[D-Leu1]MC-LR and MC-LR: A Small–Large Difference: Significantly Different Effects on Phaseolus vulgaris L. (Fabaceae) Growth and Phototropic Response after Single Contact during Imbibition with Each of These Microcystin Variants


 , and
, and 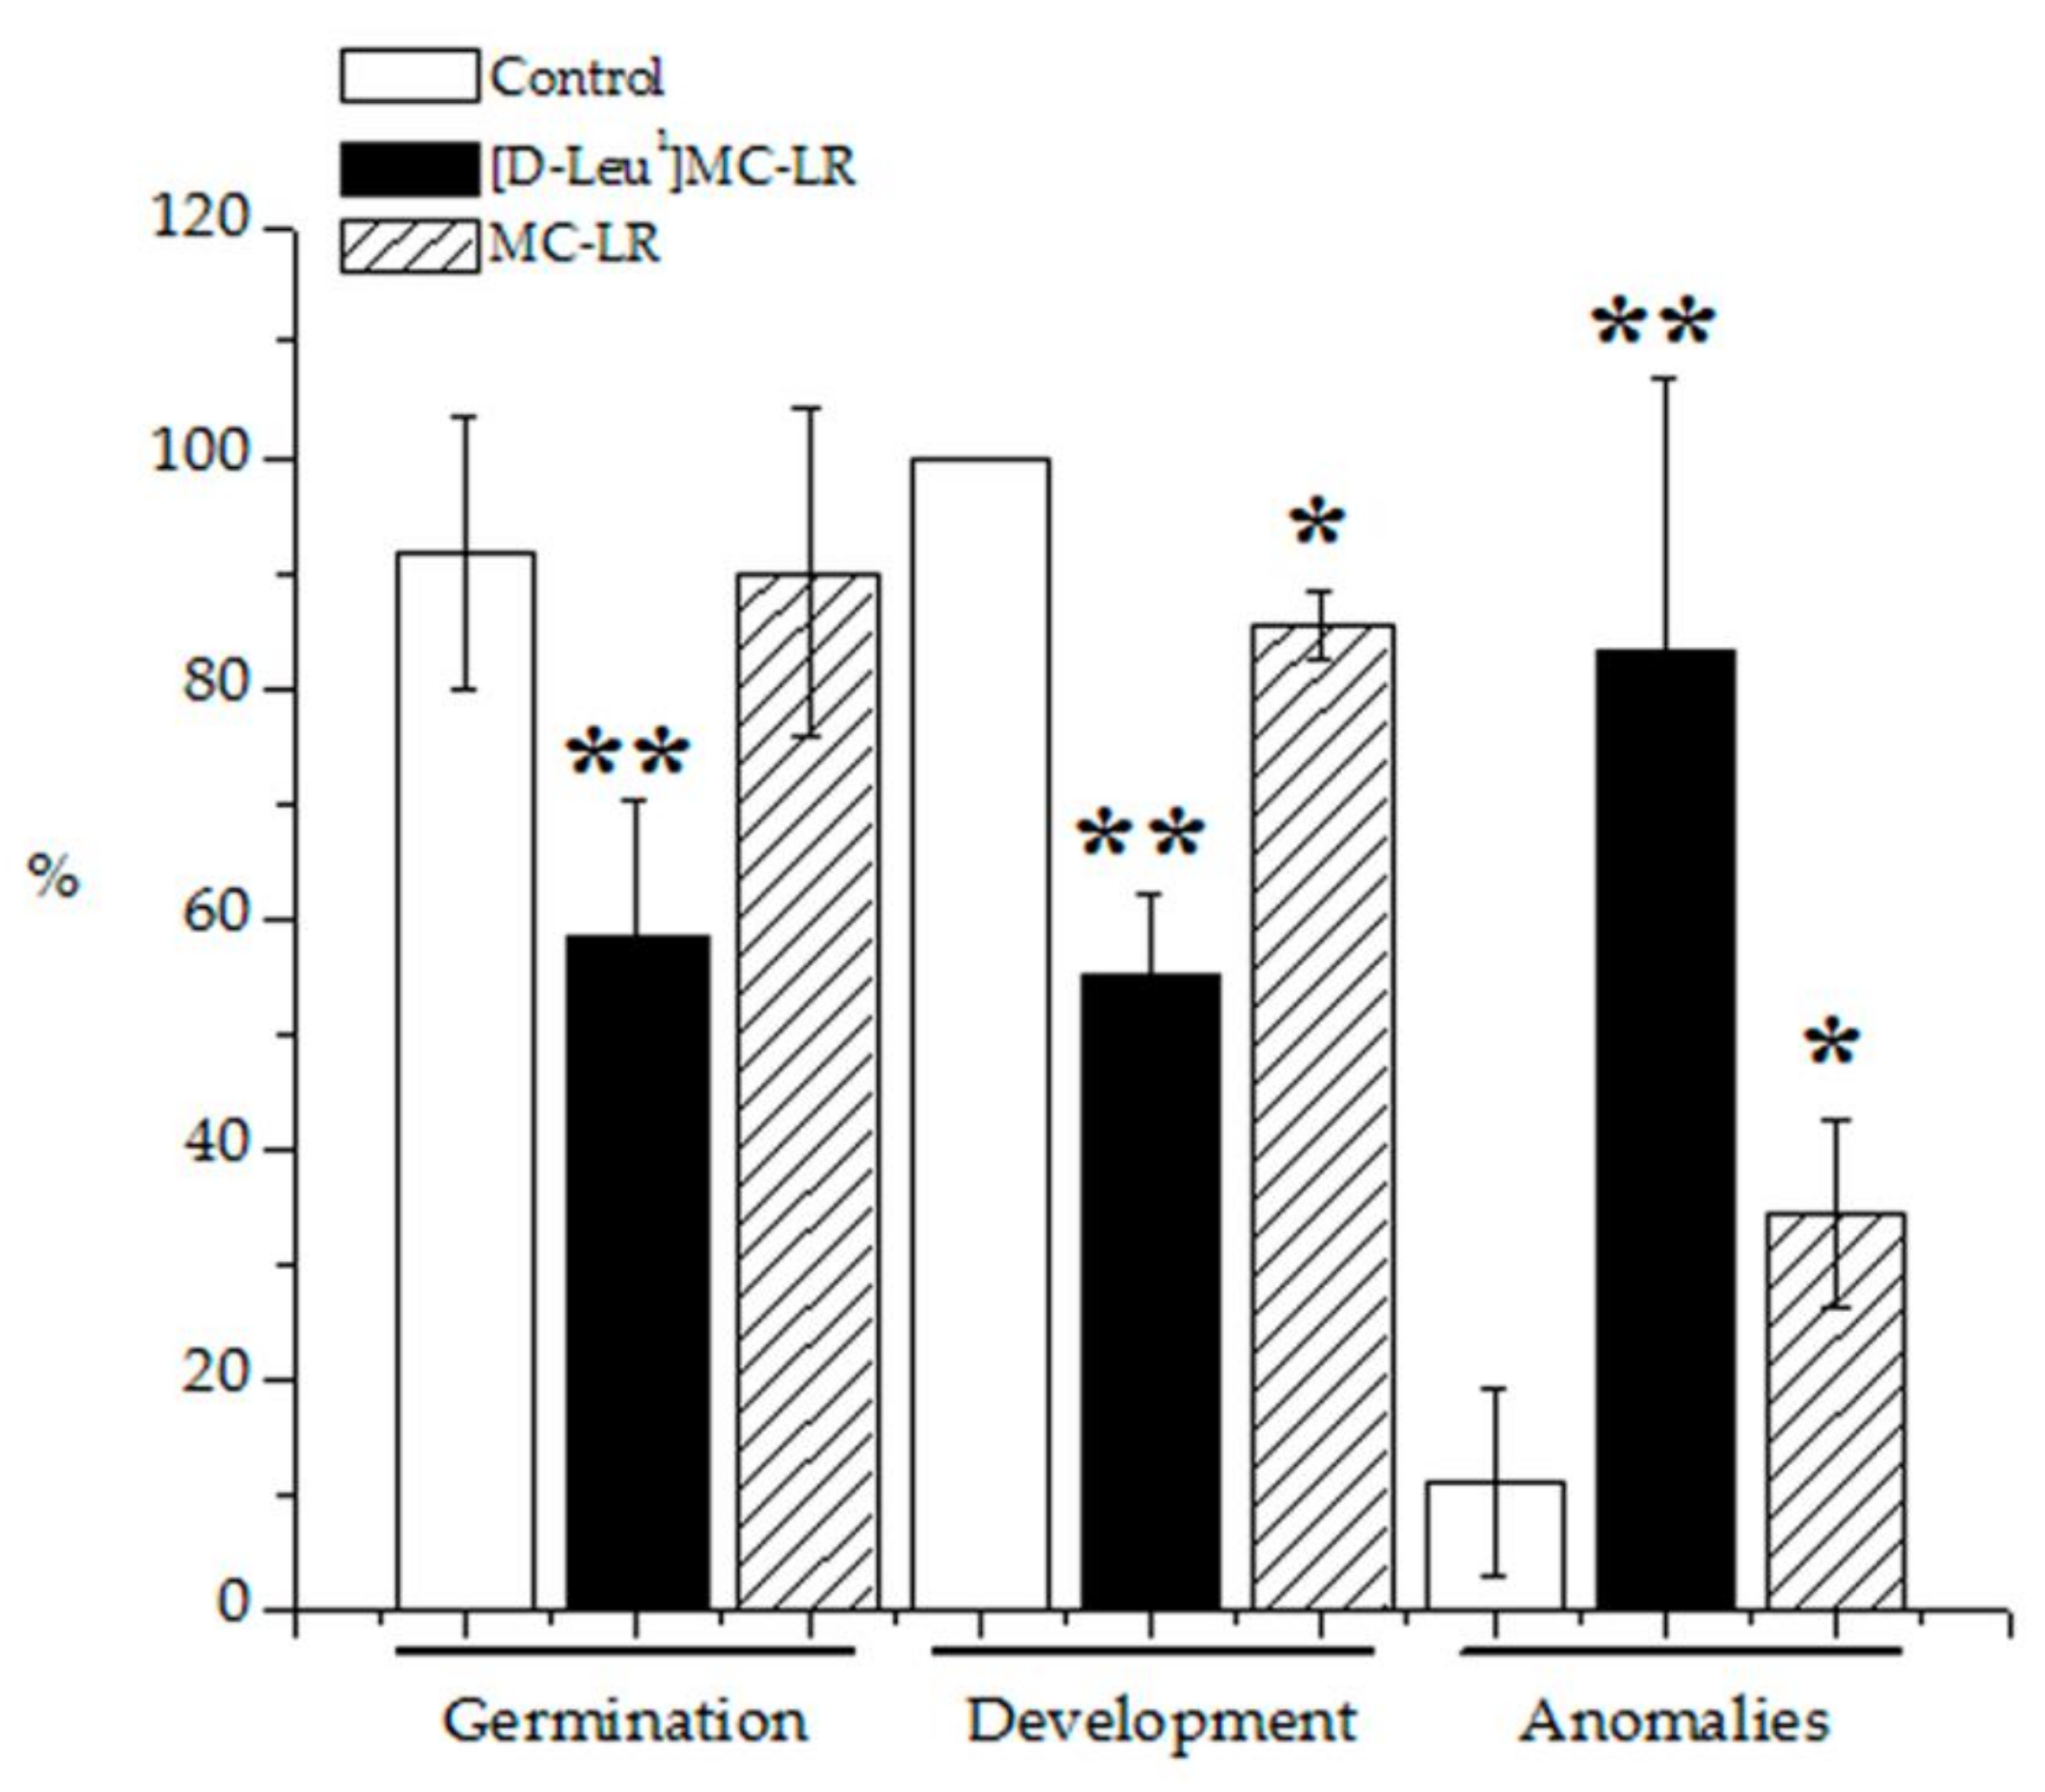
Abstract
:1. Introduction
2. Results
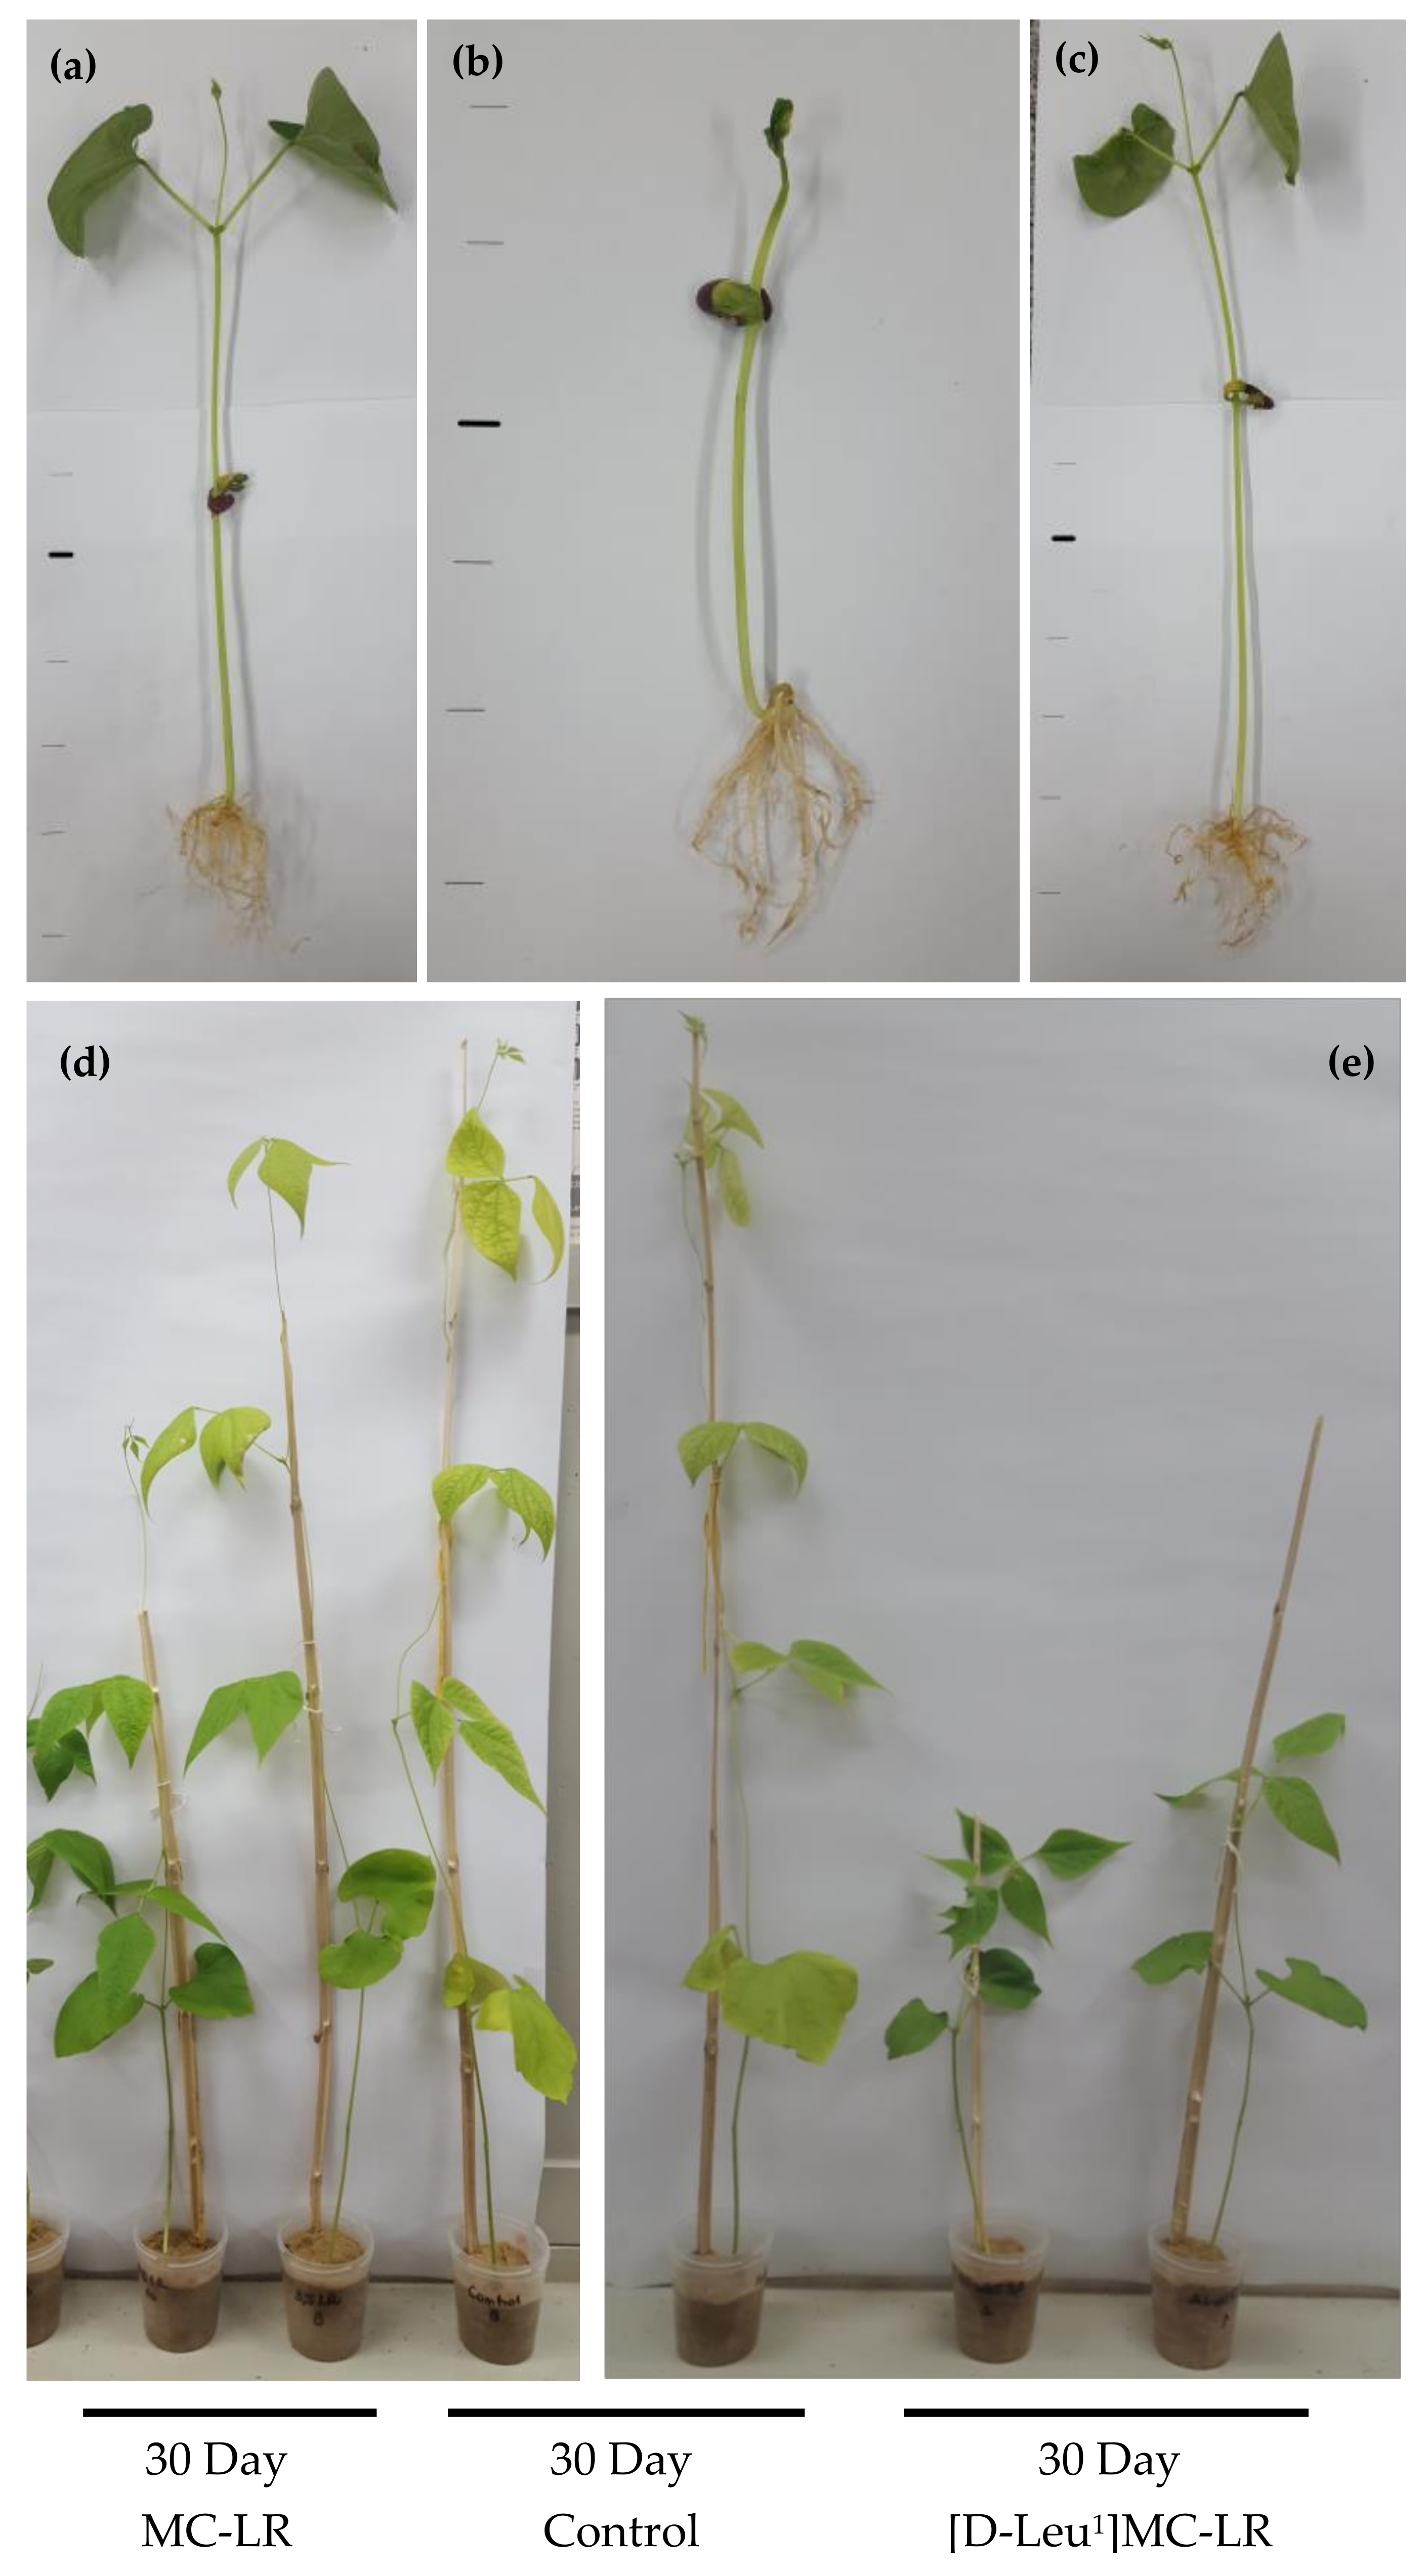
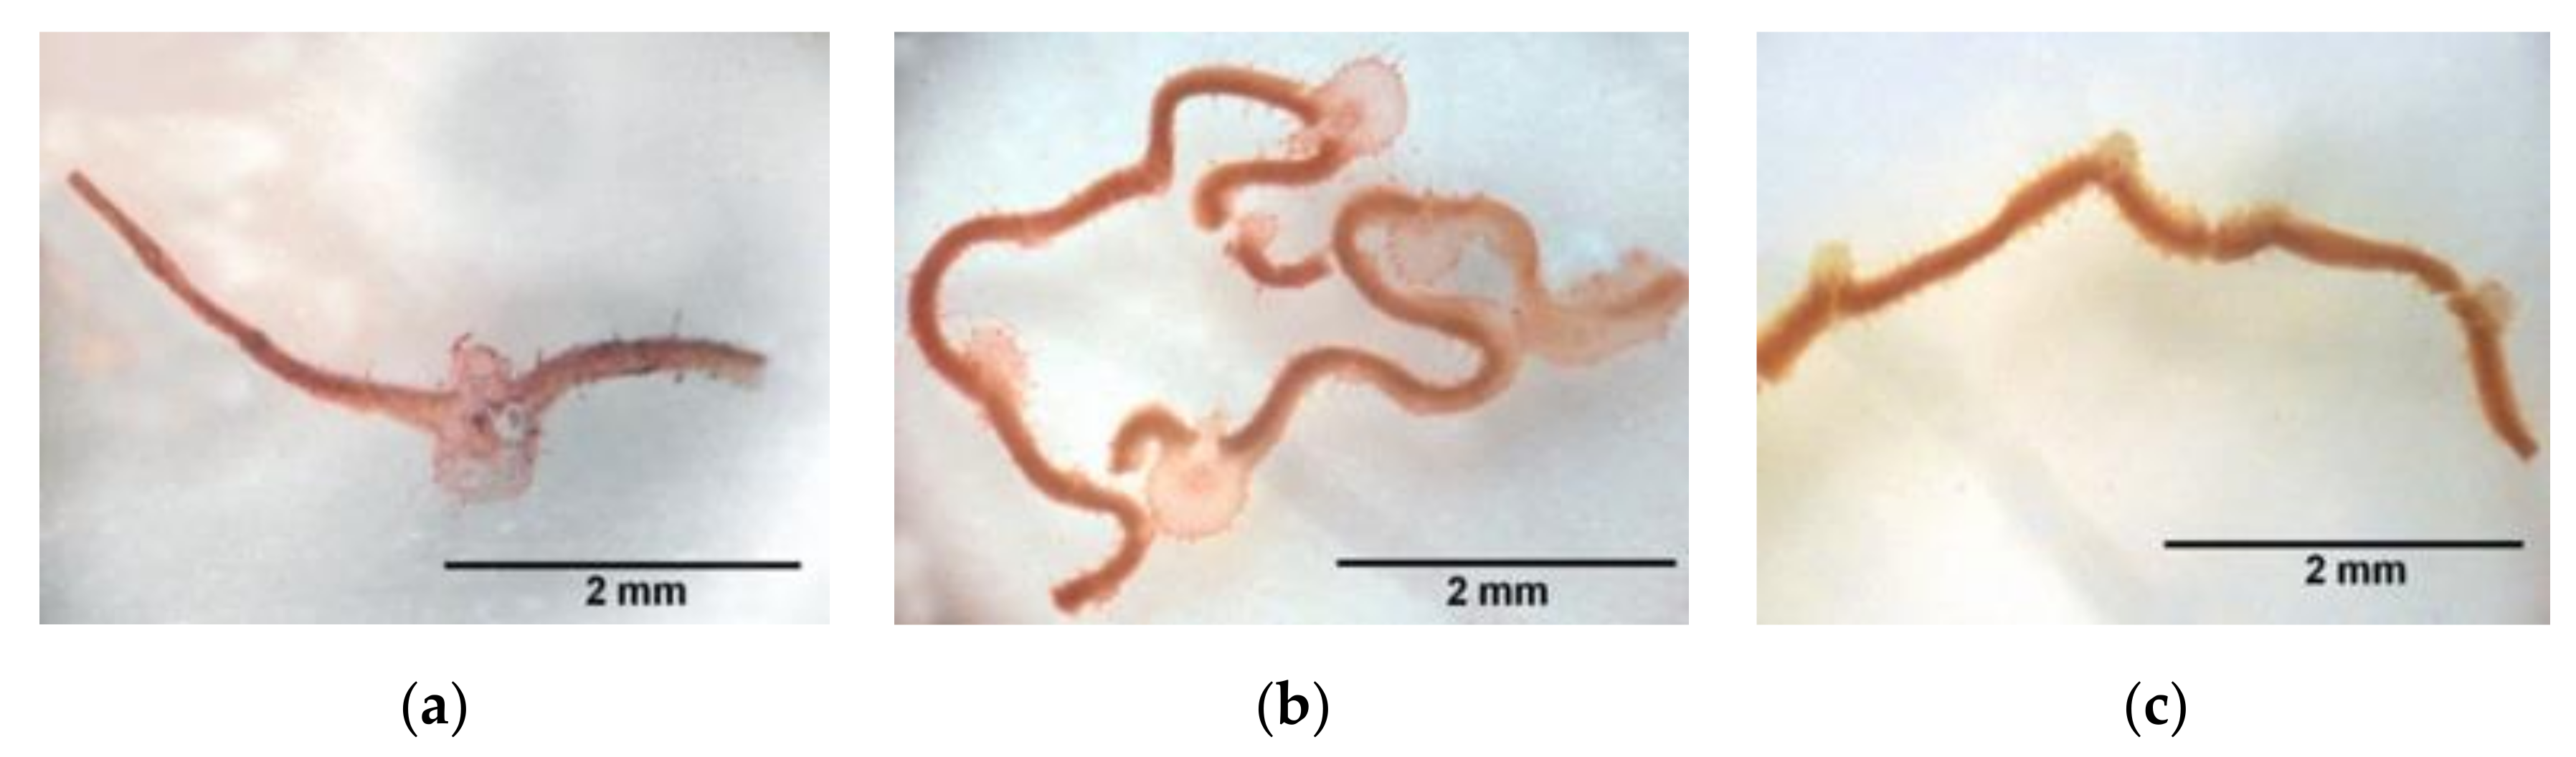
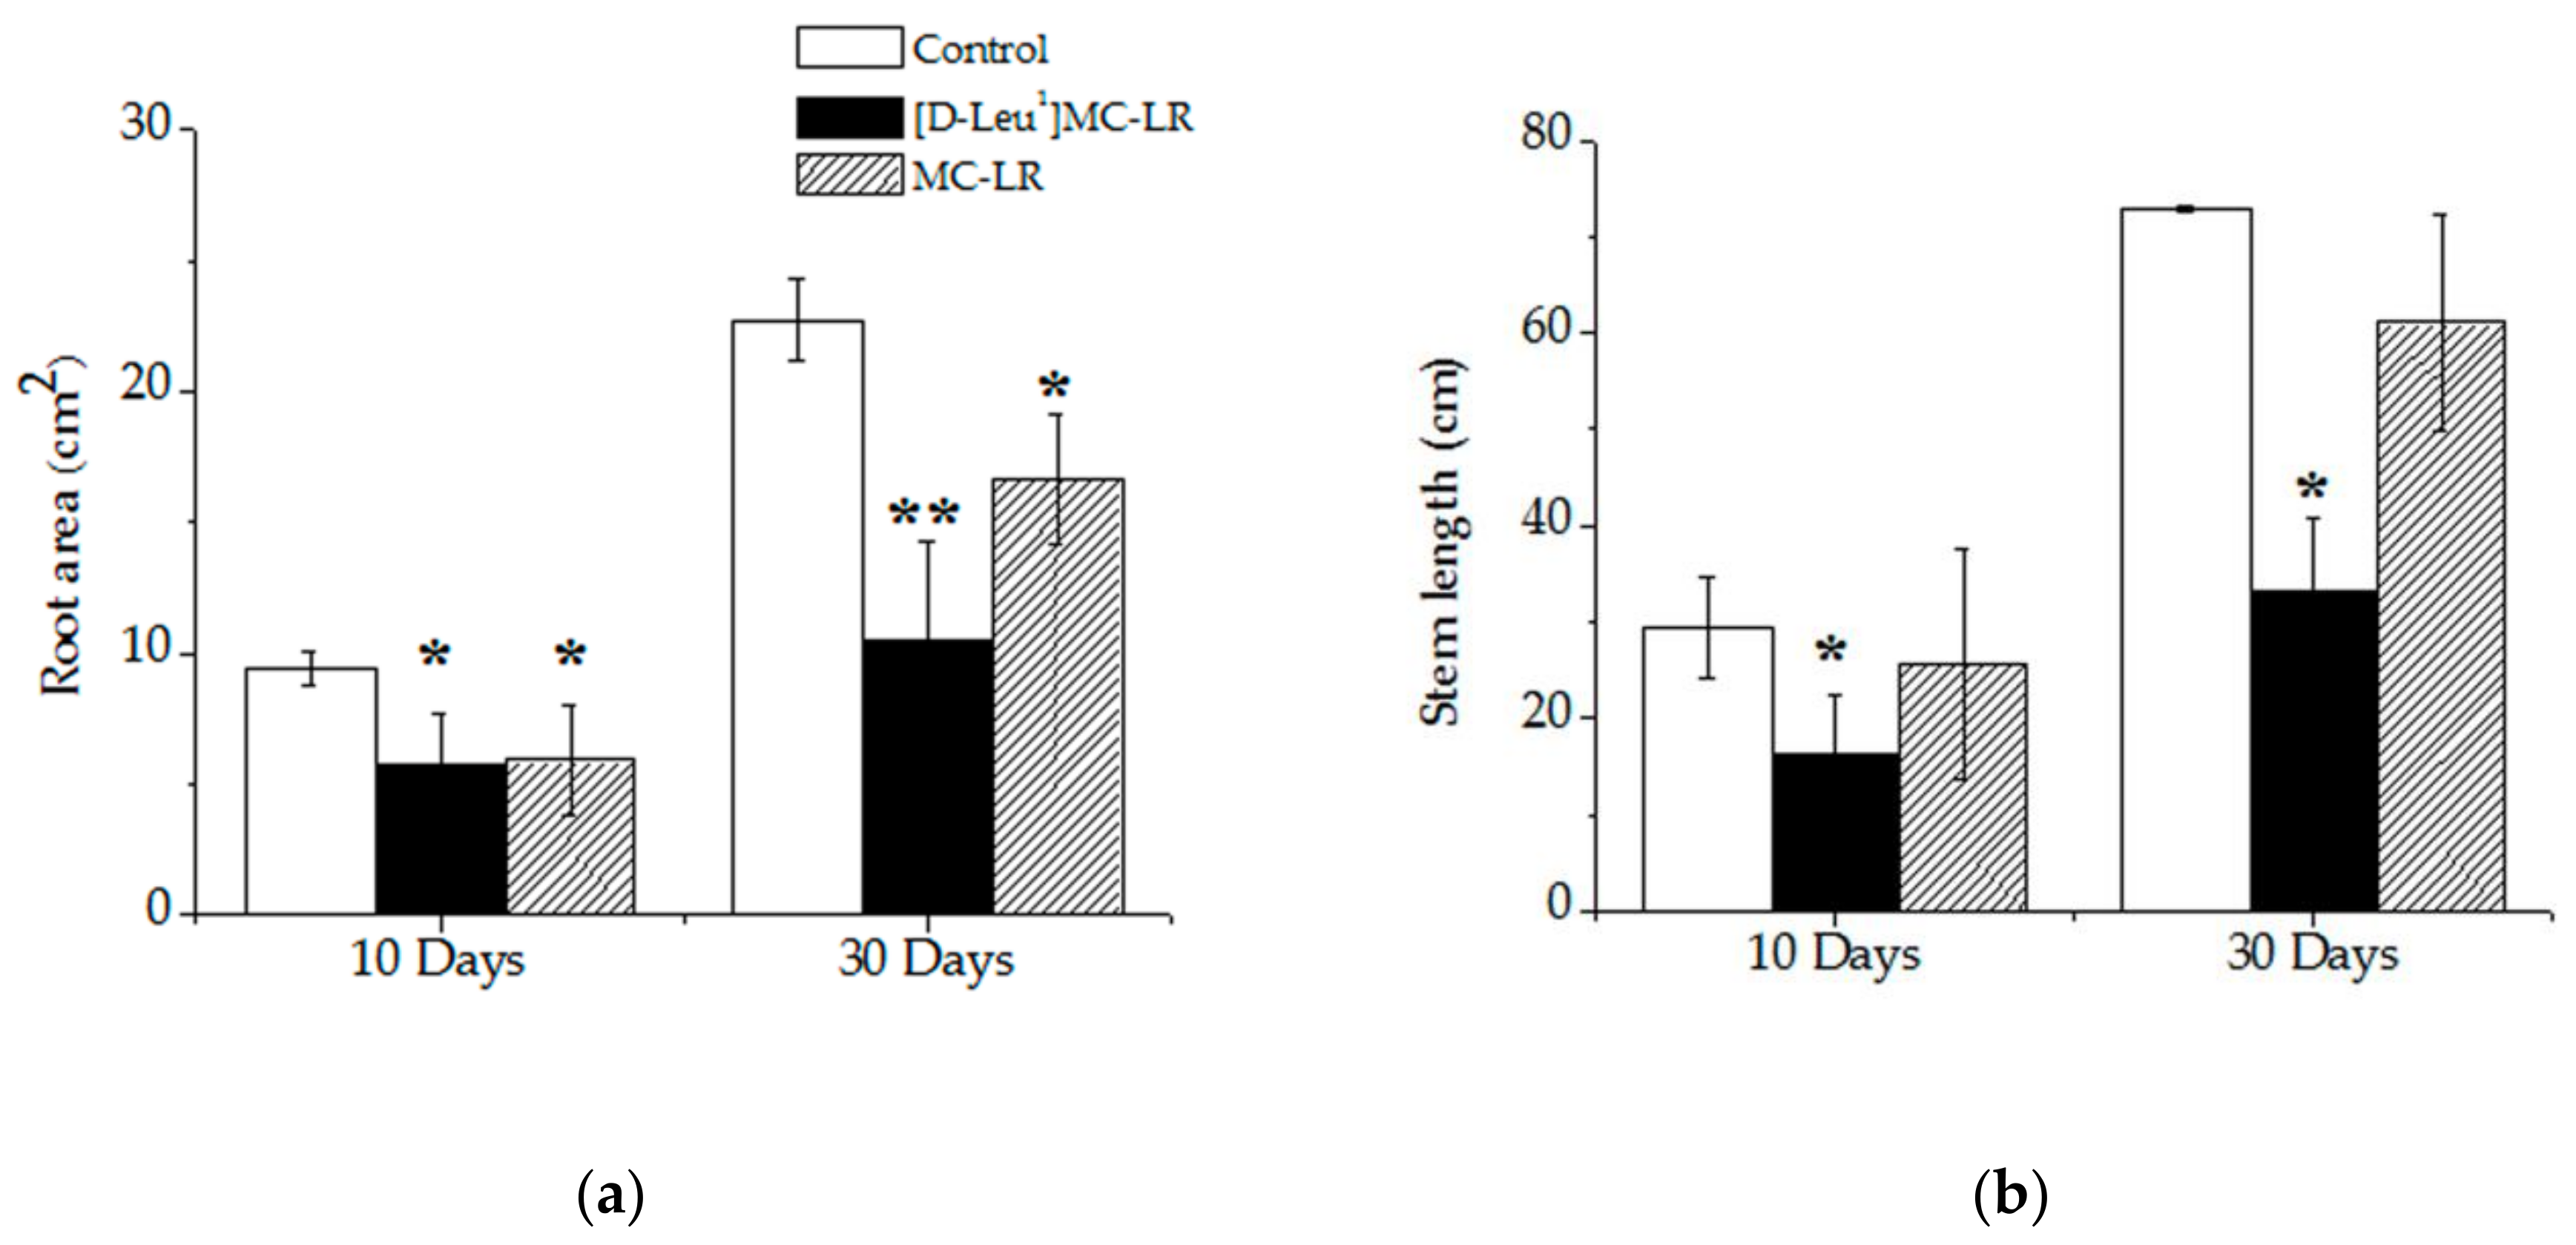
2.1. Macroscopic Alterations
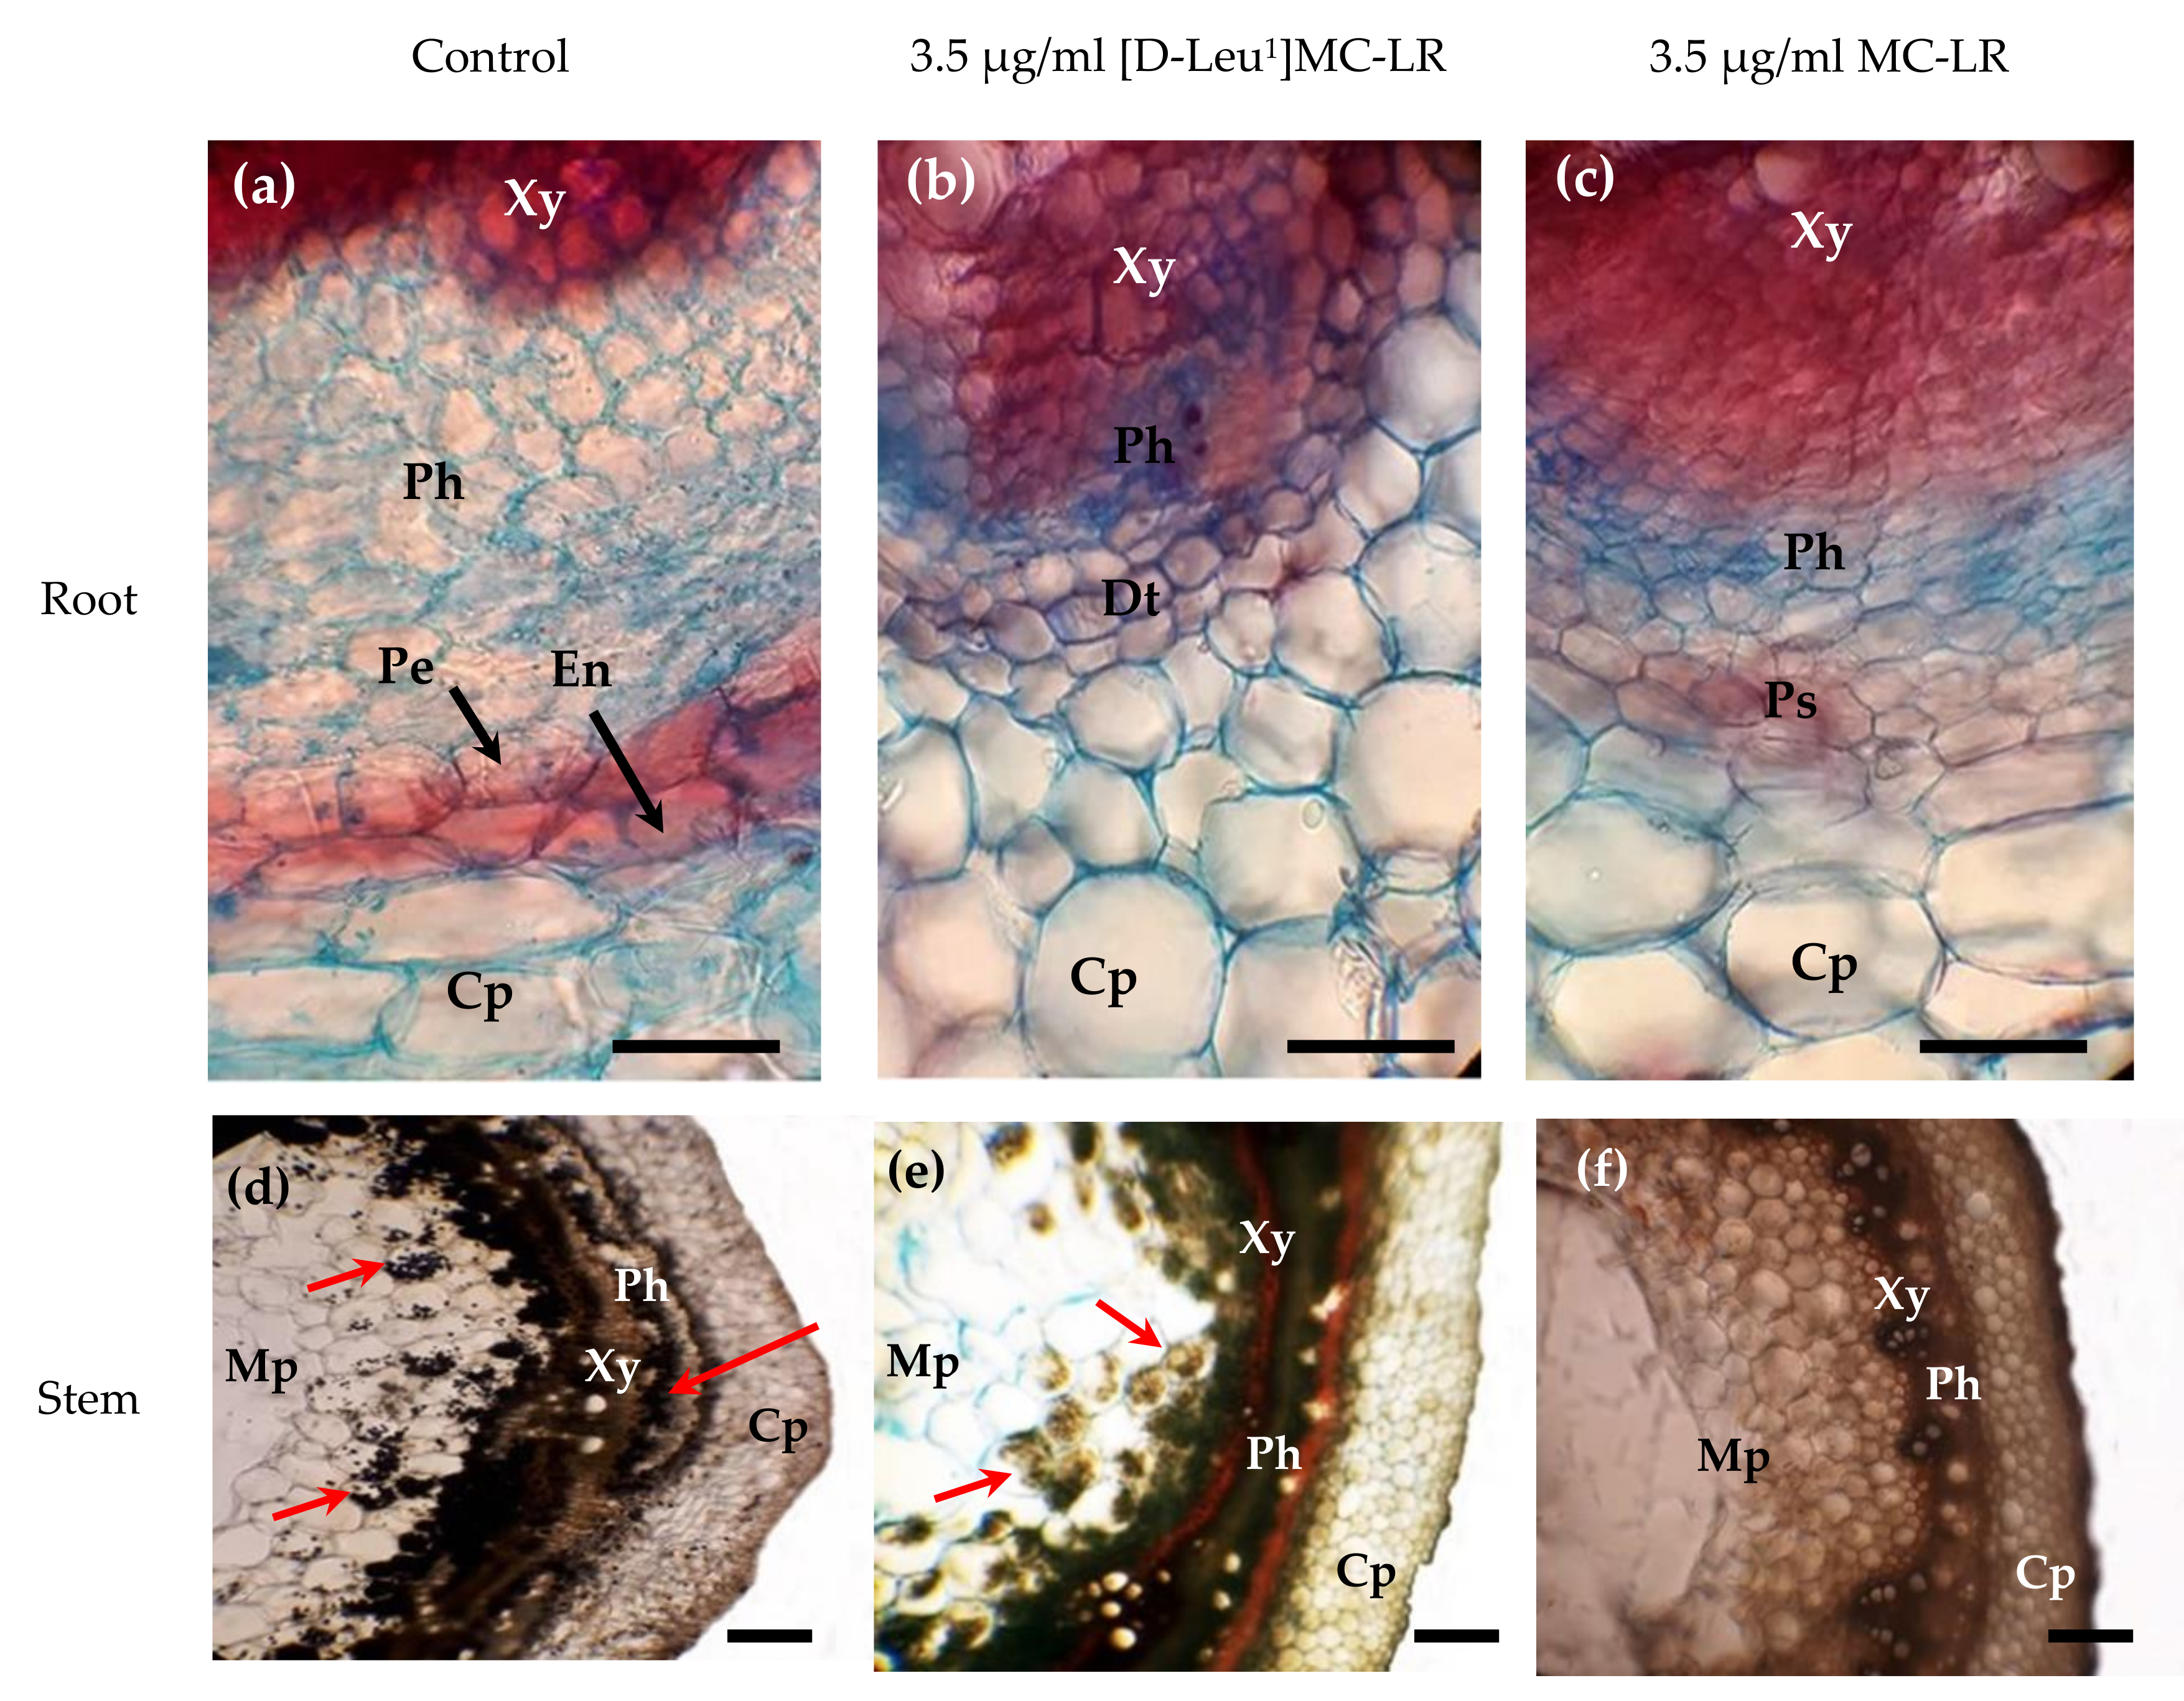
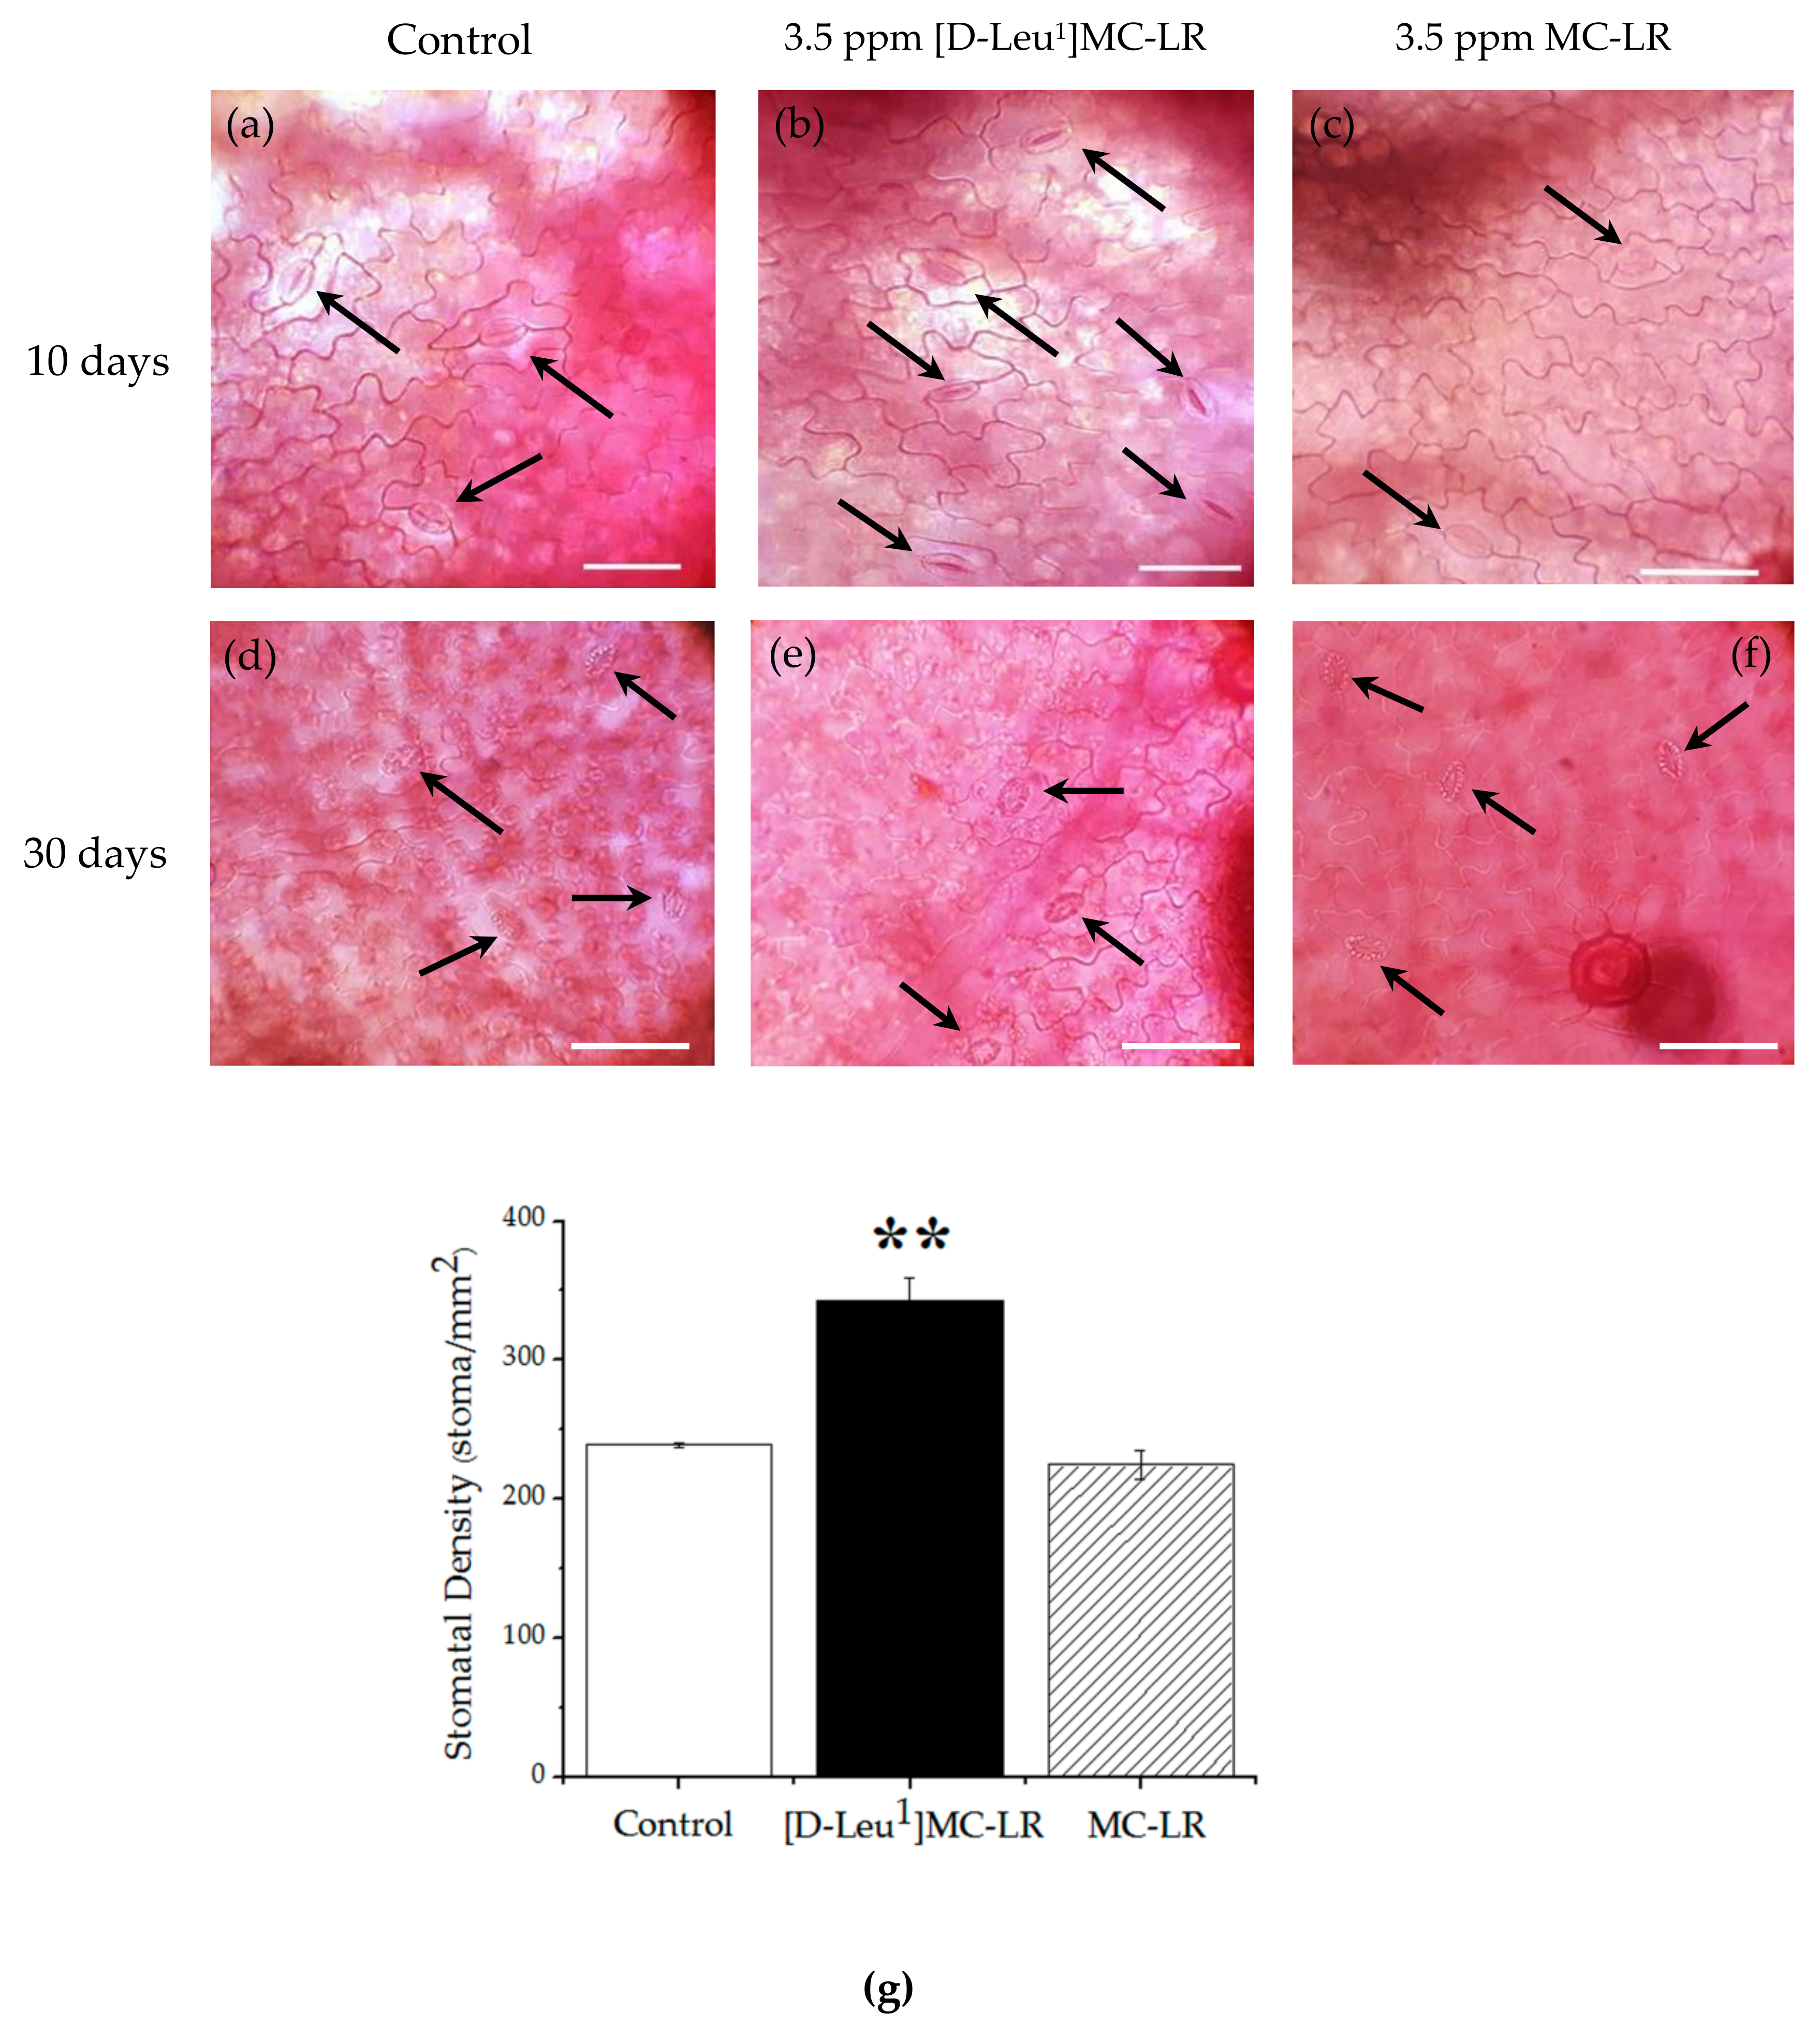
2.2. Microscopic Alterations
2.3. Biochemical Parameters
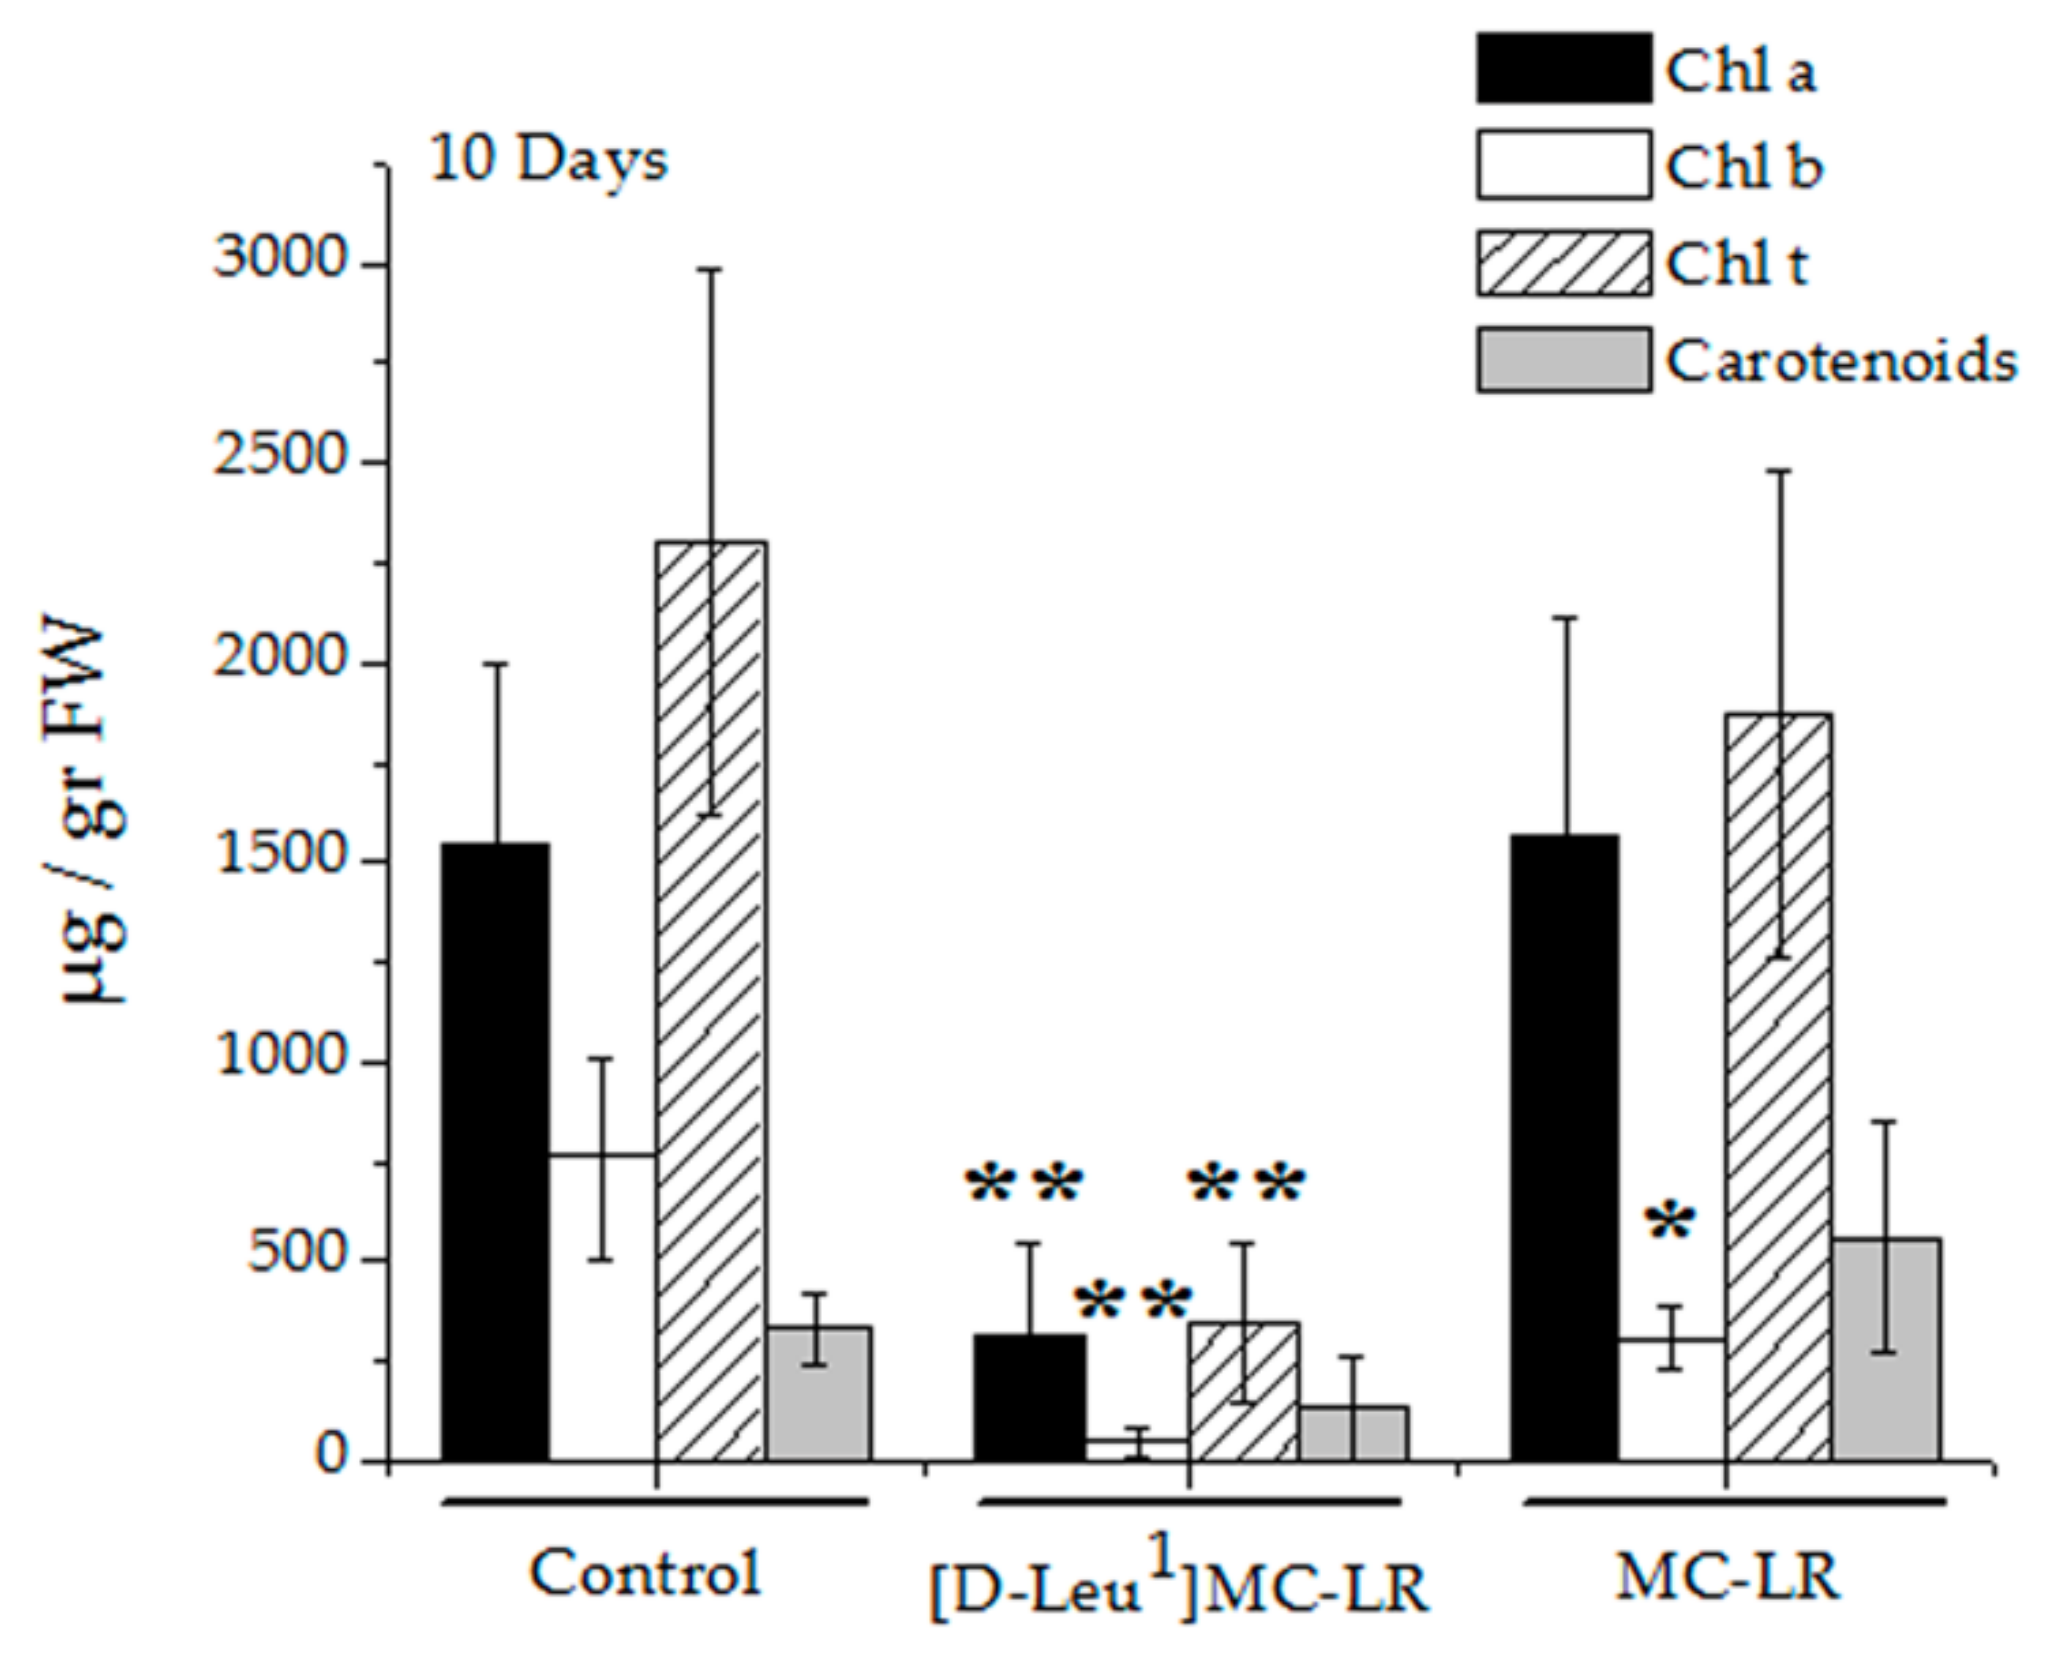
2.3.1. Pigments
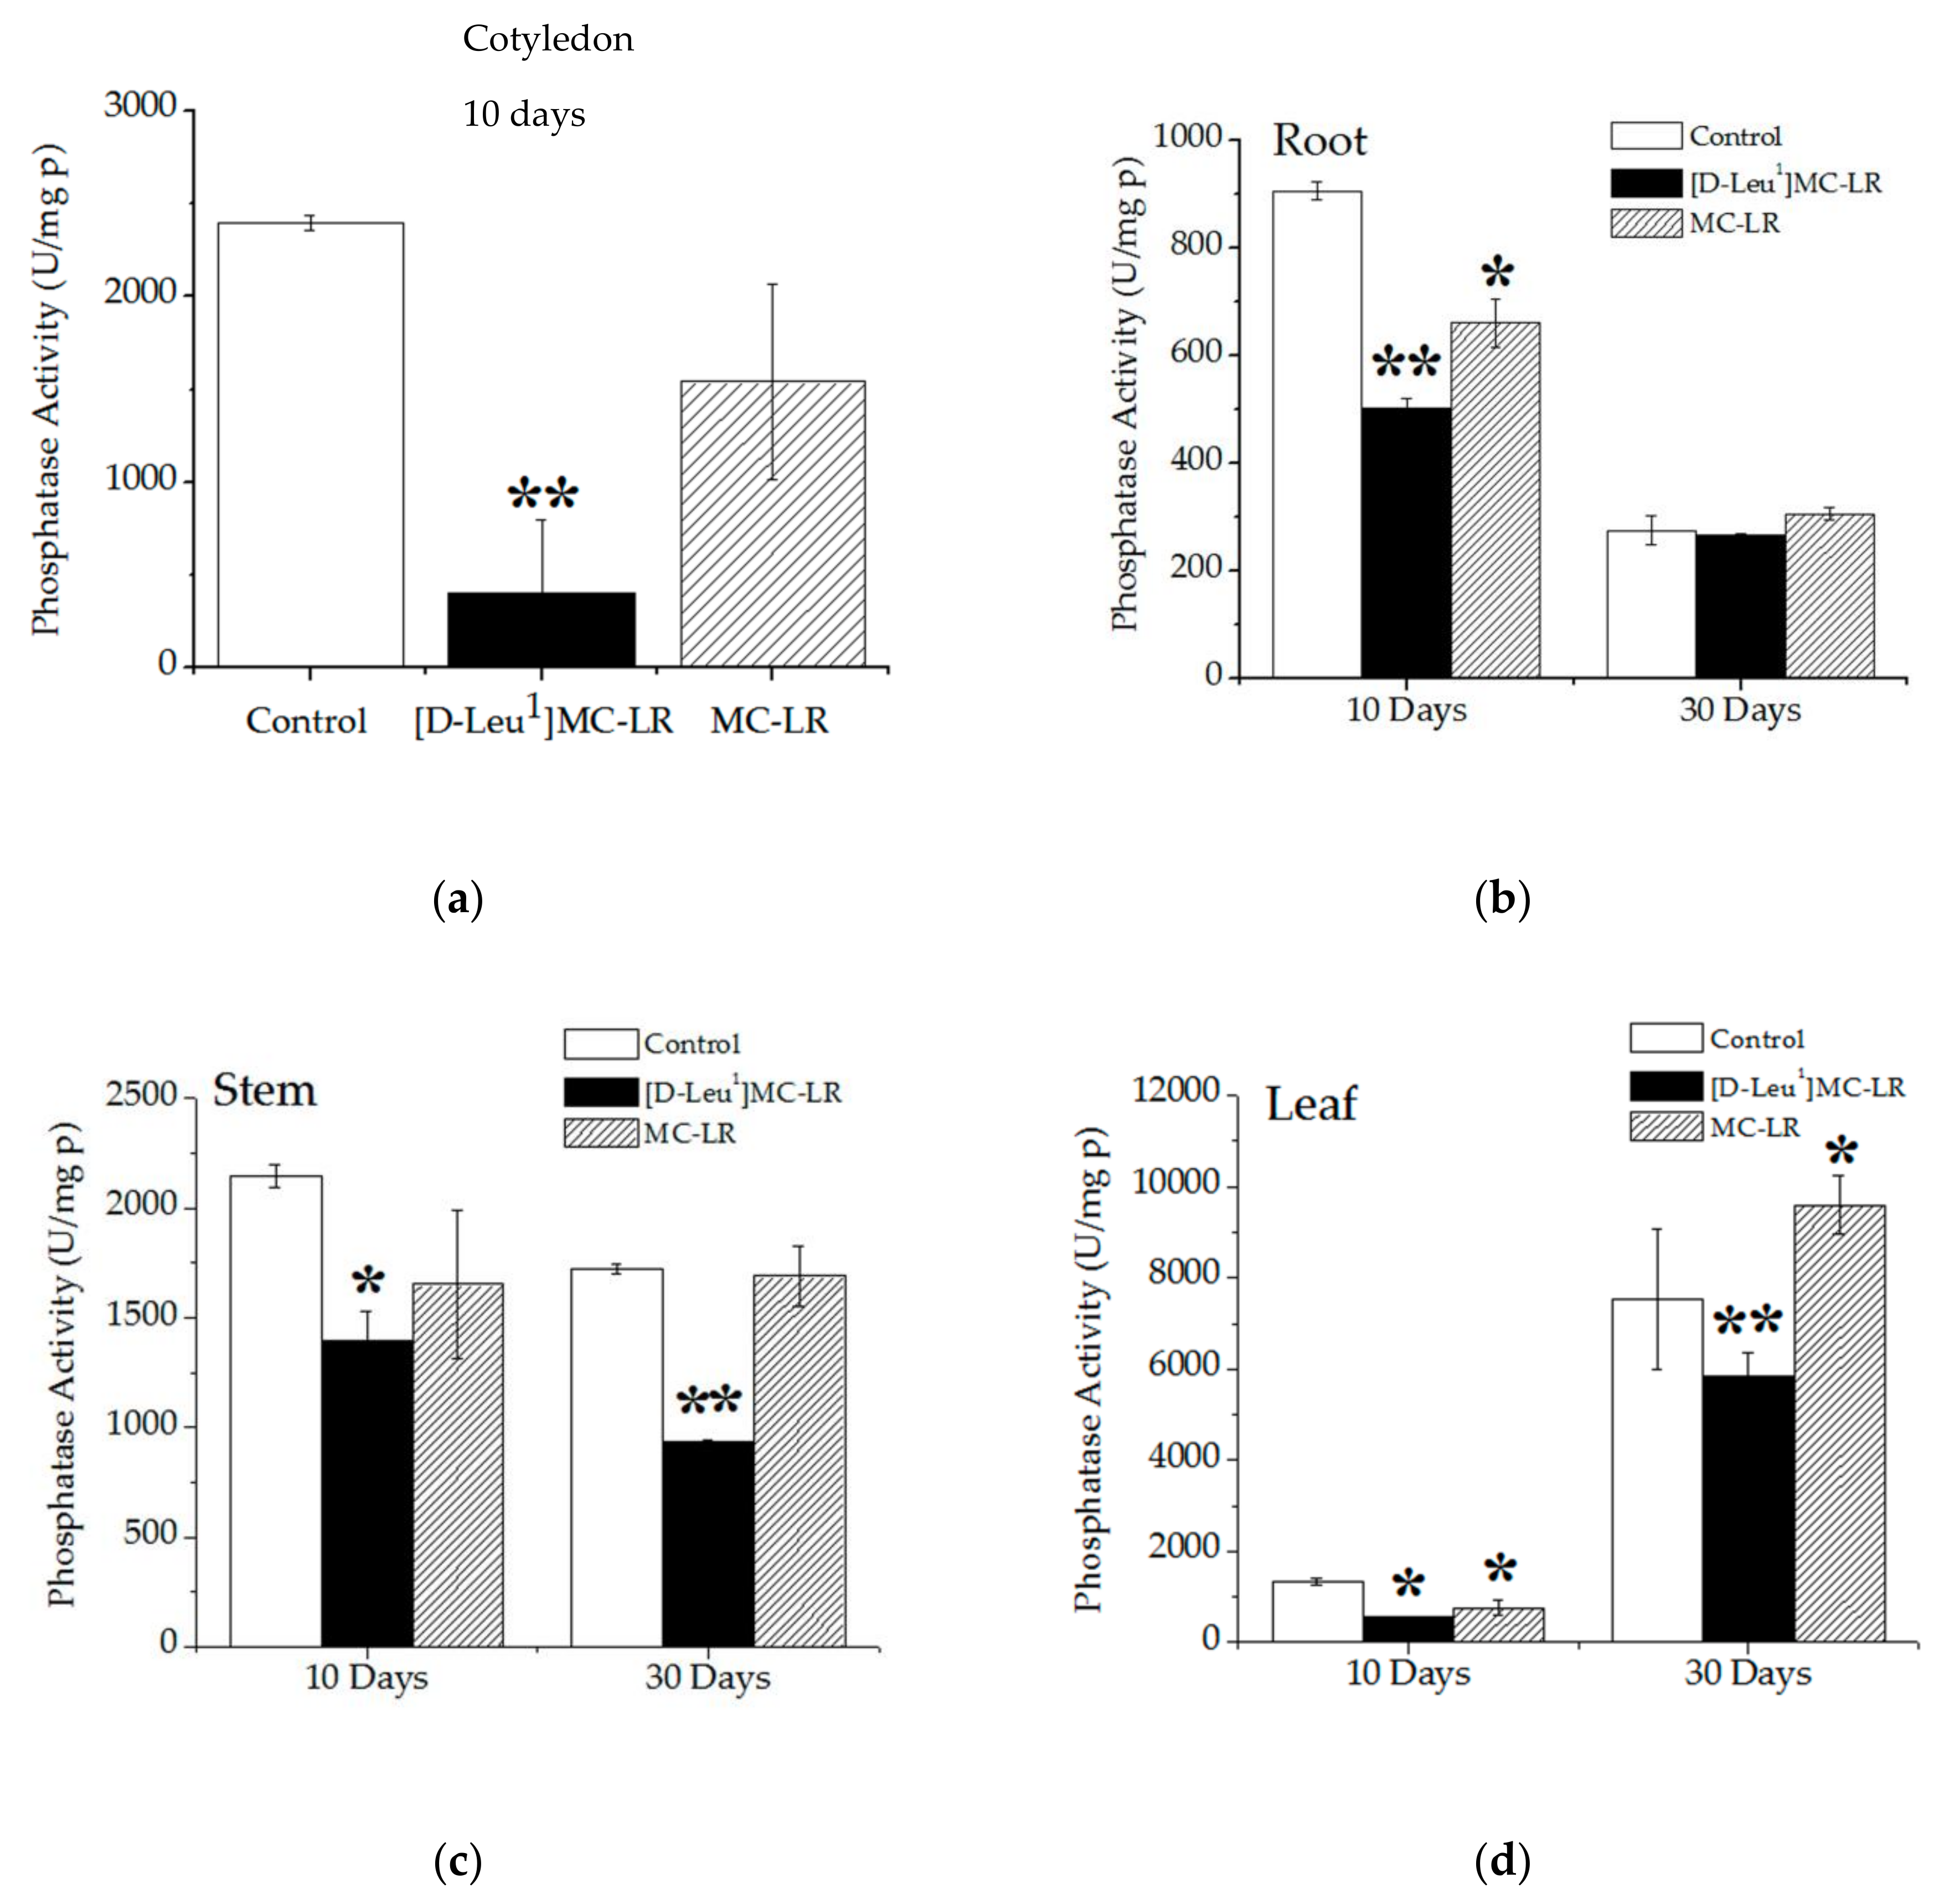
2.3.2. Phosphatase Activity
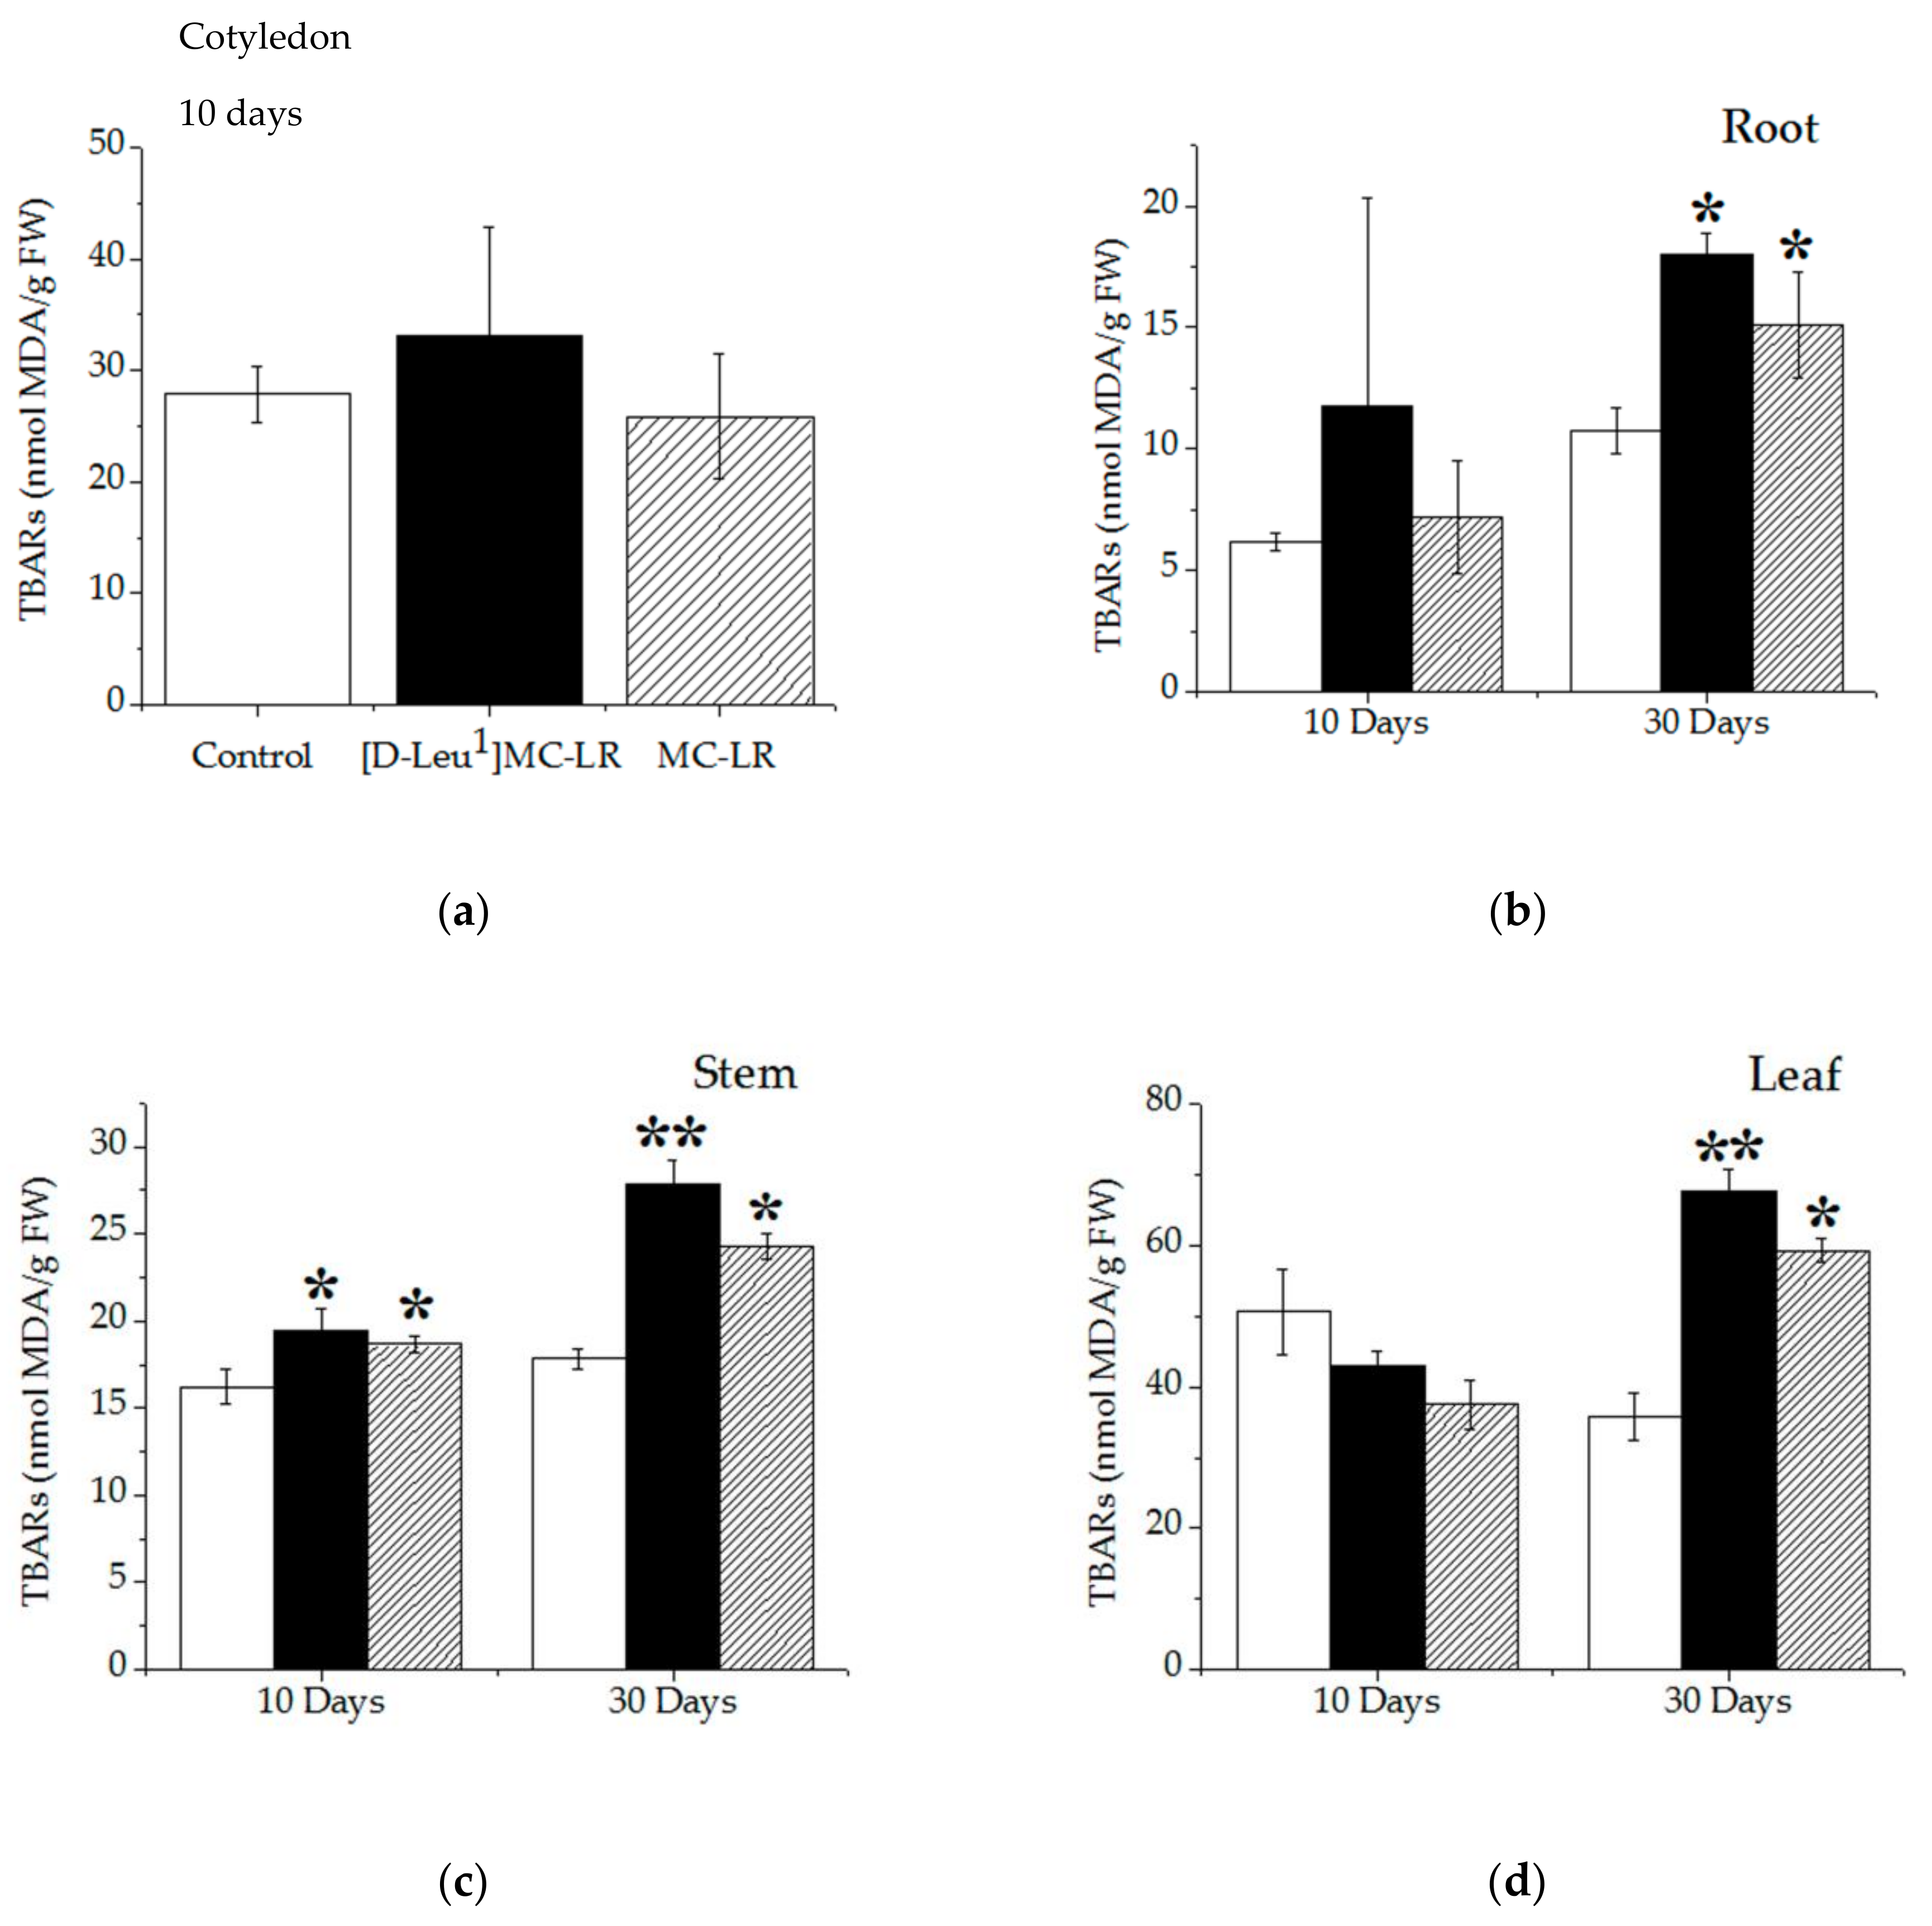
2.3.3. Lipid Peroxidation
2.4. Physiological Alteration
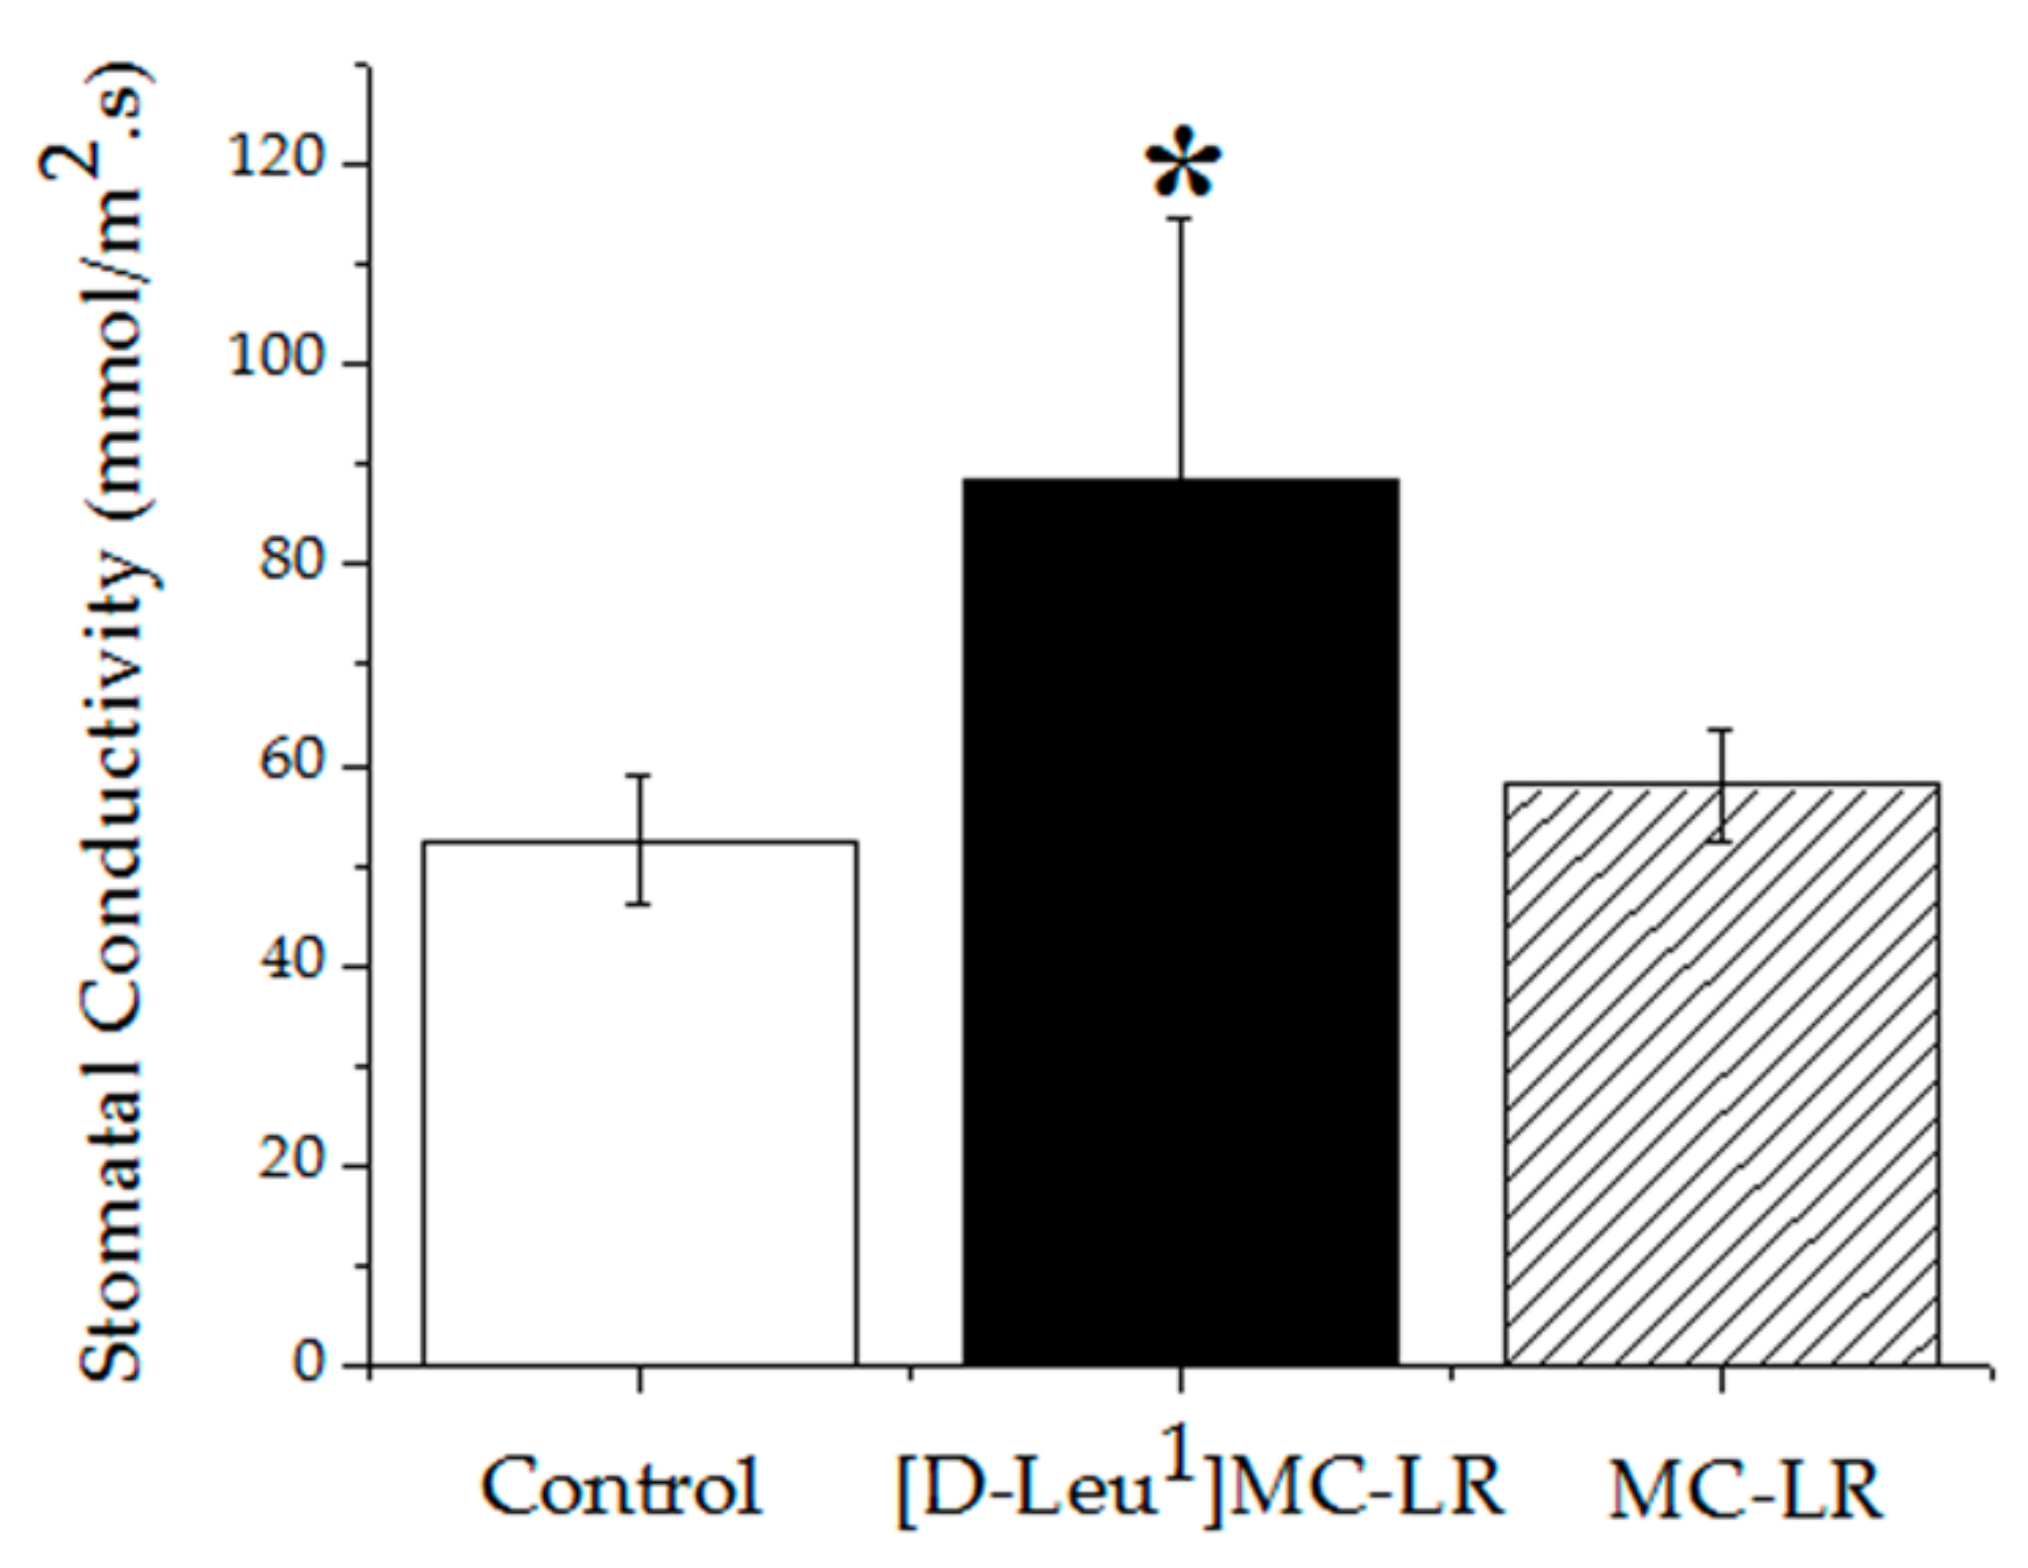
2.4.1. Stomatal Conductivity
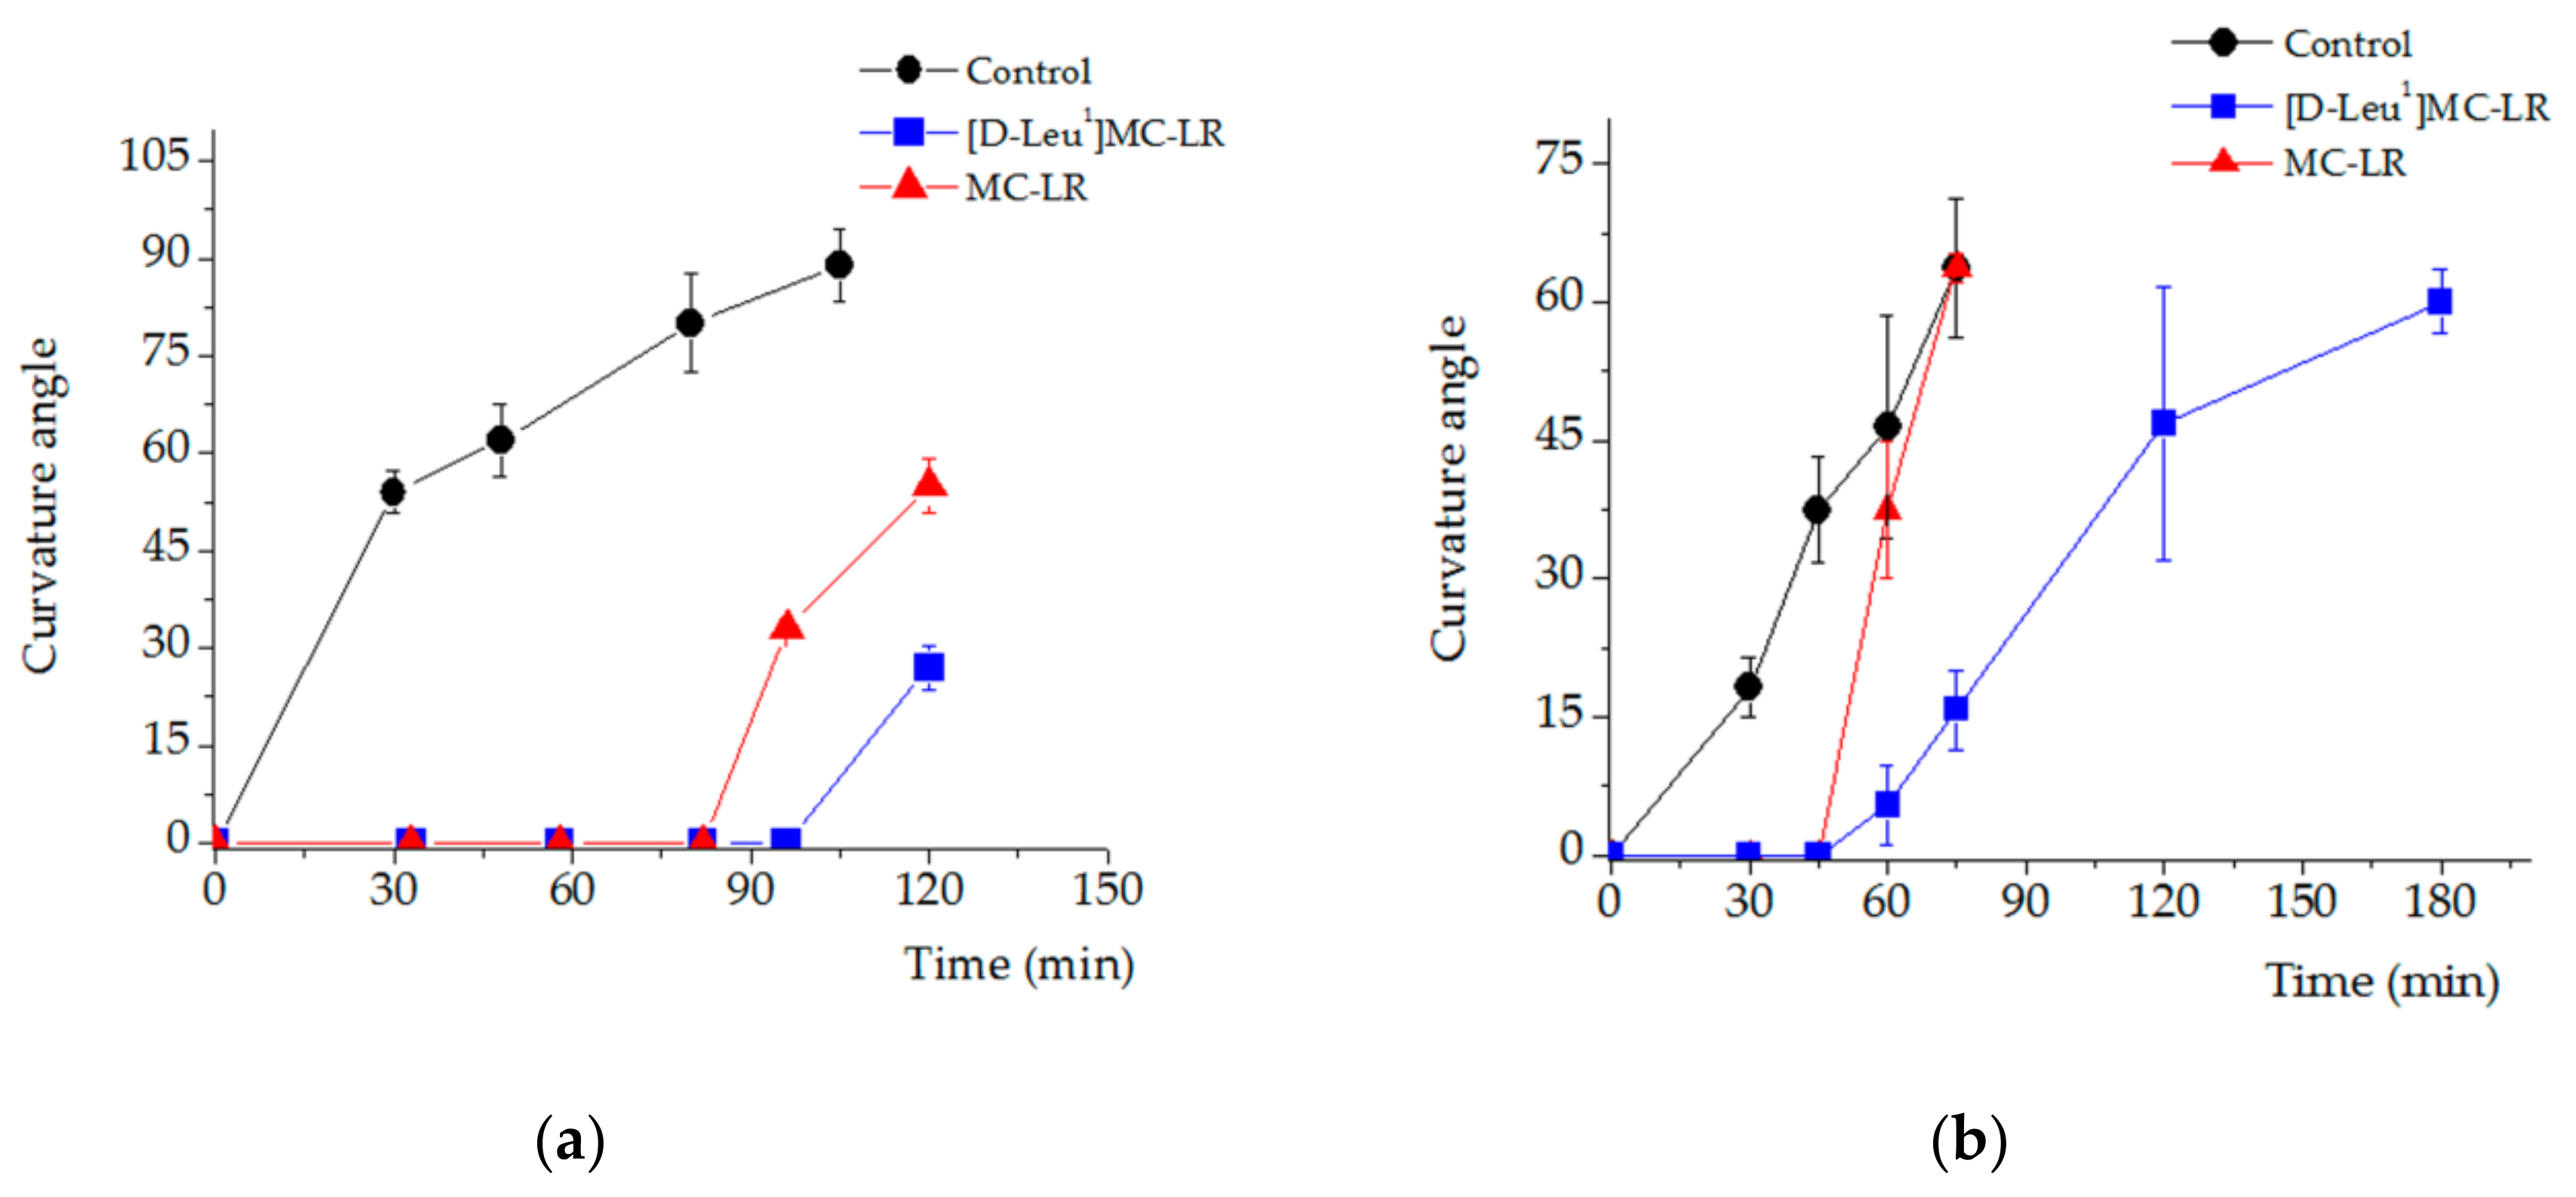
2.4.2. Phototropic Response Alterations
3. Discussion
4. Conclusions
5. Materials and Methods
5.1. [D-Leu1]MC-LR and MC-LR Purification
5.2. [D-Leu1]MC-LR and MC-LR Acute Exposure in Phaseolus vulgaris
5.3. Macroscopic Determinations
5.3.1. Germination, Development and Anomalies Percentages
5.3.2. Root Area and Stem Length
5.4. Histological Analysis
5.5. Biochemical Parameters
5.5.1. Homegenates and Leaf Samples
5.5.2. Pigment Determination
5.5.3. Lipid Peroxidation
5.5.4. Protein Phosphatase Activity Assay
5.6. Physiological Determination
5.6.1. Stomatal Conductivity
5.6.2. Phototropic Response
5.7. Statistical Analysis
Supplementary Materials
Author Contributions
Funding
Acknowledgments
Conflicts of Interest
References
- Carmichael, W.W. Fresh water cyanobacteria (blue-green algae) toxins. In Natural Toxins: Characterization, Pharmacology and Therapeutics; Ownby, C.A., Odell, G.V., Eds.; Pergamon Press: Oxford, UK, 1989; pp. 3–16. [Google Scholar]
- Codd, G.A.; Bell, S.G.; Brooks, W.P. Cyanobacterial toxins in water. Water Sci. Technol. 1989, 21, 1–13. [Google Scholar] [CrossRef]
- Pearl, H.; Huisman, J. Blooms like it hot. Science 2008, 320, 57–58. [Google Scholar] [CrossRef] [Green Version]
- Chorus, I.; Bartram, J. Toxic Cyanobacteria in Water: A Guide to Their Public Health Consequences, Monitoring and Management, 1st ed.; World Health Organization: Geneva, Switzerland, 1999; pp. 55–161. ISBN 0-419-23930-8. [Google Scholar]
- Carmichael, W.W. Cyanobacteria secondary metabolites-the cyanotoxins. J. Appl. Bacteriol. 1992, 72, 445–459. [Google Scholar] [CrossRef] [PubMed]
- Sivonen, K.; Jones, G. Cianobacterial Toxins. In Toxic Cyanobacteria in Water: A Guide to Their Public Health Consequences, Monitoring and Management, 1st ed.; Chorus, I., Bartram, J., Eds.; World Health Organization: Geneva, Switzerland, 1999; pp. 55–124. [Google Scholar]
- Matthiensen, A.; Beattie, K.A.; Yunes, J.S.; Kaya, K.; Codd, G.A. [D-Leu1]-Microcystin-LR, from the cyanobacterium Microcystis RST 9501 and from a Microcystis bloom in the Patos Lagoon estuary, Brazil. Phytochemistry 2000, 55, 383–387. [Google Scholar] [CrossRef]
- De León, L.; Yunes, J. First report of a Microcystis aeruginosa toxic bloom in La Plata River. Environ. Toxicol. 2001, 16, 110–112. [Google Scholar] [CrossRef]
- Park, H.; Namikoshi, M.; Brittain, S.M.; Carmichael, W.W.; Murphy, T. [D-Leu1] microcystin-LR, a new microcystin isolated from waterbloom in a Canadian prairie lake. Toxicon 2001, 39, 855–862. [Google Scholar] [CrossRef]
- Andrinolo, D.; Pereira, P.; Giannuzzi, L.; Aura, C.; Massera, S.; Caneo, M.; Caixach, J.; Braco, M.; Echenique, R. Ocurrence of Microcystis Aeruginosa and Microcystins in Rio de La Plata River (Argentina). Acta Toxicol. Argent. 2007, 15, 8–14. [Google Scholar]
- Echenique, R.; Rodríguez, J.; Caneo, M.; Gianuzzi, L.; Barco, M.; Rivera, J.; Caixach, J.; Andrinolo, D. Microcystins in the drinking water supply in the cities of Ensenada and La Plata (Argentina). Anais XICBFic Livros Mus. Nac. Bras. 2008, 1, 125–129. [Google Scholar]
- Rosso, L.; Sedan, D.; Kolman, M.; Caixach, J.; Flores, C.; Oteiza, J.M.; Salerno, G.; Echenique, R.; Giannuzzi, L.; Andrinolo, D. Microcystis aeruginos strain [D-Leu1] Mcyst-LR producer, from Buenos Aires province, Argentina. J. Coast. Life Med. 2014, 2, 287–296. [Google Scholar]
- Wood, S.A.; Holland, P.T.; Stirling, D.J.; Briggs, L.R.; Sprosen, J.; Ruck, J.G.; Wear, R.G. Survey of cyanotoxins in New Zealand water bodies between 2001 and 2004. N. Z. J. Mar. Freshw. Res. 2006, 40, 585–597. [Google Scholar] [CrossRef]
- Oberholster, P.J.; Myburgh, J.G.; Govender, D.; Bengis, R.; Botha, A.-M. Identification of toxigenic Microcystis strains after incidents of wild animal mortalities in the Kruger National Park, South Africa. Ecotoxicol. Environ. Saf. 2009, 72, 1177–1182. [Google Scholar] [CrossRef] [PubMed] [Green Version]
- Monitoring Program for Beach and Coastal Waters of the Department of Montevideo, April 2016–March 2017. Available online: https://montevideo.gub.uy/sites/default/files/biblioteca/informeanualcalidaddeaguadelacosta2016-2017.pdf (accessed on 2 July 2020).
- Tisdale, J. Epidemic of intestinal disorders in Charleston (West Virginia) occurring simultaneously with unprecedented water supply conditions. Am. J. Public Health 1931, 21, 198–200. [Google Scholar]
- Teixera, M.; Costa, M.; Carvalho, V.; Pereira, M.; Hage, E. Gastroenteritis epidemic in the area of the Itaparica Dam, Bahia, Brazil. Bull. Pan Am. Health Org. 1993, 27, 244–253. [Google Scholar]
- Jochimsen, E.M.; Carmichael, W.W.; An, J.S.; Cardo, D.M.; Cookson, S.T.; Holmes, C.E.M.; Antunes, M.B.; de Melo Filho, D.A.; Lyra, T.M.; Barreto, V.S.; et al. Liver failure and death after exposure to microcystins at a hemodialysis center in Brazil. N. Engl. J. Med. 1998, 338, 873–878. [Google Scholar] [CrossRef] [PubMed]
- Carmichael, W.W.; Azevedo, S.M.F.O.; An, J.S.; Molica, R.J.R.; Jochimsen, E.M.; Lau, S.; Rinehart, K.L.; Shaw, G.R.; Eaglesham, G.K. Human Fatalities from Cyanobacteria: Chemical and Biological Evidence for Cyanotoxins. Environ. Health Perspect. 2001, 109, 663–668. [Google Scholar] [CrossRef]
- Giannuzzi, L.; Sedan, D.; Echenique, R.; Andrinolo, D. An Acute Case of Intoxication with Cyanobacteria and Cyanotoxins in Recreational Water in Salto Grande Dam, Argentina. Mar. Drugs 2011, 9, 2164–2175. [Google Scholar] [CrossRef] [Green Version]
- Vidal, F.; Sedan, D.; D’Agostino, D.; Cavalieri, M.L.; Mullen, E.; Parot Varela, M.M.; Flores, C.; Caixach, J.; Andrinolo, D. Recreational Exposure during Algal Bloom in Carrasco Beach, Uruguay: A Liver Failure Case Report. Toxins 2017, 9, 267–279. [Google Scholar] [CrossRef] [Green Version]
- Craig, M.; Holmes, C.F.B. Freshwater Hepatotoxins: Microcystin and Nodularin, Mechanisms of Toxicity and Effects on Health. In Seafood and Freshwater Toxins; Botana, L.M., Ed.; Marcel Dekker: New York, NY, USA, 2000; pp. 643–671. [Google Scholar]
- Gehringer, M.M. Microcystin-LR and okadaic acid-induced cellular effects: A dualistic response. FEBS Lett. 2004, 57, 1–8. [Google Scholar] [CrossRef] [Green Version]
- Milutinovic, A.; Zivin, M.; Zorc-Pleskovic, R.; Sedmak, B.; Suput, D. Nephrotoxic effects of chronic administration of microcystins-LR and -YR. Toxicon 2003, 42, 281–288. [Google Scholar] [CrossRef]
- Guzman, R.E.; Solter, P.F. Characterization of sublethal MCLR exposure in mice. Vet. Pathol. 2002, 39, 17–26. [Google Scholar] [CrossRef]
- Ding, W.; Ong, C. Role of oxidative stress and mitochondrial changes in cyanobacteria-induced apoptosis and hepatotoxicity. FEMS Microbiol. Lett. 2003, 220, 1–7. [Google Scholar] [CrossRef] [Green Version]
- Chen, T.; Zhao, X.; Liu, Y.; Shi, Q.; Hua, Z.; Shen, P. Analysis of immunomodulating nitric oxide, iNOS and cytokines mRNA in mouse macrophages induced by Microcystin-LR. Toxicology 2004, 197, 67–77. [Google Scholar] [CrossRef]
- Zhao, Y.; Xie, P.; Tang, R.; Zhang, X.; Li, L.; Li, D. In vivo studies on the toxic effects of microcystins on mitochondrial electron transport chain and ion regulation in liver and heart of rabbit. Comp. Biochem. Physiol. 2008, 148, 204–210. [Google Scholar] [CrossRef] [PubMed]
- Soares, R.; Cagido, V.; Ferraro, R.; Meyer-Fernandes, J.; Rocco, P.; Zin, W.; Azevedo, S. Effects of Microcystin-LR on mouse lungs. Toxicon 2007, 50, 330–338. [Google Scholar] [CrossRef] [PubMed]
- Andrinolo, D.; Sedan, D.; Telese, L.; Aura, C.; Masera, S.; Giannuzzi, L.; Marra, C.; Alaniz, M.T. Recovery after damage produced by subchronic intoxication with the cyanotoxin microcystin LR. Toxicon 2008, 51, 457–467. [Google Scholar] [CrossRef]
- Sedan, D.; Andrinolo, D.; Telese, L.; Giannuzzi, L.; Alaniz, M.T.; Marra, C.A. Alteration and recovery of the antioxidant system induced by sub-chronic exposure to Microcystin-LR in mice: Its relation to liver lipid composition. Toxicon 2010, 55, 333–342. [Google Scholar] [CrossRef]
- Lezcano, N.; Sedan, D.; Lucotti, I.; Giannuzzi, L.; Vittone, L.; Andrinolo, D.; Mundiña-Weilenmann, C. Subchronic Microcystin-LR exposure increased hepatic apoptosis and induced compensatory mechanisms in mice. J. Biochem. Mol. Toxicol. 2012, 26, 131–138. [Google Scholar] [CrossRef]
- Sedan, D.; Giannuzzi, L.; Rosso, L.; Marra, C.A.; Andrinolo, D. Biomarkers of prolonged exposure to Microcystin-LR in mice. Toxicon 2013, 68, 9–17. [Google Scholar] [CrossRef]
- Carter, P.J.; Nimmo, H.G.; Fewson, C.A.; Wilkins, M.B. Bryophyllum fedtschenkoi protein phosphatase 2A can dephosphorylate phosphoenolpyruvate carboxylase. FEBS Lett. 1990, 263, 233–236. [Google Scholar] [CrossRef] [Green Version]
- Siegl, G.; MacKintosh, C.; Stitt, M. Sucrose-Phosphate synthase is dephosphorylated by protein phosphatase 2A in spinach leaves: Evidence from the effects of okadaic acid and microcystin. FEBS Lett. 1990, 270, 198–202. [Google Scholar] [CrossRef] [Green Version]
- Takeda, S.; Mano, S.; Ohto, M.; Nakamura, K. Inhibitors of protein phosphatases 1 and 2A block the sugar-inducible gene expression in plants. Plant Physiol. 1994, 106, 567–574. [Google Scholar] [CrossRef] [PubMed] [Green Version]
- Pedmale, U.; Liscum, E. Regulation of phototropic signaling in Arabidopsis via phosphorylation state changes in the phototropin 1-interacting protein NPH3. J. Biol. Chem. 2007, 282, 19992–20001. [Google Scholar] [CrossRef] [PubMed] [Green Version]
- Chavéz-Avilés, M.; Andrade-Pérez, C.; Reyes de la Cruz, H. PP2A mediates lateral root development under NaCl-induced osmotic stress throughout auxin redistribution in Arabidopsis thaliana. Plant Soil 2013, 368, 591–602. [Google Scholar] [CrossRef]
- Kós, P.; Gorzó, G.; Surányi, G.; Borbély, G. Simple and efficient method for isolation and measurement of cyanobacterial hepatotoxins by plant tests (Sinapis alba L.). Anal. Biochem. 1995, 225, 49–53. [Google Scholar] [CrossRef]
- Abe, T.; Lawson, T.; Weyers, J.D.B.; Codd, G.A. Microcystin- LR inhibits photosynthesis of Phaseolus vulgaris primary leaves: Implications for current spray irrigation practice. New Phytol. 1996, 133, 651–658. [Google Scholar] [CrossRef]
- Kurki-Helasmo, K.; Meriluoto, J. Microcystin uptake inhibits growth and protein phosphatase activity in mustard (Sinapis alba L.) seedlings. Toxicon 1998, 36, 1921–1926. [Google Scholar] [CrossRef]
- Mc Elhiney, J.; Lawton, L.A.; Leifert, C. Investigations into the inhibitory effects of microcystins on plant growth, and the toxicity of plant tissues following exposure. Toxicon 2001, 39, 1411–1420. [Google Scholar] [CrossRef]
- Chen, J.Z.; Song, L.; Dai, E.; Gan, N.; Liu, Z. Effects of microcystins on the growth and the activity of superoxide dismutase and peroxidase of rape (Brassicanapus L.) and rice (Oryza sativa L.). Toxicon 2004, 43, 393–400. [Google Scholar] [CrossRef]
- Saqrane, S.; El Ghazali, I.; Oudra, B.; Bouarab, L.; Vasconcelos, V. Effects of cyanobacteria producing microcystins on seed germination and seedling growth of several agricultural plants. J. Environ. Sci. Health Part B 2008, 43, 443–451. [Google Scholar] [CrossRef]
- Sedan, D.; Malaissi, L.; Vaccarini, C.; Ventosi, E.; Laguens, M.; Rosso, L.; Crettaz-Minaglia, M.; Juárez, I.; Giannuzzi, L.; Andrinolo, D. Efectos tóxicos de [D-Leu1]MC-LR sobre tejidos animales y vegetales: Menor capacidad inhibitoria sobre PP1 y mayor potencia tóxica que MC-LR. In Proceedings of the 2º Congreso Iberoamericano y 6° Ibérico de Cianotoxinas, Murcia, Spain, 3–5 July 2019; O12. p. 22. [Google Scholar]
- Malanga, G.; Giannuzzi, L.; Hernando, M. The possible role of microcystin (D-Leu1 MC-LR) as an antioxidant on Microcystis aeruginosa (Cyanophyceae). In vitro and in vivo evidence. Comp. Biochem. Physiol. Part C 2019, 225, 1–9. [Google Scholar] [CrossRef]
- Ramos, D.F.; Matthiensen, A.; Colvara, W.; Souza de Votto, A.P.; Trindade, G.S.; Almeida da Silva, P.E.; Yunes, J.S. Antimycobacterial and cytotoxicity activity of microcystins. J. Venom. Anim. Toxins Incl. Trop. Dis. 2015, 21, 1–7. [Google Scholar] [CrossRef] [PubMed] [Green Version]
- Morales Garzón, F.J. El Mosaico Dorado y Otras Enfermedades del Frijol Común Causadas por Geminivirus Transmitidos por Mosca Blanca en la América Latina, 1st ed.; Centro Internacional de Agricultura Tropical (CIAT): Palmira (Valle), Colombia, 2000; pp. 1–20. [Google Scholar]
- Pflugmacher, S.; Jung, K.; Lundvall, L.; Neumann, S.; Peuthert, A. Effects of cyanobacterial toxins and cyanobacterial cell-fee crude extract on germination of Alfalfa (Mendicago Sativa) and induction of oxidative stress. Environ. Toxicol. Chem. 2006, 25, 2381–2387. [Google Scholar] [CrossRef] [PubMed]
- Pflugmacher, S.; Hofmann, J.; Hübner, B. Effects on growth and physiological parameters in Wheat (Triticum Aestivum L.) grown in soil and irrigated with cyanobacterial toxin contaminated water. Environ. Toxicol. Chem. 2007, 26, 2710–2716. [Google Scholar] [CrossRef] [PubMed]
- El Khalloufi, F.; El Ghazali, I.; Saqrane, S.; Oufdou, K.; Vasconcelos, V.; Oudra, B. Phytotoxic effects of a natural bloom extract containing microcystins on Lycopersicon esculentum. Ecotoxicol. Environ. Saf. 2012, 79, 199–205. [Google Scholar] [CrossRef]
- Scofield, G.N.; Ruuska, S.A.; Aoki, N.; Lewis, D.C.; Tabe, L.M.; Jenkins, C.L.D. Starch storage in the stems of wheat plants: Localization and temporal changes. Ann. Bot. 2009, 103, 859–868. [Google Scholar] [CrossRef] [Green Version]
- Corbel, S.; Mougin, C.; Bouaïcha, N. Cyanobacterial toxins: Modes of actions, fate in aquatic and soil ecosystems, phytotoxicity and bioaccumulation in agricultural crops. Chemosphere 2014, 96, 1–15. [Google Scholar] [CrossRef]
- Blakeslee, J.J.; Bandyopadhyay, A.; Lee, O.R.; Mravec, J.; Titapiwatanakun, B.; Sauer, M.; Makam, S.N.; Cheng, Y.; Bouchard, R.; Adamec, J.; et al. Interactions among PIN-FORMED and P-Glycoprotein Auxin Transporters in Arabidopsis. Plant Cell 2007, 19, 131–147. [Google Scholar] [CrossRef] [Green Version]
- Muday, G.K.; Brady, S.R.; Argueso, C.; Deruere, J.; Kieber, J.J.; De Long, A. RCN1-Regulated phosphatase activity and EIN2 modulate hypocotyl gravitropism by a mechanism that does not require ethylene signaling. Plant Physiol. 2006, 141, 1617–1629. [Google Scholar] [CrossRef] [Green Version]
- Takemiya, A.; Shimazaki, K.-I. Phosphatidic Acid Inhibits Blue Light-Induced Stomatal Opening via Inhibition of Protein Phosphatase 11[OA]. Plant Physiol. 2010, 153, 1555–1562. [Google Scholar] [CrossRef]
- Rashotte, A.M.; DeLong, A.; Muday, G.K. Genetic and Chemical Reductions in Protein Phosphatase Activity Alter Auxin Transport, Gravity Response, and Lateral Root Growth. Plant Cell 2001, 13, 1683–1697. [Google Scholar] [CrossRef] [Green Version]
- Michniewicz, M.; Zago, M.K.; Abas, L.; Weijers, D.; Schweighofer, A.; Meskiene, I.; Heisler, M.G.; Ohno, C.; Zhang, J.; Huang, F.; et al. Antagonistic Regulation of PIN Phosphorylation by PP2A and PINOID Directs Auxin Flux. Cell 2007, 130, 1044–1056. [Google Scholar] [CrossRef] [PubMed] [Green Version]
- Máthé, C.; Vasas, G. Microcystin-LR and Cylindrospermopsin Induced Alterations in Chromatin Organization of Plant Cells. Mar. Drugs 2013, 11, 3689–3717. [Google Scholar] [CrossRef] [PubMed] [Green Version]
- Sedan, D.; Laguens, M.; Copparoni, G.; Aranda, J.O.; Giannuzzi, L.; Marra, C.A.; Andrinolo, D. Hepatic and intestine alterations in mice after prolonged exposure to low oral doses of Microcystin-LR. Toxicon 2015, 104, 26–33. [Google Scholar] [CrossRef]
- Johansen, D.A. Plant Microtechnique; McGraw-Hill Book Company: New York, NY, USA, 1940. [Google Scholar]
- De Strittmatter, D. Nueva técnica de diafanización. Bol. Soc. Argent. Bot. 1973, 15, 126–129. [Google Scholar]
- Luque, R.; Sousa, H.C.; Kraus, J.E. Métodos de coloração de Roeser (1972) -modificado- e Kropp (1972) visando a substituição do azul de astra por azul de alcião 8 GS ou 8GX/Staining methods of modified Roeser (1972) and Kropp (1972), aiming at substituting the astra blue by alcian blue 8GS or 8GX. Acta Bot. Bras. 1996, 10, 199–212. [Google Scholar]
- Gurr, E. Synthetic Dyes in Biology, Medicine and Chemistry; Academic Press: London, UK, 1971. [Google Scholar]
- Ruzin, S.E. Plant Microtechnique and Microscopy; University Press: Oxford, UK, 1999. [Google Scholar]
- Lichtenthaler, H.K. Chlorophylls and Carotenoids, the Pigments of Photosynthetic Biomembranes. In Methods in Enzymology; Douce, R., Packer, L., Eds.; Academic Press Inc.: New York, NY, USA, 1987; pp. 350–382. [Google Scholar]
- Okawa, H.; Oshishi, N.; Yagi, K. Assay for lipid peroxides in animal tissues by thiobarbituric acid reaction. Anal. Biochem. 1979, 95, 351–358. [Google Scholar] [CrossRef]
- Chen, Y.-M.; Lee, T.-H.; Lee, S.-J.; Huang, H.-B.; Huang, R.; Chou, H.-N. Comparison of protein phosphatase inhibition activities and mouse toxicities of microcystins. Toxicon 2006, 47, 742–746. [Google Scholar] [CrossRef]


© 2020 by the authors. Licensee MDPI, Basel, Switzerland. This article is an open access article distributed under the terms and conditions of the Creative Commons Attribution (CC BY) license (http://creativecommons.org/licenses/by/4.0/).
Share and Cite
Malaissi, L.; Vaccarini, C.A.; Hernández, M.P.; Ruscitti, M.; Arango, C.; Busquets, F.; Arambarri, A.M.; Giannuzzi, L.; Andrinolo, D.; Sedan, D. [D-Leu1]MC-LR and MC-LR: A Small–Large Difference: Significantly Different Effects on Phaseolus vulgaris L. (Fabaceae) Growth and Phototropic Response after Single Contact during Imbibition with Each of These Microcystin Variants. Toxins 2020, 12, 585. https://0-doi-org.brum.beds.ac.uk/10.3390/toxins12090585
Malaissi L, Vaccarini CA, Hernández MP, Ruscitti M, Arango C, Busquets F, Arambarri AM, Giannuzzi L, Andrinolo D, Sedan D. [D-Leu1]MC-LR and MC-LR: A Small–Large Difference: Significantly Different Effects on Phaseolus vulgaris L. (Fabaceae) Growth and Phototropic Response after Single Contact during Imbibition with Each of These Microcystin Variants. Toxins. 2020; 12(9):585. https://0-doi-org.brum.beds.ac.uk/10.3390/toxins12090585
Chicago/Turabian StyleMalaissi, Luciano, Cristian Adrián Vaccarini, Marcelo Paulo Hernández, Marcela Ruscitti, Cecilia Arango, Federico Busquets, Ana María Arambarri, Leda Giannuzzi, Darío Andrinolo, and Daniela Sedan. 2020. "[D-Leu1]MC-LR and MC-LR: A Small–Large Difference: Significantly Different Effects on Phaseolus vulgaris L. (Fabaceae) Growth and Phototropic Response after Single Contact during Imbibition with Each of These Microcystin Variants" Toxins 12, no. 9: 585. https://0-doi-org.brum.beds.ac.uk/10.3390/toxins12090585