Article

The Assessment of Diet Contaminated with Aflatoxin B1 in Juvenile Turbot (Scophthalmus maximus) and the Evaluation of the Efficacy of Mitigation of a Yeast Cell Wall Extract

1
The Key Laboratory of Aquaculture Nutrition and Feed (Ministry of Agriculture), the Key Laboratory of Mariculture (Ministry of Education), Ocean University of China, Qingdao 266003, China
2
Institute of Quality Standards and Testing Technology for Agricultural Products, Chinese Academy of Agricultural Sciences, Beijing 100081, China
3
College of Agriculture, Ludong University, Yantai 264025, China
4
Beijing Alltech Biological Products (China) Co., Ltd., Beijing 100600, China
5
Alltech Inc., Center for Animal Nutrigenomics and Applied Animal Nutrition, 3031 Catnip Hill Road, Nicholasville, KY 40356, USA
*
Author to whom correspondence should be addressed.
Submission received: 25 August 2020 / Revised: 12 September 2020 / Accepted: 12 September 2020 / Published: 15 September 2020

Abstract

:
This study aimed to investigate the effects of dietary AFB1 on growth performance, health, intestinal microbiota communities and AFB1 tissue residues of turbot and evaluate the mitigation efficacy of yeast cell wall extract, Mycosorb® (YCWE) toward AFB1 contaminated dietary treatments. Nine experimental diets were formulated: Diet 1 (control): AFB1 free; Diets 2–5 or Diets 6–9: 20 μg AFB1/kg diet or 500 μg AFB1/kg diet + 0%, 0.1%, 0.2%, or 0.4% YCWE, respectively). The results showed that Diet 6 significantly decreased the concentrations of TP, GLB, C3, C4, T-CHO, TG but increased the activities of AST, ALT in serum, decreased the expressions of CAT, SOD, GPx, CYP1A but increased the expressions of CYP3A, GST-ζ1, p53 in liver. Diet 6 increased the AFB1 residues in serum and muscle, altered the intestinal microbiota composition, decreased the bacterial community diversity and the abundance of some potential probiotics. However, Diet 8 and Diet 9 restored the immune response, relieved adverse effects in liver, lowered the AFB1 residues in turbot tissues, promoted intestinal microbiota diversity and lowered the abundance of potentially pathogens. In conclusion, YCWE supplementation decreased the health effects of AFB1 on turbot, restoring biomarkers closer to the mycotoxin-free control diet.
Key Contribution: Yeast cell wall extract, used as a mycotoxin mitigation strategy, could effectively restore the immune response, counteract liver damage and disruption of intestinal microbiota and decrease AFB1 residues in tissues of turbot induced by AFB1-contaminated diet.

1. Introduction

Aquaculture is the fastest growing food production industry in the world, and by 2030 it is expected to provide 60 percent of the fish available for human consumption [1]. In aquaculture, plant-based protein alternatives are used to replace or partially replace fish meal since exclusive use of fish meal is not sustainable [2,3,4]. However, plant-based ingredients are easily contaminated with mycotoxins, which increase the health risks to fish [5,6]. Aflatoxin B1 (AFB1), the secondary metabolite of fungi Aspergillus parasiticus and A. flavus [7], is one of the most harmful mycotoxins [8]. In poultry and livestock, the detrimental effects of AFB1 include low productivity, high mortality of offspring, anorexia, poor growth, immune dysfunction, and AFB1 residues in edible animal parts [9,10,11,12,13,14,15]. In fish, there were studies of various species exposed to AFB1. Most of these studies concentrated on the impact on growth performance, liver lesions and immunosuppression induced by dietary AFB1. It had been reported that when sea bass (Dicentrarchus labrax) were fed a diet with 18 μg AFB1/kg of body weight, adverse effects (liver lesions and AFB1 residues in musculature) were induced [16]. Studies on rainbow trout (Oncorhynchus mykiss) indicated that toxic effects of AFB1 could be induced when fish were fed more than 0.05 μg AFB1/kg diet [17,18,19,20,21,22]. There was also plenty of research in nile tilapia (Oreochromis niloticus) [23,24,25,26], the poor growth performance was caused by more than 250 μg AFB1/kg in diet. Other relevant studies also included gibel carp (Carassius auratus gibelio) [27,28,29], grass carp (Ctenopharyngodon idella) [30], rohu (Labeo rohita) [31,32,33], red tilapia (O. niloticus × O. mossambicus) [34], channel catfish (Ictalurus punctatus) [35], tambaqui fingerlings (Colossoma macropomum) [36], beluga (Huso huso) [37] and Thai koi (Anabas testudineus) [38]. Usually the toxic effects of AFB1 occurred when the dose was greater than 100 μg/kg diet.
AFB1 is classified as Group 1 carcinogen of hepatocellular carcinoma to human by International Agency for Research on Cancer [39]. Consequently, food consumption of AFB1 presents a serious risk to human health [40,41,42]. Few studies showed the results of AFB1 residues in musculature in fish such as sea bass [16], gibel carp [27], tambaqui [36] and Thai koi [38], whereas other studies did not detect AFB1 tissue residues in nile tilapia [26] and red tilapia [34]. The disparities observed in these studies show the potential differences in responses and absorption/metabolization processes amongst fish species following AFB1 exposure. In addition, information on the effect of AFB1 on intestinal microbiota of fish is limited. Therefore, a more complete comprehensive understanding of the effects of AFB1 in fish is necessary.
AFB1 is stable and difficult to remove from contaminated feed; therefore, one of the strategies is to decrease its bioavailability [43]. Nowadays, adsorbing agents which could prevent AFB1 from being absorbed by the intestine are widely studied and used [41,43]. The studies of these products, including hydrated sodium calcium aluminosilicate, activated carbon, zeolites and yeast cell wall, etc., have been reviewed comprehensively [43,44,45,46,47,48]. Due to the negative effects of some of the inorganic adsorbents, such as adsorption of micronutrients [44,45], high inclusion rates [49] and limited adsorbing capacity to multiple mycotoxins [48,50], research has shifted to focus on composite-type mycotoxin adsorbents [43,51,52,53]. Yeast cell wall extract (YCWE) is an adsorbent that contains yeast cell wall, beer yeast powder, calcium carbonate and hydrated sodium calcium aluminosilicate, which have shown favorable effects in livestock and poultry challenged with mycotoxin exposure [54,55,56,57,58,59,60,61,62,63].
Turbot (Scophthalmus maximus) is an important commercial marine species in aquaculture. Recently, plant-based ingredients have been more widely used in the feeds of marine fish [2], with some inclusion levels higher than 50% of the total feed ingredients [64,65,66,67]. Research about the effects of AFB1 and mycotoxin adsorbents on turbot health and performance is lacking. Therefore, this study was aimed to investigate the impacts of AFB1 in turbot and evaluate the effects of YCWE on turbot fed AFB1 contaminated diets.

2. Results

2.1. Growth Performance

No significant difference was observed in FI and survival rate (p > 0.05) (Table 1). No significant difference was observed in WGR, SGR and FE in Diets 1–5 (p > 0.05) (Table 1). WGR and SGR of fish fed Diet 6 were lower than that of fish fed Diet 1 but no significant difference was observed (p > 0.05) (Table 1). The FE of fish fed Diet 6 was significantly lower than that of fish fed Diet 1 (p < 0.05) (Table 1). No significant difference was observed in moisture and crude protein content of fish (p > 0.05) (Table 2). No significant difference was observed in content of ash and crude lipid of fish fed Diets 1–5 (p > 0.05) (Table 2). The content of crude lipid of fish fed Diet 6 was significantly lower than that of fish fed Diet 1. The Diet 8 and Diet 9 resulted in significantly higher crude lipid content compared to fish fed Diet 6, but this was still significantly lower than that of fish fed Diet 1 (p < 0.05) (Table 2). Conversely, the content of ash of fish fed Diets 6, 7 and 8 was significantly higher than that of fish fed Diet 1 (p < 0.05) (Table 2). However, no significant difference of the ash content was observed between Diet 1 and Diet 9 (p > 0.05) (Table 2).

2.2. Biochemical Analysis of Serum

2.2.1. TP, ALB and GLB

No significant difference was observed in the concentration of serum TP of fish fed Diets 1–5 (p > 0.05) (Figure 1A). The concentration of TP of fish fed Diet 6 was significantly lower than that of fish fed Diet 1 (p < 0.05) (Figure 1A). However, Diets 7, 8 and 9 resulted in significantly higher concentration of TP compared to Diet 6 (p < 0.05) (Figure 1A). No significant difference was observed in the concentration of serum ALB (p > 0.05) (Figure 1B). The concentration of GLB of fish fed Diet 2 and Diet 6 was significantly lower than that of in control diet (p < 0.05) (Figure 1C). However, Diet 8 and Diet 9 resulted in significantly higher concentration of GLB compared to Diet 6 (p < 0.05) (Figure 1C).

2.2.2. IgM, C3, C4 and LZM

No significant difference was observed in the concentration of serum IgM and the activity of serum LZM among all groups (p > 0.05) (Table 3). No significant difference was observed on the concentrations of serum C3 and C4 of fish fed Diets 1–5 (p > 0.05) (Table 3). The concentrations of serum C3 and C4 of fish fed Diet 6 were significantly lower than that of fish fed Diet 1, while serum C3 and C4 concentrations of fish fed Diets 7, 8 and 9 were equal to those observed in fish fed Diet 1 (p > 0.05) (Table 3).

2.2.3. TG and T-CHO

No significant difference was observed on the concentrations of serum TG and T-CHO of fish fed Diets 1–5 (p > 0.05) (Table 3). The concentrations of serum TG and T-CHO of fish fed Diet 6 and Diet 7 were significantly lower than that of fish fed Diet 1 (p < 0.05) (Table 3). In addition, no significant difference was observed on the concentrations of serum TG and T-CHO of fish fed Diet 8 and Diet 9 compared to Diet 1 (p > 0.05) (Table 3).

2.2.4. ALP, AST and ALT

No significant difference was observed in the activity of serum ALP among all groups (p > 0.05) (Figure 2A). No significant difference was observed in the activities of serum AST and ALT of fish fed Diets 1–5 (p > 0.05) (Figure 2B,C). The activities of AST and ALT in serum of fish fed Diet 6 were significantly higher than that of fish fed Diet 1 (p < 0.05) (Figure 2B,C). However, fish fed Diet 8 and Diet 9 had significantly lower activities of AST and ALT in serum compared to fish fed Diet 6 (p < 0.05) (Figure 2B,C).

2.3. Gene Expression in Liver

2.3.1. Antioxidant Genes

No significant difference was observed for gene expression of CAT, SOD or GPx of fish fed Diets 1–5 (p > 0.05) (Figure 3A–C). The gene expression of CAT, SOD and GPx of fish fed Diet 6 was significantly lower than that of fish fed Diet 1 (p < 0.05) (Figure 3A–C). Compared to Diet 6, the gene expression of CAT of fish was significantly heightened by Diet 9 (p < 0.05) (Figure 3A), and the gene expression of SOD of fish was significantly heightened by Diet 8 and Diet 9 (p < 0.05) (Figure 3B). No significant difference was observed for gene expression of CAT, SOD or GPx when fish were fed Diets 7, 8 and 9 compared to Diet 1 (p > 0.05) (Figure 3A–C).

2.3.2. CYP1A, CYP3A, GST-ζ1

No significant difference was observed on gene expression of CYP1A, CYP3A and GST-ζ1 of fish fed Diets 1–5 (p > 0.05) (Figure 4A–C). The gene expression of CYP1A of fish fed Diet 6 was significantly lower than that of fish fed Diet 1 (p < 0.05) (Figure 4A), while the expression was significantly higher in fish fed Diet 8 and Diet 9 (p < 0.05) (Figure 4A). The gene expression of CYP3A and GST-ζ1 of fish was significantly increased by Diet 6 (p < 0.05) (Figure 4B,C). Compared to Diet 6, the gene expression of CYP3A of fish was significantly lowered by Diet 8 and Diet 9 (p < 0.05) (Figure 4B), and the gene expression of GST-ζ1 of fish was significantly lowered by Diets 7, 8 and 9 (p < 0.05) (Figure 4C). No significant difference was observed for gene expression of CYP1A, CYP3A and GST-ζ1 when fish were fed Diet 8 and Diet 9 compared to Diet 1 (p > 0.05) (Figure 4A–C).

2.3.3. Apoptosis Gene

No significant difference was observed on gene expression of p53 of fish fed Diets 1–5 (p > 0.05) (Figure 4D). The gene expression of p53 of fish fed Diet 6 was significantly higher than that of fish fed Diet 1 (p < 0.05) (Figure 4D). Compared to Diet 6, the gene expression of p53 of fish was significantly lowered by Diet 8 and Diet 9 (p < 0.05) (Figure 4D). No significant difference was observed for gene expression of p53 when fish were fed Diet 8 and Diet 9 compared to Diet 1 (p > 0.05) (Figure 4D).

2.4. Intestinal Microbiota

After assembled, quality screened and trimmed, a total of 3,106,795 high quality valid reads were obtained, resulting in identification of 22,064 OTUs under 97% sequence similarity. These OTUs were assigned to 66 phyla, 82 classes, 185 orders, 375 families, and 1347 genera. Rarefaction curves, rank abundance and species accumulation boxplot showed that all samples reached the saturation phase, indicating adequate sequencing depth (Figure S1). At phylum level, Firmicutes, Proteobacteria, Bacteroidetes were the predominant bacterial phyla in turbot intestinal content across all groups, and Actinobacteria, Acidobacteria, Cyanobacteria, Tenericutes, Fusobacteria, Deinococcus-Thermus, Chloroflexi completed the top 10 most abundant phyla (Figure 5A). At the genus level, the top 10 most abundant genera were Ignatzschineria, Sphingomonas, Massilia, Lactobacillus, Gardnerella, Acinetobacter, Proteiniphilum, unidentified_Clostridiales, Enhydrobacter, Candidatus_Arthromitus (Figure 5B).
The alpha diversity indices indicated that no significant difference was observed on OTUs, Chao1 index, ACE index and Shannon index of fish fed Diets 1–5 (p > 0.05) (Table 4). OTUs, Chao1 index, ACE index and Shannon index were significantly lowered when fish were fed Diet 6 (p < 0.05) (Table 4). The Diet 2 and Diet 6 resulted in significantly lower PD whole tree index in turbot intestinal microbiota, especially, when fish were fed Diet 6, the PD whole tree index was even lower (p < 0.05) (Table 4). However, the Diets 7, 8 and 9 resulted in significantly higher alpha diversity indices including OTUs, Chao1 index, ACE index, Shannon index, and PD whole tree index (p < 0.05) (Table 4). No significant difference was observed on Simpson index among all groups (p > 0.05) (Table 4).
In Diets 1–5 groups, MRPP test confirmed the differences between groups were greater than differences within groups (Table S1). The results of Adonis test indicated the intestinal microbial community structure of fish fed Diet 1 or Diet 2 was significantly different from other groups, while the difference within Diets 3, 4 and 5 was not significant (Table S1). Similarly, the PCoA (Figure 6A) and UPGMA (Figure S2A) plot showed that samples clustered together according to the diets with a clear separation among Diet 1, Diet 2 and Diets 3–5. In Diet 1, Diet 6 and Diet 8 groups, MRPP test confirmed the differences between groups were greater than differences within groups (Table S2). The results of Adonis test indicated the intestinal microbial community structure in these three groups were significantly different from each other (Table S2). Similarly, the PCoA (Figure 6B) and UPGMA (Figure S2B) plot showed that samples clustered together according to the diets with a clear separation among Diet 1, Diet 6 and Diet 8.
MetaStat analysis was conducted to compare the relative abundance of intestinal bacteria at genus levels in Diet 1, Diet 6 and Diet 8 groups (Figure 7). The Diet 6 resulted in significantly lower abundance of genera Lactobacillus, Lactococcus, Streptococcus, Faecalibacterium, unidentified Lachnospiraceae, Blautia, unidentified Clostridiales, Alcaligenes, Sphingomonas, unidentified Enterobacteriaceae, and unidentified Acidobacteria, as well as potential pathogenic genera Salmonella, Aeromonas and Comamonas compared to Diet 1 (p < 0.05) (Figure 7). The Diet 8 resulted in significantly higher abundance of genera Lactobacillus, Streptococcus, unidentified Lachnospiraceae, Blautia, unidentified Clostridiales, unidentified Acidobacteria and Salmonella compared to Diet 6 (p < 0.05) (Figure 7). The Diet 8 resulted in significantly lower abundance of genera Lactococcus, Bifidobacterium, and potential pathogenic genera Salmonella, Aeromonas and Comamonas compared to Diet 1 (p < 0.05) (Figure 7).

2.5. AFB1 Residues in Serum and Muscle

No AFB1 residues in serum or muscle were detected in control group (Diet 1, Figure 8). The AFB1 residues in serum of fish fed Diet 4 and Diet 5 was significantly lower than that of fish fed Diet 2 (p < 0.05) (Figure 8A). The AFB1 residues in serum of fish fed Diet 9 was significantly lower than that of fish fed Diet 6 (p < 0.01) (Figure 8A). Besides, the AFB1 residues in muscle of fish fed Diet 5 was lower than that of fish fed Diet 2, fish fed Diet 8 and Diet 9 was lower than that of fish fed Diet 6, while no significant difference was observed (p > 0.05) (Figure 8B).

3. Discussion

In the present study, dietary AFB1 (20 and 500 μg/kg) did not remarkably affect the growth performance of turbot in a 67-day feeding trial. The adverse effects of higher level of AFB1 in diet on growth performance had been reported in several fish species. In nile tilapia, diets with AFB1 (2000 or 4000 μg/kg) remarkably reduced the weight gain (WG), FE, and the content of crude lipid [23], while results reported by Tuan et al. [25] and Deng et al. [26] demonstrated that WG, FI and FE were significantly reduced by 250 μg/kg or higher dietary AFB1. A similar result was also showed in tambaqui (500 μg/kg or higher level of AFB1) [36]. However, previous studies found that a diet with low levels of AFB1 could reduce the WGR, SGR and FI of grass carp (less than 147 μg/kg AFB1) [30]. Beluga fed diets with 75 or 100 μg/kg AFB1 affected WG and FE but not the SGR [37]. The effects of dietary AFB1 on the growth performance of fish is closely tied to the level of AFB1 in diet but is also dependent on the fish species, the development stage, the environment and the length of feeding terms.
It has been identified that dietary AFB1 could induce immunosuppressive response in aquatic animals, such as sea bass [16], grass carp [30], rohu [32], nile tilapia [68,69] and pacific white shrimp [
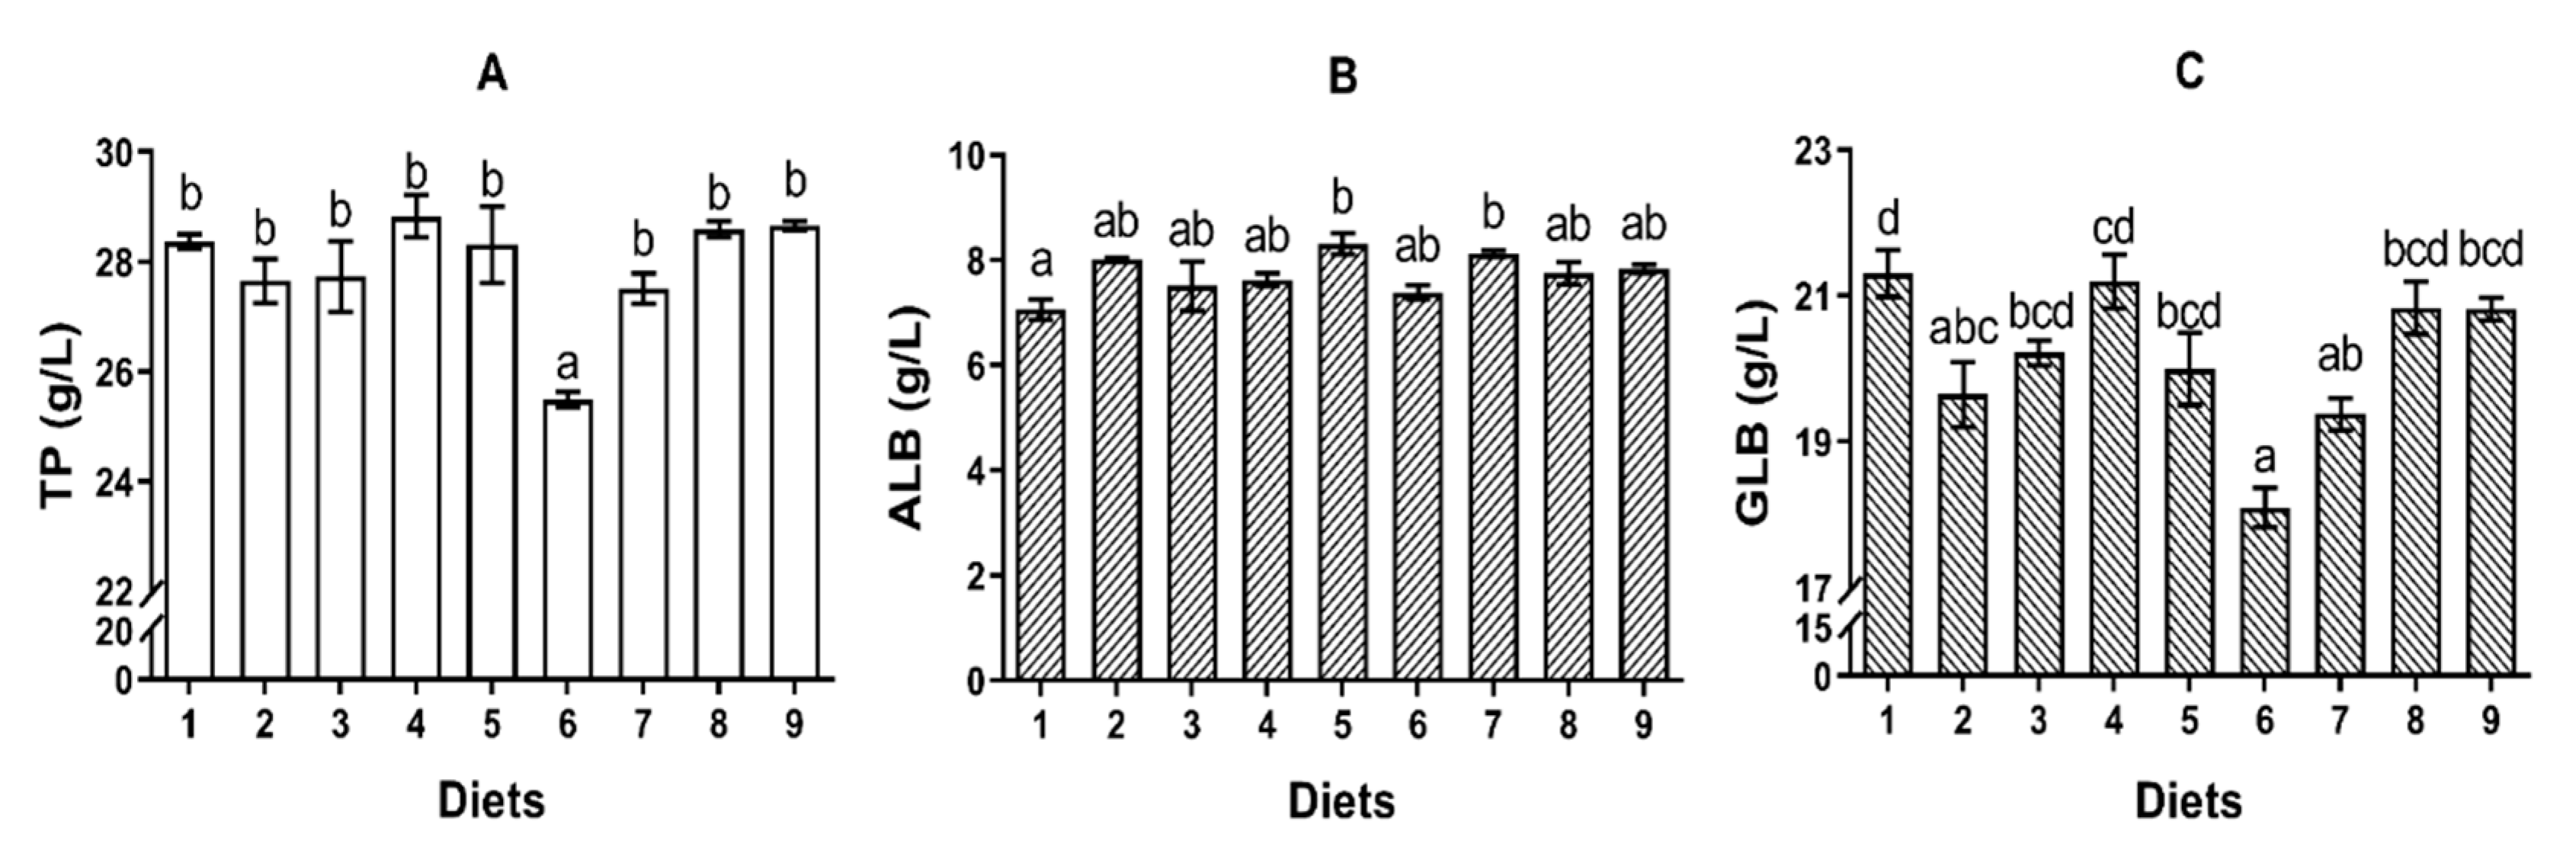
70]. The level of TP and GLB can reflect protein synthesis capacity and immunity [32,71,72]. C3 and C4 are the key components of both classical and lectin pathways responsible for various immune effector functions [73]. In the current study, the concentrations of TP and GLB, as well as the concentrations of C3 and C4 in serum, were reduced by Diet 6, which suggested an immunosuppressive effect. It has been reported that the reduction of TP might be attributed to the hepatocellular damage [32], and reduction of GLB might be resulting from lymphocytolysis [
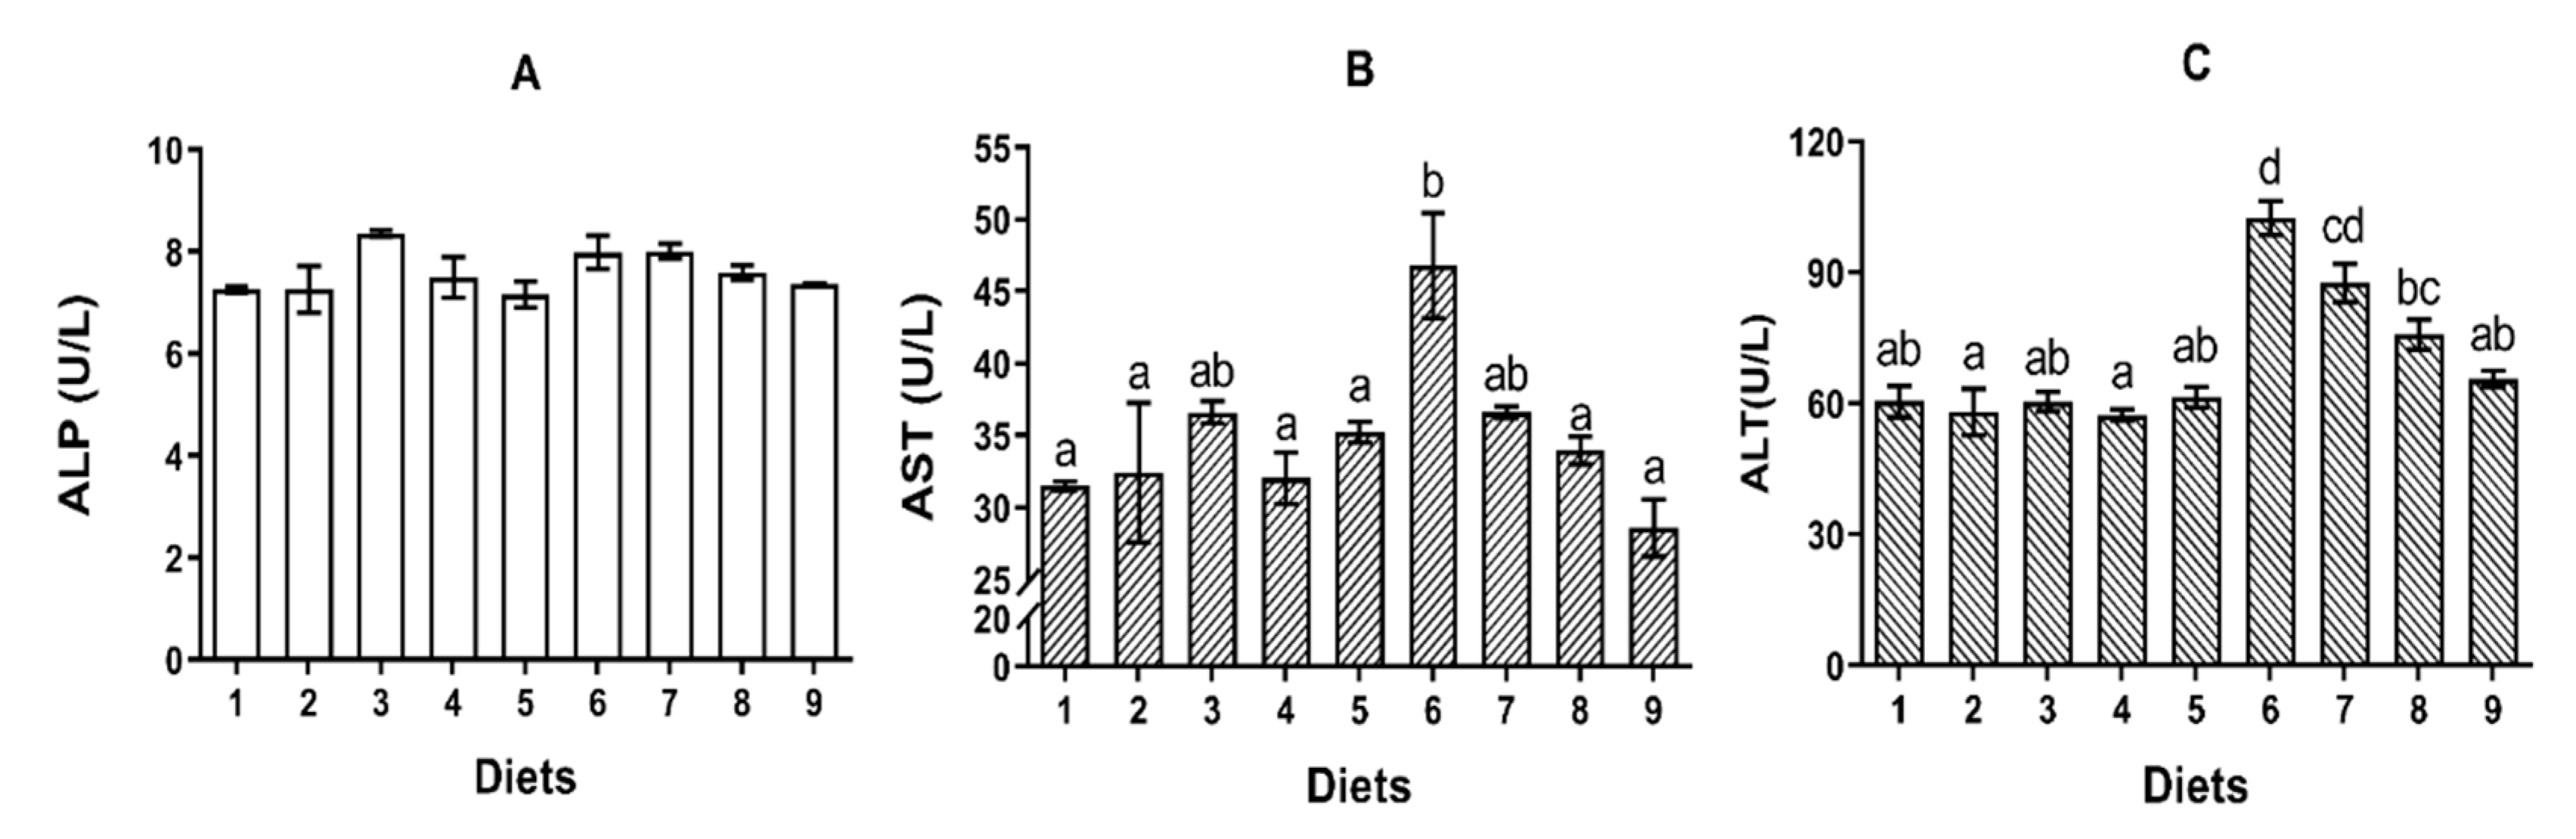
74]. Generally, AST and ALT are recognized as biomarkers to identify the hepatic functions and cell membrane permeability. In the present study, turbot fed Diet 6 had higher activities of AST and ALT in serum indicating that AFB1 might cause hepatocellular damage in turbot. Similar results had been observed in other aquatic animals such as sea bass [16], nile tilapia [26], gibel carp [29] and pacific white shrimp [75]. The reduction of the concentrations of TG and T-CHO in serum induced by Diet 6 was similar when compared to previous studies performed in broiler chicks and ducks [76,77]. Due to the hepatocellular damage, the synthesis of TG and T-CHO was decreased, which was consistent with the lower concentrations of TP and GLB of serum as well. On the other hand, AFB
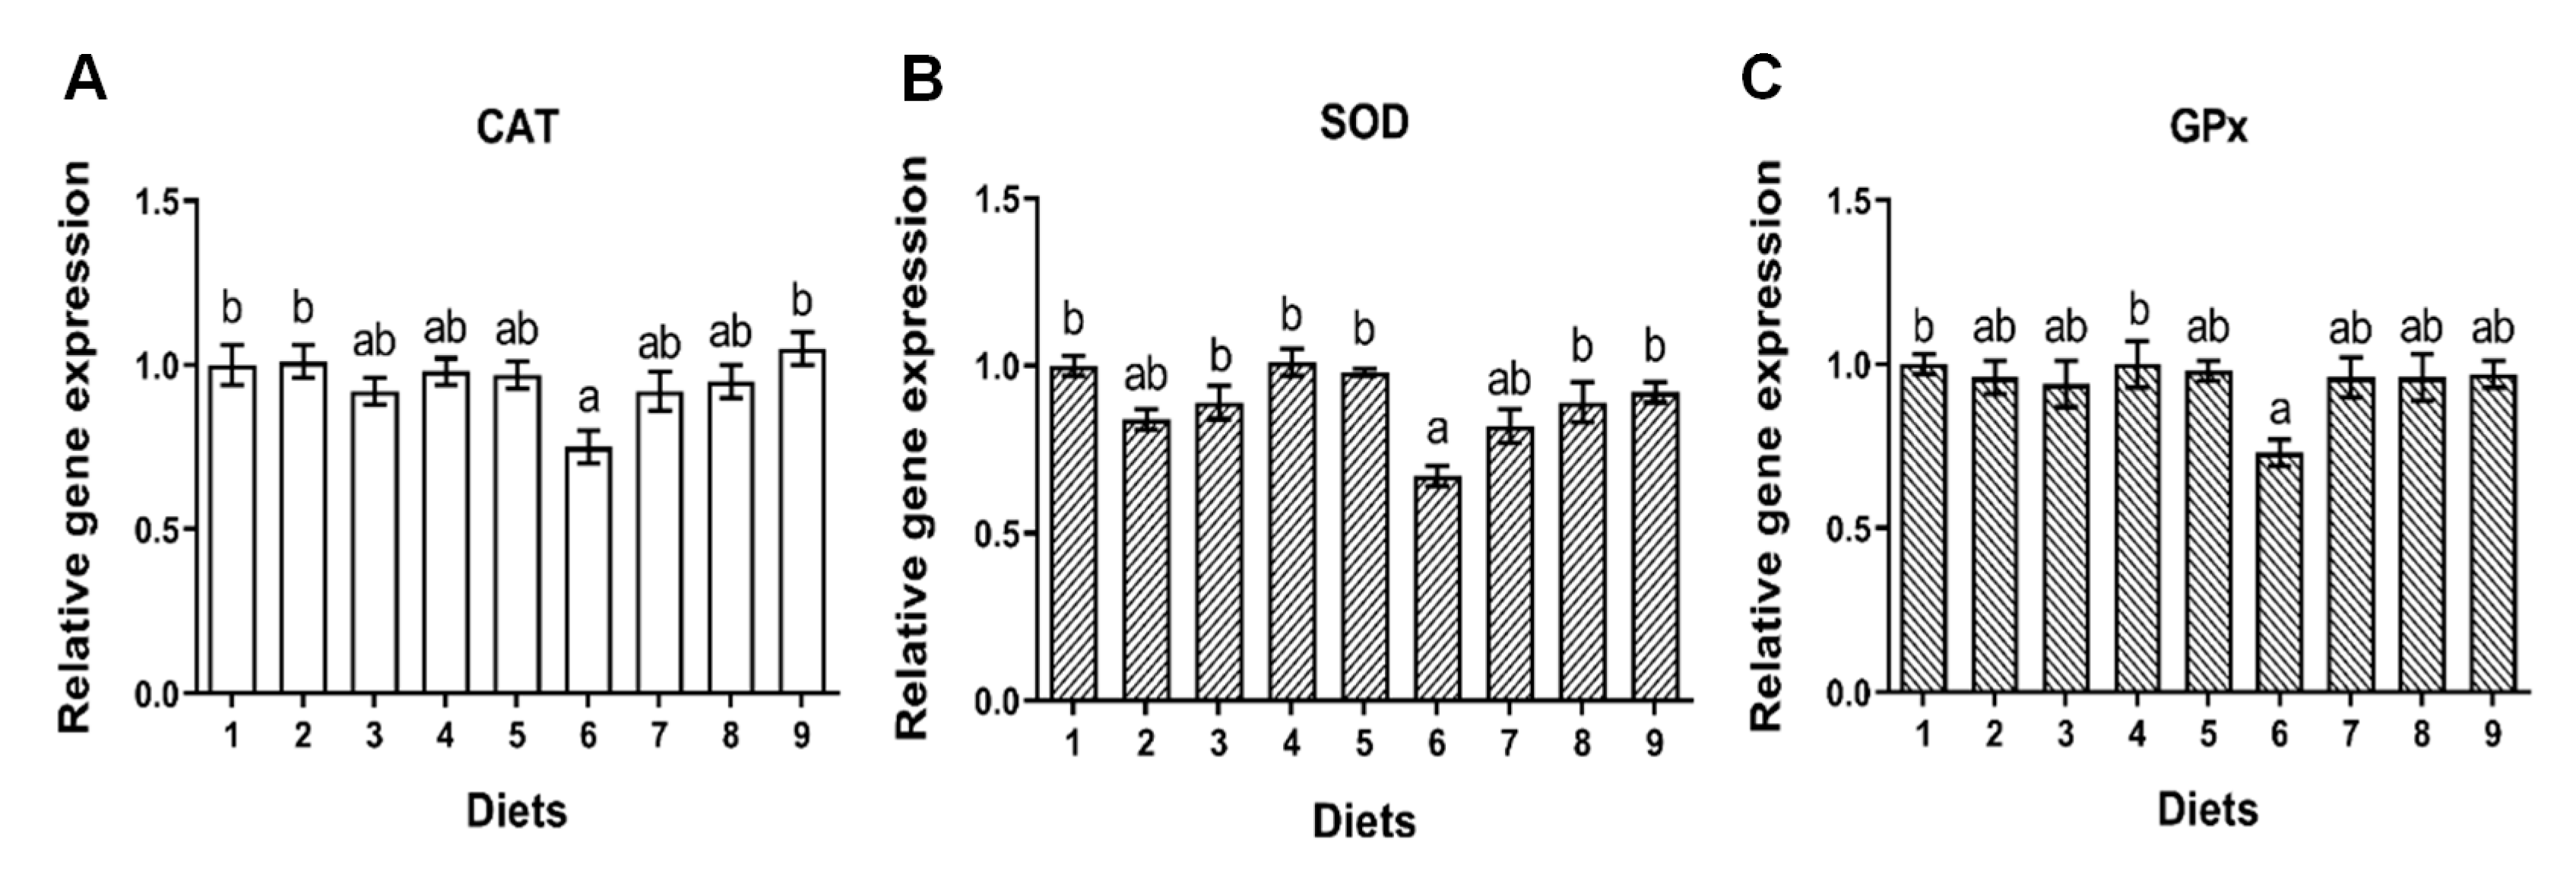
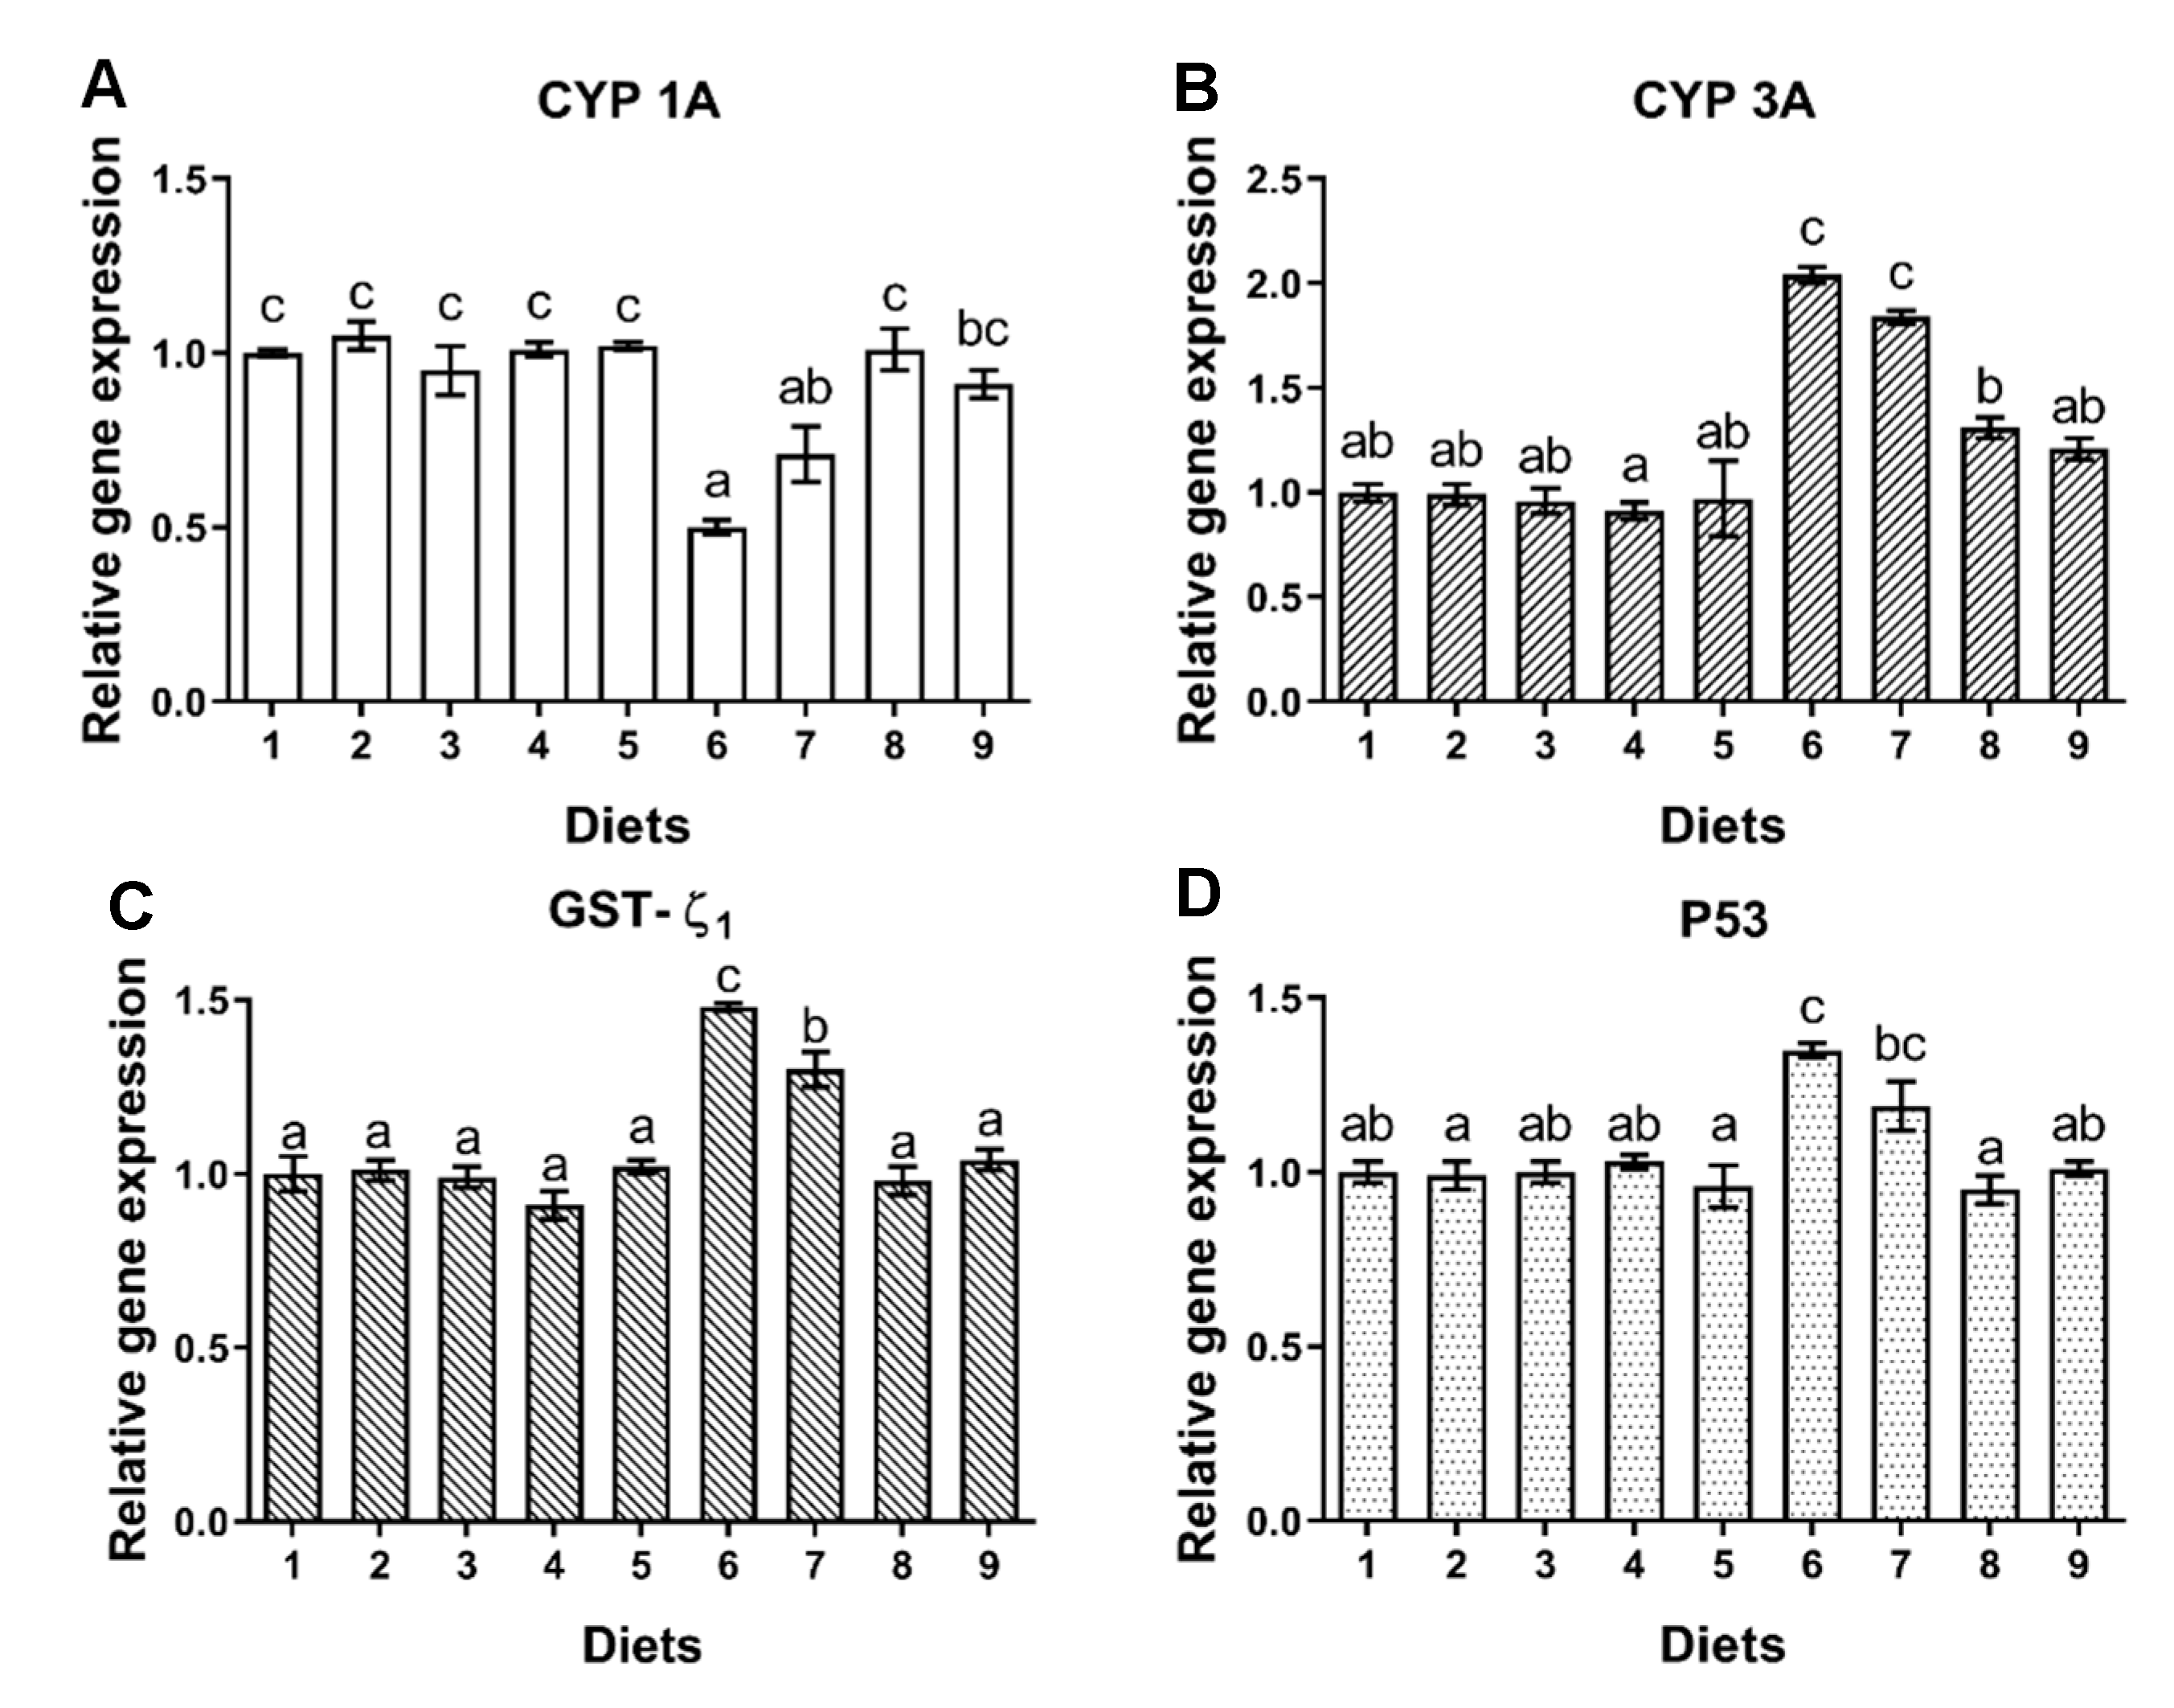
1 requires metabolic activation by the cytochrome p450 enzymes system to generate AFB1-exo-8, 9-epoxide (AFBO), which can exert cytotoxic effects [78]. GSTs is one of the important detoxifiers of AFBO [79]. In the process of hepatocellular function, CYP1A and CYP3A play key roles in AFB1 activation [80,81,82], but CYP1A or CYP3A could also convert AFB1 to less toxic AFM1 or AFQ1, respectively [82]. In this study, the down-regulated expression of CYP1A and up-regulated expression of CYP3A and GST-ζ1 observed in fish fed Diet 6, might indicate that the affinity of CYP1A and CYP3A to AFB1 is different in hepatocytes of turbot. Moreover, AFBO, one of the oxidation products of AFB1 is easily bound to DNA, which could induce DNA damage [83,84]. Gene p53 could promote apoptosis when DNA damage is unrepaired [85]. Consequently, tissue antioxidant capacity may be compromised, and the oxidative metabolism of AFB1 may contribute further to oxidative stress [26,86], eventually leading to oxidative damage as well. This was consistent with the decreased expression of liver p53, CAT, SOD and GPx in group of Diet 6. A previous study in rohu also reported that both DNA and oxidative damage of liver were induced by dietary AFB1 [87,88].
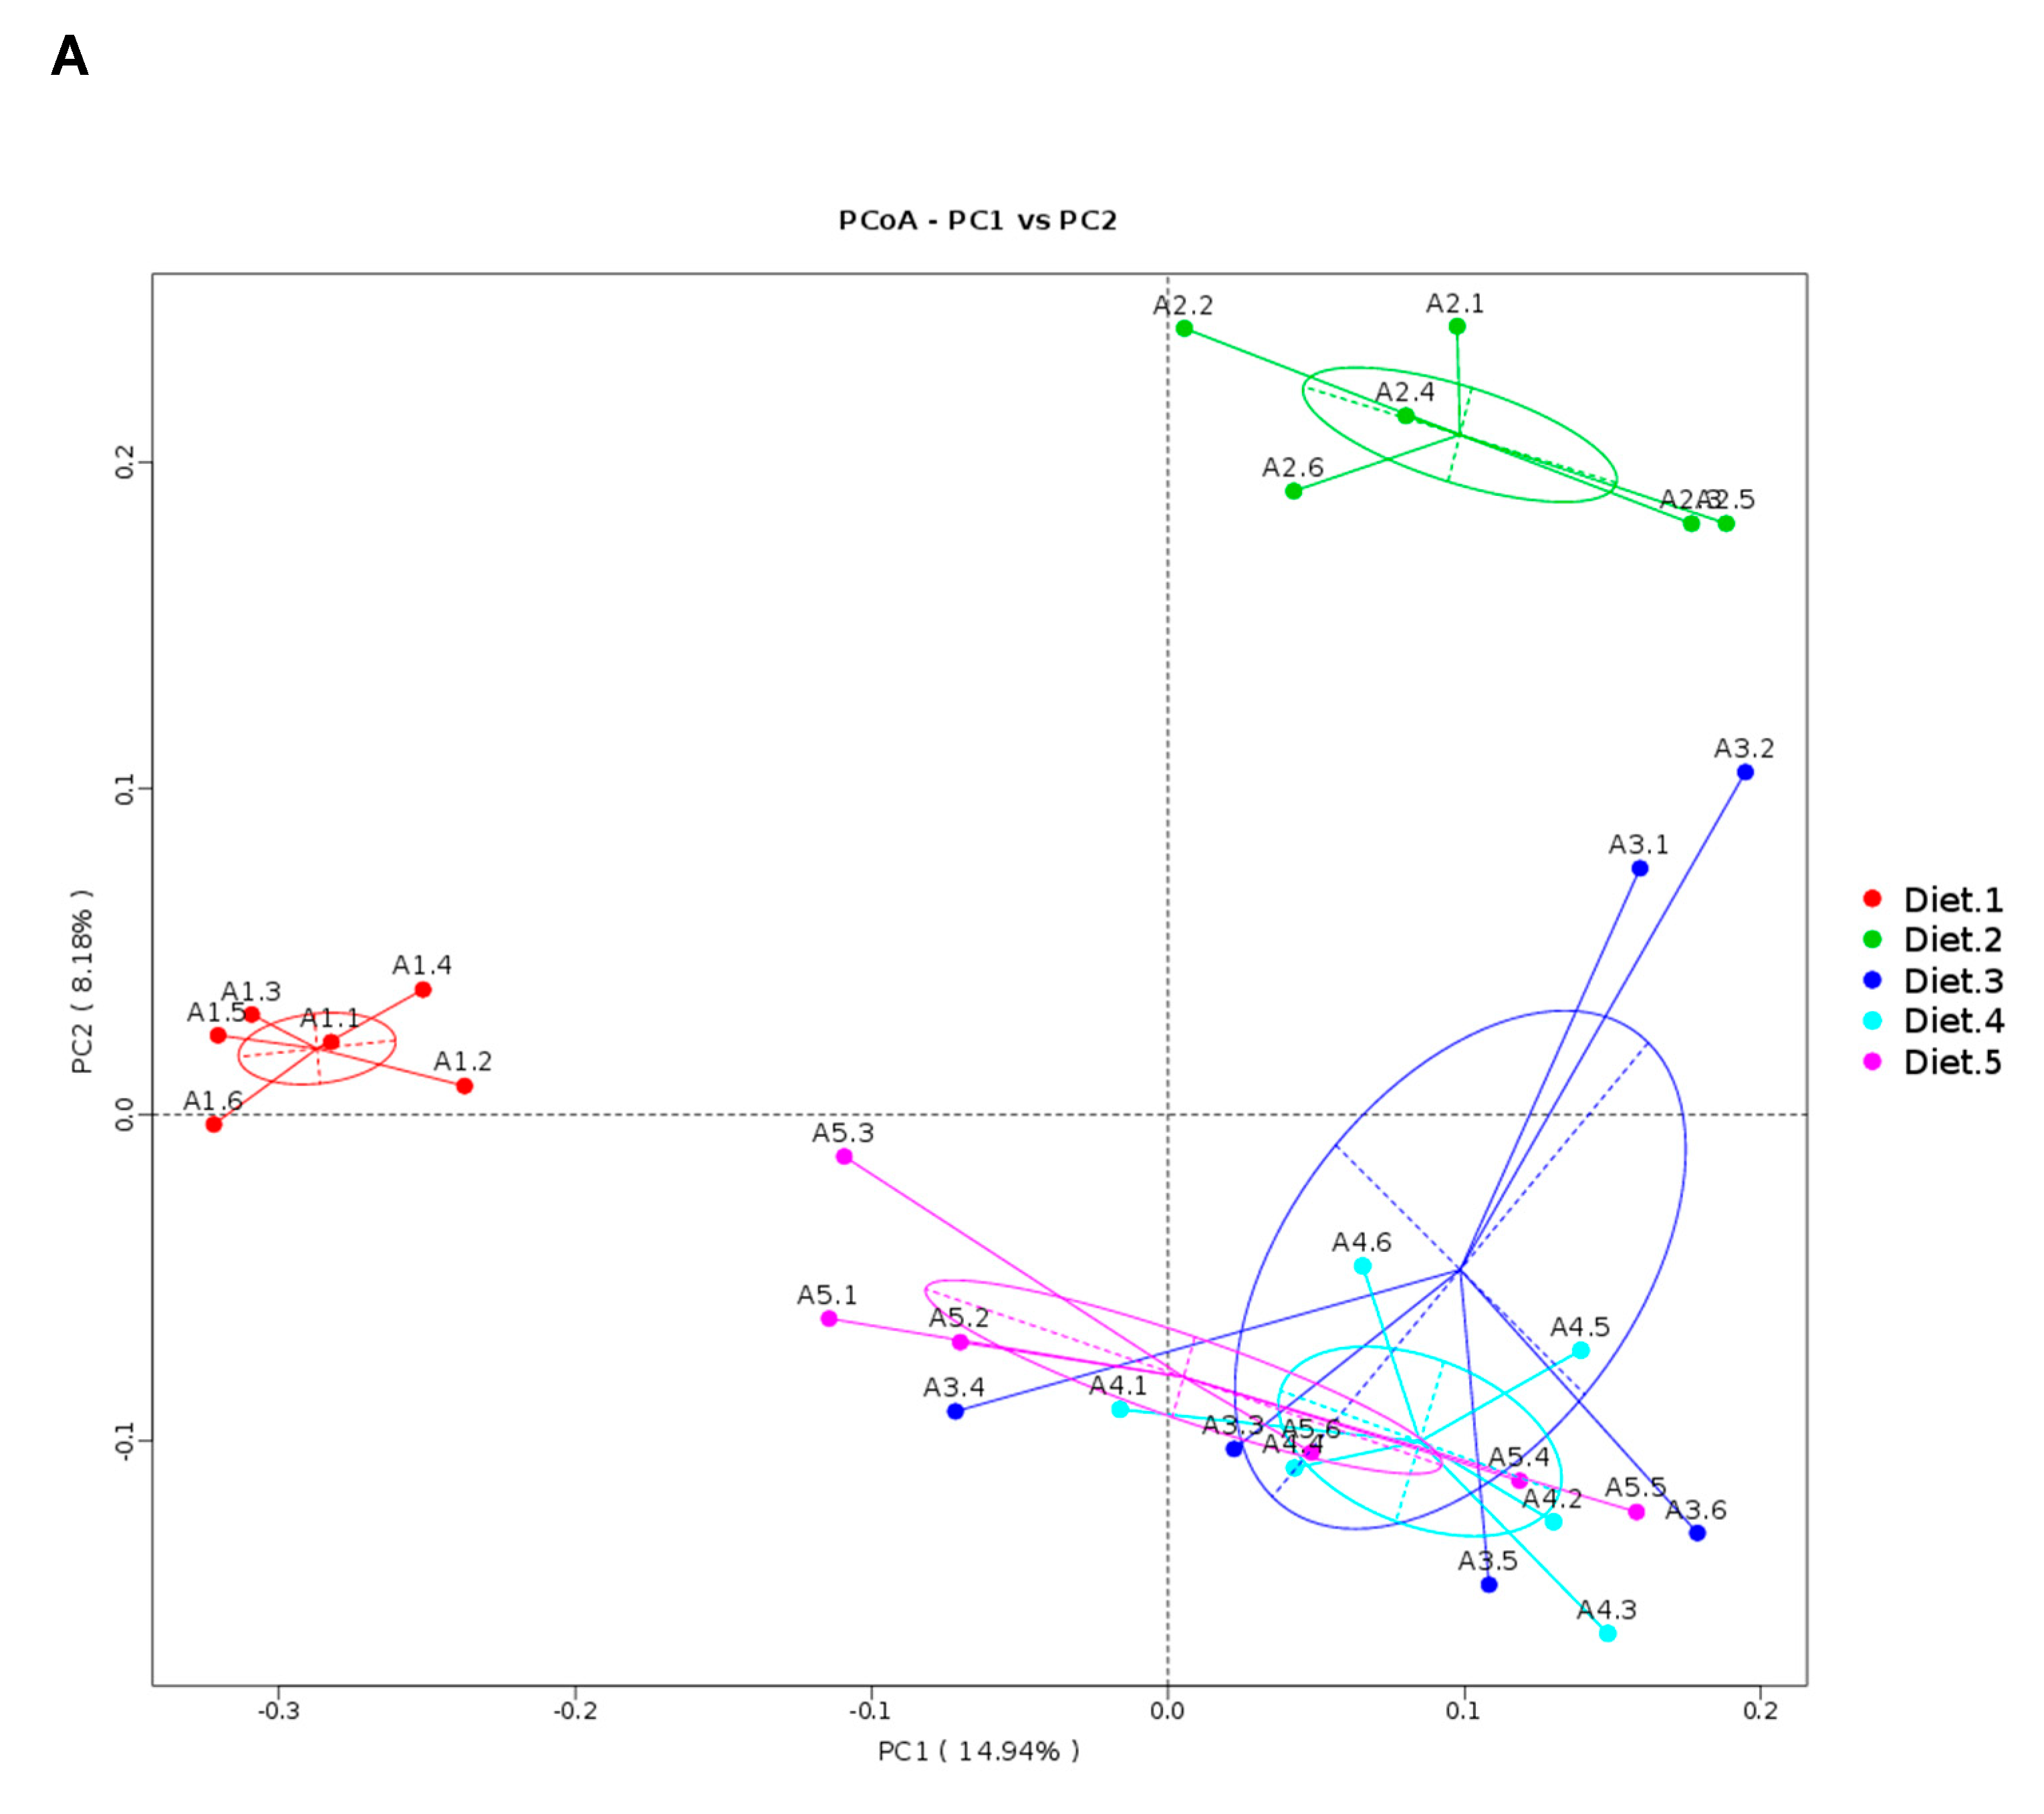
In the present study, high-throughput sequencing was used to assess the overall intestinal microbiota community of juvenile turbot in response to dietary AFB1 and YCWE. The observation that the predominant phyla in the intestinal mucosa belonged to Firmicutes and Proteobacteria was in accordance with previous studies on turbot intestinal microbiota [89,90]. Compared with control group, turbot fed Diet 6 showed the lowest observed OTUs and phylogenetic diversity, and the microbiota community formed a different cluster from other groups. This was similar to a study in male Fischer 344 rat where AFB1 significantly decreased the observed OTUs and phylogenetic diversity [91]. In addition, Wang et al. reported the number of bacterial species at genus and phylum level were decreased by a dietary level of 5000 μg/kg AFB1 in pacific white shrimp [92]. The present study showed that Diet 6 significantly decreased the abundance of some potential beneficial microbiota, including Lactobacillus, Lactococcus, Streptococcus, Faecalibacterium genera, which are lactic acid producers [93]. It has been reported that lactic acid could efficiently degrade AFB1 into less toxic AFB2 and AFB2a [94]. In addition, some studies had proved that some strains of Lactobacillus, Lactococcus, Streptococcus and Bifidobacterium could detoxify AFB1 by cell binding mechanisms [95,96,97]. Therefore, the intestinal bacteria might be involved in detoxification of AFB1. Besides, previous studies had reported the intestinal microbiota alteration of liver diseases’ patients. For example, in the host with cirrhosis and hepatic encephalopathy diseases, the decreased abundance of non-pathogenic bacteria Lachnospiraceae and Clostridiales were observed; in the host with non-alcoholic fatty liver disease, the decreased abundance of potential probiotics Faecalibacterium and Bifidobacterium were observed [98]. Therefore, the role of intestinal bacteria in liver disease induced by AFB1 is of great significance for further research.
Several studies have reported AFB1 residues in fish fed dietary AFB1. While few studies paid attention to the residues of AFB1 in serum, the current study was the first to study AFB1 residues both in serum and muscle of aquatic animals. The result showed that AFB1 residues in serum was higher than in muscle of turbot fed Diet 6. Furthermore, Han et al. reported AFB1 residues in muscle and ovaries of gibel carp [27], and similar findings had been observed in kidney and spleen of grass carp [30] and muscle, kidney and liver of tambaqui [36]. El-Sayed and Khalil reported AFB1 residues in musculature of sea bass at high level (about 5 μg/kg), the consumption of which could have negative effects on human health [16]. In contrast, two experiments with nile tilapia and red tilapia concluded that the consumption of fish muscle had no effects on human health as no AFB1 residue was detected when fish were exposed to AFB1 [26,34]. These differences might be the result of different uptake doses of AFB1 and different AFB1 metabolism pathways in different fishes.
In the present study, Diet 2 altered intestinal microbiota composition; however, there were no significant effects observed on growth performance, immune response and the diversity and abundance of intestinal microbiota in 67 days feeding trial. Nonetheless, low level of AFB1 residues in serum and muscle were observed in fish fed Diet 2. The AFB1 residues of fish muscle might accumulate more under long-term cultivation. Food contaminated with AFB1 residues may increase the risk to human hepatoma [99]. The safety level of AFB1 in human food has been set at 2 μg/kg by the European Union [100]; however, experts of FAO and WHO have given a guidance value for a provisional maximum tolerated daily intake of 1 ng AFB1/kg body weight per day [101]. Hence, even a low dose of AFB1 residues poses a danger to humans.
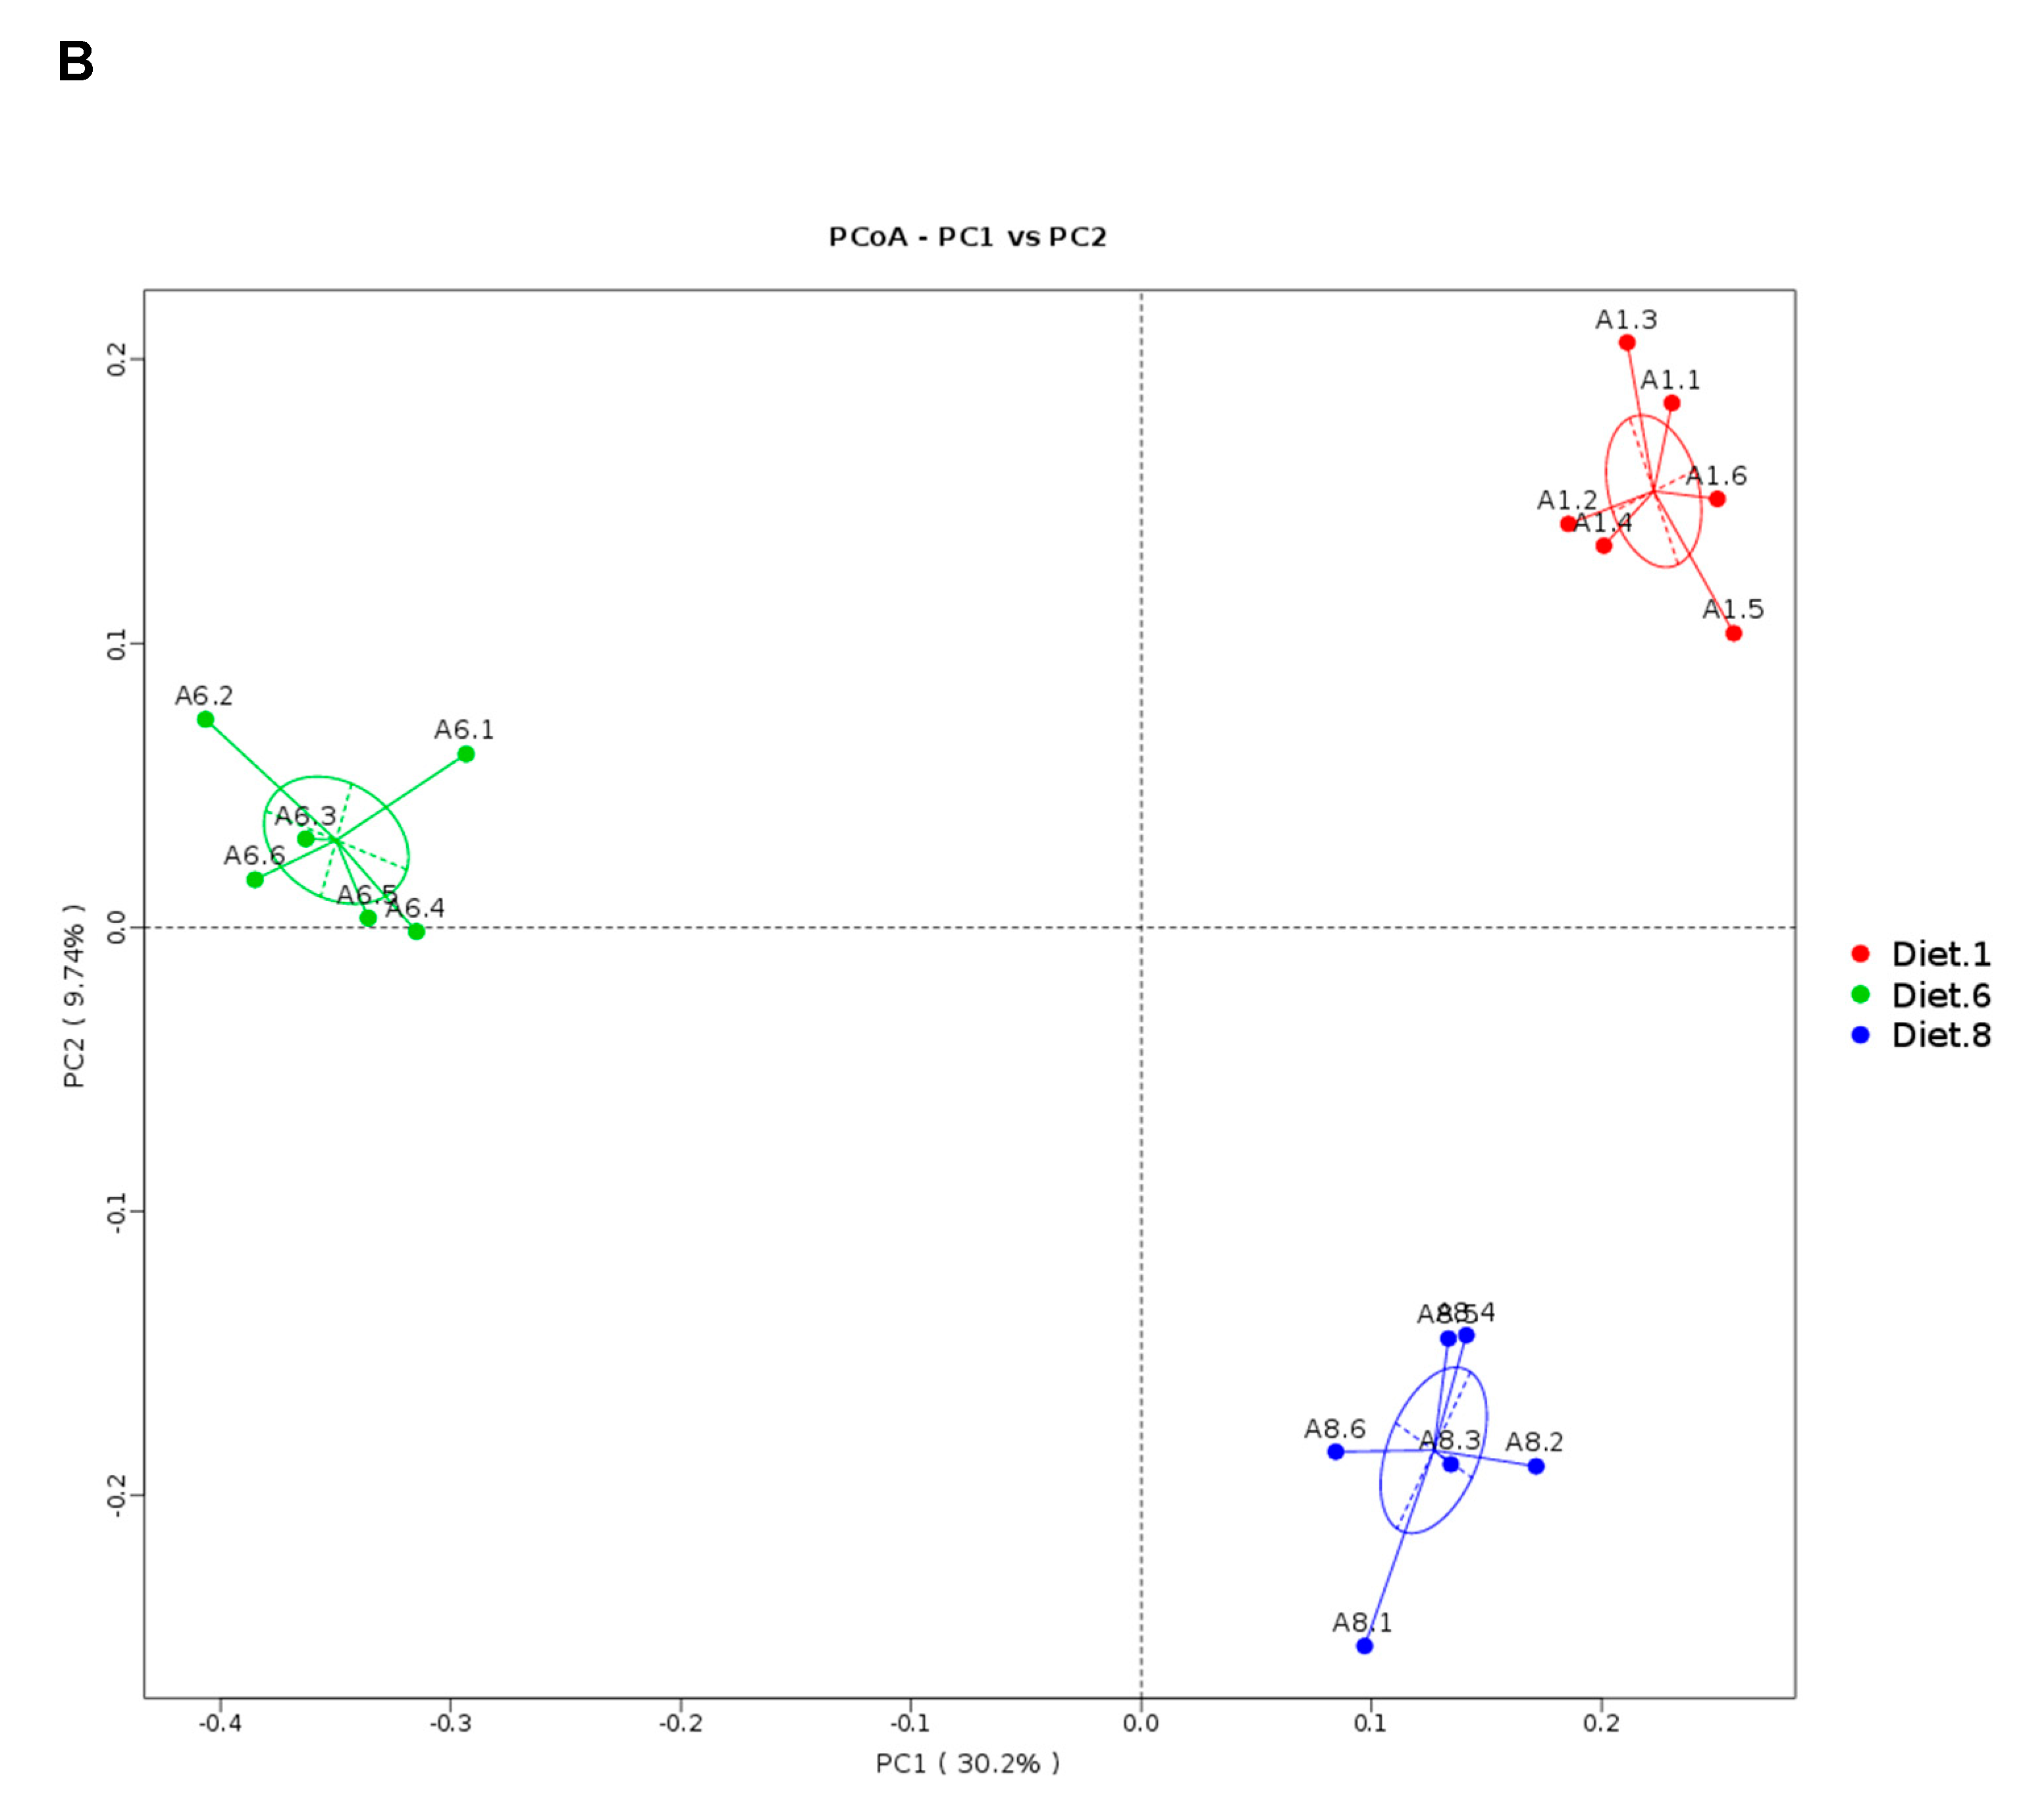
As a complex adsorbent, previous studies on YCWE focused on livestock and poultry. In the present study, YCWE also showed favorable mitigation efficacy to the adverse effects caused by dietary AFB1 in turbot. In addition, Diet 8 and Diet 9 lessened the immune function loss and liver damage induced by Diet 6. Apart from this, Diet 8 and Diet 9 resulted in lower AFB1 residues in serum and muscle. These results indicate the positive adsorbing capacity of YCWE to AFB1. Therefore, dietary YCWE could decrease the health risk resulting from feed consumption with AFB1 contamination. The results agree with previous studies in cows (10 g YCWE/cow per day) [58] and broilers (0.1% or 0.25% addition) [61,62,102,103]. Further, Diet 8 resulted in significantly higher alpha diversity and abundance of some potential beneficial bacteria compared to Diet 6; the abundance of potential pathogenic bacteria Salmonella, Aeromonas and Comamonas was lowered by Diet 8 compared to Diet 1. This derived a suggestion that YCWE might be beneficial to regulate intestinal microbiota communities.

4. Conclusions

The present study showed that 20 μg AFB1/kg diets did not affect the growth performance of turbot in a 67-day feeding trial. However, the AFB1 residues detected in serum and muscle of turbot suggested that the AFB1 intake at low level remains a potential health risk to human consumption of fish products. In addition, 500 μg AFB1/kg diet suppressed the immune response, induced liver damage (including reduced antioxidant capacity, decreased expression of antioxidant genes and increased expression of apoptosis genes in liver), increased AFB1 residues in serum and muscle, decreased the intestinal bacterial community diversity and reduced the abundance of some potential probiotics of turbot. However, the supplementation of 0.2% and 0.4% YCWE in 500 μg AFB1/kg diets resulted in liver function, immunity, AFB1 residues, intestinal microbiota communities and relative abundance of some potential probiotics more similar to that of the untreated control, which suggests that YCWE is an effective adsorbent to AFB1 in turbot feed.

5. Materials and Methods

5.1. AFB1 Preparation and YCWE Preparation

Reference Standard AFB1 was purchased from Pribolab (Qingdao, China) Technology Co., Ltd. The AFB1 was dissolved in absolute ethanol (AR, Sinopharm Chemical Reagent Co., Ltd., Shanghai, China) at 0.1 mg AFB1 per 1 mL ethanol.
Product of adsorbent (Mycosorb®) was provided by Beijing Alltech Biological Products (Beijing, China) Co., Ltd. YCWE was mixed with powder ingredients.

5.2. Experimental Diets

Based on previous studies establishing the negative effects of AFB1 on fish, 0 µg, 20 μg (Low contamination) or 500 μg (High contamination) of AFB1 per kg feed were included in the diets, resulting in the following nine isonitrogenous and isolipidic experimental diets: Diet 1 (control, basal diet): 0 µg AFB1/kg diet; Diets 2–5: 20 μg/kg AFB1 + 0%, 0.1%, 0.2%, or 0.4% YCWE; Diets 6–9: 500 μg/kg AFB1 + 0%, 0.1%, 0.2%, or 0.4% YCWE. The basal experimental diet was formulated as shown in Table 5. Fish meal, soybean meal and corn gluten meal were used as the main protein sources. Fish oil and soybean lecithin were used as lipid sources. Basal ingredients were purchased from Qingdao Great-seven Nutr-tech Co., Ltd (Qingdao, China). All the powder ingredients were thoroughly mixed, and then, the ethanol solution with AFB1 was re-dissolved in water and mixed with powder ingredients. After mixing all ingredients, the feed was pelleted with an approximate diameter of 3 mm and dried until constant weight at 55 °C in a ventilated oven. The practical content of AFB1 was detected by Beijing Alltech Biological Products (Beijing, China) Co., Ltd. The feeds were stored at −20 °C without light until the start of feeding. The chemical composition and AFB1 content in feeds were shown in Table 6.

5.3. Fish Husbandry and Sample Collection

Juvenile turbot (Scophthalmus maximus L.) was purchased from one commercial farm in Haiyang (Shandong, China). The feeding trial was carried out in Huanghai Aquaculture Co. Ltd. Prior to the start of the experiment, fish were acclimated to a commercial diet for two weeks with flowing water. Then the fish were fasted for 24 h and weighed (initial body weight of 12.43 ± 0.02 g). A total of 810 fish were randomly distributed to 27 cylindrical fiberglass tanks (200 L) in an indoor rearing system with flow-through seawater. In each tank 30 fish were cultured. The nine diets were randomly assigned to 27 tanks (three replications each group). Fish were fed to apparent satiation twice per day (08:00 and 18:00 h) for 67 days. The seawater of 2/3 volume was exchanged twice daily. To avoid the loss of AFB1, the experimental diets were stored in refrigerator (−20 °C), and a small portion of the feed was weighed to feed the fish every week. During the feeding trial, temperature was 12–14 °C; salinity was 30–33 ‰; pH was 7.5–8.0; dissolved oxygen was higher than 7 mg/L.
At the end of feeding trial, fish were fasted for 24 h, and then, all surviving fish were counted and weighed. After that, 2 fish of each tank were randomly selected and stored at −20 °C for whole-body analysis. Six fish of each tank were randomly selected to collect blood from caudal vein using 1 mL syringes. After clotting on ice, the serum was obtained by centrifugation with 3000 rpm for 10 min at 4 °C and stored at −80 °C for biochemical analysis. For enzyme activities and gene expressions analysis, 6 fish of each tank were randomly selected and dissected. The liver was obtained, transferred into 2 mL sterile tubes (Axygen, USA), frozen in liquid nitrogen and stored at −80 °C. For the analysis of intestinal microbiota, 2 fish of each tank were randomly selected. The exterior of fish was wiped with 70% ethanol, and the abdominal cavity was opened. After that, hind gut was obtained with sterile tools. The intestinal content was removed, the hind gut was transferred to 2 mL sterile tubes and immersed in liquid nitrogen immediately.

5.4. Growth Performance

Growth performance were calculated by using the following variables:
Weigh gain rate (WGR, %) = 100 × (finial body weight−initial body weight)/initial body weight
Specific growth rate (SGR, %/day) =100 × (Ln final body weight−Ln initial body weight)/days
Feed intake (FI, %/day) = 100 × total amount of feed consumptions/[(initial body weight + final body weight) ×2]/days
Feed efficiency (FE) = (final body weight−initial body weight)/total amount of feed consumptions
Survival rate (%) =100 × final number of fish/initial number of fish.

5.5. Feeds and Whole-Body Chemical Analysis

Chemical composition analysis of the feeds and the whole-body were performed following standard protocols of AOAC [104]: dry matter was measured by drying samples to a constant weight at 105 °C; crude protein was determined by measuring nitrogen (N × 6.25) using Kjeldahl method; crude lipid was determined by mineral ether extraction using Soxhlet method; ash content was determined by incineration of samples at 550 °C in a muffle furnace.
The moisture was calculated with following equation:
Moisture (%) = 100 × (W1 − W2)/W1;
W1: Wet weight of matter; W2: Dry weight of matter.
The ash content was calculated with following equation:
Ash (%) = 100 × W3/W2;
W3: Ash weight; W2: Dry weight of matter.

5.6. Biochemical Analysis of Serum

Hematological parameters were determined by using automated biochemistry analyzer (Roche/Hitachi cobas c 311 analyzer, Tokyo, Japan). GLB was calculated by subtracting ALB values from TP. The content of IgM, C3 and C4 and activity of LZM were determined by using commercial Fish ELISA kits and following manufacturer instructions (IgM: 17025, C3: 17181, C4: 17200, LZM: 17094, Quantikine® ELISA kit, R and D Systems, Minnesota, MN, USA).

5.7. RNA Extract and Real-Time PCR

The total RNA of the liver was isolated using Trizol Reagent (9108; Takara Biotech, Dalian, China). Briefly, approximate 0.2 g liver tissue was homogenized in 1 mL RNAiso Plus using a tissue grinder. Then, chemicals were added in order following the reagent instruction. The RNA concentration and quality were assessed with NanoDrop ND-1000 Spectrophotometer (Thermo Scientific, Waltham, MA, USA). The integrity of extracted RNA was determined by electrophoresis on a 1.2% (w/v) agarose gel. After that, 1000 ng RNA was reverse transcribed to cDNA in 20 μL reactions using PrimeScript RT reagent Kit with gDNA Eraser (RR047A; Takara Biotech, Dalian, China). Then, real-time PCR was performed in a total 25 μL volume: 1 μL cDNA template (≤ 50 ng); 1 μL Forward primer (10 μM); 1 μL Reverse primer (10 μM); 9.5 μL DEPC-treated water (Sangon biotech, Shanghai, China); 12.5 μL TB Green™ Premix EX Taq II™ (RR820 A, Takara Biotech, Dalian, China). A two-step real-time PCR amplification program was used: 95 °C for 2 min and then 40 cycles of 95 °C for 10 s and 60 °C for 30 s. At last, melting curve analysis was used to ensure the specification of PCR product for each primer pair.
Specific primers for target genes and housekeeping genes, designed in NCBI, were synthesized by Sangon Biotech (Shanghai) Co., Ltd., and then the application efficiency was assessed (Table S3). All the real-time PCR analysis were performed using a quantitative thermal cycler (CFX96 Touch™ Real-Time PCR Detection System, Bio-Rad, Richmond, CA, USA). The genes expressions levels were normalized using relative quantitative method (2−ΔΔCT) referencing gene β-actin of turbot [105].

5.8. DNA Extract of Intestinal Microbiota and Sequencing Analysis

Genomic DNA sample was extracted from the intestinal mucosa layer using the QIAamp Fast DNA Stool Mini Kit (51604, Qiagen, Hilden, Germany) under sterile conditions (alcohol flame) following the manufacturer manual with some modifications [89,90]. PCR amplification of V4 region of 16S rRNA (515F/806R primer), quality and purity of PCR product were assessed by Beijing Novogene Genomics Technology Co. Ltd. (Beijing, China). Sequencing was conducted on an Illumina NovaSeq platform provided by Beijing Novogene Genomics Technology Co. Ltd. (Beijing, China).
For the sequence data analysis, Fast Length Adjustment of SHort reads (FLASH) was used to merge paired-end reads from the original DNA fragments when there were overlaps between reads1 and reads2 [106]. Sequencing reads were assigned to each sample with unique barcodes. Cutadapter was used to remove the adapter sequence, barcode sequence, primer sequence and to filter low-quality reads of raw reads [107]. The UCHIME algorithm was used to detect and remove chimeric sequences and obtain effective reads that would be used for further analysis [108]. After dereplication, abundance sort and discarding singletons reads, sequences with ≥97% similarity were clustered to the same OUTs (operational taxonomic units) using UPARSE [109]. Representative sequence for each OTU was screened for further annotation using Silva Database(v132) based on Ribosomal Database Project (RDP) classifier [110]. Alpha diversity indices (OTUs, Chao1, ACE, Shannon, Simpson and PD whole tree) were calculated with Quantitative Insights Into Microbial Ecology (QIIME) and displayed with R software (v 3.6.2) [111]. Beta diversity on unweighted UniFrac for Principal Coordinate Analysis (PCoA) and Unweighted Pair Group Method with Arithmetic mean (UPGMA) Clustering was calculated with QIIME and displayed with R software as well.

5.9. AFB1 Residues of Serum and Muscle

The AFB1 residues of serum and dorsal muscle of turbot were detected following the methods provided by Wang et al. [112]. This analysis was completed at the Institute of Quality Standard and Testing Technology for Agro-Products of CAAS (Beijing, China).

5.10. Statistical Analysis

Statistical software SPSS 22.0 for Windows (IBM SPSS corporation, Chicago, IL, USA) was used for the data analysis. Results were analyzed by one-way analysis of variance (ANOVA). Tukey’s multiple-range test was used for the multiple comparisons of group means. Differences were regarded as significant when p < 0.05. T-test was used for the comparisons of AFB1 residues in fish tissues of any two groups; “*” was marked when p < 0.05, and “**” was marked when p < 0.01.
Multi Response Permutation Procedure (MRPP) and Adonis test were employed to assess the difference of microbiota composition within or between groups using the vegan package in R software (v 3.6.2). MetaStat analysis [113] was conducted to identify the differential abundant taxa between groups.

5.11. Ethics Statement

The animal study was reviewed and approved by the Animal Care Committee of Ocean University of China (No. OUCFC2018001325, 24 August 2018).

Supplementary Materials

The following are available online at https://0-www-mdpi-com.brum.beds.ac.uk/2072-6651/12/9/597/s1. Figure S1: Rarefaction curves (A), Rank abundance (B) and Species accumulation boxplot (C) for all the intestinal microbiota samples. Figure S2: UPGMA clustering trees in samples (A,B) based on Unweighted Unifrac distances between Diet 1–5 or Diet 1, 6 and 8. Table S1: MRPP test and Adonis test of the Diet 1–5 groups’ microbial community structure of turbot. Table S2: MRPP test and Adonis test of the Diet 1, 6 and 8 groups’ microbial community structure of turbot. Table S3: Primer sequences, efficiency, amplicon size, annealing temperature and function for the genes profiled in real-time PCR.

Author Contributions

Conceptualization, Y.Z., K.M. and G.L.; methodology, Y.Z., J.Y. and T.W.; formal analysis, Y.Z., J.Y. and T.W.; investigation, J.Y. and T.W.; data curation, Y.Z. and J.Y; writing—original draft preparation, J.Y. and Y.Z.; writing—review and editing, Y.Z., J.Y., G.L., M.L., R.Z. and A.Y.; supervision, Y.Z. and K.M.; project administration, K.M. and Y.Z.; funding acquisition, K.M. and Y.Z. All authors have read and agreed to the published version of the manuscript.

Funding

This research was funded by the National Natural Science Foundation of China (No. 31872577), National Key R&D Program of China (No.2019YFD0900104) and China Agriculture Researches System (Grant No. CARS 47-G10).

Acknowledgments

The authors would like to thank Ruiguo Wang, Jihong Dai, Weihao Ou and Guijuan Yu for their support during this study.

Conflicts of Interest

The authors declare that they have no conflicts of interest.

Abbreviations

AFB1aflatoxin B1
AFBOAFB1-exo-8, 9-epoxide
ALBalbumin
ALPalkaline phosphatase
ALTalanine aminotransferase
ASTaspartate aminotransferase
C3complement component 3
C4complement component 4
CATcatalase
CYP1Acytochrome p450 1A
CYP3Acytochrome p450 3A
FEfeed efficiency
FIfeed intake
GLBglobulin
GPxglutathione peroxidase
GSTsglutathione-S-transferase
GST-ζ1glutathione-S-transferase zeta-1
IgMimmunoglobulin M
LZMlysozyme
p53tumor suppressor protein p53
SGRspecific growth rate
SODsuperoxide dismutase
T-CHOtotal cholesterol
TGtriglyceride
TPtotal protein
WGweight gain
WGRweight gain rate

References

  1. FAO. The State of World Fisheries and Aquaculture 2018-Meeting the Sustainable Development Goals; CC BY-NC-SA 3.0 IGO Licence; FAO: Rome, Italy, 2018. [Google Scholar]
  2. Daniel, D. A review on replacing fish meal in aqua feeds using plant protein sources. Int. J. Fish. Aquat. Stud. 2018, 6, 164–179. [Google Scholar]
  3. Oliva-Teles, A.; Enes, P.; Peres, H. 8-Replacing fishmeal and fish oil in industrial aquafeeds for carnivorous fish. In Woodhead Publishing Series in Food Science, Technology and Nutrition; Davis, D.A.B.T.-F., Ed.; Woodhead Publishing: Oxford, UK, 2015; pp. 203–233. ISBN 978-0-08-100506-4. [Google Scholar]
  4. Gasco, L.; Gai, F.; Maricchiolo, G.; Genovese, L.; Ragonese, S.; Bottari, T.; Caruso, G. Feeds for the Aquaculture Sector Current Situation and Alternative Sources; Springer: Berlin/Heidelberg, Germany, 2018; ISBN 9783319779409. [Google Scholar]
  5. Lei, Y.P.; Zhou, J.C.; Wang, L.T.; Zheng, W.G.; Zhao, L.H.; Ji, C. A survey report on the mycotoxin contamination of Chinese raw materials and feed in 2018. Feed Ind. 2020, 41, 60–64. [Google Scholar]
  6. Santos, G.A.; Rodrigues, I.; Starkl, V.; Naehrer, K.; Hofstetter, U. Mycotoxins in aquaculture: Occurrence in feeds components and impact on animal performance. Av. Nutr. Acuicola 2010, 35, 502–513. [Google Scholar]
  7. Varga, J.; Frisvad, J.C.; Samson, R.A. A reappraisal of fungi producing aflatoxins. World Mycotoxin J. 2009, 2, 263–277. [Google Scholar] [CrossRef]
  8. Matejova, I.; Svobodova, Z.; Vakula, J.; Mares, J.; Modra, H. Impact of Mycotoxins on Aquaculture Fish Species: A Review. J. World Aquac. Soc. 2017, 48, 186–200. [Google Scholar] [CrossRef]
  9. Fouad, A.M.; Ruan, D.; El Senousey, H.A.K.; Chen, W.; Jiang, S.; Zheng, C. Harmful effects and control strategies of aflatoxin B1 produced by aspergillus flavus and aspergillus parasiticus strains on poultry: Review. Toxins 2019, 11, 176. [Google Scholar] [CrossRef] [Green Version]
  10. Kemboi, D.C.; Antonissen, G.; Ochieng, P.E.; Croubels, S.; Okoth, S.; Kangethe, E.K.; Faas, J.; Lindahl, J.F.; Gathumbi, J.K. A Review of the Impact of Mycotoxins on Dairy Cattle Health: Challenges for Food Safety and Dairy Production in Sub-Saharan Africa. Toxins 2020, 12, 222. [Google Scholar] [CrossRef] [Green Version]
  11. Giovati, L.; Magliani, W.; Ciociola, T.; Santinoli, C.; Conti, S.; Polonelli, L. AFM1 in milk: Physical, biological, and prophylactic methods to mitigate contamination. Toxins 2015, 7, 4330–4349. [Google Scholar] [CrossRef]
  12. Van Heugten, E.; Spears, J.W.; Coffey, M.T.; Kegley, E.B.; Qureshi, M.A. The effect of methionine and aflatoxin on immune function in weanling pigs. J. Anim. Sci. 1994, 72, 658–664. [Google Scholar] [CrossRef]
  13. Kanora, A.; Maes, D. The role of mycotoxins in pig reproduction: A review. Vet. Med. 2009, 54, 565–576. [Google Scholar] [CrossRef] [Green Version]
  14. Fu, J.C.; Chen, Q.; Du, J.; Shi, B.M.; An, S.S. Effectiveness of maifanite in reducing the detrimental effects of aflatoxin B1 on hematology, aflatoxin B1 residues, and antioxidant enzymes activities of weanling piglets. Livest. Sci. 2013, 157, 218–224. [Google Scholar] [CrossRef]
  15. Mughal, M.J.; Peng, X.; Kamboh, A.A.; Zhou, Y.; Fang, J. Aflatoxin B1 Induced Systemic Toxicity in Poultry and Rescue Effects of Selenium and Zinc. Biol. Trace Elem. Res. 2017, 178, 292–300. [Google Scholar] [CrossRef]
  16. El-Sayed, Y.S.; Khalil, R.H. Toxicity, biochemical effects and residue of aflatoxin B1 in marine water-reared sea bass (Dicentrarchus labrax L.). Food Chem. Toxicol. 2009, 47, 1606–1609. [Google Scholar] [CrossRef] [PubMed]
  17. Alinezhad, S.; Faridi, M.; Falahatkar, B.; Nabizadeh, R.; Davoodi, D. Effects of nanostructured zeolite and aflatoxin B1 in growth performance, immune parameters and pathological conditions of rainbow trout Oncorhynchus mykiss. Fish Shellfish. Immunol. 2017, 70, 648–655. [Google Scholar] [CrossRef] [PubMed]
  18. Bauer, D.H.; Lee, D.J.; Sinnhuber, R.O. Acute toxicity of aflatoxins B 1 and G 1 in the rainbow trout ( Salmo gairdneri). Toxicol. Appl. Pharmacol. 1969, 15, 415–419. [Google Scholar] [CrossRef]
  19. Halver, J.E. Aflatoxicosis and trout hepatoma. Bull.-Off. Int. Épizoot. 1968, 69, 1249–1278. [Google Scholar]
  20. Imani, A.; Salimi Bani, M.; Noori, F.; Farzaneh, M.; Moghanlou, K.S. The effect of bentonite and yeast cell wall along with cinnamon oil on aflatoxicosis in rainbow trout (Oncorhynchus mykiss): Digestive enzymes, growth indices, nutritional performance and proximate body composition. Aquaculture 2017, 476, 160–167. [Google Scholar] [CrossRef]
  21. Nomura, H.; Ogiso, M.; Yamashita, M.; Takaku, H.; Kimura, A.; Chikasou, M.; Nakamura, Y.; Fujii, S.; Watai, M.; Yamada, H. Uptake by dietary exposure and elimination of aflatoxins in muscle and liver of rainbow trout (Oncorhynchus mykiss). J. Agric. Food Chem. 2011, 59, 5150–5158. [Google Scholar] [CrossRef]
  22. Mohamadi Saei, M.; Taee, H.M.; Siahpoust, S.; Taheri, M. Effects of Toxin Binder Biotox on Growth Performance Survival, Enzymatic Activity, Hematologichal and Biochemical Parameters of Fingerlings Rainbow Trout (Oncorhynchus mykiss) Fed Diets-Contaminated with Aflatoxin. J. Aquac. Res. Dev. 2017, 10, 2155–9546. [Google Scholar] [CrossRef]
  23. Hussain, D.; Mateen, A.; Gatlin, D.M. Alleviation of aflatoxin B1 (AFB1) toxicity by calcium bentonite clay: Effects on growth performance, condition indices and bioaccumulation of AFB1 residues in Nile tilapia (Oreochromis niloticus). Aquaculture 2017, 475, 8–15. [Google Scholar] [CrossRef]
  24. Selim, K.M.; El-hofy, H.; Khalil, R.H. The efficacy of three mycotoxin adsorbents to alleviate aflatoxin B1-induced toxicity in Oreochromis niloticus. Aquac. Int. 2014, 22, 523–540. [Google Scholar] [CrossRef] [Green Version]
  25. Anh Tuan, N.; Grizzle, J.M.; Lovell, R.T.; Manning, B.B.; Rottinghaus, G.E. Growth and hepatic lesions of Nile tilapia (Oreochromis niloticus) fed diets containing aflatoxin B1. Aquaculture 2002, 212, 311–319. [Google Scholar] [CrossRef]
  26. Deng, S.X.; Tian, L.X.; Liu, F.J.; Jin, S.J.; Liang, G.Y.; Yang, H.J.; Du, Z.Y.; Liu, Y.J. Toxic effects and residue of aflatoxin B1 in tilapia (Oreochromis niloticus×O. aureus) during long-term dietary exposure. Aquaculture 2010, 307, 233–240. [Google Scholar] [CrossRef]
  27. Han, D.; Xie, S.; Zhu, X.; Yang, Y.; Guo, Z. Growth and hepatopancreas performances of gibel carp fed diets containing low levels of aflatoxin B1. Aquac. Nutr. 2009, 16, 335–342. [Google Scholar] [CrossRef]
  28. Huang, Y.; Han, D.; Xiao, X.; Zhu, X.; Yang, Y.; Jin, J.; Chen, Y.; Xie, S. Effect of dietary aflatoxin B1 on growth, fecundity and tissue accumulation in gibel carp during the stage of gonad development. Aquaculture 2014, 428–429, 236–242. [Google Scholar] [CrossRef]
  29. Huang, Y.; Han, D.; Zhu, X.; Yang, Y.; Jin, J.; Chen, Y.; Xie, S. Response and recovery of gibel carp from subchronic oral administration of aflatoxin B1. Aquaculture 2011, 319, 89–97. [Google Scholar] [CrossRef]
  30. Zeng, Z.Z.; Jiang, W.D.; Wu, P.; Liu, Y.; Zeng, Y.Y.; Jiang, J.; Kuang, S.Y.; Tang, L.; Zhou, X.Q.; Feng, L. Dietary aflatoxin B1 decreases growth performance and damages the structural integrity of immune organs in juvenile grass carp (Ctenopharyngodon idella). Aquaculture 2019, 500, 1–17. [Google Scholar] [CrossRef]
  31. Sahoo, P.K.; Mukherjee, S.C. Effect of dietary β-1,3 glucan on immune responses and disease resistance of healthy and aflatoxin B1-induced immunocompromised rohu (Labeo rohita Hamilton). Fish Shellfish Immunol. 2001, 11, 683–695. [Google Scholar] [CrossRef]
  32. Sahoo, P.K.; Mukherjee, S.C. Immunosuppressive effects of aflatoxin B1 in Indian major carp (Labeo rohita). Comp. Immunol. Microbiol. Infect. Dis. 2001, 24, 143–149. [Google Scholar] [CrossRef]
  33. Sahoo, P.; Mukherjee, S. Immunomodulation by dietary vitamin C in healthy and aflatoxin B1-induced immunocompromised rohu (Labeo rohita). Comp. Immunol. Microbiol. Infect. Dis. 2003, 26, 65–76. [Google Scholar] [CrossRef]
  34. Usanno, O.; Chaisilapasung, S.; Sukrakanchana, N.; Supamattaya, K. Effects of aflatoxin B1 on sex reversed red tilapia (Oreochromis niloticus Linn. x O. mossambicus Peters). Songklanakarin J. Sci. Technol. (SJST) 2005, 27, 187–197. [Google Scholar]
  35. Jantrarotai, W.; Lovell, R.T. Subchronic Toxicity of Dietary Aflatoxin B 1 to Channel Catfish. J. Aquat. Anim. Health 1990, 2, 248–254. [Google Scholar] [CrossRef]
  36. Nunes, E.M.C.G.; Pereira, M.M.G.; Costa, A.P.R.; Araripe, M.N.B.A.; Calvet, R.M.; Pereyra, C.M.; Azevedo, M.L.X.; Pinheiro, R.E.E.; Alves, V.C.; Conde Júnior, A.M.; et al. Effects of aflatoxin B1 on performance and health of tambaqui fingerlings (Colossoma macropomum). Int. Aquat. Res. 2019, 11, 73–83. [Google Scholar] [CrossRef] [Green Version]
  37. Sepahdari, A.; Ebrahimzadeh Mosavi, H.A.; Sharifpour, I.; Khosravi, A.; Motallebi, A.A.; Mohseni, M.; Kakoolaki, S.; Pourali, H.R.; Hallajian, A. Effects of different dietary levels of AFB1 on survival rate and growth factors of Beluga (Huso huso). Iran. J. Fish. Sci. 2010, 9, 141–150. [Google Scholar]
  38. Eti, A.S.; Rahim, M.; Hasan, M. Effects of aflatoxin B1 contaminated feed on Thai koi. Dhaka Univ. J. Biol. Sci. 2019, 28, 37–47. [Google Scholar] [CrossRef]
  39. International Agency for Research on Cancer. Some naturally occurring substances: Food items and constituents, heterocyclic aromatic amines and mycotoxins. IARC Monogr. Eval. Carcinog. Risks Hum. 1993, 56, 489–521. [Google Scholar]
  40. Kumar, P.; Mahato, D.K.; Kamle, M.; Mohanta, T.K.; Kang, S.G. Aflatoxins: A global concern for food safety, human health and their management. Front. Microbiol. 2017, 7, 1–10. [Google Scholar] [CrossRef] [Green Version]
  41. Su, Q. The Toxification and Detoxification Mechanisms of Aflatoxin B1 in Human: An Update. In Aflatoxin B1 Occurrence, Detection and Toxicological Effects; InTech Open: Rijeka, Croatia, 2019; pp. 1–17. [Google Scholar]
  42. Reddy, K.; Salleh, B.; Saad, B.; Abbas, H.; Abel, C.; Shier, W. An overview of mycotoxin contamination in foods and its implications for human health. Toxin Rev. 2010, 29, 3–26. [Google Scholar] [CrossRef]
  43. Boudergue, C.; Burel, C.; Dragacci, S.; Favrot, M.; Fremy, J.; Massimi, C.; Prigent, P.; Debongnie, P.; Pussemier, L.; Boudra, H.; et al. Review of mycotoxin-detoxifying agents used as feed additives: Mode of action, efficacy and feed/food safety. EFSA Supporting Publ. 2009, 6, 22E. [Google Scholar] [CrossRef]
  44. Kolosova, A.; Stroka, J. Substances for reduction of the contamination of feed by mycotoxins: A review. World Mycotoxin J. 2011, 4, 225–256. [Google Scholar] [CrossRef]
  45. Wielogorska, E.; MacDonald, S.; Elliott, C.T. A review of the efficacy of mycotoxin detoxifying agents used in feed in light of changing global environment and legislation. World Mycotoxin J. 2016, 9, 419–433. [Google Scholar] [CrossRef]
  46. Vila-Donat, P.; Marín, S.; Sanchis, V.; Ramos, A.J. A review of the mycotoxin adsorbing agents, with an emphasis on their multi-binding capacity, for animal feed decontamination. Food Chem. Toxicol. 2018, 114, 246–259. [Google Scholar] [CrossRef] [PubMed] [Green Version]
  47. Shan, Y. The Toxic Effects of Aflatoxin B1: An Update. In Aflatoxin B1 Occurrence, Detection and Toxicological Effects; IntechOpen: Rijeka, Croatia, 2020; p. 7. ISBN 978-1-83880-256-1. [Google Scholar]
  48. Di Gregorio, M.C.; Neeff, D.V.D.; Jager, A.V.; Corassin, C.H.; Carão, Á.C.D.P.; Albuquerque, R.D.; Azevedo, A.C.D.; Oliveira, C.A.F. Mineral adsorbents for prevention of mycotoxins in animal feeds. Toxin Rev. 2014, 33, 125–135. [Google Scholar] [CrossRef]
  49. Devegowda, G.; Raju, M.V.L.N.; Swamy, H.V.L.N. Mycotoxins: Novel solutions for their counteraction. Feedstuffs 1998, 70, 12–15. [Google Scholar]
  50. Surai, P.F.; Dvorska, J.E. Effects of mycotoxins on antioxidant status and immunity systems. In The Mycotoxin Blue Book; Diaz, D., Ed.; Nottingham University Press: Nottingham, UK, 2005; pp. 93–138. [Google Scholar]
  51. Chen, F.; Chu, J. Composite Mold Toxin Sorbent. Patent CN1843151, 16 March 2006. [Google Scholar]
  52. Luo, Y. Composite Type and Broad-Spectrum Mycotoxin Adsorbent and Preparation Method Thereof. Patent CN109939648A, 15 March 2019. [Google Scholar]
  53. Li, J.; Xu, Z.; Deng, B.; Song, H.; Wan, J.; Lin, H.; Zhao, Y.; Liao, Y. Composite Type Mycotoxin Adsorbent and Preparation Method Thereof. Patent CN103521181B, 10 October 2013. [Google Scholar]
  54. Casteel, S.W.; Pace, L.W.; Rottinghaus, G.E.; Evans, T.J.; Spring, P. Effects of diets containing mycotoxins with or without Mycosorb (R) on piglet performance. J. Anim. Sci. 2004, 82, 61. [Google Scholar]
  55. Dvorska, J.E.; Surai, P.F. Effects of T-2 Toxin, Zeolite and Mycosorb on Antioxidant Systems of Growing Quail. Asian Australas. J. Anim. Sci. 2001, 14, 1752–1757. [Google Scholar] [CrossRef]
  56. Girish, C.K.; Devegowda, G. Efficacy of Glucomannan-containing Yeast Product (Mycosorb®) and Hydrated Sodium Calcium Aluminosilicate in Preventing the Individual and Combined Toxicity of Aflatoxin and T-2 Toxin in Commercial Broilers. Asian Australas. J. Anim. Sci. 2006, 19, 877–883. [Google Scholar] [CrossRef]
  57. Janječić; Mužic, Z.; Gazić, S.P.J.; Vesna, K.G.K. Efficiency of MYCOSORB and SEL PLEX in duck fattening. Krmiva 2006, 48, 237. [Google Scholar]
  58. Moran, C.A.; Kettunen, H.; Yiannikouris, A.; Ojanperä, S.; Pennala, E.; Helander, I.M.; Apajalahti, J. A dairy cow model to assess aflatoxin transmission from feed into milk—Evaluating efficacy of the mycotoxin binder Mycosorb®. J. Appl. Anim. Nutr. 2013, 2, 1–7. [Google Scholar] [CrossRef]
  59. Pavičic’, P.; Nemanič, A. The influence of esterified glucomannan (Mycosorb®) on performance parameters of broiler chickens. Perad. Dani 2001, 55, 219–225. [Google Scholar]
  60. Kaki, S.; Moeini, M.; Cheraghi, J. Effects of Zeolite and Mycosorb on Serum Biochemical and Hematological Parameters of Broilers Chicken Aflatoxicosis. J. Blood Lymph 2012, 2, 2–5. [Google Scholar]
  61. Saki, A.; Rahmani, A.; Mahmoudi, H.; Tabatabaei, M.M.; Zamani, P.; Khosravi, A.R. The ameliorative effect of mycosorb in aflatoxin contaminated diet of broiler chickens. J. Liverstock Sci. Technol. 2018, 6, 39–47. [Google Scholar]
  62. Wade, M.R.; Sapcota, D.; Verma, U. Ameliorating aflatoxicosis in commercial broiler chickens by dietary Mycosorb: Heamato-Biochemical studies. Indian J. Anim. Res. 2017, 52, 46–50. [Google Scholar] [CrossRef] [Green Version]
  63. Yiannikouris, A.; Bertin, G.; Jouany, J. Reducing mycotoxin impact: The science behind Mycosorb®. In Nutritional Biotechnology in the Feed and Food Industries; Alltech UK: Stamford, UK, 2005; pp. 265–276. [Google Scholar]
  64. Regost, C.; Arzel, J.; Kaushik, S. Partial or total replacement of fish meal by corn gluten meal in diet for turbot (Psetta maxima). Aquaculture 1999, 180, 99–117. [Google Scholar] [CrossRef]
  65. Bonaldo, A.; Parma, L.; Mandrioli, L.; Sirri, R.; Fontanillas, R.; Badiani, A.; Gatta, P.P. Increasing dietary plant proteins affects growth performance and ammonia excretion but not digestibility and gut histology in turbot (Psetta maxima) juveniles. Aquaculture 2011, 318, 101–108. [Google Scholar] [CrossRef]
  66. Bonaldo, A.; Di Marco, P.; Petochi, T.; Marino, G.; Parma, L.; Fontanillas, R.; Koppe, W.; Mongile, F.; Finoia, M.G.; Gatta, P.P. Feeding turbot juveniles Psetta maxima L. with increasing dietary plant protein levels affects growth performance and fish welfare. Aquac. Nutr. 2015, 21, 401–413. [Google Scholar] [CrossRef]
  67. Zhang, B.; He, G.; Wang, X.; Pi, X.; Mai, K.; Zhou, H. Effects of replacing fish meal with soybean meal or fermented and phytase-treated soybean meal respectively, on growth performance, feed utilization, and apparent digestibility in juvenile turbot (Scophthalmus maximus L.). Isr. J. Aquac.-Bamidgeh 2016, 68, 8. [Google Scholar]
  68. Zhao, W.; Wang, L.; Liu, M.; Jiang, K.; Wang, M.; Yang, G.; Qi, C.; Wang, B. Transcriptome, antioxidant enzyme activity and histopathology analysis of hepatopancreas from the white shrimp Litopenaeus vannamei fed with aflatoxin B1(AFB1). Dev. Comp. Immunol. 2017, 74, 69–81. [Google Scholar] [CrossRef]
  69. Abdel Rahman, A.N.; Abdellatief, S.A.; Mahboub, H.H.H. Protection of Nile tilapia, Oreochromis niloticus from aflatoxin B1 toxicity by dietary supplementation with Fennel essential oil and Saccharomyces cerevisiae. Egypt. J. Aquat. Res. 2017, 43, 235–240. [Google Scholar] [CrossRef]
  70. Wang, Y.; Li, M.; Filer, K.; Xue, Y.; Ai, Q.; Mai, K. Evaluation of Schizochytrium meal in microdiets of Pacific white shrimp (Litopenaeus vannamei) larvae. Aquac. Res. 2017, 48, 2328–2336. [Google Scholar] [CrossRef]
  71. Cagauan, A.G.; Tayaban, R.H.; Somga, J.R.; Bartolome, R.M. Effect of aflatoxin-contaminated feeds in Nile tilapia (Oreochromis niloticus L.). Soc. Sci. 2004, 12, 172–178. [Google Scholar]
  72. Jha, A.K.; Pal, A.K.; Sahu, N.P.; Kumar, S.; Mukherjee, S.C. Haemato-immunological responses to dietary yeast RNA, ω-3 fatty acid and β-carot ene in Catla catla juveniles. Fish Shellfish Immunol. 2007, 23, 917–927. [Google Scholar] [CrossRef] [PubMed]
  73. Holland, M.C.H.; Lambris, J.D. The complement system in teleosts. Fish Shellfish Immunol. 2002, 12, 399–420. [Google Scholar] [CrossRef] [Green Version]
  74. Sahoo, P.K.; Mukherjee, S.C.; Jain, A.K.; Mukherjee, A. Light and ultrastructural changes in opisthonephros of rohu, Labeo rohita during acute and subchronic aflatoxin B1 toxicity. In Proceedings of the International Conference on Fisheries and Food Security Beyond the Year 2000, Chiang Mai, Thailand, 11–14 November 1998. [Google Scholar]
  75. Yu, Y.Y.; Niu, J.; Yin, P.; Mei, X.T.; Liu, Y.J.; Tian, L.X.; Xu, D.H. Detoxification and immunoprotection of Zn(II)-curcumin in juvenile Pacific white shrimp (Litopenaeus vannamei) feed with aflatoxin B1. Fish Shellfish Immunol. 2018, 80, 480–486. [Google Scholar] [CrossRef] [PubMed]
  76. Huff, W.E.; Kubena, L.F.; Harvey, R.B.; Corrier, D.E.; Mollenhauer, H.H. Progression of aflatoxicosis in broiler chickens. Poult. Sci. 1986, 65, 1891–1899. [Google Scholar] [CrossRef]
  77. He, J.; Zhang, K.Y.; Chen, D.W.; Ding, X.M.; Feng, G.D.; Ao, X. Effects of maize naturally contaminated with aflatoxin B1 on growth performance, blood profiles and hepatic histopathology in ducks. Livest. Sci. 2013, 152, 192–199. [Google Scholar] [CrossRef]
  78. Gallagher, E.P.; Eaton, D.L. In vitro biotransformation of aflatoxin B1 (AFB1) in channel catfish liver. Toxicol. Appl. Pharmacol. 1995, 132, 82–90. [Google Scholar] [CrossRef]
  79. Livingstone, D.R. The fate of organic xenobiotics in aquatic ecosystems: Quantitative and qualitative differences in biotransformation by invertebrates and fish. Comp. Biochem. Physiol. Part A Mol. Integr. Physiol. 1998, 120, 43–49. [Google Scholar] [CrossRef]
  80. Ueng, Y.-F.; Shimada, T.; Yamazaki, H.; Guengerich, F.P. Oxidation of Aflatoxin B1 by Bacterial Recombinant Human Cytochrome P450 Enzymes. Chem. Res. Toxicol. 1995, 8, 218–225. [Google Scholar] [CrossRef]
  81. Gallagher, E.P.; Kunze, K.L.; Stapleton, P.L.; Eaton, D.L. The Kinetics of Aflatoxin B1Oxidation by Human cDNA-Expressed and Human Liver Microsomal Cytochromes P450 1A2 and 3A4. Toxicol. Appl. Pharmacol. 1996, 141, 595–606. [Google Scholar] [CrossRef]
  82. Eaton, D.L.; Groopman, J.D. Biotransformation of aflatoxins. In The Toxicology of Aflatoxins: Human Health, Veterinary and Agricultural Significance; Eaton, D.L., Groopman, J.D., Eds.; Academic Press: San Diego, CA, USA; London, UK, 1994; pp. 45–47. [Google Scholar]
  83. Essigmann, J.M.; Croy, R.G.; Bennett, R.A.; Wogan, G.N. Metabolic Activation of Aflatoxin B 1: Patterns of DNA Adduct Formation, Removal, and Excretion in Relation to Carcinogenesis. Drug Metab. Rev. 1982, 13, 581–602. [Google Scholar] [CrossRef] [PubMed]
  84. Smela, M.E.; Hamm, M.L.; Henderson, P.T.; Harris, C.M.; Harris, T.M.; Essigmann, J.M. The aflatoxin B1 formamidopyrimidine adduct plays a major role in causing the types of mutations observed in human hepatocellular carcinoma. Proc. Natl. Acad. Sci. USA 2002, 99, 6655–6660. [Google Scholar] [CrossRef] [Green Version]
  85. Liu, X.-F. Correlation of p53 gene mutation and expression of P53 protein in cholangiocarcinoma. World J. Gastroenterol. 2006, 12, 4706. [Google Scholar] [CrossRef] [PubMed]
  86. Santacroce, M.P.; Conversano, M.C.; Casalino, E.; Lai, O.; Zizzadoro, C.; Centoducati, G.; Crescenzo, G. Aflatoxins in aquatic species: Metabolism, toxicity and perspectives. Rev. Fish Biol. Fish. 2008, 18, 99–130. [Google Scholar] [CrossRef]
  87. Madhusudhanan, N.; Kavithalakshmi, S.N.; Shanmugasundaram, K.R.; Shanmugasundaram, E.R.B. Oxidative damage to lipids and proteins induced by aflatoxin B1 in fish (Labeo rohita)-Protective role of Amrita Bindu. Environ. Toxicol. Pharmacol. 2004, 17, 73–77. [Google Scholar] [CrossRef]
  88. Madhusudhanan, N.; Kavithalakshmi, S.N.; Shanmugasundaram, E.R.B.; Shanmugasundaram, K.R. Aflatoxin B1-Induced DNA Damage in Labeo rohita: Protective Effect of an Antioxidant Supplement, Amrita Bindu. Basic Clin. Pharmacol. Toxicol. 2006, 98, 473–479. [Google Scholar] [CrossRef]
  89. Yang, P.; Hu, H.; Liu, Y.; Li, Y.; Ai, Q.; Xu, W.; Zhang, W.; Zhang, Y.; Zhang, Y.; Mai, K. Dietary stachyose altered the intestinal microbiota profile and improved the intestinal mucosal barrier function of juvenile turbot, Scophthalmus maximus L. Aquaculture 2018, 486, 98–106. [Google Scholar] [CrossRef]
  90. Li, Y.; Yang, P.; Zhang, Y.; Ai, Q.; Xu, W.; Zhang, W.; Zhang, Y.; Hu, H.; Liu, J.; Mai, K. Effects of dietary glycinin on the growth performance, digestion, intestinal morphology and bacterial community of juvenile turbot, Scophthalmus maximus L. Aquaculture 2017, 479, 125–133. [Google Scholar] [CrossRef]
  91. Wang, J.; Tang, L.; Glenn, T.C.; Wang, J.-S. Aflatoxin B 1 Induced Compositional Changes in Gut Microbial Communities of Male F344 Rats. Toxicol. Sci. 2016, 150, 54–63. [Google Scholar] [CrossRef] [Green Version]
  92. Wang, Y.; Wang, B.; Liu, M.; Jiang, K.; Wang, M.; Wang, L. Aflatoxin B1 (AFB1) induced dysregulation of intestinal microbiota and damage of antioxidant system in pacific white shrimp (Litopenaeus vannamei). Aquaculture 2018, 495, 940–947. [Google Scholar] [CrossRef]
  93. Brown, C.T.; Davis-Richardson, A.G.; Giongo, A.; Gano, K.A.; Crabb, D.B.; Mukherjee, N.; Casella, G.; Drew, J.C.; Ilonen, J.; Knip, M.; et al. Gut Microbiome Metagenomics Analysis Suggests a Functional Model for the Development of Autoimmunity for Type 1 Diabetes. PLoS ONE 2011, 6, e25792. [Google Scholar] [CrossRef] [PubMed] [Green Version]
  94. Aiko, V.; Edamana, P.; Mehta, A. Decomposition and detoxification of aflatoxin B1 by lactic acid. J. Sci. Food Agric. 2016, 96, 1959–1966. [Google Scholar] [CrossRef] [PubMed]
  95. Guan, S.; Ji, C.; Zhou, T.; Li, J.; Ma, Q.; Niu, T. Aflatoxin B(1) degradation by Stenotrophomonas maltophilia and other microbes selected using coumarin medium. Int. J. Mol. Sci. 2008, 9, 1489–1503. [Google Scholar] [CrossRef] [Green Version]
  96. Peltonen, K.; El-Nezami, H.; Haskard, C.; Ahokas, J.; Salminen, S. Aflatoxin B1 binding by dairy strains of lactic acid bacteria and bifidobacteria. J. Dairy Sci. 2001, 84, 2152–2156. [Google Scholar] [CrossRef]
  97. Hamidi, A.; Mirnejad, R.; Yahaghi, E.; Behnod, V.; Mirhosseini, A.; Amani, S.; Sattari, S.; Darian, E.K. The aflatoxin B1 isolating potential of two lactic acid bacteria. Asian Pac. J. Trop. Biomed. 2013, 3, 732–736. [Google Scholar] [CrossRef] [Green Version]
  98. Punzalan, C.; Qamar, A. Probiotics for the Treatment of Liver Disease. In The Microbiota in Gastrointestinal Pathophysiology; Floch, M.H., Ringel, Y., Allan Walker, W.B.T.-T.M., Eds.; Elsevier: Boston, MA, USA, 2017; pp. 373–381. ISBN 978-0-12-804024-9. [Google Scholar]
  99. Marchese, S.; Polo, A.; Ariano, A.; Velotto, S.; Costantini, S.; Severino, L. Aflatoxin B1 and M1: Biological Properties and Their Involvement in Cancer Development. Toxins 2018, 10, 214. [Google Scholar] [CrossRef] [Green Version]
  100. Food and Agirculture Organization (FAO). Worldwide Regulations for Mycotoxins in Food and Feed in 2003; Food and Nutrition Paper No. 81.; FAO: Rome, Italy, 2004; ISBN 92-5-105162-3. [Google Scholar]
  101. World Health Organization(WHO). Evaluation of Certain Food Additives and Contaminants. Forty-Ninth Report of the Joint FAO/WHO Expert Committee on Food Additives; WHO: Geneva, Switzerland, 1999; Volume 884. [Google Scholar]
  102. Azizpour, A.; Moghadam, N. Assessment of serum biochemical parameters and pathological changes in broilers with chronic aflatoxicosis fed glucomannan-containing yeast product (Mycosorb) and sodium bentonite. Bull. Vet. Inst. Pulawy 2015, 59, 205–211. [Google Scholar] [CrossRef] [Green Version]
  103. Mogadam, N.; Azizpour, A. Ameliorative effect of glucomannan-containing yeast product (Mycosorb) and sodium bentonite on performance and antibody titers against Newcastle disease in broilers during chronic aflatoxicosis. Afr. J. Biotechnol. 2011, 10, 17372–17378. [Google Scholar]
  104. AOAC. Official Methods of Analysis of AOAC International; Association of Official Analytical Chemists International: Arlington, VA, USA, 1995. [Google Scholar]
  105. Livak, K.J.; Schmittgen, T.D. Analysis of relative gene expression data using real-time quantitative PCR and the 2-ΔΔCT method. Methods 2001, 25, 402–408. [Google Scholar] [CrossRef]
  106. Magoč, T.; Salzberg, S.L. FLASH: Fast length adjustment of short reads to improve genome assemblies. Bioinformatics 2011, 27, 2957–2963. [Google Scholar] [CrossRef]
  107. Martin, M. Cutadapt removes adapter sequences from high-throughput sequencing reads. EMBnet J. 2011, 17, 10. [Google Scholar] [CrossRef]
  108. Edgar, R.C.; Haas, B.J.; Clemente, J.C.; Quince, C.; Knight, R. UCHIME improves sensitivity and speed of chimera detection. Bioinformatics 2011, 27, 2194–2200. [Google Scholar] [CrossRef] [Green Version]
  109. Edgar, R.C. UPARSE: Highly accurate OTU sequences from microbial amplicon reads. Nat. Methods 2013, 10, 996–998. [Google Scholar] [CrossRef]
  110. Wang, Q.; Garrity, G.M.; Tiedje, J.M.; Cole, J.R. Naïve Bayesian Classifier for Rapid Assignment of rRNA Sequences into the New Bacterial Taxonomy. Appl. Environ. Microbiol. 2007, 73, 5261–5267. [Google Scholar] [CrossRef] [Green Version]
  111. Caporaso, J.G.; Kuczynski, J.; Stombaugh, J.; Bittinger, K.; Bushman, F.D.; Costello, E.K.; Fierer, N.; Peña, A.G.; Goodrich, J.K.; Gordon, J.I.; et al. QIIME allows analysis of high-throughput community sequencing data. Nat. Methods 2010, 7, 335–336. [Google Scholar] [CrossRef] [Green Version]
  112. Wang, R.; Su, X.; Wang, P.; Zhang, W. Simultaneous Detection of 21 Kinds of Mycotoxins and Their Metabolites in Animal Plasma with Impurity Adsorption Purification Followed by Liquid Chromatography-Tandem Mass Spectrometry. Chin. J. Anal. Chem. 2017, 45, 231–237. [Google Scholar]
  113. White, J.R.; Nagarajan, N.; Pop, M. Statistical Methods for Detecting Differentially Abundant Features in Clinical Metagenomic Samples. PLoS Comput. Biol. 2009, 5, e1000352. [Google Scholar] [CrossRef]
Figure 1. The effects of AFB1 and YCWE in serum TP, ALB and GLB concentrations of turbot. (A) Total protein (TP); (B) albumin (ALB); (C) globulin (GLB). Values represented are means ± S.E. of 3 replicate tanks. a, b, c, d Value bars not sharing a same superscript letter are significantly different (p < 0.05).
Toxins 12 00597 g001
Figure 2. The effects of AFB1 and YCWE in serum ALP, AST and ALT activities of turbot. (A) Alkaline phosphatase (ALP); (B) aspartate aminotransferase (AST); (C) alanine aminotransferase (ALT). Values represented are means ± S.E. of 3 replicate tanks. a, b, c, d Value bars not sharing a same superscript letter are significantly different (p < 0.05).
Toxins 12 00597 g002
Figure 3. The effects of AFB1 and YCWE on antioxidant relative gene expressions in liver of turbot. (A) Catalase (CAT); (B) superoxide dismutase (SOD); (C) glutathione peroxidase (GPx). Values represented are means ± S.E. of 3 replicate tanks. a, b Value bars in a column not sharing a same superscript letter are significantly different (p < 0.05).
Toxins 12 00597 g003
Figure 4. The effects of AFB1 and YCWE on CYP1A, CYP3A, GST-ζ1 and p53 expressions in liver of turbot. (A) Cytochrome p450 1A (CYP1A); (B) cytochrome p450 3A (CYP3A); (C) glutathione-S-transferase-zeta 1 (GST-ζ1); (D) p53: tumor suppressor protein p53. Values represented are means ± S.E. of 3 replicate tanks. a, b, c Value bars not sharing a same superscript letter are significantly different (p < 0.05).
Toxins 12 00597 g004
Figure 5. Taxonomy classification of reads at phylum (A) and genus (B) levels. Only top 10 most abundant (based on relative abundance) bacterial phyla and genera were shown in the figures.
Toxins 12 00597 g005
Figure 6. Principal Coordinate Analysis (PCoA) plot (A,B) in samples based on Unweighted Unifrac distances between Diet 1–5 or Diet 1, 6 and 8.
Toxins 12 00597 g006aToxins 12 00597 g006b
Figure 7. The MetaStat analysis of intestinal microbiota communities of juvenile turbot. (AC) The significantly changed abundance at genus level in Diet 1, 6 and 8. (A) Genera belong to phylum Firmicutes. (B) Genera belong to phyla Proteobacteria, Acidobacteria, Actinobacteria. (C) Potential pathogenic genera belong to phyla Proteobacteria. u_ means unidentified. *: p < 0.05, **: p < 0.01.
Toxins 12 00597 g007
Figure 8. The effects of AFB1 and YCWE on AFB1 residues in serum and muscle turbot. (A) AFB1 residues in serum; (B) AFB1 residues in muscle. ND: Not Detected. Values represented are means ± S.E. of 3 replicate tanks. *: p < 0.05, **: p < 0.01.
Toxins 12 00597 g008
Table 1. Effects of aflatoxin B1 (AFB1) and yeast cell wall extract (YCWE) on growth performance and feed utilization in turbot *.
DietsAFB1 (μg/kg)YCWE (%)IBW 1 (g)FBW 1 (g)FI (%/day)WGR (%)SGR (%/day)FESurvival (%)
10012.46 ± 0.1038.37 ± 0.271.03 ± 0.04208.0 ± 4.1 ab1.68 ± 0.02 ab1.49 ± 0.06 c92.22 ± 1.11
220012.36 ± 0.0240.32 ± 2.641.15 ± 0.04226.1 ± 21.1 b1.76 ± 0.10 b1.37 ± 0.02 abc96.67 ± 1.93
3200.112.48 ± 0.0338.78 ± 0.451.17 ± 0.04210.7 ± 3.8 ab1.69 ± 0.02 ab1.31 ± 0.04 abc98.89 ± 1.11
4200.212.40 ± 0.0539.03 ± 2.171.12 ± 0.04214.5 ± 16.1 ab1.71 ± 0.08 b1.38 ± 0.01 abc93.33 ± 0.00
5200.412.41 ± 0.0639.04 ± 0.501.08 ± 0.02214.7 ± 2.6 ab1.71 ± 0.01 b1.43 ± 0.03 bc95.56 ± 1.11
6500012.45 ± 0.0434.34 ± 0.151.10 ± 0.01175.8 ± 1.9 ab1.51 ± 0.01 ab1.27 ± 0.01 ab95.55 ± 2.22
75000.112.48 ± 0.0632.79 ± 0.651.12 ± 0.01162.6 ± 4.7 a1.44 ± 0.03 a1.20 ± 0.02 a92.70 ± 2.03
85000.212.43 ± 0.0634.26 ± 1.651.14 ± 0.04175.6 ± 13.2 ab1.51 ± 0.07 ab1.22 ± 0.05 a97.78 ± 1.11
95000.412.38 ± 0.0634.08 ± 1.401.08 ± 0.03175.1 ± 9.9 ab1.51 ± 0.05 ab1.29 ± 0.06 ab95.55 ± 2.22
* Values represented are means ± S.E. of 3 replicate tanks. a, b, c Values in a column not sharing a same superscript letter are significantly different (p < 0.05). 1 IBW: initial body weight; FBW: final body weight.
Table 2. Effects of AFB1 and YCWE on carcass composition in turbot *.
DietsAFB1 (μg/kg)YCWE (%)Moisture (%)Crude Protein 1 (%)Crude Lipid 1 (%)Ash 1 (%)
10078.17 ± 0.2464.21 ± 0.2819.15 ± 0.31 c15.11 ± 0.06 a
220077.57 ± 0.2964.41 ± 1.1819.55 ± 0.21 c15.12 ± 0.31 a
3200.177.00 ± 1.4165.86 ± 0.8519.82 ± 0.01 c15.38 ± 0.17 a
4200.278.97 ± 0.3466.54 ± 0.7419.19 ± 0.10 c15.74 ± 0.04 ab
5200.479.22 ± 0.1467.15 ± 1.1519.18 ± 0.07 c15.73 ± 0.09 ab
6500079.46 ± 1.1066.69 ± 0.5516.53 ± 0.18 a16.47 ± 0.03 c
75000.179.59 ± 0.2366.32 ± 0.1116.99 ± 0.06 a16.53 ± 0.06 c
85000.278.56 ± 0.5165.11 ± 0.1918.18 ± 0.03 b16.28 ± 0.02 bc
95000.478.96 ± 0.3165.43 ± 0.2518.15 ± 0.12 b15.73 ± 0.06 ab
* Values represented are means ± S.E. of 3 replicate tanks. 1 Expressed as a percentage of dry matter. a, b, c Values in a column not sharing a same superscript letter are significantly different (p < 0.05).
Table 3. Effects of AFB1 and YCWE on hematological parameters in turbot *.
DietsAFB1 (μg/kg)YCWE (%)IgM (g/L)C3 (g/L)C4 (g/L)LZM (U/L)TG (mmol/L)T-CHO (mmol/L)
1003.26 ± 0.015.67 ± 0.15 b0.976 ± 0.028 b0.360 ± 0.01413.43 ± 0.38 bc4.04 ± 0.08 b
22003.20 ± 0.035.56 ± 0.09 b0.933 ± 0.021 b0.349 ± 0.00713.28 ± 0.26 bc4.27 ± 0.21 b
3200.13.21 ± 0.035.53 ± 0.08 b0.967 ± 0.035 b0.366 ± 0.00513.79 ± 0.12 c4.06 ± 0.03 b
4200.23.10 ± 0.075.38 ± 0.14 b0.912 ± 0.014 ab0.349 ± 0.01114.07 ± 0.50 c4.24 ± 0.24 b
5200.43.09 ± 0.025.48 ± 0.12 b0.945 ± 0.029 b0.354 ± 0.00613.82 ± 0.33 c3.85 ± 0.11 ab
650003.17 ± 0.044.47 ± 0.09 a0.809 ± 0.012 a0.347 ± 0.00510.77 ± 0.12 a3.25 ± 0.19 a
75000.13.22 ± 0.025.28 ± 0.06 b0.892 ± 0.016 ab0.365 ± 0.00710.57 ± 0.03 a3.22 ± 0.09 a
85000.23.19 ± 0.025.40 ± 0.06 b0.889 ± 0.015 ab0.353 ± 0.00512.00 ± 0.20 ab3.68 ± 0.06 ab
95000.43.24 ± 0.065.46 ± 0.13 b0.930 ± 0.006b0.363 ± 0.00712.00 ± 0.45 ab3.70 ± 0.28 ab
* IgM: immunoglobulin M; C3/C4: complement component C3/C4; LZM: lysozyme; TG: triglyceride; T-CHO: total cholesterol. Values represented are means ± S.E. of 3 replicate tanks. a, b, c Values in a column not sharing a same superscript letter are significantly different (p < 0.05).
Table 4. Richness and diversity indices of intestinal microbiota of experimental turbot *.
DietsAFB1 (μg/kg)YCWE (%)Richness EstimatesDiversity EstimatesPhylogenetic Diversity
OTUsChao1ACEShannonSimpsonPD whole tree
1003918 ± 137 c4014 ± 147 c4203 ± 164 c9.21 ± 0.15 b0.973 ± 0.005719.9 ± 24.9 d
22003219 ± 147 bc3306 ± 140 bc3467 ± 140 bc8.39 ± 0.49 ab0.983 ± 0.004451.7 ± 23.8 bc
3200.13749 ± 188 c3831 ± 199 c3991 ± 222 c9.52 ± 0.16 b0.987 ± 0.003464.0 ± 38.2 bc
4200.23439 ± 228 bc3551 ± 220 bc3738 ± 214 bc8.85 ± 0.42 ab0.972 ± 0.011428.0 ± 29.8 b
5200.43402 ± 199 bc3496 ± 201 bc3656 ± 204 bc8.80 ± 0.48 ab0.971 ± 0.012492.4 ± 41.1 bc
650001353 ± 161 a1411 ± 167 a1495 ± 176 a7.57 ± 0.35 a0.974 ± 0.010211.8 ± 15.3 a
75000.13601 ± 173 c3715 ± 169 c3919 ± 174 c8.87 ± 0.36 ab0.971 ± 0.008435.4 ± 26.1 b
85000.23499 ± 75 bc3569 ± 73 bc3714 ± 73 bc9.30 ± 0.17 b0.982 ± 0.005579.8 ± 15.7 c
95000.42759 ± 237 b2821 ± 236 b2938 ± 244 b9.21 ± 0.15 b0.985 ± 0.002396.4 ± 40.6 b
* Values represented are means ± S.E. of 3 replicate tanks. a, b, c, d Values in a column not sharing a same superscript letter are significantly different (p < 0.05).
Table 5. Diet formulation of basal diet (% dry matter).
IngredientsContent (%)
Fish meal39.20
Soybean meal15.68
Corn protein meal8.00
Glutens5.12
Beer yeast2.50
Wheat flour16.63
Taurine1.00
L-Methionine0.26
L-Threonine0.18
L-Histidine0.19
L-Lysine0.74
Fish oil8.00
Soya bean lecithin1.00
Vitamin and mineral premix 11.00
Choline chloride0.25
Ethoxyquin0.05
Calcium propionate0.10
Yttrium oxide0.10
1 Vitamin and mineral premix (kg−1): retinyl acetate 675,000 IU; vitamin D3 150,000 IU; DL-α-tocopherol acetate 6 g; vitamin K3 1.2 g; thiamin nitrate 0.9 g; riboflavin, 1.35 g; pyridoxine hydrochloride 1.05 g; vitamin B12 0.0075 g; D-calcium pantothenate 4.5 g; nicotinamide 6.75 g; folic acid 0.375 g; D-biotin, 0.015 g; L-ascorbyl-2-monophosphate-Na 15 g (based on L-ascorbic acid); inositol 10 g; Fe 20 g; Zn 9.6 g; Mn 5 g; Cu 0.6 g; Co 0.08 g; Se 0.04 g; I 0.08 g; moisture < 10%.
Table 6. Chemical composition and AFB1 concentrations of experimental diets.
ParametersDiets
123456789
Chemical Analysis (% dry matter)
Crude protein52.852.552.853.853.152.453.353.153.8
Crude lipid15.815.015.215.215.715.314.515.116.0
Ash9.629.669.579.619.659.499.519.559.69
AFB1 Analysis (μg/kg)
AFB1 (formulated value)020202020500500500500
AFB1 (analyzed value)ND 118191817525537513504
Adsorbents (%)
YCWE 2000.10.20.400.10.20.4
1 ND: Not Detected. 2 The content of wheat flour was partly replaced by the same addition of YCWE.

