Article

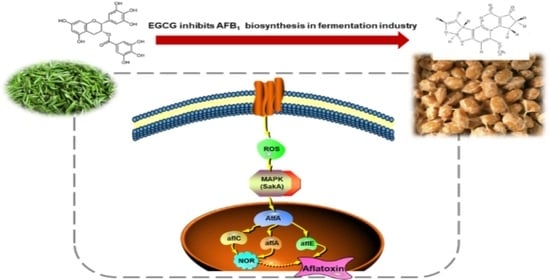
EGCG Alleviates Oxidative Stress and Inhibits Aflatoxin B1 Biosynthesis via MAPK Signaling Pathway

School of Food and Biological Engineering, Shaanxi University of Science and Technology, Xi’an 710021, China
*
Author to whom correspondence should be addressed.
These authors contributed equally to this work.
Submission received: 1 September 2021 / Revised: 26 September 2021 / Accepted: 27 September 2021 / Published: 30 September 2021
(This article belongs to the Collection Aflatoxins)

Abstract

:
Aflatoxin biosynthesis has established a connection with oxidative stress, suggesting a prevention strategy for aflatoxin contamination via reactive oxygen species (ROS) removal. Epigallocatechin gallate (EGCG) is one of the most active and the richest molecules in green tea with well-known antioxidant effects. Here, we found EGCG could inhibit aflatoxin B1 (AFB1) biosynthesis without affecting mycelial growth in Aspergillus flavus, and the arrest occurred before the synthesis of toxin intermediate metabolites. Further RNA-seq analysis indicated that multiple genes involved in AFB1 biosynthesis were down-regulated. In addition, EGCG exposure facilitated the significantly decreased expression of AtfA which is a bZIP (basic leucine zipper) transcription factor mediating oxidative stress. Notably, KEGG (Kyoto Encyclopedia of Genes and Genomes) analysis indicated that the MAPK signaling pathway target transcription factor was down-regulated by 1 mg/mL EGCG. Further Western blot analysis showed 1 mg/mL EGCG could decrease the levels of phosphorylated SakA in both the cytoplasm and nucleus. Taken together, these data evidently supported that EGCG inhibited AFB1 biosynthesis and alleviated oxidative stress via MAPK signaling pathway. Finally, we evaluated AFB1 contamination in soy sauce fermentation and found that EGCG could completely control AFB1 contamination at 8 mg/mL. Conclusively, our results supported the potential use of EGCG as a natural agent to prevent AFB1 contamination in fermentation industry.
Key Contribution: EGCG could alleviate oxidative stress and inhibit aflatoxin B1 bio-synthesis via MAPK signaling pathway. The results supported EGCG as a natural agent to prevent AFB1 contamination in the fermentation industry.

Graphical Abstract

1. Introduction

Aflatoxins (AFs), the most carcinogenic and toxic naturally occurring metabolites, are primarily produced by Aspergillus parasiticus and Aspergillus flavus [1,2,3]. They were widely distributed in food and feed crops, which caused huge losses in crop quality and posed a global threat to animal and human health through the food chains [4,5,6]. Among them, aflatoxin B1 (AFB1) is categorized as Group I carcinogen by IARC (International Agency for Research) and induced as many as 28% of liver cancer cases in the world [7,8,9]. Hence, it is extremely urgent to explore simple and effective methods to prevent the contamination of AFs in feed and food, especially during processing and storage [10].
Oxidative stress occurs when ROS (reactive oxygen species) accumulation surpasses the intracellular antioxidant ability [11,12]. It has been implicated as a prerequisite for AFs formation [13,14]. Studies have shown that compounds associated with oxidative stress also influence the production of AFs in A. flavus [15,16]. For example, the antioxidant, ethylene, could inhibit aflatoxin biosynthesis in A. flavus by reducing oxidative stress and regulating the state of glutathione redox [17]. Gallic Acid inhibited aflatoxin formation by reducing oxidative stress and modulating transcription factors FarB and CreA [18]. Piperine could suppress AFB1 synthesis by regulating oxidative stress response in A. flavus [19].
As the richest catechin extracted from green tea, epigallocatechin gallate (EGCG) is reported to contain the highest concentration of powerful antioxidants [20,21]. Previous studies have shown that tea extract could suppress aflatoxin production by reducing the expression of aflS and aflR [22]. Green tea polyphenols (GTPs) could modulate AFB1 metabolism [23,24]. However, it has not been clarified whether EGCG in GTPs is responsible for the AFs suppression. In the present study, the functions of EGCG on fungal growth and AFB1 biosynthesis were explored. Further, RNA-seq and Western blot were conducted to elucidate the anti-aflatoxigenic mechanism of EGCG. Our study provided an efficient and safe agent to prevent the AFB1 contamination during storage and processing.

2. Results

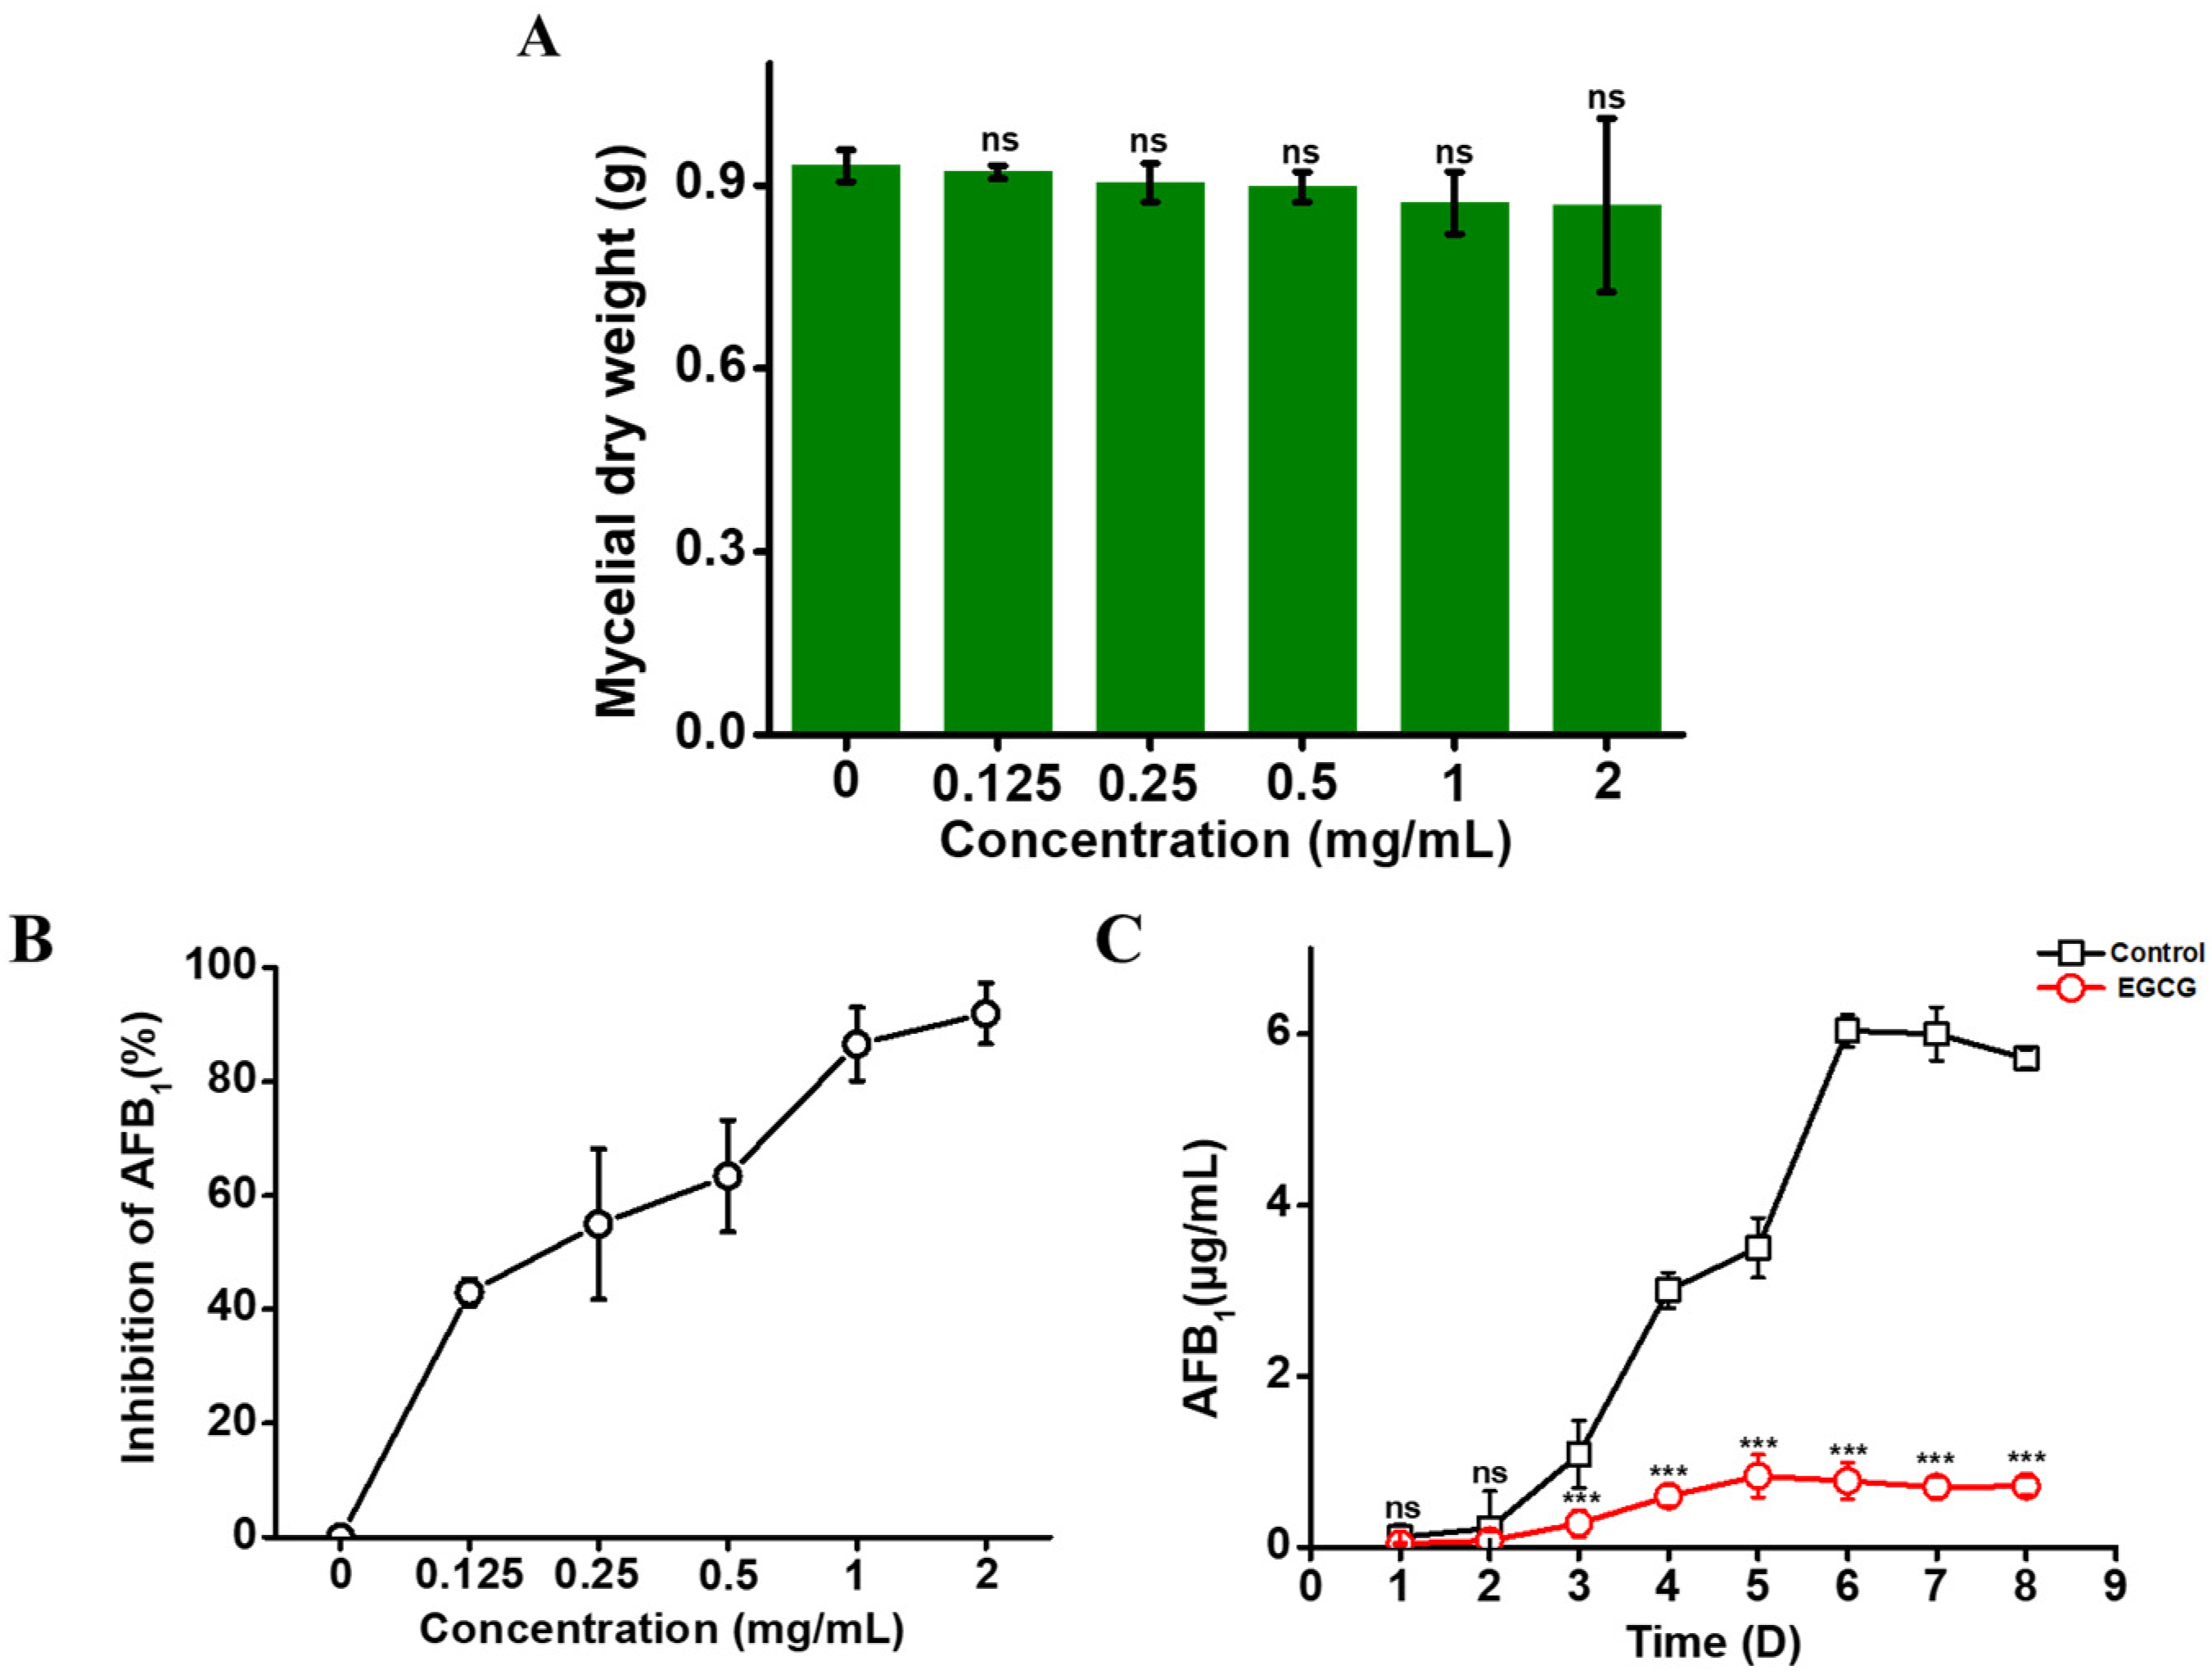
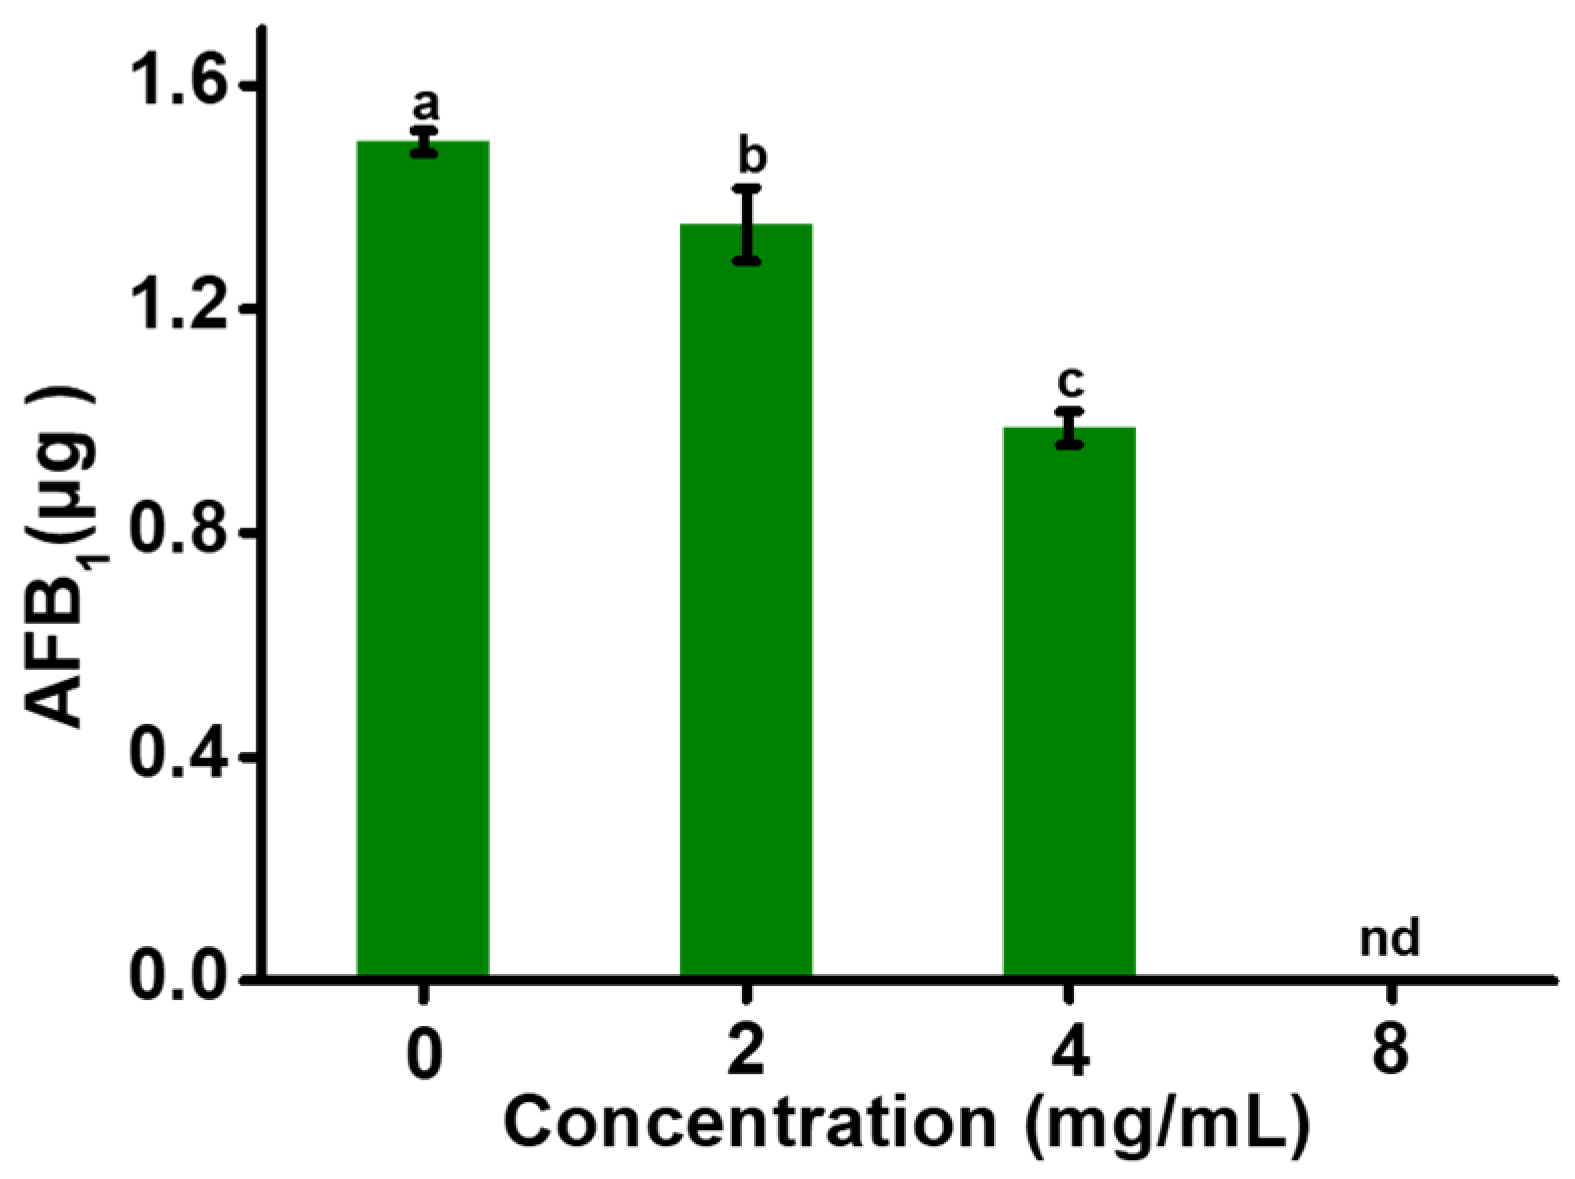
2.1. EGCG Inhibiting AFB1 Synthesis, but Not Mycelial Growth

In order to investigate the function of EGCG in A. flavus, different doses of EGCG were set to determine their influence on mycelial growth and AFB1 production. As shown in Figure 1A, there was almost no effect on mycelia growth under the treatment of 0–2 mg/mL EGCG. Nevertheless, EGCG showed significant anti-aflatoxigenic properties. The results indicated that EGCG arrested the biosynthesis of AFB1 in a dose-dependent manner (Figure 1B). On treatment with 2 mg/mL EGCG, the inhibitory percentage of AFB1 biosynthesis was 92%. After confirming that EGCG at concentrations of up to 1 mg/mL could inhibit AFB1 biosynthesis and had no effect on mycelial growth, the time dependent was studied between 1 mg/mL EGCG and AFB1 biosynthesis. The results showed the inhibitory effect of EGCG on AFB1 production was hardly affected at different time points and the inhibitory rate still lived up to 87.5% at 8 days (Figure 1C). These results revealed that EGCG could inhibited AFB1 biosynthesis without affecting mycelial growth.

2.2. EGCG Blocking ROS Accumulation

EGCG is an ideal natural antioxidant. It is well known that fungal oxidative stress is associated with the AFs production [14]. Considering the functions of ROS regulating AFB1 biosynthesis, we managed to detect the intracellular levels of ROS through fluorescence microscopy with a fluorescent probe of DCFH-DA. The results showed that the generation of ROS in A. flavus cells was obviously decreased under the treatment of 1 mg/mL EGCG and the inhibition rate up to 60.55% at 48 h (Figure 2A). Through microscope observation, the mycelial tip with 1 mg/mL EGCG showed an extremely weak green fluorescence before 60 h (Figure 2B). In summary, the results revealed that EGCG could effectively inhibit the accumulation of ROS and relieve oxidative stress.

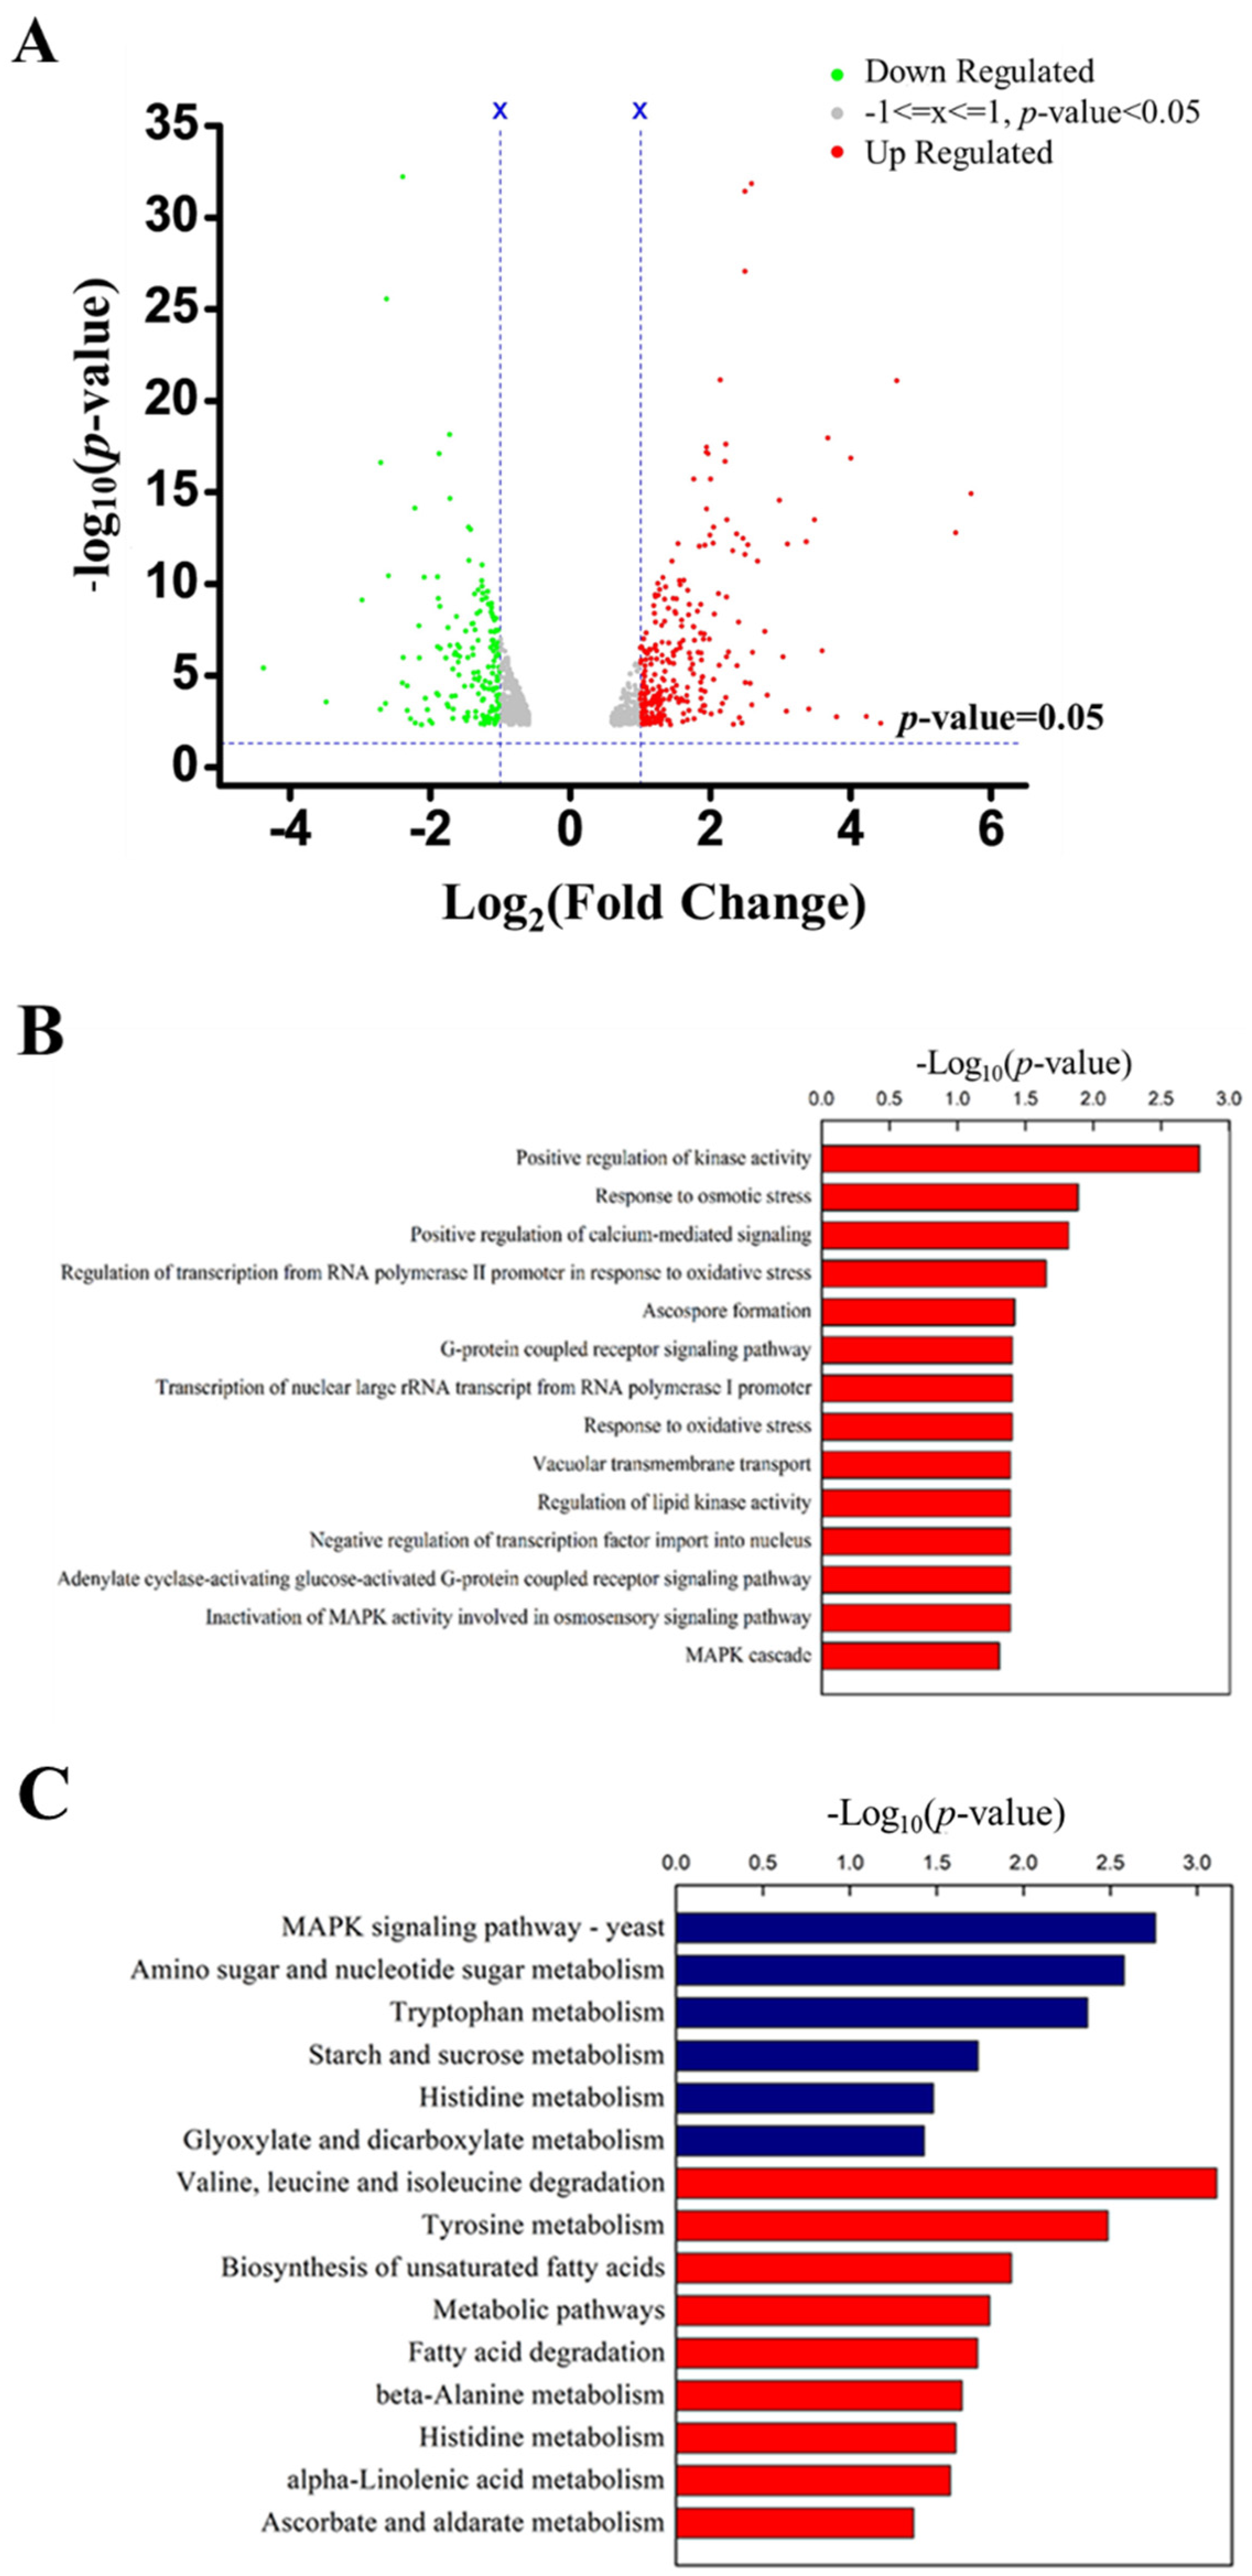
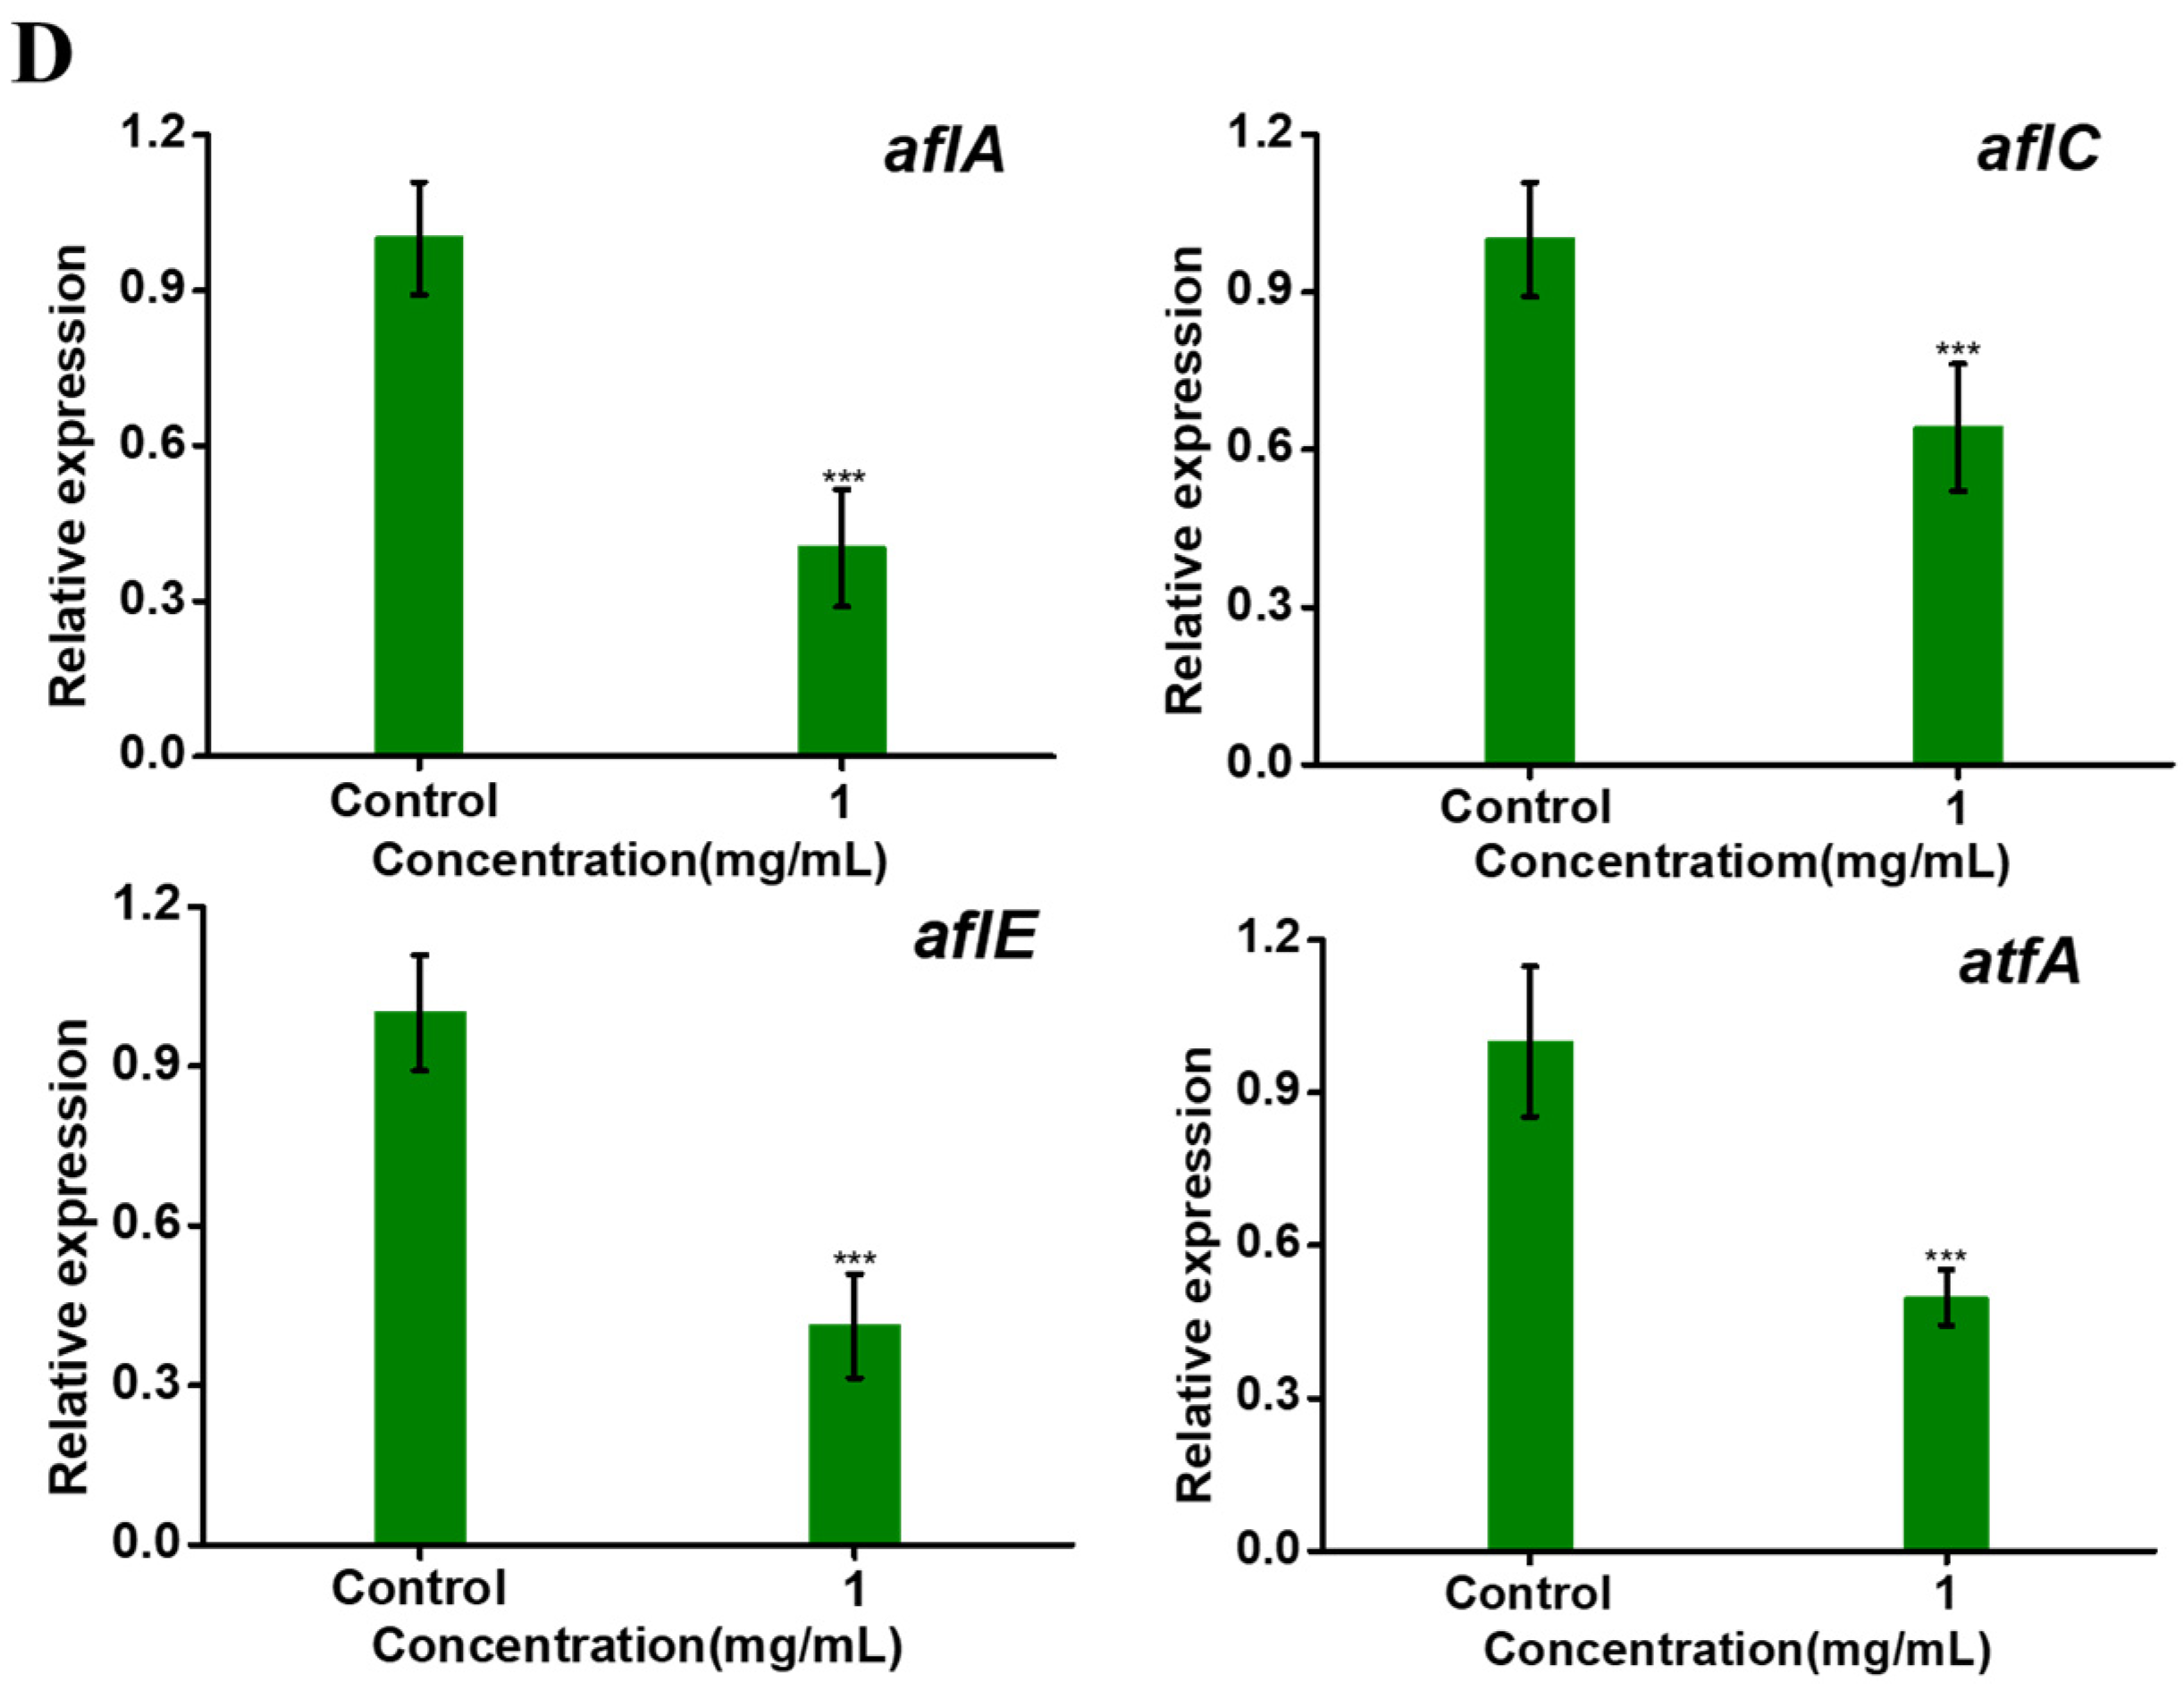
2.3. Transcriptome Analysis and qRT-PCR

To further understand the inhibitory roles of EGCG to AFB1 production, the RNA profile mycelia exposed to EGCG was sequenced and analyzed. In comparison to the control, a total of 927 differentially expressed genes (DEGs) were screened, including 496 markedly down-regulated genes and 431 significantly up-regulated genes (Figure 3A). Gene ontology (GO) analysis revealed a significant enrichment of DEGs in several functional categories. These down-regulated genes mainly involve the transcriptional regulation from RNA polymerase II promoter under oxidative stress, ascospore formation, signaling pathway via G-protein coupled receptor, inhibition of MAPK activity in osmosensory pathway, MAPK cascade, etc. (Figure 3B, Table 1). KEGG pathway enrichment analysis (Figure 3C, Table 2) revealed the synergistic relationship between these DEGs; the hypergeometric Fisher test was used to perform significant statistics on the pathways where DEGs were involved, revealing 15 enrichment pathways. Among these 15 pathways, down-regulated DEGs in the pathways of MAPK signaling pathway ranked first.
The transcription factors of basic leucine zipper (bZIP) respond to oxidative stress. Transcriptome analysis showed a great number of genes involved in bZIPs were down-regulated. Among them, AtfA was the most obvious one and qRT-PCR showed it was reduced by 51% after treatment with 1 mg/mL EGCG. It indicated that the inhibition of AFB1 synthesis by EGCG was related to the alleviation of oxidative stress.
To investigate the inhibitory mechanism of EGCG to AFB1 production, DEGs in the AFB1 biosynthesis cluster in A. flavus were identified based on transcriptomic data. It was indicated that five DEGs involving AFB1 biosynthesis were down-regulated. Furthermore, qRT-PCR was performed to validate these five DEGs, and the results displayed that the transcription of aflE, aflC and aflA was reduced by 60, 40 and 59% when A. flavus was treated with EGCG (Figure 3D, Table 3).

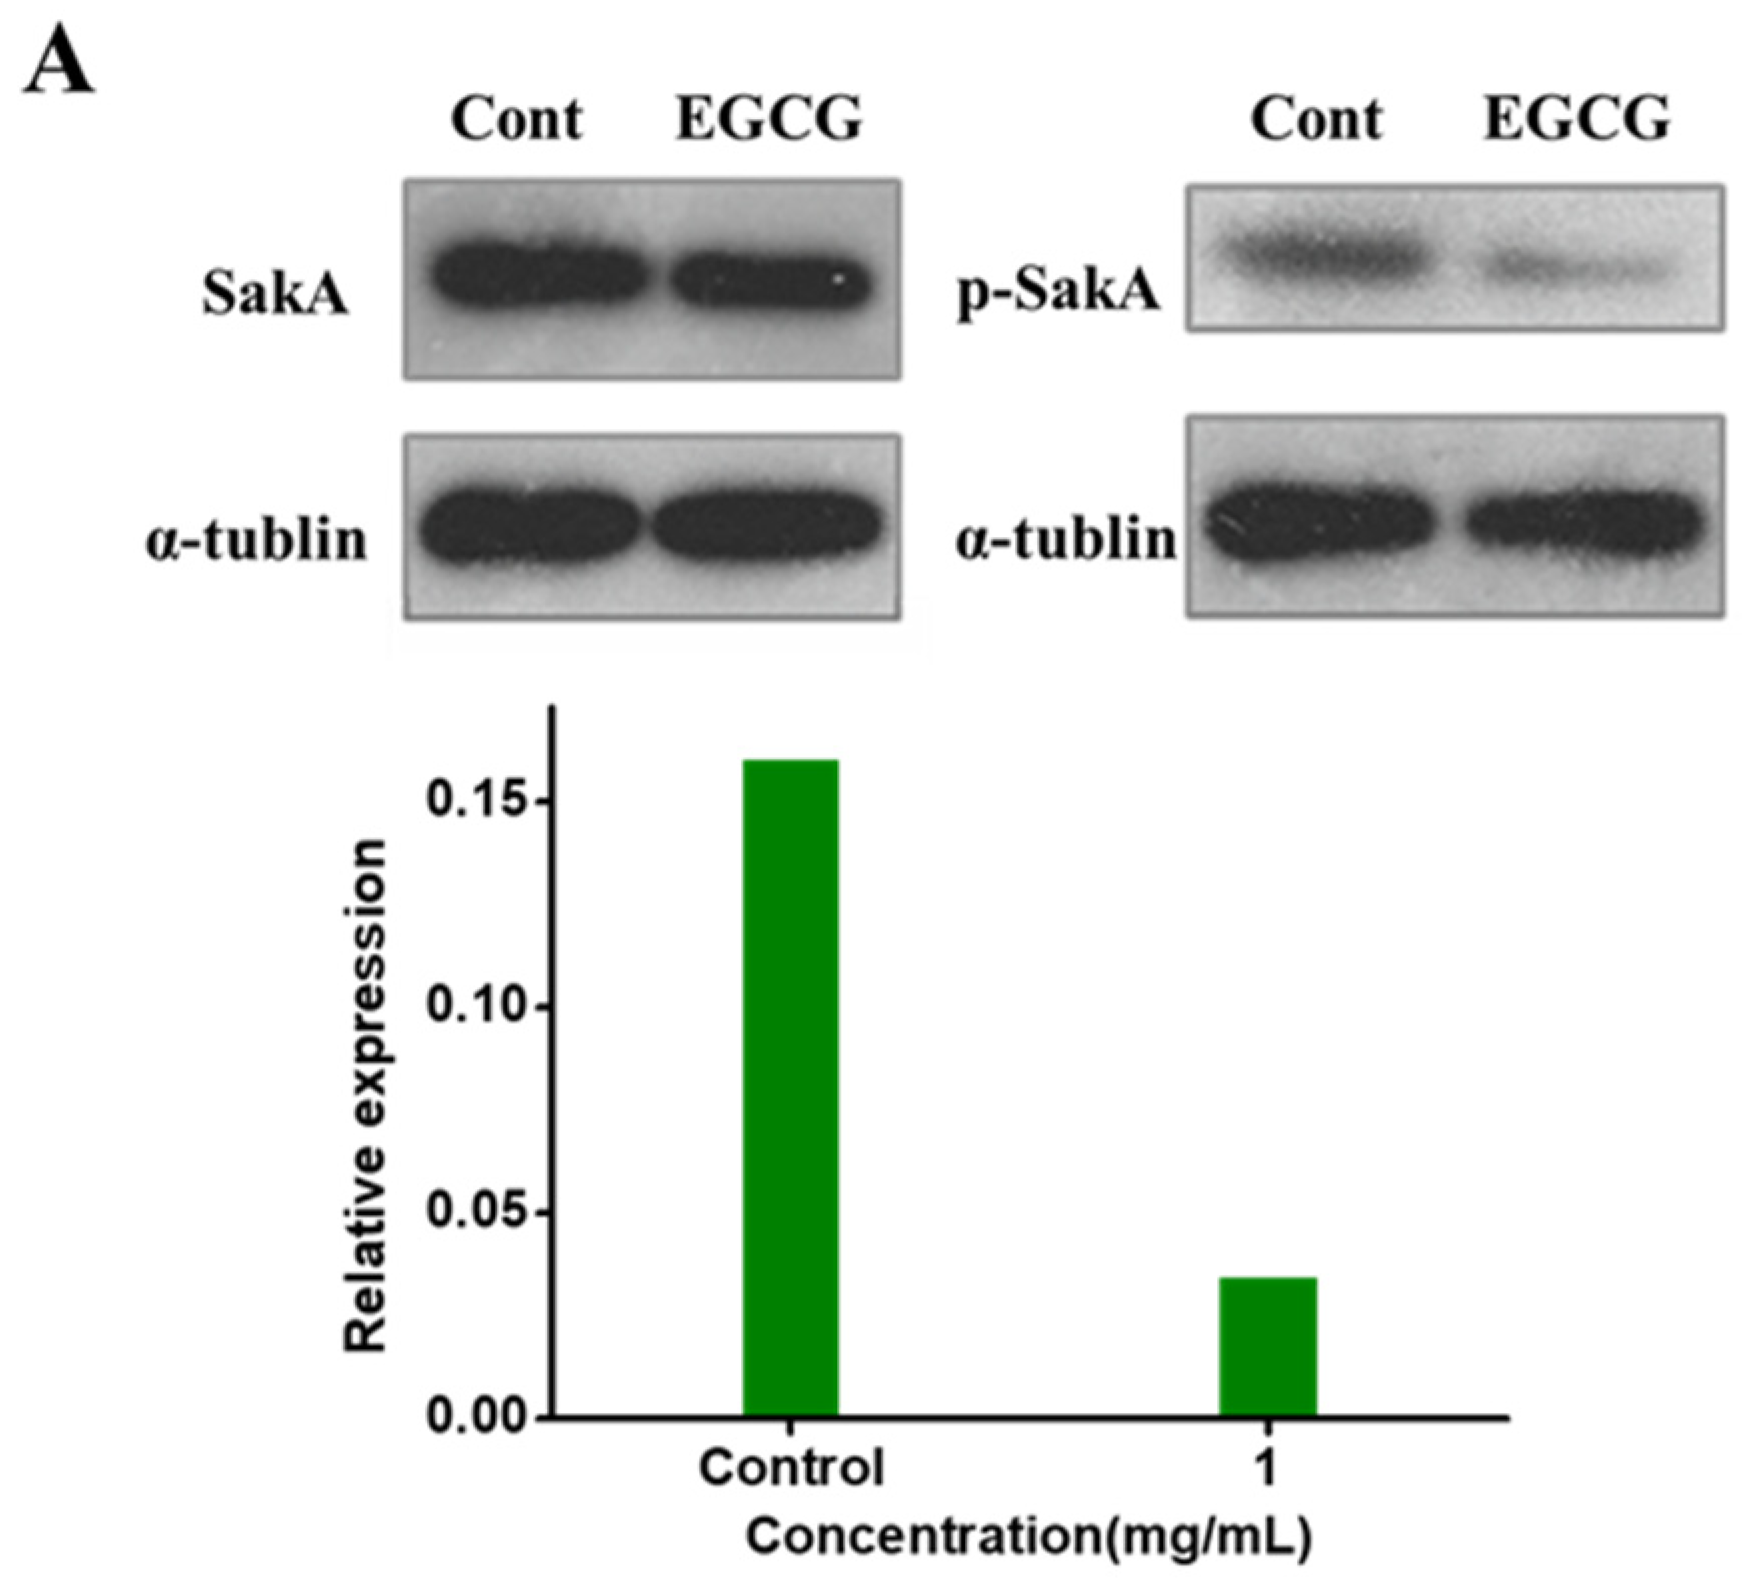
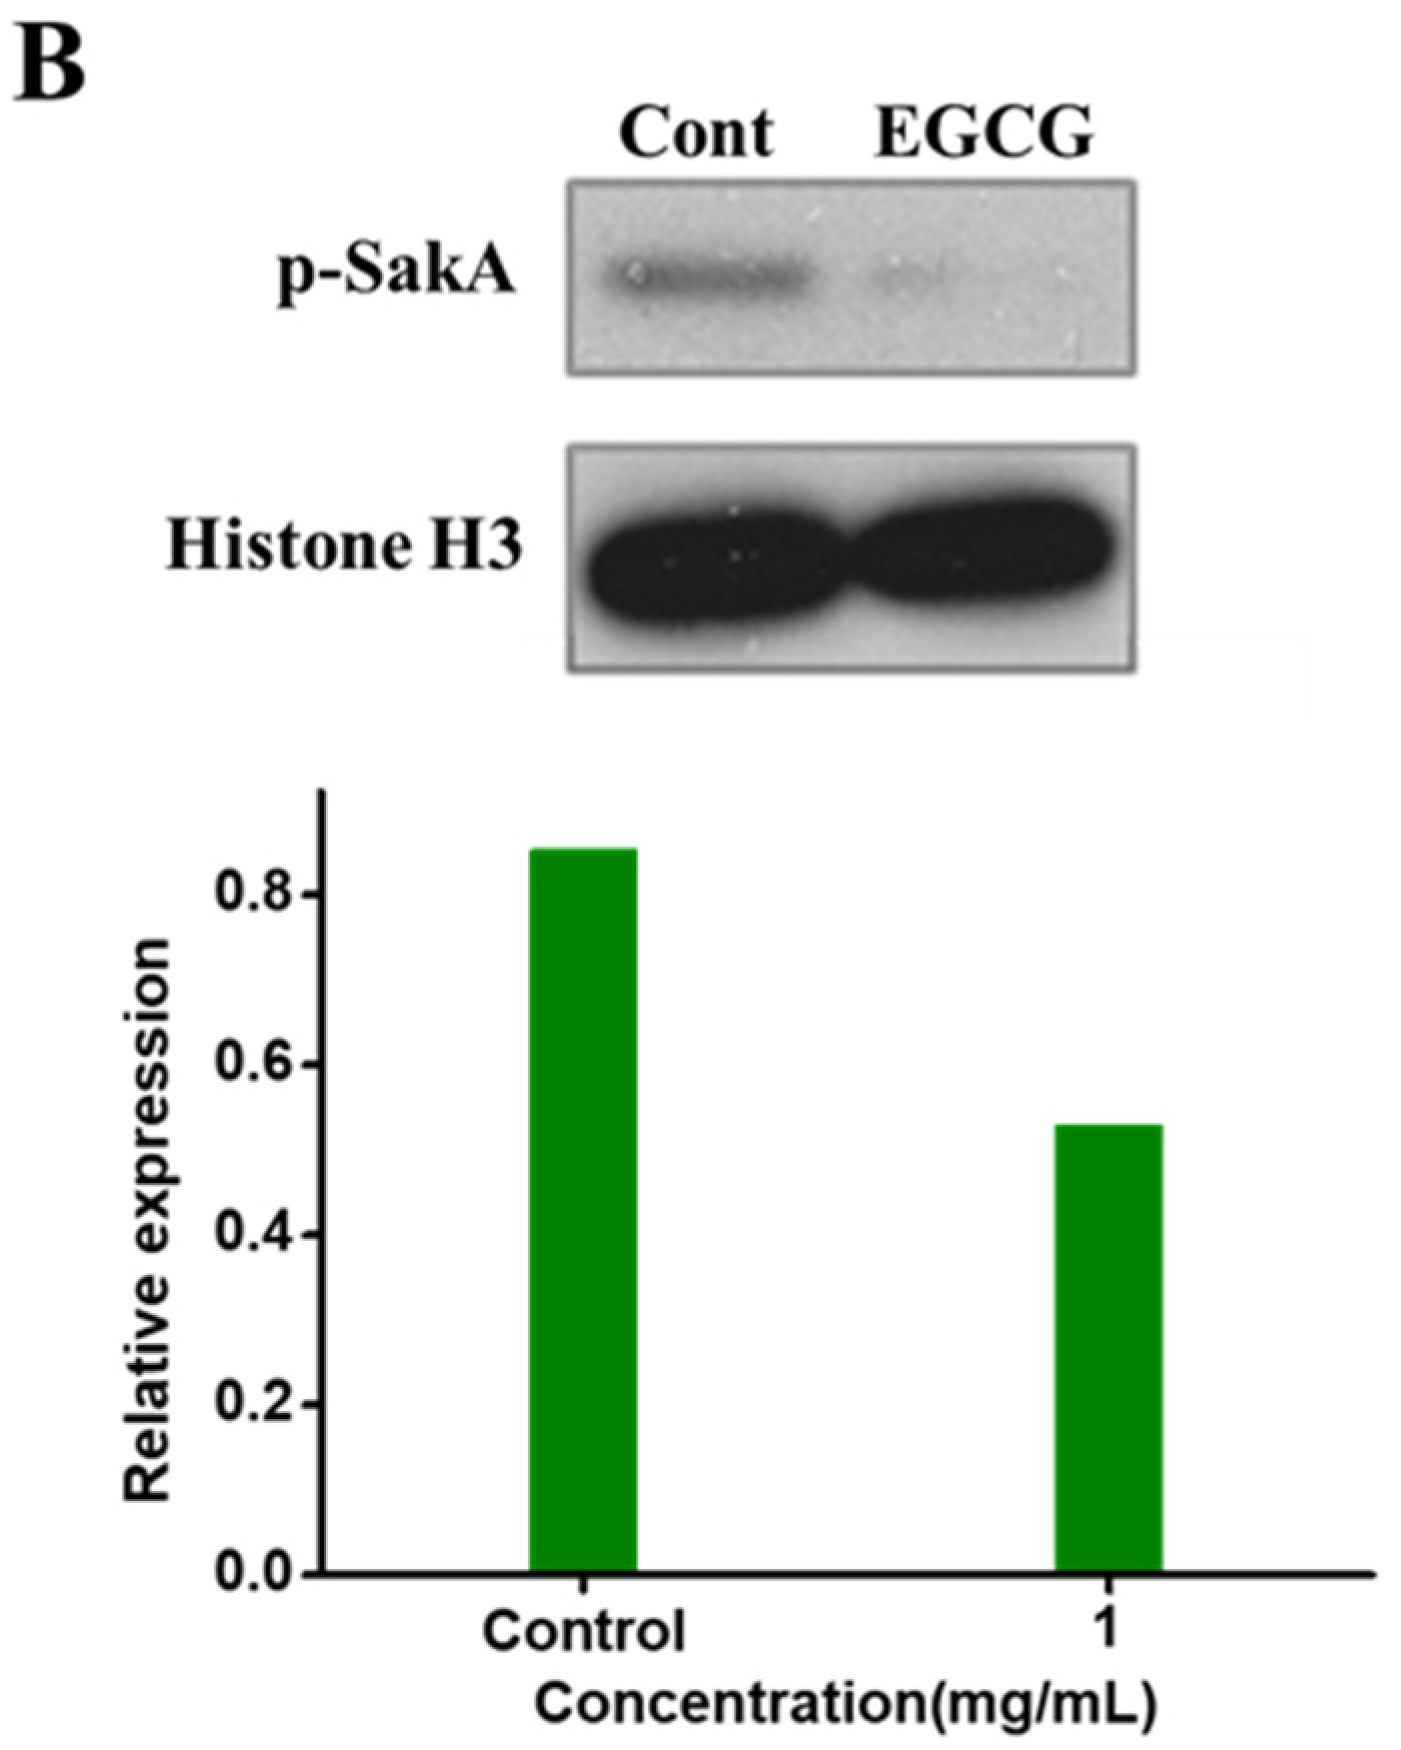
2.4. EGCG Arresting SakA Phosphorylation in MAPK Signaling Pathway

The signaling pathway via MAPK plays a vital role in fungal response to oxidative stress [25]. RNA-seq results suggested anti-oxidative stress system might be activated through the MAPK signaling pathway. To confirm our hypothesis whether the protective effects of EGCG against the reduction of oxidative stress is associated with the MAPK signaling pathway, we estimated the protein level of SakA by Western blot. It was indicated that EGCG did not affect the expression of SakA, but significantly decreased the levels of phosphorylated SakA in cytoplasm. The grayscale value of the protein bands analyzed by Image J showed that the inhibition rate of EGCG on SakA phosphorylation in cytoplasm was 38.92% (Figure 4A). AtfA mainly locates in the nucleus, whereas SakA translocates to the nucleus answering oxidative stress signals and reacts with AtfA [26]. Therefore, we examined the p-SakA in the nucleus (Figure 4B). EGCG (1 mg/mL) was identified to significantly reduce p-SakA with the inhibitory rate of 78.64% compared with the control. These results demonstrated that EGCG might alleviate oxidative stress through the MAPK pathway.

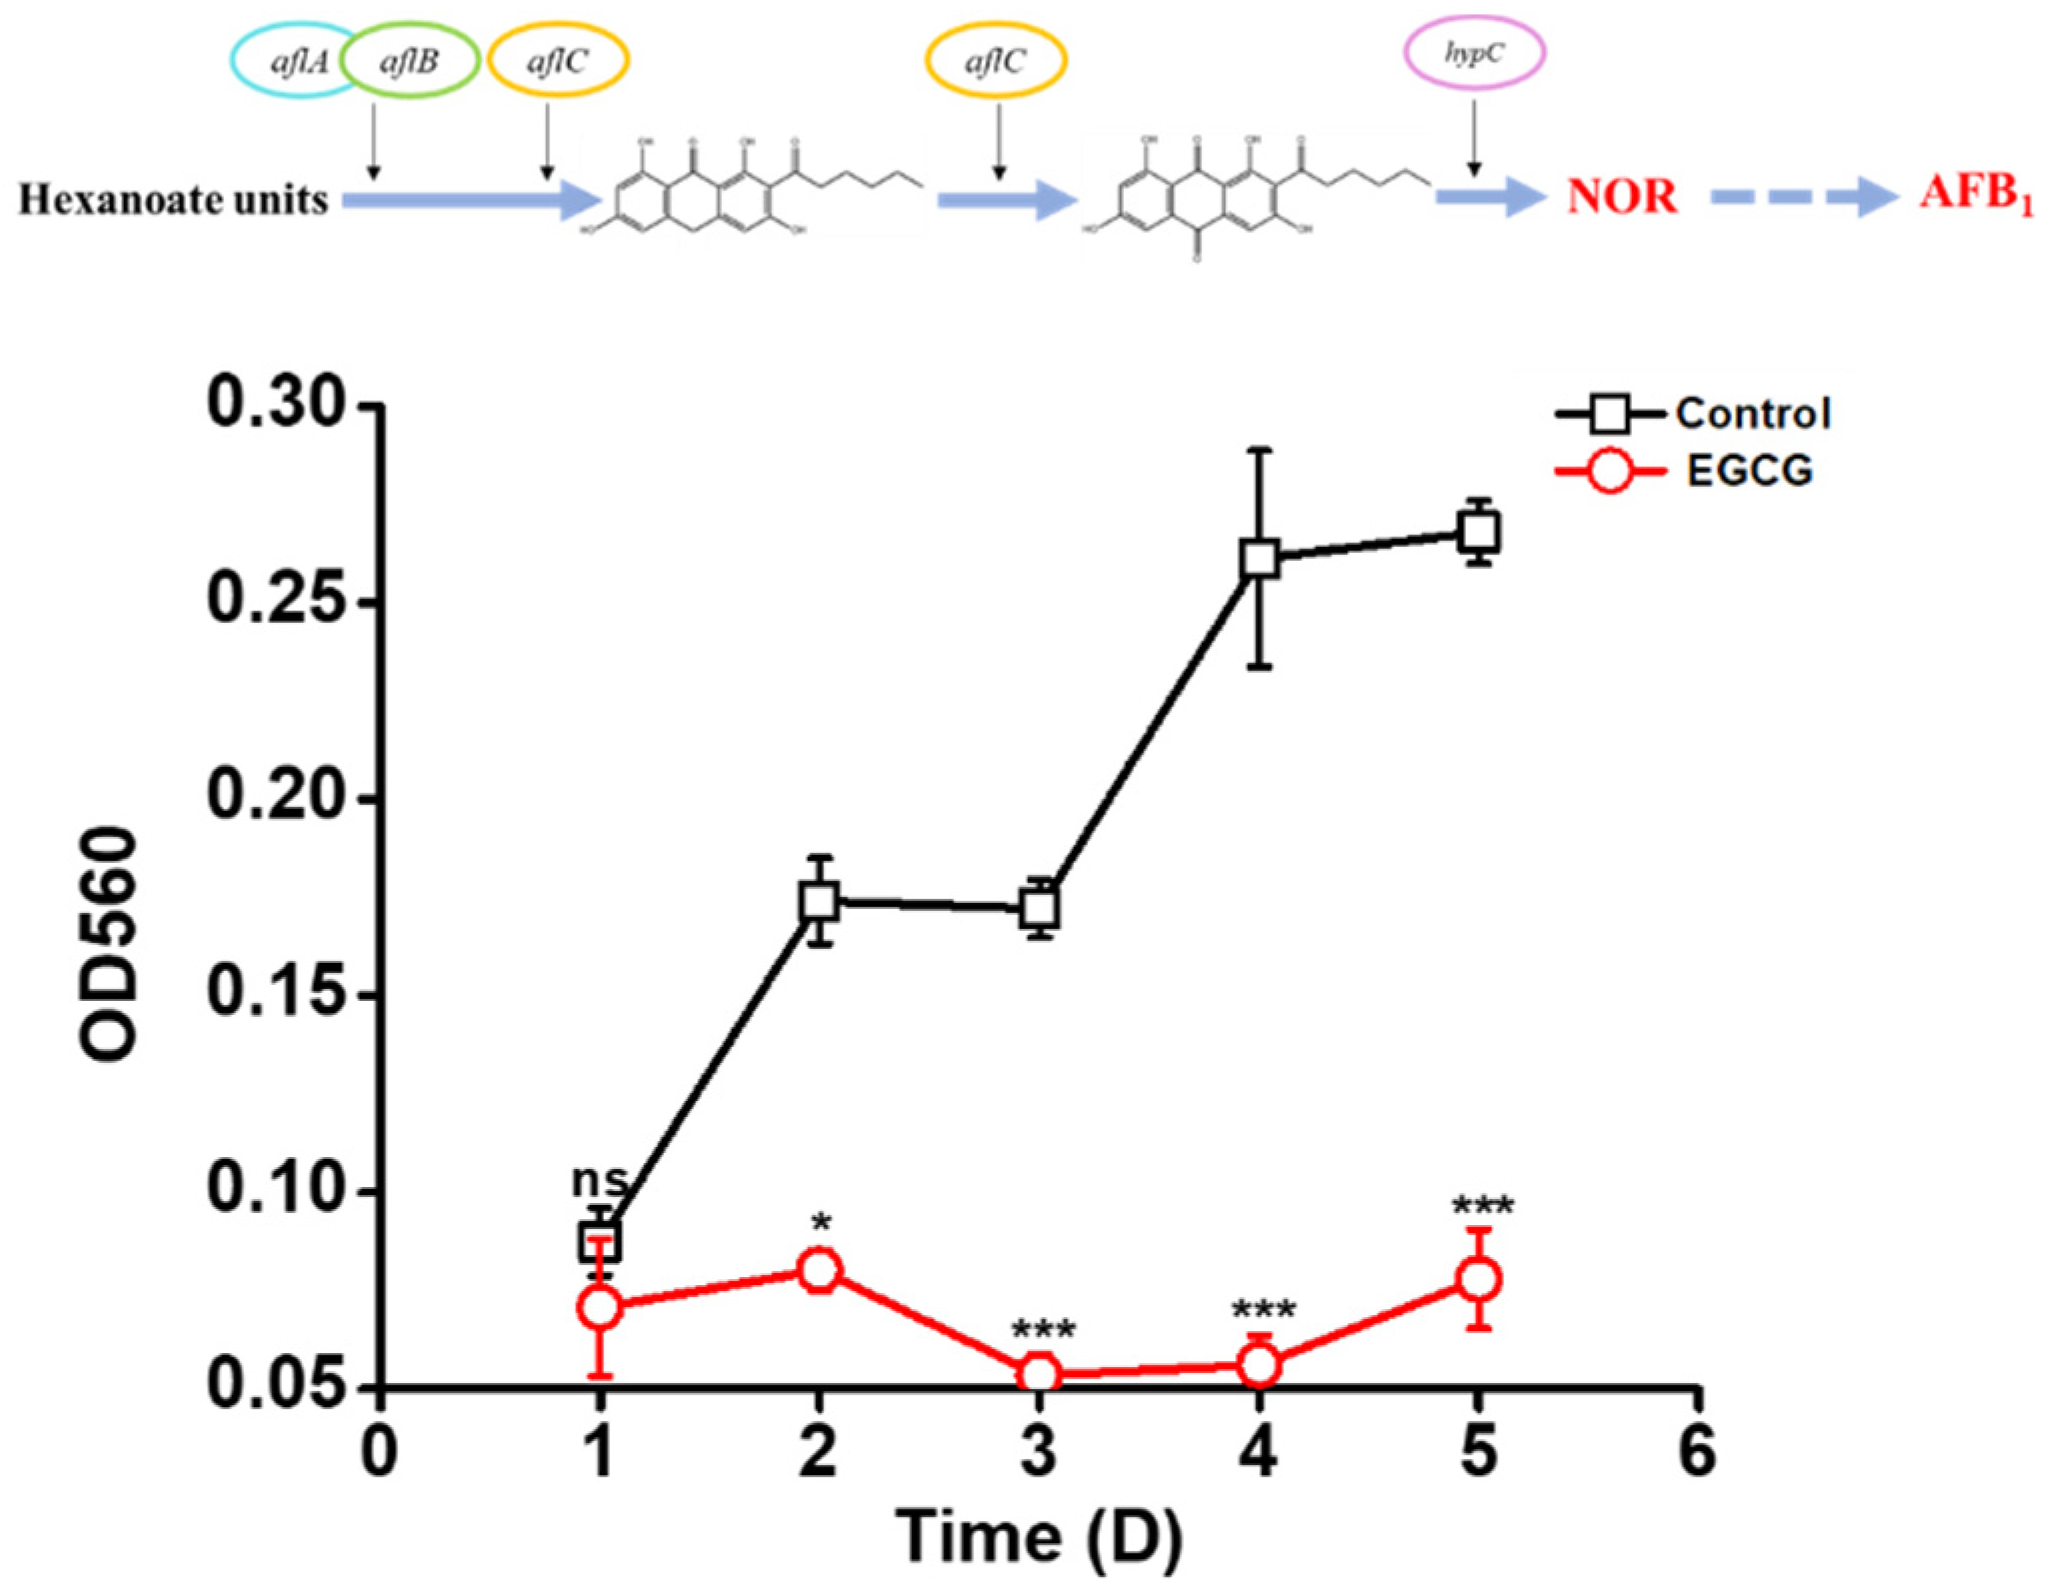
2.5. EGCG Inhibiting NOR Production

RNA-seq results showed aflA and aflC involved in NOR production were down-regulated under the treatment of 1 mg/mL EGCG. As a stable aflatoxin precursor, NOR is the first to be generated in AFB1 biosynthesis [27]. Therefore, NOR was detected to further analyze if EGCG inhibited NOR biosynthesis. Spectrophotometric analyses indicated that NOR biosynthesis were markedly suppressed by 1 mg/mL EGCG (Figure 5). The inhibition rate of NOR synthesis was only 0.45% of that in control group exposure to EGCG for 5 d. These results indicated that the AFB1 biosynthesis pathway was blocked prior to the production of NOR by EGCG.

2.6. Preventing AFB1 Production in Fermented Soybean Products with EGCG

The filamentous fungus Aspergillus oryzae plays a necessary role in the traditional fermentation and food processing industries and is often used in the production of soy sauce. Whereas it may be contaminated by Aspergillus flavus producing AFB1 during fermentation. As shown in Figure 6, EGCG showed significant inhibitory effects on AFB1 production in fermented soybean products. When 8 mg/mL EGCG was applied, the production of AFB1 was completely inhibited. Therefore, EGCG had great potential to control AFB1 contamination in fermented soybean products.

3. Discussion

Among the polyphenols in green tea extract, EGCG is the most active, accounting for 50%–80% of the catechin content [28]. Extensive studies have shown that it exhibits a wide range of beneficial effects including anti-oxidative, antimicrobial and anti-carcinogenic and has therapeutic potential against various human diseases [29]. In this study, we found that EGCG was able to dose-dependently inhibit AFB1 synthesis in A. flavus. The transcription files indicated that some genes responsible for AFB1 biosynthesis were down-regulated after the treatment of EGCG. Aflatoxins are biosynthesized by a polyketide pathway which involves at least 27 enzymatic reactions [7]. It was worth noting that EGCG targeted the genes responsible for the initial steps of AFB1 biosynthesis pathway, of which aflA and aflC were significantly down-regulated post the addition of EGCG. aflA and aflC encode fatty acid synthases and polyketide synthase, respectively [2]. They are also required for generation of NOR, a precursor of AFB1 and toxic intermediate metabolites. As we expected, no NOR accumulation occurred when EGCG blocked AFB1 biosynthesis. This highlighted the potential of EGCG as a natural material to prevent AFB1 contamination.
Oxidative stress is considered as a prerequisite for the synthesis of AFB1 in A. flavus [30,31]. bZIPs play crucial roles in pathways of stress response and are highly conserved in eukaryotes [32]. In filamentous fungi, many bZIP elements such as AtfA, AtfB, AP-1, SrrA, MeaB and MsnA respond to oxidative stress, and mediate the coordinative adjustment in the morphological development and secondary metabolism involving the AFB1 biosynthesis [33,34]. In the present study, the level of intracellular ROS in A. flavus was much reduced with the addition of EGCG, and AtfA associated with oxidative stress was also significantly down-regulated. Hence, we proposed that EGCG block AFB1 biosynthesis pathway by relieving oxidative stress. It has been indicated that cinnamaldehyde and ethanol could inhibit AFB1 formation by down-regulating the expression of some oxidative stress-related genes, whereas they also disrupt cell membranes [15,16]. EGCG is highlighted for its ability to pass through cell membrane [35], and hence has high potential as an intracellular antioxidant applied in food fermentation industry or health care.
How does oxidative stress affect transcription factor AtfA by EGCG? Transcription files revealed that MAPK signaling pathway was blocked after EGCG addition. Being a critical phosphorylation pathway, the modules of MAPK cascade converts environmental stimuli into cellular response [36,37]. They harmonize miscellaneous cellular processes, including development, signal transduction, and secondary metabolism [38,39]. In A. nidulans, SskA, as a response regulator, transmitted the signals of oxidative stress to SakA, Then, SakA translocated to the nucleus answering oxidative stress signals and reacted with AtfA [26]. Garrido-Bazán [40] has shown that H2O2 induced SakA accumulation in the nucleus, interacting with AtfA in A. nidulans. In A. fumigatus, SakA played a collaborative role in translating stress tolerance to the conidia through AtfA [40]. Further Western blot analysis found phosphorylation of SakA was decreased treated with EGCG both in cytoplasm and nucleus. Taken together, we proposed a hypothetical mechanism of EGCG underlying its inhibitory effects on AFB1 production (Figure 7). EGCG perturbed MAPK signaling pathway by decreasing the level of intracellular ROS. Simultaneously, the decrease of phosphorylated SakA level might reduce the tolerance to oxidative stress, leading to the activation of bZIP transcription factor AtfA in the stress signaling pathway. The decreased expression of genes in AFB1 cluster might then be the most down-stream response to the modulation by bZIP transcription factor.
Soy sauce is a traditional condiment fermented by A. oryzae. It is subject to A. flavus contamination producing AFB1 in the process of brewing soy sauce. In this case, it is required to develop efficient agents to prevent AFB1 contamination without affecting the growth of A. oryzae. Our study indicated that EGCG was able to block the pathway of AFB1 biosynthesis prior to NOR production without affecting mycelial growth. Given the safety and efficacy of EGCG, as well as its low cost, it could be considered as a promising agent to prevent the AFB1 contamination in fermentation industry.

4. Conclusions

In this study, we discovered that EGCG had high potential to reduce AFB1 biosynthesis in A. flavus. The anti-aflatoxigenic property of EGCG was related to its ability to relieve oxidative stress via MAPK signaling pathway and inhibit AFB1 cluster gene expression. In summary, our findings indicated EGCG could be considered as a potential natural agent to prevent AFB1 contamination.

5. Materials and Methods

5.1. Chemicals and Strain

EGCG of 98% purity, was purchased from Waston Technology Co., Ltd. (Shaanxi, China). A. flavus NRRL 3357 was gifted by Prof. Zhumei He of Sun Yat-sen University (Guangdong, China), and cultivated on the potato dextrose agar (PDA) medium (Becton, Dickinson and Company, Franklin Lakes, NJ, USA) at 30°C in dark. Spores were harvested with 0.05% TritonX-80 and their numbers were counted with a hemocytometer.

5.2. Determination of Fungal Growth and AFB1 Biosynthesis

Spores (106 cells/mL) were inoculated into 20 mL YES containing 0, 0.25, 0.5, 1, and 2 mg/mL EGCG, respectively. All inocula were incubated at 28°C, 150 rpm. After incubation for 5 days, mycelia and filtrate were harvested. The dry weight of mycelia was weighed 12 h post desiccation at 80 °C.
The amount of AFB1 in filtrate was detected according to Dan et al. [41] with minor changes. AFB1 in the filtrate sample (1 mL) was extracted with 3 mL chloroform, followed by drying with a rotary evaporator and a nitrogen gas blowing concentrator. The AFB1 extract was dissolved with 100 μL trifluoroacetic acid and 200 μL n-hexane, and kept in the dark at 40 ℃ for 15 min. Subsequently, the derivative was dried under nitrogen gas blowing, and redissolved with 1 mL of acetonitrile -water (30:70; v/v). At last, the AFB1 derivative solution was filtered through a 0.22 μm filter, and quantified by using Aglient HPLC 1200 liquid-chromatograph (Agilent Technologies, Palo Alto, CA, USA) matched with a C18 column (Diamonsil®, 250 mm × 4.6 mm, 5 μm) conditioned at 30 °C. The mobile phase was 30% acetonitrile and 70% water at a flow rate of 1.0 mL/min. Then the signal of AFB1 was monitored with a fluorescent detector at 360/440 nm excitation/emission wavelengths. The AFB1 production were calculated according to the standard curve.
The content of norsolorinic acid (NOR) was quantitated as reported [42] with some modifications. The samples were mixed with 3 mL 9:1 methanol/1 N NaOH. NOR is a pH indicator and is purple at this pH, which allows for spectrophotometric measurement at 560 nm with a 96-well-titer ELISA plate reader (Thermo Fisher, Waltham, MA, USA).

5.3. Intracellular ROS Determination

ROS in mycelia was visualized by using a fluorescence microscope (Nikon, Japan) with a fluorescent probe of DCFH-DA (Sigma-Aldrich, St. Louis, MO, USA) described by [43] with slight modification. Spore suspension of A. flavus was incubated into YES with 1 mg/mL EGCG and cultured at 28 ℃ for 24, 36, 48 h. The mycelia were harvested by filtration, washed twice, and resuspended in PBS. The probes were loaded into the mycelia and incubated at 37 °C for 20 min. The treated mycelium was taken and the removal reagent was washed with PBS. Finally, mycelial resuspension in 100 μL PBS was directly transferred into the wells of 96-well plate directly for fluorescent photography. The relative intensity of fluorescence at 500 nm excited by 450 and 520 nm were time-course recorded by a microreader (Thermo Fisher Scientific, Waltham, MA, USA). And ROS distribution in mycelial tip was directly evaluated through fluorescence microscope.

5.4. RNA-Seq and RT-qPCR Validation

The A. flavus mycelia exposed to 1 mg/mL EGCG were taken and grounded in liquid nitrogen. RNA extractor (Trizol) kit (Sangon, Shanghai, China) was employed to extract total RNA according to the instructions. The integrity and quality of RNA were evaluated using 1% agarose gel and an Agilent Technologies 2100 Bioanalyzer. The cDNA library was constructed based on high-quality samples and then sequenced. The mRNA was separated by magnetic beads attached with oligonucleotide (dT). The isolated mRNA was cleaved into small fragments by divalent cations at high temperature. The cDNA was synthesized using these RNA fragments as templates. Appropriate fragments were picked as templates for the PCR amplification. Sequencing was performed by NovelBio Technology (Shanghai, China). Clean sequenced reads were obtained by filtering low quality reads and adaptor contamination, and were compared with the predicted transcripts of the A. flavus NRRL 3357 genome. The FPKM method was used to calculate and normalize the transcription levels of genes in A. flavus. The DEGs were identified as p-value< 0.05. DEGs were visualized by a volcano plot and then were subjected to GO enrichment analysis (Fisher’s Exact Test) and KEGG (Kyoto Encyclopedia of Genes and Genomes) pathway enrichment to identify which DEGs were dramatically enriched in GO terms or metabolic pathways.
Furthermore, the expression level of selected DEGs was confirmed by RT-qPCR. The primer sequences and gene names used in this study were displayed in Table 4. PCR program was settled as follows: 3 min denaturation at 95 °C followed by 35 cycles of 95 °C for 15 s and 60 °C for 40 s. The 2-ΔΔCT method was used to compute the expression of relative gene [44].

5.5. Western Blot Analysis

Spores (106 cells/mL) were inoculated into YES with 1 mg/mL EGCG (without EGCG for the control), and incubated at 28 °C for 3 days. Mycelial biofilm formed on the surface was ground into fine powder in liquid nitrogen. The ground mycelia were addressed in RIPA (Beyotime Institute of Biotechnology, Jiangsu, China) lysis buffer for the total protein preparation. The amount of extracted protein was detected by using a BCA protein assay kit (Beyotime Institute of Biotechnology, Jiangsu, China). The derivative protein was exposed to 10% Sodium dodecyl SDS-PAGE gel and transferred to a polyvinylidene fluoride membrane (PVDF) (Millopore, Burlington, MA, USA). The membrane was sealed with 1× TBST solution containing 5% skim milk powder at room temperature for 1 h and then incubated overnight with primary antibody at 4 ℃. After washing with PBST solution for three times, the membranes were incubated with corresponding respective secondary antibody (1:2000, cell signaling) (Mouse anti-rabbit IgG-HRP, Santa Cruz Biotechnology, Dallas, TX, USA; Anti-mouse IgG; HRP-linked Antibody; Cell Signaling Technology, Danvers, MA, USA) for 2 h at room temperature. Protein gangs were visualized by using Chemi Doc-It® 510 Imager (Upland, CA, USA), and the bands were quantitated by using Image J (Bio-Rad, Hercules, CA, USA). Alfa-tubulin (Sigma-Aldrich, St. Louis, MO, USA) was employed as an internal control [44,45].

5.6. Anti-Aflatoxigenic Evaluation of EGCG in Fermented Soybean Products

Fresh soybeans were boiled and ground which were purchased from a local supermarket. The soybeans (2 g) were placed in centrifuge tubes with 10 mL fungal suspension containing 106 cells/mL. EGCG was added into the centrifuge tubes with the concentrations of 0, 1, 2, 4, 8 mg/mL, respectively. The tubes were incubated at 30 ℃ for 5 days. Then, AFB1 production in fermented soybean products were determined by HPLC, as described earlier.

5.7. Statistical Analyses

All experiments were conducted in triplicate. The results are presented as mean values with standard deviations. Statistical differences were assessed by Student’s t-test.

Author Contributions

Conceptualization, D.X., S.P. and L.H.; methodology, D.X., S.P. and R.G.; formal analysis, D.X., S.P., R.G. and H.M.; data curation, L.Y., H.S. and H.L.; writing—original draft preparation, D.X. and S.P.; writing—review and editing, D.X., S.P. and L.H.; project administration, L.H.; funding acquisition, L.H. All authors have read and agreed to the published version of the manuscript.

Funding

This research was funded by the National Natural Science Foundation of China (Grant No. 31801652, 31901795 and 31671952) and Key research and development project of science and technology department of Shaanxi province (NO.2020ZDLNY02-09).

Institutional Review Board Statement

Not applicable.

Informed Consent Statement

Informed consent was obtained from all subjects involved in the study. Written informed consent has been obtained from the patient(s) to publish this paper.

Data Availability Statement

No new data were created or analyzed in this study. Data sharing is not applicable to this article.

Conflicts of Interest

The authors declare no conflict of interest.

References

  1. Adeyeye, S.A.O. Aflatoxigenic fungi and mycotoxins in food: A review. Crit. Rev. Food Sci. Nutr. 2020, 60, 709–721. [Google Scholar] [CrossRef]
  2. Roze, L.V.; Hong, S.-Y.; Linz, J.E. Aflatoxin Biosynthesis: Current Frontiers. Annu. Rev. Food Sci. Technol. 2013, 4, 293–311. [Google Scholar] [CrossRef]
  3. Tian, F.; Lee, S.Y.; Woo, S.Y.; Choi, H.Y.; Park, S.B.; Chun, H.S. Effect of plant-based compounds on the antifungal and antiaflatoxigenic efficiency of strobilurins against Aspergillus flavus. J. Hazard. Mater. 2021, 415, 125663. [Google Scholar] [CrossRef] [PubMed]
  4. Moral, J.; Garcia-Lopez, M.T.; Camiletti, B.X.; Jaime, R.; Michailides, T.J.; Bandyopadhyay, R.; Ortega-Beltran, A. Present Status and Perspective on the Future Use of Aflatoxin Biocontrol Products. Agronomy 2020, 10, 491. [Google Scholar] [CrossRef] [Green Version]
  5. Amaike, S.; Keller, N.P. Aspergillus flavus. Annu. Rev. Phytopathol. 2011, 49, 107–133. [Google Scholar] [CrossRef] [PubMed]
  6. Wang, P.; Ma, L.; Jin, J.; Zheng, M.; Pan, L.; Zhao, Y.; Sun, X.; Liu, Y.; Xing, F. The anti-aflatoxigenic mechanism of cinnamaldehyde in Aspergillus flavus. Sci. Rep. 2019, 9, 1. [Google Scholar] [CrossRef] [PubMed]
  7. Caceres, I.; Al Khoury, A.; El Khoury, R.; Lorber, S.; Oswald, I.P.; El Khoury, A.; Atoui, A.; Puel, O.; Bailly, J.-D. Aflatoxin Biosynthesis and Genetic Regulation: A Review. Toxins 2020, 12, 150. [Google Scholar] [CrossRef] [Green Version]
  8. WHO; IARC. Some naturally occurring substances: Food items and constituents, heterocyclic aromatic amines and mycotoxins. IARC Monogr. Eval. Carcinog. Risks Hum. 1993, 56, 489–521. [Google Scholar]
  9. Wu, F. Perspective: Time to face the fungal threat. Nature 2014, 516, S7. [Google Scholar] [CrossRef]
  10. Li, X.; Ren, Y.; Jing, J.; Jiang, Y.; Yang, Q.; Luo, S.; Xing, F. The inhibitory mechanism of methyl jasmonate on Aspergillus flavus growth and aflatoxin biosynthesis and two novel transcription factors are involved in this action. Food Res. Int. 2021, 140, 110051. [Google Scholar] [CrossRef]
  11. Grintzalis, K.; Vernardis, S.; Klapa, M.I.; Georgiou, C.D. Role of Oxidative Stress in Sclerotial Differentiation and Aflatoxin B1 Biosynthesis in Aspergillus flavus. Appl. Environ. Microbiol. 2014, 80, 5561–5571. [Google Scholar] [CrossRef] [Green Version]
  12. Fountain, J.C.; Bajaj, P.; Pandey, M.; Nayak, S.N.; Yang, L.; Kumar, V.; Jayale, A.S.; Chitikineni, A.; Zhuang, W.; Scully, B.T.; et al. Oxidative stress and carbon metabolism influence Aspergillus flavus transcriptome composition and secondary metabolite production. Sci. Rep. 2016, 6, 38747. [Google Scholar] [CrossRef] [Green Version]
  13. Guan, X.; Zhao, Y.; Liu, X.; Shang, B.; Xing, F.; Zhou, L.; Wang, Y.; Zhang, C.; Bhatnagar, D.; Liu, Y. The bZIP transcription factor Afap1 mediates the oxidative stress response and aflatoxin biosynthesis in Aspergillus flavus. Rev. Argent. Microbiol. 2019, 51, 292–301. [Google Scholar] [CrossRef] [PubMed]
  14. Jayashree, T.; Subramanyam, C. Oxidative stress as a prerequisite for aflatoxin production by Aspergillus parasiticus. Free Radic. Biol. Med. 2000, 29, 981–985. [Google Scholar] [CrossRef]
  15. Sun, Q.; Shang, B.; Wang, L.; Lu, Z.; Liu, Y. Cinnamaldehyde inhibits fungal growth and aflatoxin B1 biosynthesis by modulating the oxidative stress response of Aspergillus flavus. Appl. Microbiol. Biotechnol. 2016, 100, 1355–1364. [Google Scholar] [CrossRef] [PubMed]
  16. Ren, Y.; Jin, J.; Zheng, M.; Yang, Q.; Xing, F. Ethanol Inhibits Aflatoxin B1 Biosynthesis in Aspergillus flavus by Up-Regulating Oxidative Stress-Related Genes. Front. Microbiol. 2020, 10, 2946. [Google Scholar] [CrossRef] [PubMed] [Green Version]
  17. Huang, J.-Q.; Jiang, H.-F.; Zhou, Y.-Q.; Lei, Y.; Wang, S.-Y.; Liao, B.-S. Ethylene inhibited aflatoxin biosynthesis is due to oxidative stress alleviation and related to glutathione redox state changes in Aspergillus flavus. Int. J. Food Microbiol. 2009, 130, 17–21. [Google Scholar] [CrossRef]
  18. Zhao, X.; Zhi, Q.-Q.; Li, J.-Y.; Keller, N.P.; He, Z.-M. The Antioxidant Gallic Acid Inhibits Aflatoxin Formation in Aspergillus flavus by Modulating Transcription Factors FarB and CreA. Toxins 2018, 10, 270. [Google Scholar] [CrossRef] [Green Version]
  19. Caceres, I.; El Khoury, R.; Bailly, S.; Oswald, I.P.; Puel, O.; Bailly, J.-D. Piperine inhibits aflatoxin B1 production in Aspergillus flavus by modulating fungal oxidative stress response. Fungal Genet. Biol. 2017, 107, 77–85. [Google Scholar] [CrossRef]
  20. Singh, B.N.; Shankar, S.; Srivastava, R.K. Green tea catechin, epigallocatechin-3-gallate (EGCG): Mechanisms, perspectives and clinical applications. Biochem. Pharmacol. 2011, 82, 1807–1821. [Google Scholar] [CrossRef] [Green Version]
  21. Almatroodi, S.A.; Almatroudi, A.; Khan, A.A.; Alhumaydhi, F.A.; Alsahli, M.A.; Rahmani, A.H. Potential Therapeutic Targets of Epigallocatechin Gallate (EGCG), the Most Abundant Catechin in Green Tea, and its Role in the Therapy of Various Types of Cancer. Molecules 2020, 25, 3146. [Google Scholar] [CrossRef]
  22. Mo, H.Z.; Zhang, H.; Wu, Q.H.; Bin Hu, L. Inhibitory effects of tea extract on aflatoxin production by Aspergillus flavus. Lett. Appl. Microbiol. 2013, 56, 462–466. [Google Scholar] [CrossRef]
  23. Qin, G.; Gopalan-Kriczky, P.; Su, J.; Ning, Y.; Lotlikar, P.D. Inhibition of aflatoxin B1-induced initiation of hepatocarcinogenesis in the rat by green tea. Cancer Lett. 1997, 112, 149–154. [Google Scholar] [CrossRef]
  24. Pakshir, K.; Mirshekari, Z.; Nouraei, H.; Zareshahrabadi, Z.; Zomorodian, K.; Khodadadi, H.; Hadaegh, A. Mycotoxins Detection and Fungal Contamination in Black and Green Tea by HPLC-Based Method. J. Toxicol. 2020, 2020, 2456210. [Google Scholar] [CrossRef]
  25. Raja, V.; Majeed, U.; Kang, H.; Andrabi, K.I.; John, R. Abiotic stress: Interplay between ROS, hormones and MAPKs. Environ. Exp. Bot. 2017, 137, 142–157. [Google Scholar] [CrossRef]
  26. Lara-Rojas, F.; Sánchez, O.; Kawasaki, L.; Aguirre, J. Aspergillus nidulans transcription factor AtfA interacts with the MAPK SakA to regulate general stress responses, development and spore functions. Mol. Microbiol. 2011, 80, 436–454. [Google Scholar] [CrossRef] [PubMed] [Green Version]
  27. Bennett, J.W.; Lee, L.S.; Vinnett, C. The correlation of aflatoxin and norsolorinic acid production. J. Am. Oil Chem. Soc. 1971, 48, 368–370. [Google Scholar] [CrossRef]
  28. Liu, B.; Yan, W. Lipophilization of EGCG and effects on antioxidant activities. Food Chem. 2019, 272, 663–669. [Google Scholar] [CrossRef]
  29. Chacko, S.M.; Thambi, P.T.; Kuttan, R.; Nishigaki, I. Beneficial effects of green tea: A literature review. Chin. Med. 2010, 5, 13–19. [Google Scholar] [CrossRef] [Green Version]
  30. Kim, J.H.; Yu, J.; Mahoney, N.; Chan, K.L.; Molyneux, R.J.; Varga, J.; Bhatnagar, D.; Cleveland, T.E.; Nierman, W.C.; Campbell, B.C. Elucidation of the functional genomics of antioxidant-based inhibition of aflatoxin biosynthesis. Int. J. Food Microbiol. 2008, 122, 49–60. [Google Scholar] [CrossRef]
  31. Reverberi, M.; Punelli, M.; Smith, C.A.; Zjalic, S.; Scarpari, M.; Scala, V.; Cardinali, G.; Aspite, N.; Pinzari, F.; Payne, G.A.; et al. How Peroxisomes Affect Aflatoxin Biosynthesis in Aspergillus Flavus. PLoS ONE 2012, 7, e48097. [Google Scholar] [CrossRef]
  32. Dröge-Laser, W.; Snoek, B.L.; Snel, B.; Weiste, C. The Arabidopsis bZIP transcription factor family—An update. Curr. Opin. Plant. Biol. 2018, 45, 36–49. [Google Scholar] [CrossRef] [PubMed]
  33. Wee, J.; Hong, S.-Y.; Roze, L.V.; Day, D.M.; Chanda, A.; Linz, J.E. The Fungal bZIP Transcription Factor AtfB Controls Virulence-Associated Processes in Aspergillus parasiticus. Toxins 2017, 9, 287. [Google Scholar] [CrossRef] [PubMed] [Green Version]
  34. Roze, L.V.; Chanda, A.; Wee, J.; Awad, D.; Linz, J.E. Stress-related Transcription Factor AtfB Integrates Secondary Metabolism with Oxidative Stress Response in Aspergilli. J. Biol. Chem. 2011, 286, 35137–35148. [Google Scholar] [CrossRef] [PubMed] [Green Version]
  35. Cano, A.; Ettcheto, M.; Chang, J.-H.; Barroso, E.; Espina, M.; Kühne, B.A.; Barenys, M.; Auladell, C.; Folch, J.; Souto, E.B.; et al. Dual-drug loaded nanoparticles of Epigallocatechin-3-gallate (EGCG)/Ascorbic acid enhance therapeutic efficacy of EGCG in a APPswe/PS1dE9 Alzheimer’s disease mice model. J. Control. Release 2019, 301, 62–75. [Google Scholar] [CrossRef]
  36. Yang, G.; Cao, X.; Ma, G.; Qin, L.; Wu, Y.; Lin, J.; Ye, P.; Yuan, J.; Wang, S. MAPK pathway-related tyrosine phosphatases regulate development, secondary metabolism and pathogenicity in fungus Aspergillus flavus. Environ. Microbiol. 2020, 22, 5232–5247. [Google Scholar] [CrossRef]
  37. Manfiolli, A.O.; Siqueira, F.S.; Reis, T.; Van Dijck, P.; Schrevens, S.; Hoefgen, S.; Föge, M.; Straßburger, M.; de Assis, L.J.; Heinekamp, T.; et al. Mitogen-Activated Protein Kinase Cross-Talk Interaction Modulates the Production of Melanins in Aspergillus fumigatus. mBio 2019, 10, e00215-19. [Google Scholar] [CrossRef] [Green Version]
  38. Martínez-Soto, D.; Ruiz-Herrera, J. Functional analysis of the MAPK pathways in fungi. Rev. Iberoam. Micol. 2017, 34, 192–202. [Google Scholar] [CrossRef]
  39. Yue, J.; López, J.M. Understanding MAPK Signaling Pathways in Apoptosis. Int. J. Mol. Sci. 2020, 21, 2346. [Google Scholar] [CrossRef] [Green Version]
  40. Garrido-Bazán, V.; Jaimes-Arroyo, R.; Sánchez, O.; Lara-Rojas, F.; Aguirre, J. SakA and MpkC Stress MAPKs Show Opposite and Common Functions During Stress Responses and Development in Aspergillus nidulans. Front. Microbiol. 2018, 9, 2518. [Google Scholar] [CrossRef] [Green Version]
  41. Xu, D.; Wang, H.; Zhang, Y.; Yang, Z.; Sun, X. Inhibition of non-toxigenic Aspergillus niger FS10 isolated from Chinese fermented soybean on growth and aflatoxin B1 production by Aspergillus flavus. Food Control. 2013, 32, 359–365. [Google Scholar] [CrossRef]
  42. Keller, N.P.; Nesbitt, C.; Sarr, B.; Phillips, T.D.; Burow, G.B. pH Regulation of Sterigmatocystin and Aflatoxin Biosynthesis in Aspergillus spp. Phytopathology 1997, 87, 643–648. [Google Scholar] [CrossRef] [PubMed] [Green Version]
  43. Foreman, J.; Demidchik, V.; Bothwell, J.H.F.; Mylona, P.; Miedema, H.; Torres, M.A.; Linstead, P.; Costa, S.; Brownlee, C.; Jones, J.; et al. Reactive oxygen species produced by NADPH oxidase regulate plant cell growth. Nature 2003, 422, 442–446. [Google Scholar] [CrossRef]
  44. Paul, S.; Diekema, D.; Moye-Rowley, W.S. Contributions of both ATP-Binding Cassette Transporter and Cyp51A Proteins Are Essential for Azole Resistance in Aspergillus fumigatus. Antimicrob. Agents Chemother. 2017, 61, e02748-16. [Google Scholar] [CrossRef] [PubMed] [Green Version]
  45. Liu, W.; Dong, M.; Bo, L.; Li, C.; Liu, Q.; Li, Y.; Ma, L.; Xie, Y.; Fu, E.; Mu, D.; et al. Epigallocatechin-3-gallate Ameliorates Seawater Aspiration-Induced Acute Lung Injury via Regulating Inflammatory Cytokines and Inhibiting JAK/STAT1 Pathway in Rats. Mediat. Inflamm. 2015, 2014, 612593. [Google Scholar] [CrossRef] [PubMed] [Green Version]
Figure 1. Effects of EGCG on mycelial growth and AFB1 production in A. flavus. (A) The dry weight of mycelia exposed to EGCG. (B) The AFB1 levels in YES (yeast extract with supplements) after treatment with EGCG at different concentrations for 5 days was determined by HPLC. (C) Constant monitoring of AFB1 biosynthesis in YES with 1 mg/mL EGCG for 8 days by HPLC. “ns” represents not significant; ***: p < 0.001.
Toxins 13 00693 g001
Figure 2. Influences of EGCG on mycelial ROS accumulation. (A) The fluorescence intensity was tested post the treatment with 1 mg/mL EGCG for 72 h by a microreader. (B) The mycelial bright-filed images and corresponding fluorescent images were obtained post treatment with 1 mg/mL EGCG for 36, 48 and 72 h by a fluorescence microscope. ***: p < 0.001.
Toxins 13 00693 g002
Figure 3. RNA-seq of A. flavus exposed to 1 mg/mL EGCG. (A) Volcano map describing the expression of different genes. (B) GO enrichment of down-regulated genes. (C) KEGG histogram of down-regulated DEGs. (D) Validation of RNA−seq data about the AFB1 biosynthesis down−regulated genes cluster by qRT−PCR. ***: p < 0.001.
Toxins 13 00693 g003aToxins 13 00693 g003b
Figure 4. Influence of EGCG on SakA expression and phosphorylation in cytoplasm and nucleus. (A) The analysis of SakA phosphorylation and the protein expression of SakA in cytoplasm by Western blot. (B) The analysis of SakA phosphorylation and expression in nucleus by Western blot.
Toxins 13 00693 g004aToxins 13 00693 g004b
Figure 5. Effect of 1 mg/mL EGCG on the production of NOR in YES. NOR content was detected by optical adsorption at 560 nm with a microreader. “ns” means no significant; *: p < 0.05; ***: p < 0.001.
Toxins 13 00693 g005
Figure 6. AFB1 amount in fermented soybean products was determined by HPLC. “nd” represents no detection, and different letters show a significant difference at p < 0.05.
Toxins 13 00693 g006
Figure 7. Hypothetical mechanism of EGCG inhibition of AFB1 biosynthesis in A. flavus. EGCG perturbed MAPK signaling pathway by decreasing the level of intracellular ROS. Simultaneously, the decrease of phosphorylated SakA level might reduce the tolerance to oxidative stress, leading to the activation of bZIP transcription factor AtfA in the stress signaling pathway. The decreased expression of genes in AFB1 cluster might then be the most down-stream response to the modulation by bZIP transcription factor.
Toxins 13 00693 g007
Table 1. Transcriptional down-regulated genes and functions.
GOIDGOTermQueryIDDescriptionp-ValueEnrichment
GO:0033674positive regulation of kinase activityAFLA_034120vacuole-associated enzyme activator complex component Vac140.0010.09
GO:0033674positive regulation of kinase activityAFLA_046890phospholipid metabolism enzyme regulator0.00124.59
GO:0006970response to osmotic stressAFLA_094490protein phosphatase 2C0.014.28
GO:0006970response to osmotic stressAFLA_136040chitin synthase 0.014.28
GO:0006970response to osmotic stressAFLA_136030chitin synthase ChsE0.014.28
GO:0006970response to osmotic stressAFLA_013690chitin synthase C0.014.28
GO:0050850positive regulation of calcium-mediated signalingAFLA_051240MAP kinase kinase (Mkk2) MAP0.029.84
GO:0050850positive regulation of calcium-mediated signalingAFLA_068440calcium channel subunit Cch10.029.84
GO:0043619regulation of transcription from RNA polymerase II promoter in response to oxidative stressAFLA_106830sensor histidine kinase/response regulator Fos-1/TcsA0.028.20
GO:0030437ascospore formationAFLA_137060plasma membrane SNARE protein (Sec9)0.042.67
GO:0030437ascospore formationAFLA_052430G protein complex alpha subunit GpaB0.042.67
GO:0030437ascospore formationAFLA_030580C2H2 transcription factor PacC0.042.67
GO:0007186G-protein coupled receptor signaling pathwayAFLA_018540G protein complex alpha subunit GpaB0.046.15
GO:0007186G-protein coupled receptor signaling pathwayAFLA_061620a-pheromone receptor PreA0.043.33
GO:0006979response to oxidative stressAFLA_106830sensor histidine kinase/response regulator Fos-1/TcsA0.043.07
GO:0006979response to oxidative stressAFLA_034380spore-specific catalase CatA0.043.07
GO:0006979response to oxidative stressAFLA_056170mycelial catalase Cat10.043.07
GO:0000173inactivation of MAPK activity involved in osmosensory signaling pathwayAFLA_094490protein phosphatase 2C0.0424.59
GO:0010619adenylate cyclase-activating glucose-activated G-protein coupled receptor signaling pathwayAFLA_018540G protein complex alpha subunit GpaB0.0424.59
GO:0042992negative regulation of transcription factor import into nucleusAFLA_032170protein serine/threonine kinase (Ran1)0.0424.59
GO:0043550regulation of lipid kinase activityAFLA_034120vacuole-associated enzyme activator complex component Vac140.0424.59
GO:0035970peptidyl-threonine dephosphorylationAFLA_094490protein phosphatase 2C0.0424.59
GO:0071619phosphorylation of RNA polymerase II C-terminal domain serine 2 residuesAFLA_005900protein kinase0.0424.59
GO:0034486vacuolar transmembrane transportAFLA_112050cation chloride cotransporter0.0424.59
Table 2. The numbers of DEGs in each pathway.
Pathway IDRegulatedPathway TermGene Number
PATH:04011DownMAPK signaling pathway-yeast9
PATH:00520DownAmino sugar and nucleotide sugar metabolism9
PATH:00380DownTryptophan metabolism7
PATH:00500DownStarch and sucrose metabolism8
PATH:00340DownHistidine metabolism3
PATH:00630DownGlyoxylate and dicarboxylate metabolism5
PATH:00280UpValine, leucine and isoleucine degradation7
PATH:00350UpTyrosine metabolism8
PATH:01040UpBiosynthesis of unsaturated fatty acids4
PATH:01100UpMetabolic pathways53
PATH:00071UpFatty acid degradation5
PATH:00410Upbeta-Alanine metabolism4
PATH:00340UpHistidine metabolism3
PATH:00592Upalpha-Linolenic acid metabolism2
PATH:00053UpAscorbate and aldarate metabolism2
Table 3. Influence of EGCG on the transcriptions of gene cluster responsible for aflatoxin production.
Gene IDGene Name and ProductStyle
AFLA_139310aflE/norA/aad/adh2/NOR (norsolorinic acid reductase)down a
AFLA_139320aflJ/estA/esterasedown
AFLA_139360aflR/apa2/afl2/C6 transcription factordown
AFLA_139380aflA/fas2/hexA/fatty acid synthase alpha subunitdown a
AFLA_139410aflC/pksA/pksL1/polyketide synthasedown a
a shows a significant difference at p < 0.05.
Table 4. The list of primers for qRT-PCR.
GeneForward Primer (5′-3′)Reverse Primer (5′-3′)
aflACGTCACGCTCTATACAATTTGCTATCCGATAAAGTTGCCTAGTTCC
aflCTGTCAGACCACAAACGCACCTCATCTCACAGAACGCCCTCAA
aflECTATCATCTAGCGCCGGTGTCCATCTTTCGCTATCGCCTCC
aflJCTGCGTTGCTACACTCCCCATCACGCGGCAGAAACCATC
aflRGCAGTCAATGGAACACGGAAACCCTGAAACGGTGGTAGTGGG
atfAAAACTGAAGACTCCCAGGCGCAAACTGAAGACTCCCAGGCGC
actinAGGACTCTTATGTCGGTGATGCGGTTGGACTTAGGGTTG
Publisher’s Note: MDPI stays neutral with regard to jurisdictional claims in published maps and institutional affiliations.

