The Responsiveness of Bee Venom Phospholipase A2 on Regulatory T Cells Correlates with the CD11c+CD206+Population in Human Peripheral Blood Mononuclear Cells

 , , , and
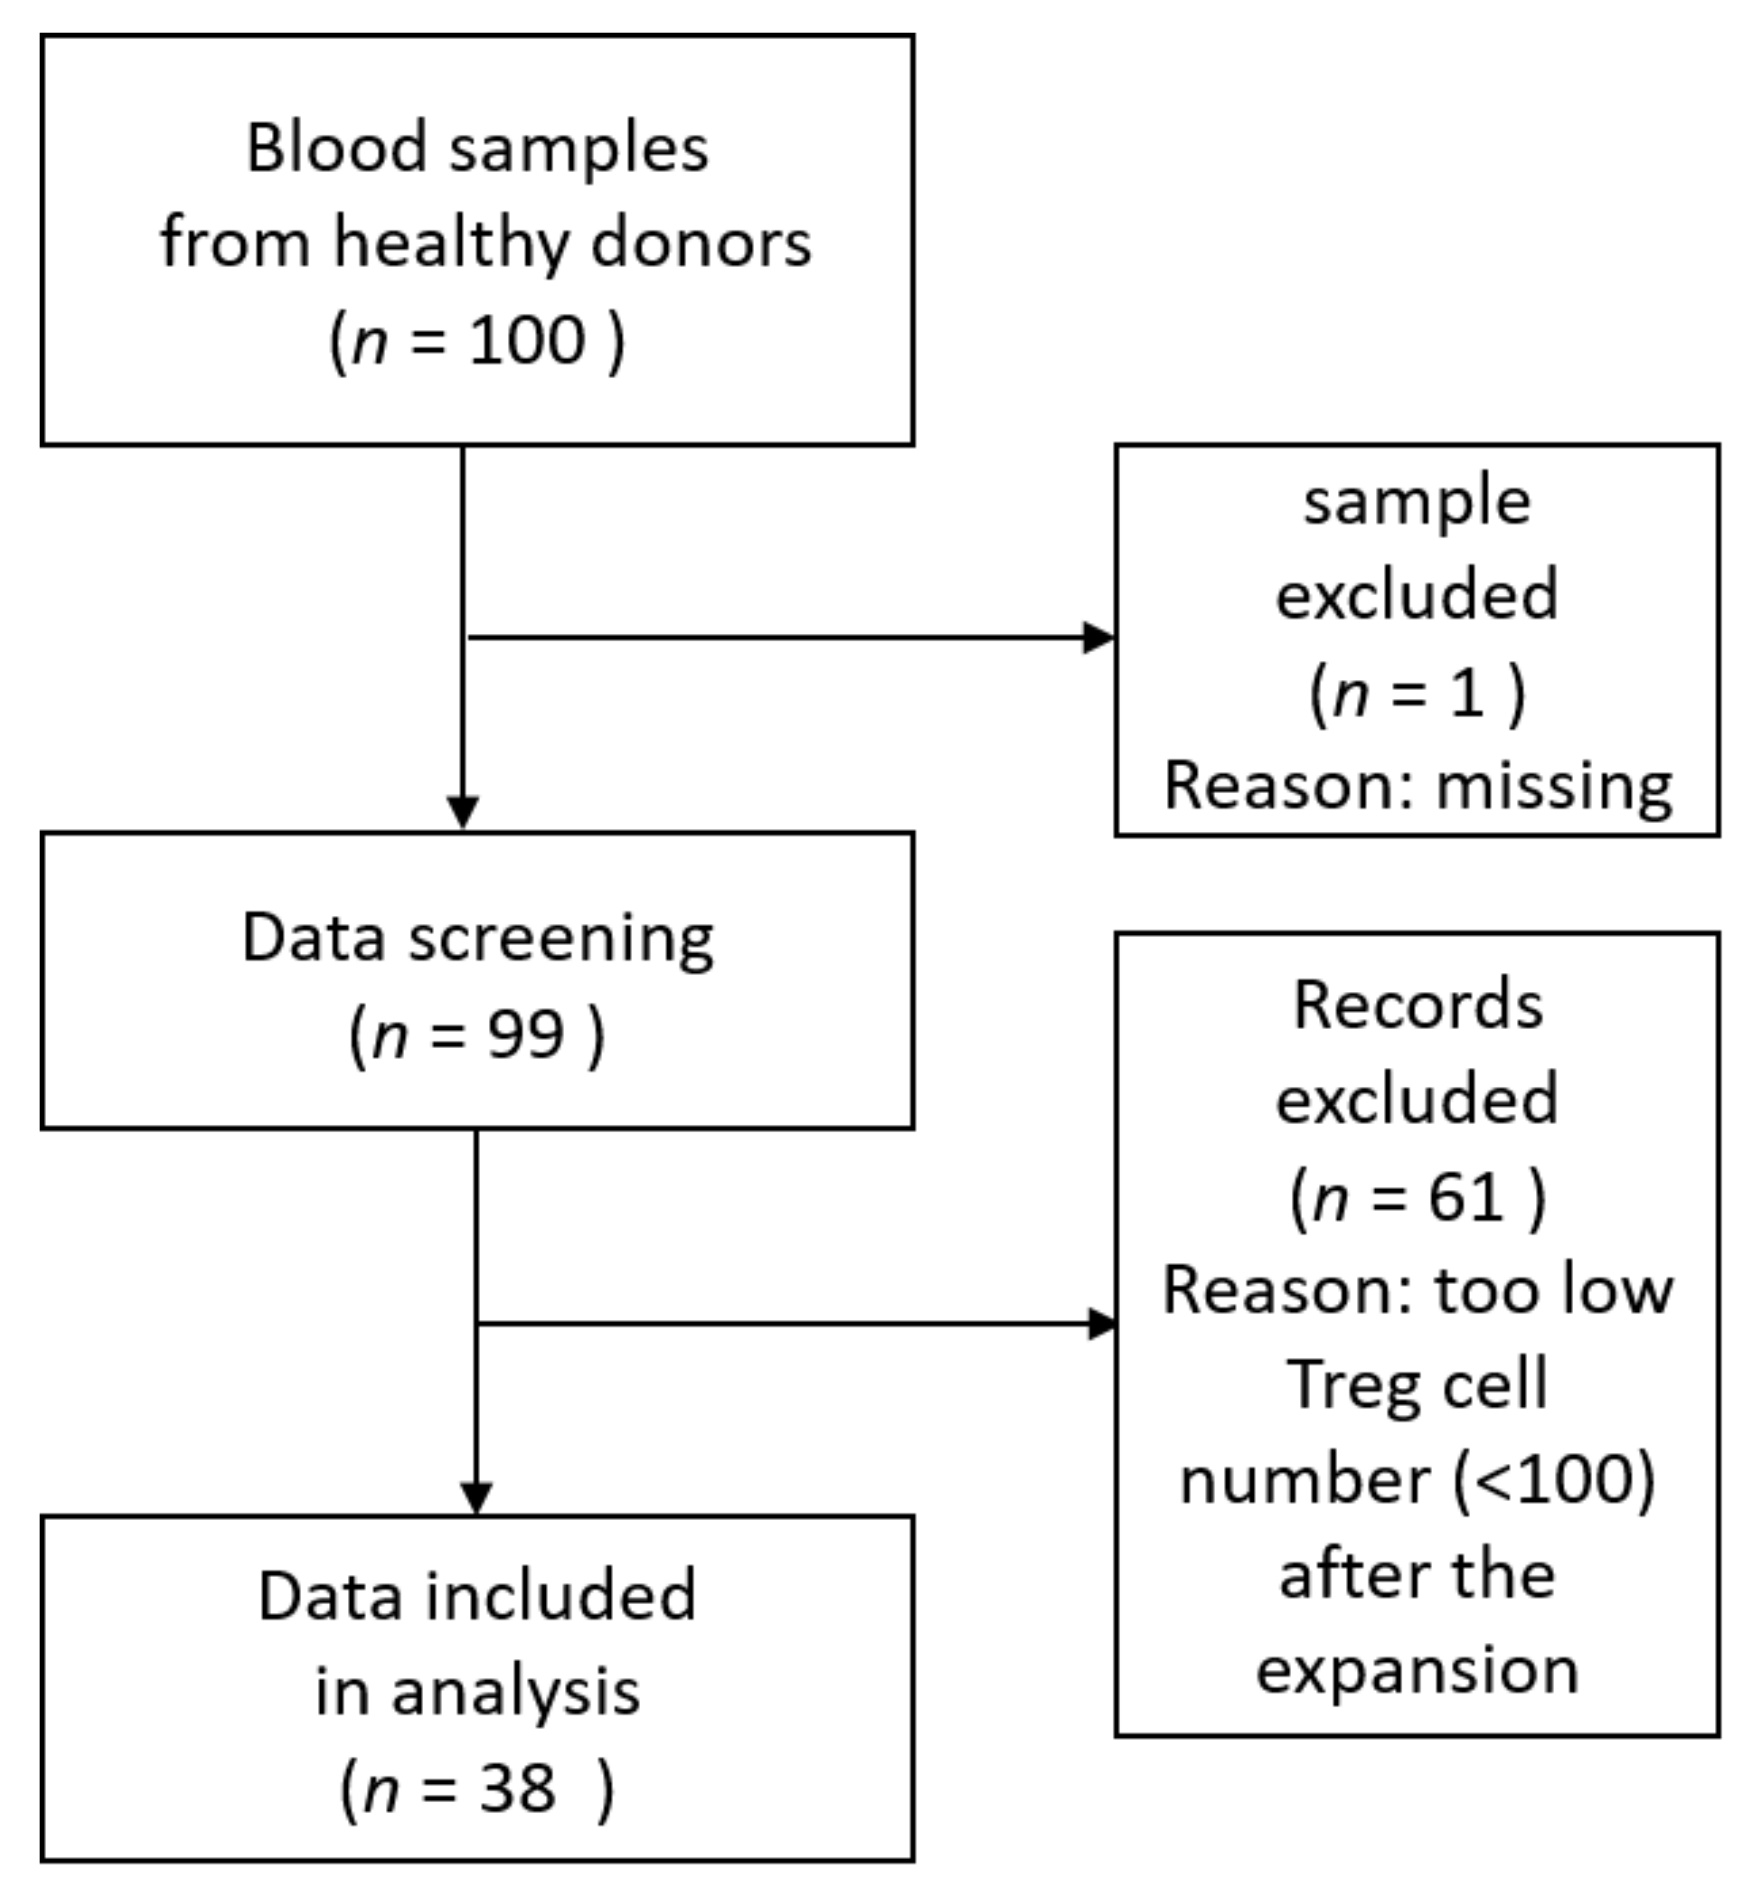
Abstract
:1. Introduction
2. Results
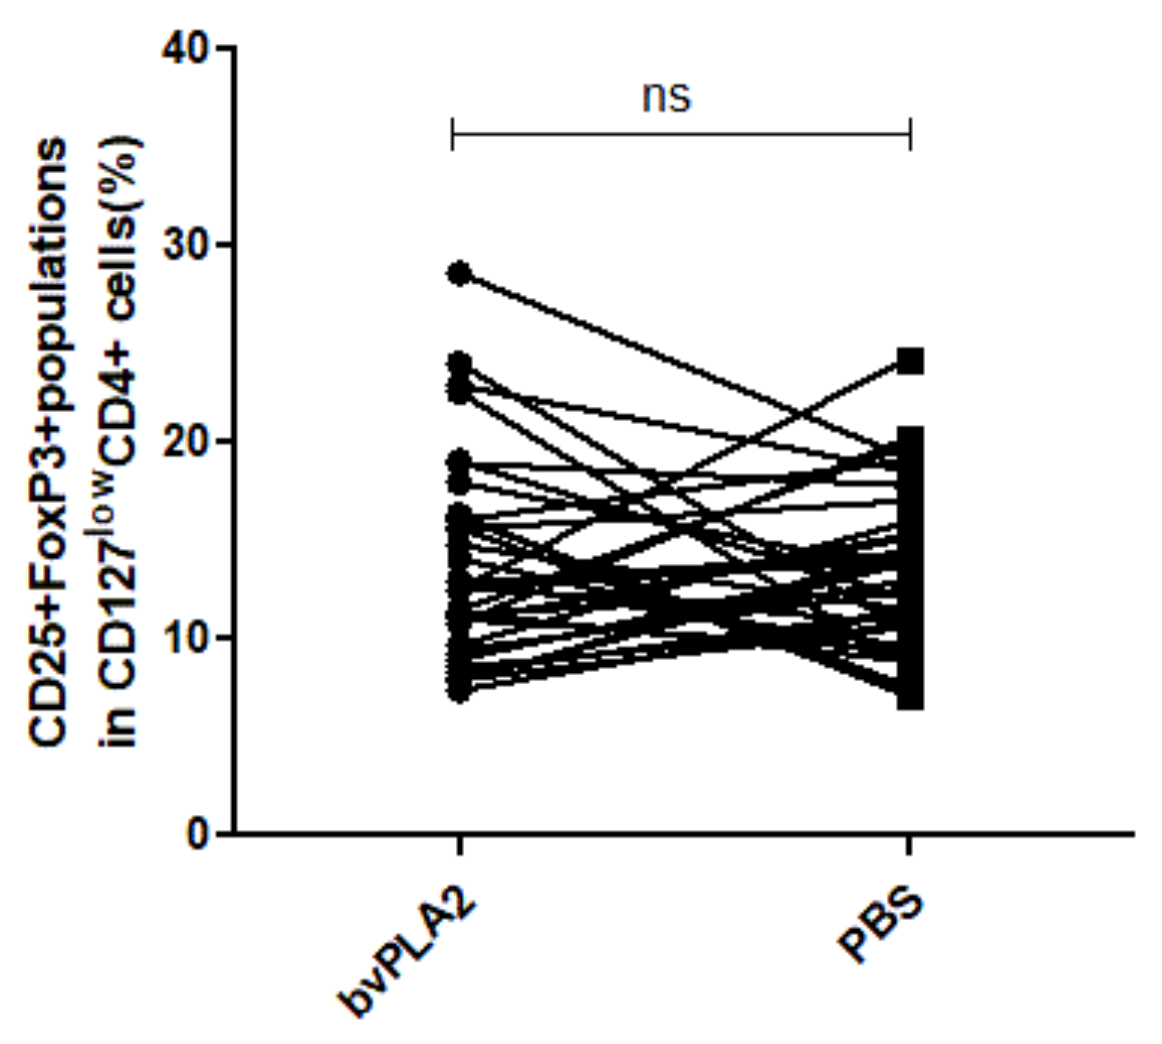
2.1. Effect of bvPLA2 Treatment on the Treg Expansion of hPBMCs
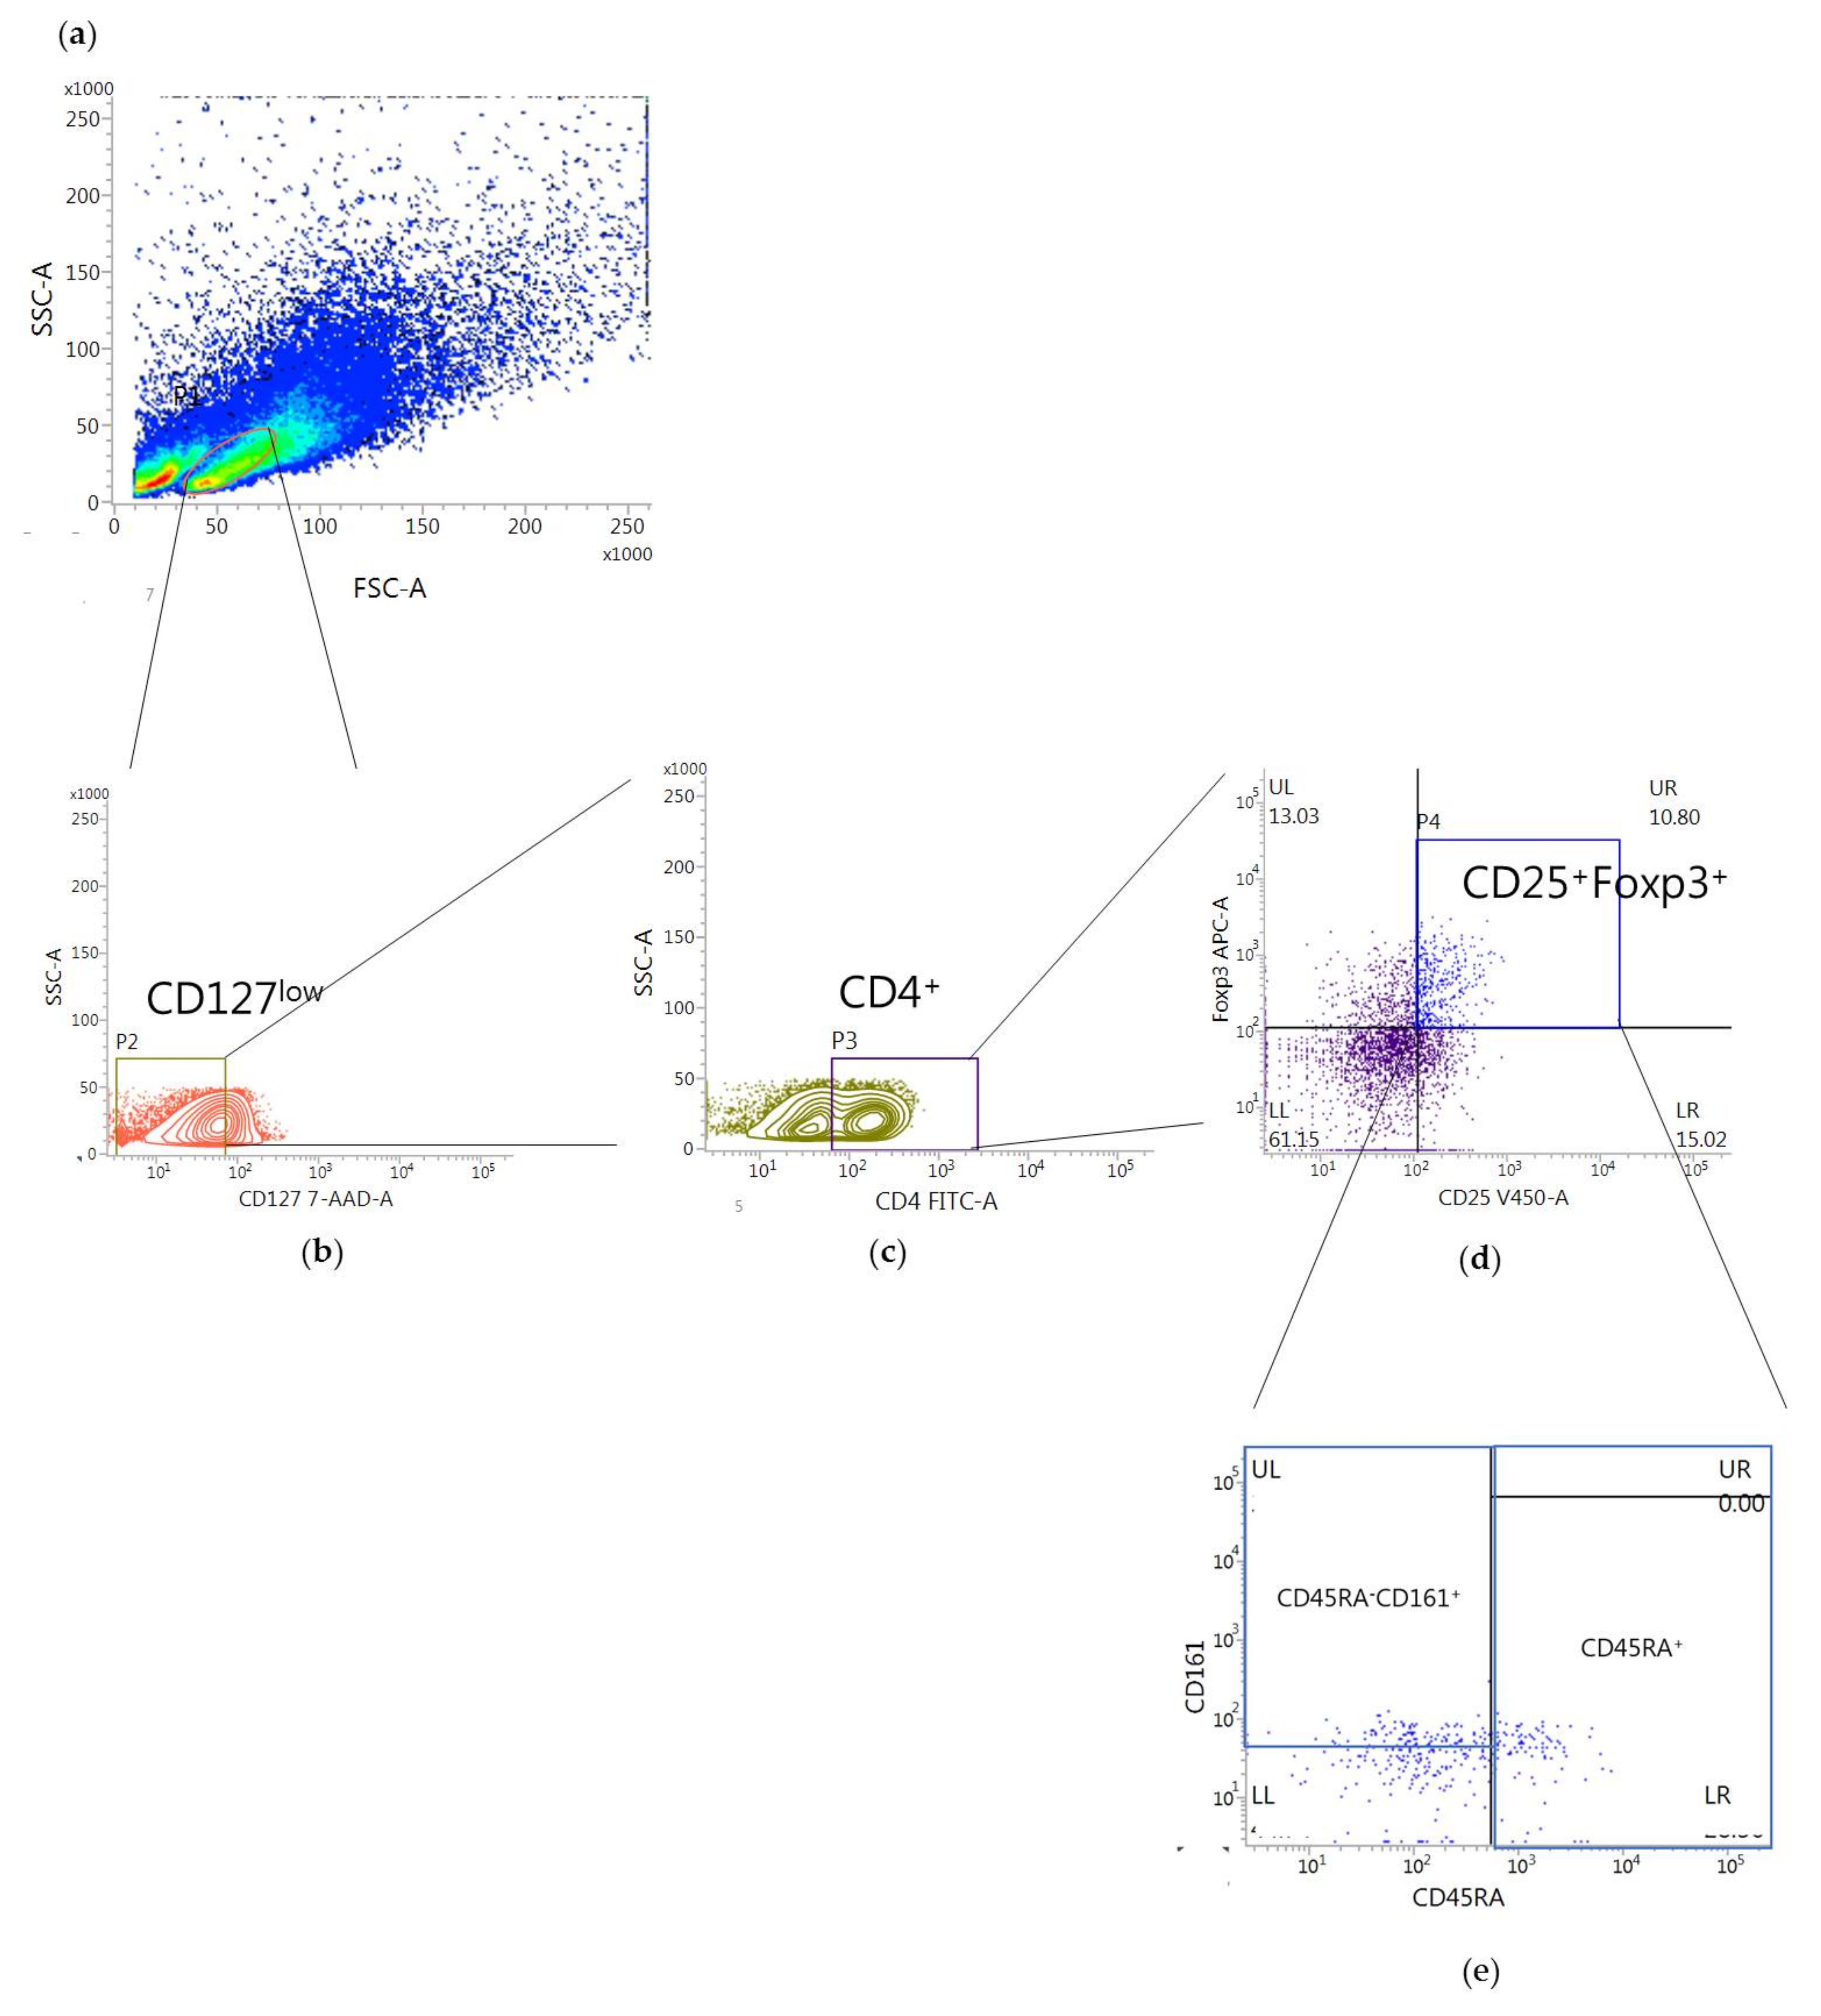
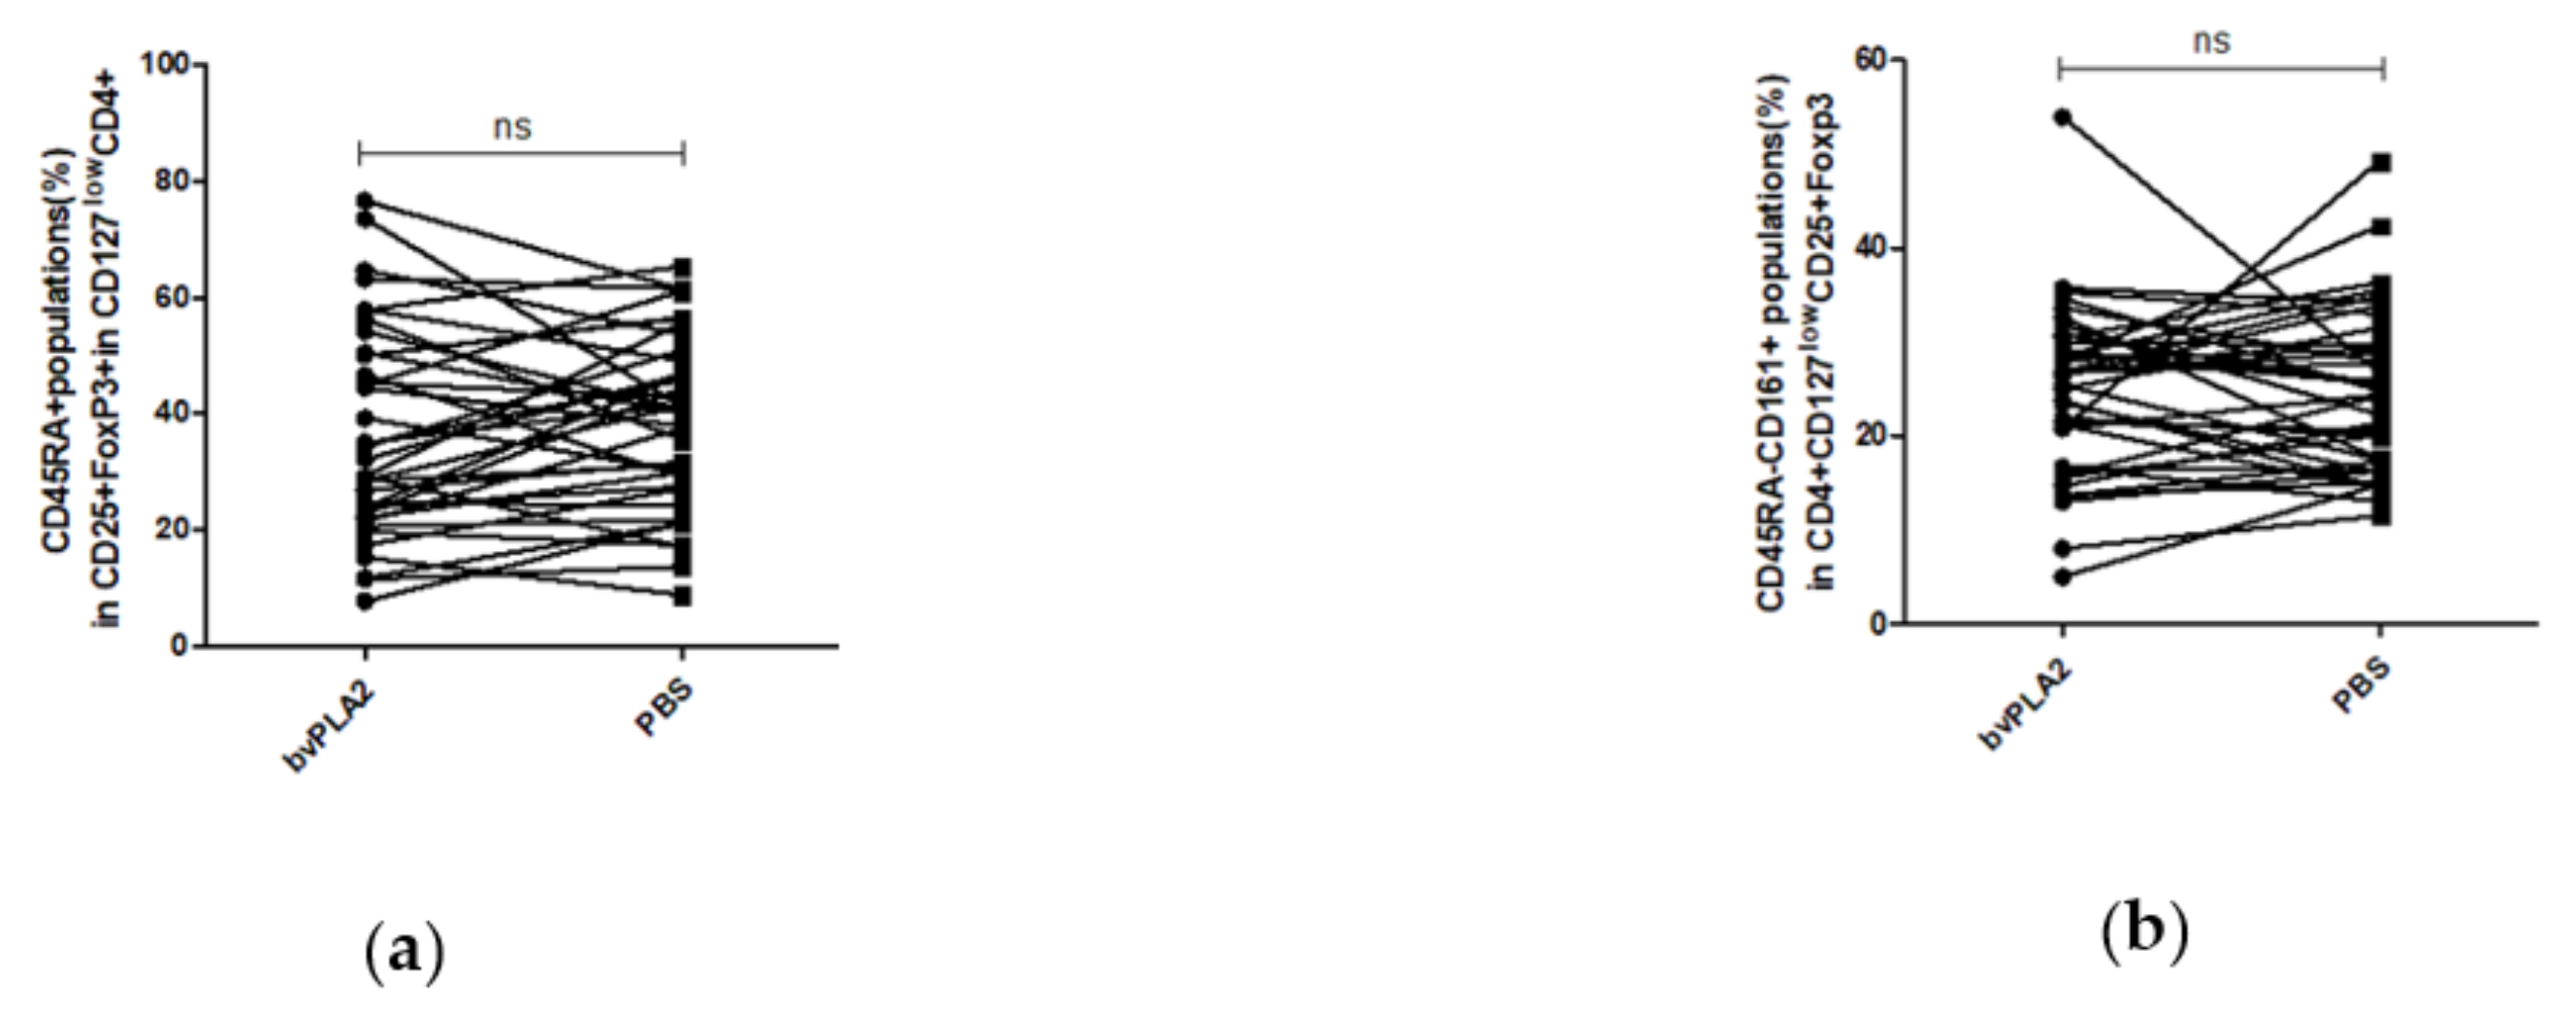
2.2. Effect of bvPLA2 Treatment on the Treg Subsets after Expansion in hPBMCs
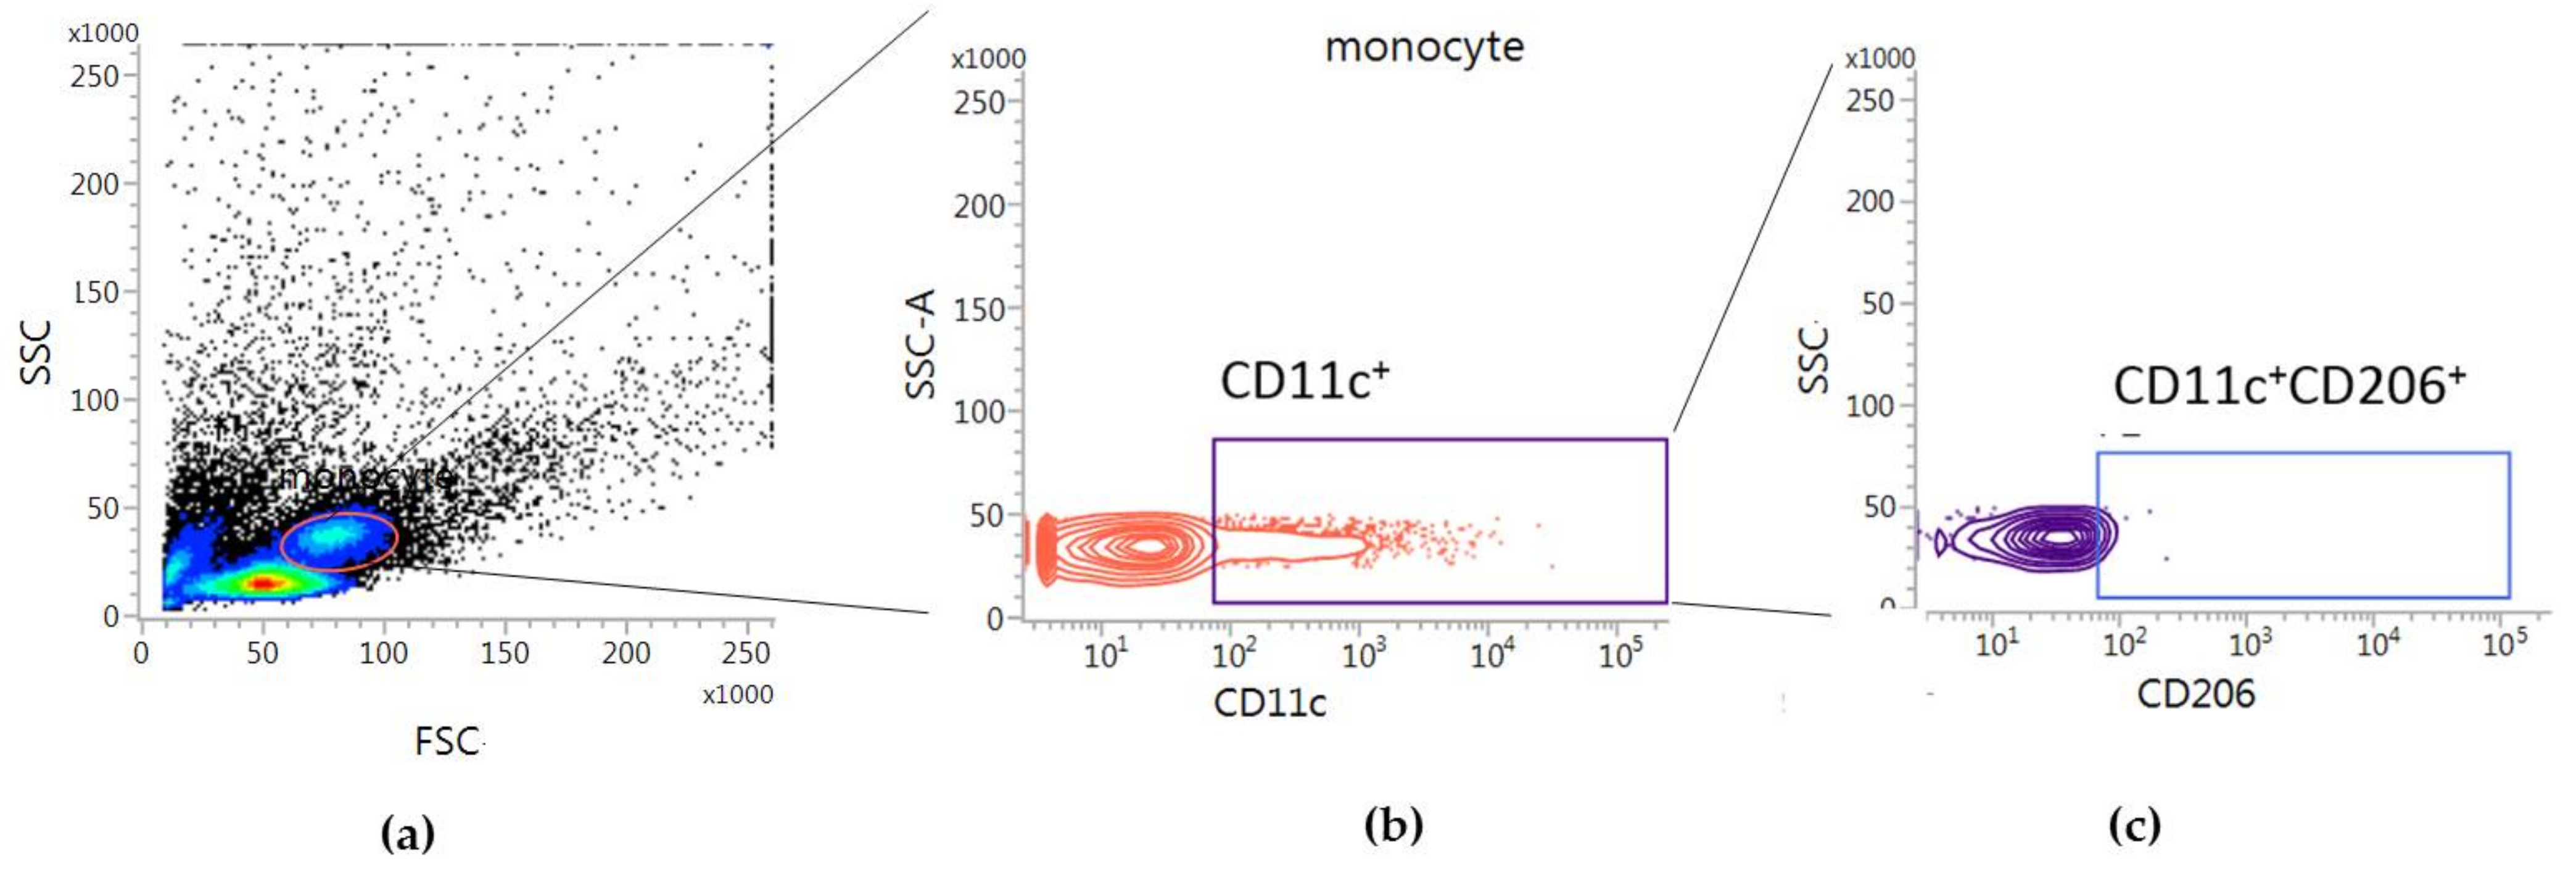
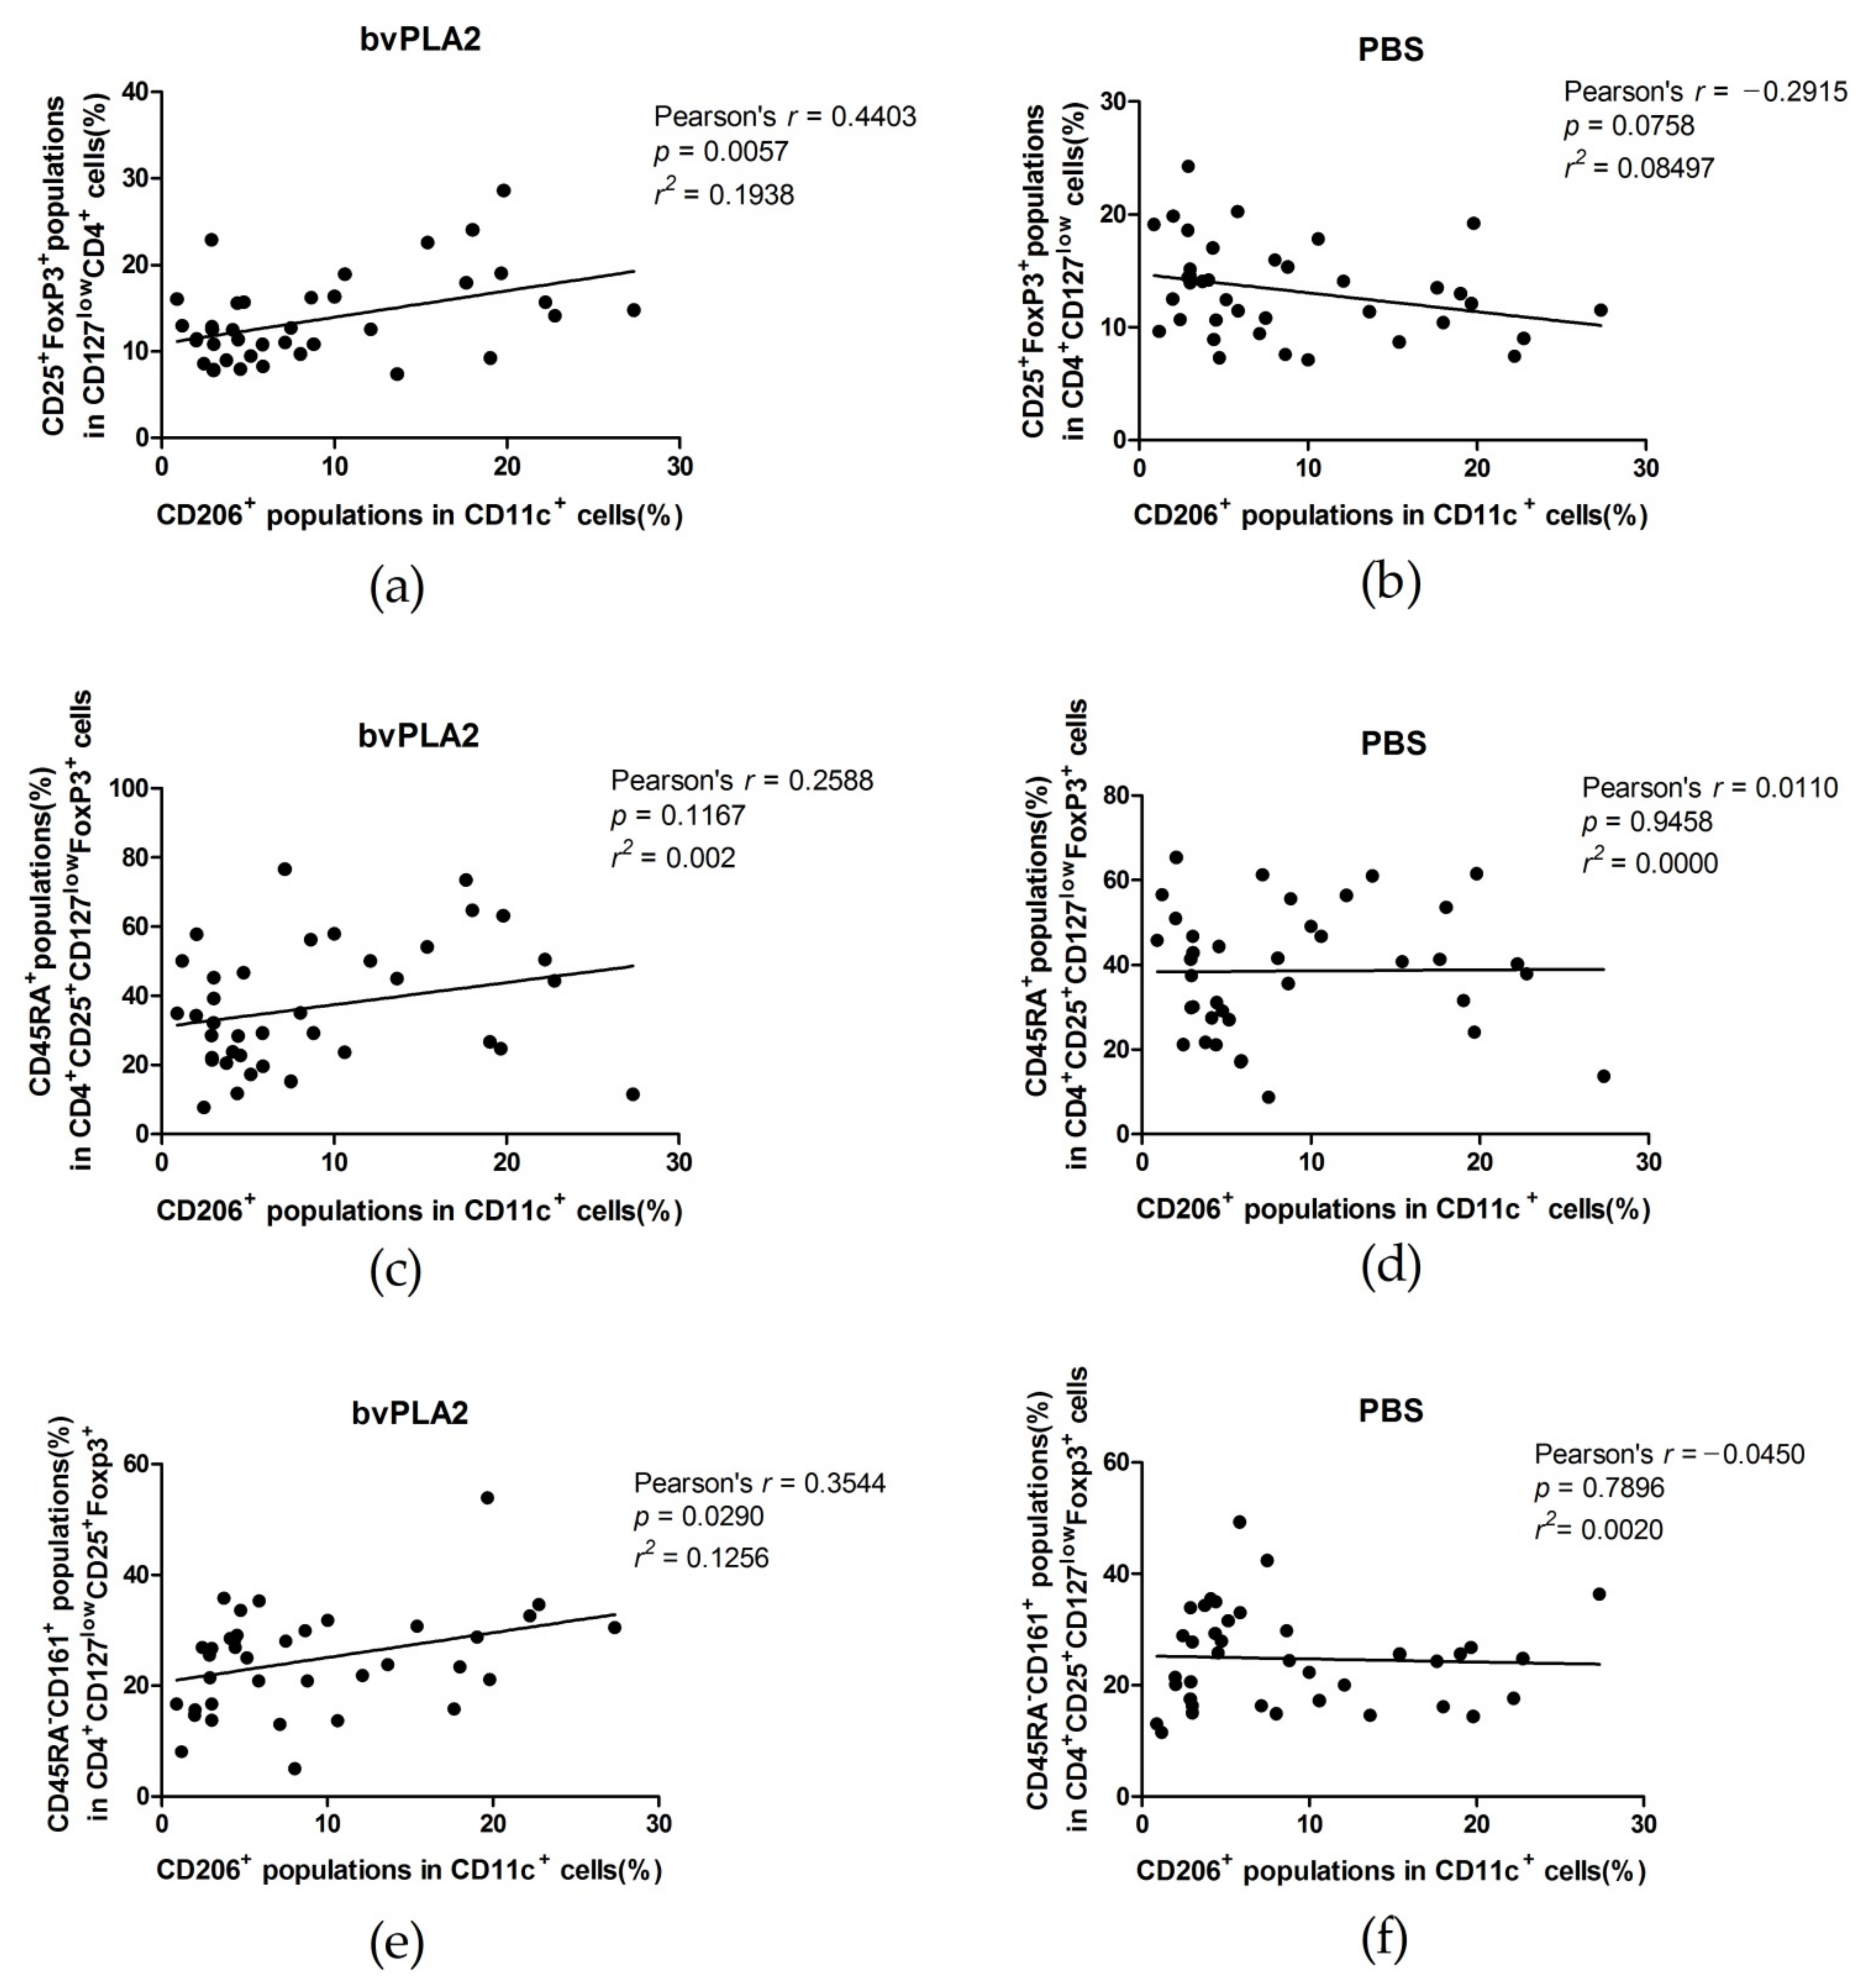
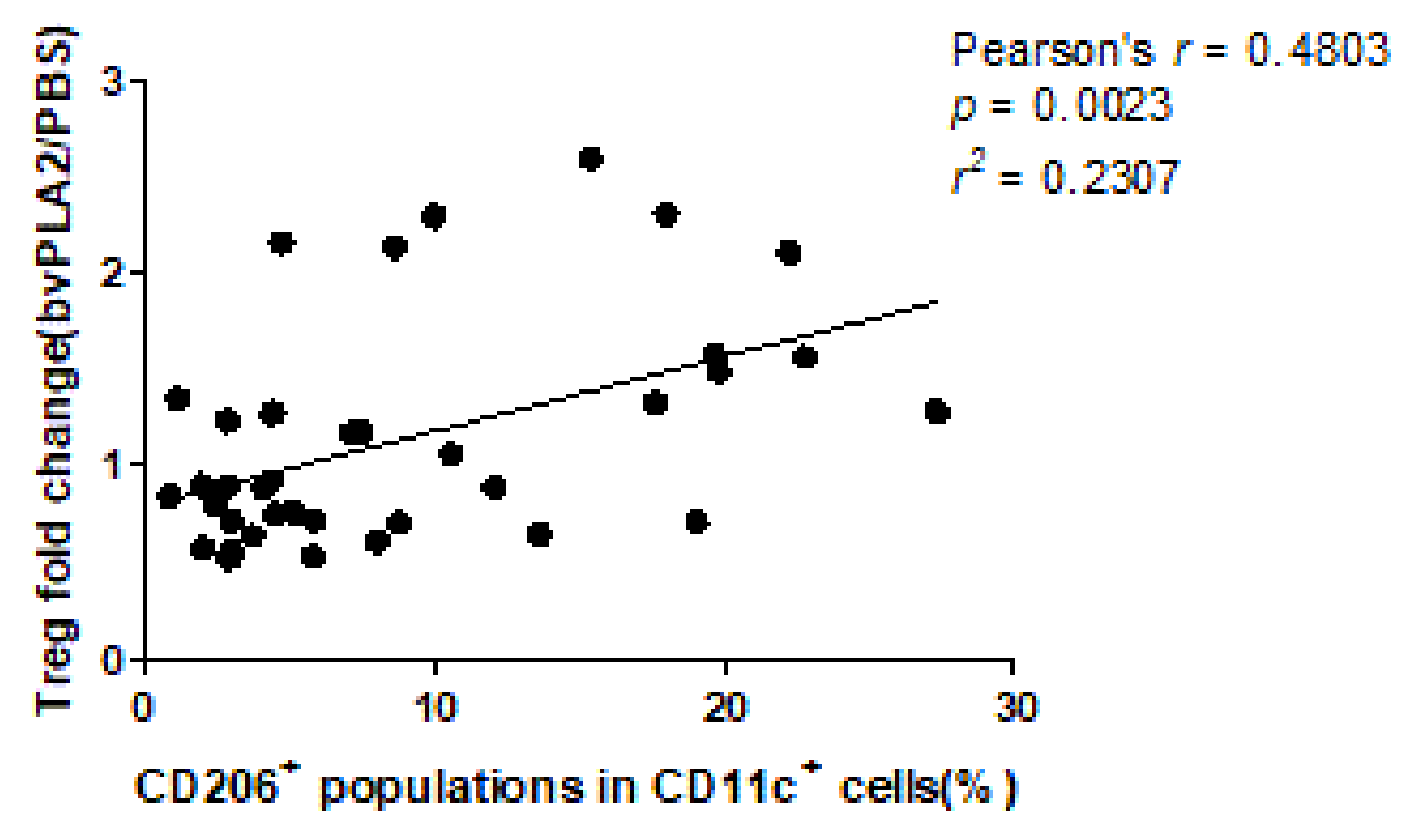
2.3. Correlations between Tregs after Treated with bvPLA2 or PBS and CD11c+CD206+ DCs in hPBMCs
3. Discussion
4. Conclusions
5. Materials and Methods
5.1. Isolation of Human Peripheral Blood Mononuclear Cells (hPBMCs)
5.2. Regulatory T Cell Expansion
5.3. Flow Cytometric Analysis
5.4. Statistical Analysis
Author Contributions
Funding
Institutional Review Board Statement
Informed Consent Statement
Data Availability Statement
Conflicts of Interest
References
- Kwon, Y.B.; Lee, J.D.; Lee, H.J.; Han, H.J.; Mar, W.C.; Kang, S.K.; Beitz, A.J.; Lee, J.H. Bee venom injection into an acupuncture point reduces arthritis associated edema and nociceptive responses. Pain 2001, 90, 271–280. [Google Scholar] [CrossRef]
- Kwon, Y.B.; Lee, H.J.; Han, H.J.; Mar, W.C.; Kang, S.K.; Yoon, O.B.; Beitz, A.J.; Lee, J.H. The water-soluble fraction of bee venom produces antinociceptive and anti-inflammatory effects on rheumatoid arthritis in rats. Life Sci. 2002, 71, 191–204. [Google Scholar] [CrossRef]
- Lee, S.H.; Choi, S.M.; Yang, E.J. Bee Venom Acupuncture Augments Anti-Inflammation in the Peripheral Organs of hSOD1G93A Transgenic Mice. Toxins 2015, 7, 2835–2844. [Google Scholar] [CrossRef] [PubMed] [Green Version]
- Cai, M.; Choi, S.M.; Yang, E.J. The effects of bee venom acupuncture on the central nervous system and muscle in an animal hSOD1G93A mutant. Toxins 2015, 7, 846–858. [Google Scholar] [CrossRef] [PubMed] [Green Version]
- Yang, E.J.; Jiang, J.H.; Lee, S.M.; Yang, S.C.; Hwang, H.S.; Lee, M.S.; Choi, S.M. Bee venom attenuates neuroinflammatory events and extends survival in amyotrophic lateral sclerosis models. J. Neuroinflamm. 2010, 7, 69. [Google Scholar] [CrossRef] [PubMed] [Green Version]
- Cho, S.Y.; Shim, S.R.; Rhee, H.Y.; Park, H.J.; Jung, W.S.; Moon, S.K.; Park, J.M.; Ko, C.N.; Cho, K.H.; Park, S.U. Effectiveness of acupuncture and bee venom acupuncture in idiopathic Parkinson’s disease. Park. Relat. Disord. 2012, 18, 948–952. [Google Scholar] [CrossRef]
- Gu, S.M.; Park, M.H.; Hwang, C.J.; Song, H.S.; Lee, U.S.; Han, S.B.; Oh, K.W.; Ham, Y.W.; Song, M.J.; Son, D.J.; et al. Bee venom ameliorates lipopolysaccharide-induced memory loss by preventing NF-kappaB pathway. J. Neuroinflamm. 2015, 12, 124. [Google Scholar] [CrossRef] [PubMed] [Green Version]
- Karimi, A.; Ahmadi, F.; Parivar, K.; Nabiuni, M.; Haghighi, S.; Imani, S.; Afrouzi, H. Effect of honey bee venom on lewis rats with experimental allergic encephalomyelitis, a model for multiple sclerosis. Iran. J. Pharm. Res. 2012, 11, 671–678. [Google Scholar] [PubMed]
- Orsolic, N. Bee venom in cancer therapy. Cancer Metastasis Rev. 2012, 31, 173–194. [Google Scholar] [CrossRef]
- Lee, W.R.; Kim, S.J.; Park, J.H.; Kim, K.H.; Chang, Y.C.; Park, Y.Y.; Lee, K.G.; Han, S.M.; Yeo, J.H.; Pak, S.C.; et al. Bee venom reduces atherosclerotic lesion formation via anti-inflammatory mechanism. Am. J. Chin. Med. 2010, 38, 1077–1092. [Google Scholar] [CrossRef]
- Sobotka, A.K.; Franklin, R.M.; Adkinson, N.F., Jr.; Valentine, M.; Baer, H.; Lichtenstein, L.M. Allergy to insect stings. II. Phospholipase A: The major allergen in honeybee venom. J. Allergy Clin. Immunol. 1976, 57, 29–40. [Google Scholar] [CrossRef]
- Kim, H.; Keum, D.J.; Kwak, J.; Chung, H.S.; Bae, H. Bee venom phospholipase A2 protects against acetaminophen-induced acute liver injury by modulating regulatory T cells and IL-10 in mice. PLoS ONE 2014, 9, e114726. [Google Scholar] [CrossRef] [PubMed]
- Kim, H.; Lee, H.; Lee, G.; Jang, H.; Kim, S.S.; Yoon, H.; Kang, G.H.; Hwang, D.S.; Kim, S.K.; Chung, H.S.; et al. Phospholipase A2 inhibits cisplatin-induced acute kidney injury by modulating regulatory T cells by the CD206 mannose receptor. Kidney Int. 2015, 88, 550–559. [Google Scholar] [CrossRef] [PubMed] [Green Version]
- Jung, K.H.; Baek, H.; Shin, D.; Lee, G.; Park, S.; Lee, S.; Choi, D.; Kim, W.; Bae, H. Protective Effects of Intratracheally-Administered Bee Venom Phospholipase A2 on Ovalbumin-Induced Allergic Asthma in Mice. Toxins 2016, 8, 269. [Google Scholar] [CrossRef] [Green Version]
- Park, S.; Baek, H.; Jung, K.H.; Lee, G.; Lee, H.; Kang, G.H.; Lee, G.; Bae, H. Bee venom phospholipase A2 suppresses allergic airway inflammation in an ovalbumin-induced asthma model through the induction of regulatory T cells. Immun. Inflamm. Dis. 2015, 3, 386–397. [Google Scholar] [CrossRef]
- Shin, D.; Lee, G.; Sohn, S.H.; Park, S.; Jung, K.H.; Lee, J.M.; Yang, J.; Cho, J.; Bae, H. Regulatory T Cells Contribute to the Inhibition of Radiation-Induced Acute Lung Inflammation via Bee Venom Phospholipase A(2) in Mice. Toxins 2016, 8, 131. [Google Scholar] [CrossRef] [Green Version]
- Jung, K.H.; Baek, H.; Kang, M.; Kim, N.; Lee, S.Y.; Bae, H. Bee Venom Phospholipase A2 Ameliorates House Dust Mite Extract Induced Atopic Dermatitis Like Skin Lesions in Mice. Toxins 2017, 9, 68. [Google Scholar] [CrossRef]
- Shin, D.; Choi, W.; Bae, H. Bee Venom Phospholipase A2 Alleviate House Dust Mite-Induced Atopic Dermatitis-Like Skin Lesions by the CD206 Mannose Receptor. Toxins 2018, 10, 146. [Google Scholar] [CrossRef] [Green Version]
- Li, D.; Lee, Y.; Kim, W.; Lee, K.; Bae, H.; Kim, S.K. Analgesic Effects of Bee Venom Derived Phospholipase A2 in a Mouse Model of Oxaliplatin-Induced Neuropathic Pain. Toxins 2015, 7, 2422. [Google Scholar] [CrossRef] [Green Version]
- Chung, E.S.; Lee, G.; Lee, C.; Ye, M.; Chung, H.S.; Kim, H.; Bae, S.J.; Hwang, D.S.; Bae, H. Bee Venom Phospholipase A2, a Novel Foxp3+ Regulatory T Cell Inducer, Protects Dopaminergic Neurons by Modulating Neuroinflammatory Responses in a Mouse Model of Parkinson’s Disease. J. Immunol. 2015, 195, 4853–4860. [Google Scholar] [CrossRef] [Green Version]
- Ye, M.; Chung, H.S.; Lee, C.; Hyun Song, J.; Shim, I.; Kim, Y.S.; Bae, H. Bee venom phospholipase A2 ameliorates motor dysfunction and modulates microglia activation in Parkinson’s disease alpha-synuclein transgenic mice. Exp. Mol. Med. 2016, 48, 244. [Google Scholar] [CrossRef] [Green Version]
- Ye, M.; Chung, H.S.; Lee, C.; Yoon, M.S.; Yu, A.R.; Kim, J.S.; Hwang, D.S.; Shim, I.; Bae, H. Neuroprotective effects of bee venom phospholipase A2 in the 3xTg AD mouse model of Alzheimer’s disease. J. Neuroinflamm. 2016, 13, 10. [Google Scholar] [CrossRef] [Green Version]
- Baek, H.; Lee, C.J.; Choi, D.B.; Kim, N.S.; Kim, Y.S.; Ye, Y.J.; Kim, Y.S.; Kim, J.S.; Shim, I.; Bae, H. Bee venom phospholipase A2 ameliorates Alzheimer’s disease pathology in Abeta vaccination treatment without inducing neuro-inflammation in a 3xTg-AD mouse model. Sci. Rep. 2018, 8, 17369. [Google Scholar] [CrossRef] [PubMed]
- Putz, T.; Ramoner, R.; Gander, H.; Rahm, A.; Bartsch, G.; Thurnher, M. Antitumor action and immune activation through cooperation of bee venom secretory phospholipase A2 and phosphatidylinositol-(3,4)-bisphosphate. Cancer Immunol. Immunother. 2006, 55, 1374–1383. [Google Scholar] [CrossRef] [PubMed]
- Putz, T.; Ramoner, R.; Gander, H.; Rahm, A.; Bartsch, G.; Bernardo, K.; Ramsay, S.; Thurnher, M. Bee venom secretory phospholipase A2 and phosphatidylinositol-homologues cooperatively disrupt membrane integrity, abrogate signal transduction and inhibit proliferation of renal cancer cells. Cancer Immunol. Immunother. 2007, 56, 627–640. [Google Scholar] [CrossRef]
- Uddin, M.B.; Lee, B.H.; Nikapitiya, C.; Kim, J.H.; Kim, T.H.; Lee, H.C.; Kim, C.G.; Lee, J.S.; Kim, C.J. Inhibitory effects of bee venom and its components against viruses in vitro and in vivo. J. Microbiol. 2016, 54, 853–866. [Google Scholar] [CrossRef]
- Hollander, T.; Aeed, P.A.; Elhammer, Å.P. Characterization of the oligosaccharide structures on bee venom phospholipase A2. Carbohydr. Res. 1993, 247, 291–297. [Google Scholar] [CrossRef]
- März, L.; Kühne, C.; Michl, H. The glycoprotein nature of phospholipase A2, hyaluronidase and acid phosphatase from honey-bee venom. Toxicon 1983, 21, 893–896. [Google Scholar] [CrossRef]
- Mustafa, F.B.; Ng, F.S.; Nguyen, T.H.; Lim, L.H. Honeybee venom secretory phospholipase A2 induces leukotriene production but not histamine release from human basophils. Clin. Exp. Immunol. 2008, 151, 94–100. [Google Scholar] [CrossRef]
- Mukhopadhyay, A.; Stahl, P. Bee venom phospholipase A2 is recognized by the macrophage mannose receptor. Arch. Biochem. Biophys. 1995, 324, 78–84. [Google Scholar] [CrossRef]
- Sakaguchi, S.; Sakaguchi, N.; Asano, M.; Itoh, M.; Toda, M. Immunologic self-tolerance maintained by activated T cells expressing IL-2 receptor alpha-chains (CD25). Breakdown of a single mechanism of self-tolerance causes various autoimmune diseases. J. Immunol. 1995, 155, 1151–1164. [Google Scholar]
- Sakaguchi, S.; Yamaguchi, T.; Nomura, T.; Ono, M. Regulatory T cells and immune tolerance. Cell 2008, 133, 775–787. [Google Scholar] [CrossRef] [Green Version]
- Sakaguchi, S.; Miyara, M.; Costantino, C.M.; Hafler, D.A. FOXP3+ regulatory T cells in the human immune system. Nat. Rev. Immunol. 2010, 10, 490–500. [Google Scholar] [CrossRef] [PubMed]
- Tarbell, K.V.; Yamazaki, S.; Olson, K.; Toy, P.; Steinman, R.M. CD25+ CD4+ T cells, expanded with dendritic cells presenting a single autoantigenic peptide, suppress autoimmune diabetes. J. Exp. Med. 2004, 199, 1467–1477. [Google Scholar] [CrossRef] [PubMed]
- Yamazaki, S.; Iyoda, T.; Tarbell, K.; Olson, K.; Velinzon, K.; Inaba, K.; Steinman, R.M. Direct expansion of functional CD25+ CD4+ regulatory T cells by antigen-processing dendritic cells. J. Exp. Med. 2003, 198, 235–247. [Google Scholar] [CrossRef] [PubMed]
- Miyara, M.; Yoshioka, Y.; Kitoh, A.; Shima, T.; Wing, K.; Niwa, A.; Parizot, C.; Taflin, C.; Heike, T.; Valeyre, D.; et al. Functional delineation and differentiation dynamics of human CD4+ T cells expressing the FoxP3 transcription factor. Immunity 2009, 30, 899–911. [Google Scholar] [CrossRef] [PubMed] [Green Version]
- Yue, H.Y.; Fujita, T.; Kumamoto, E. Phospholipase A2 activation by melittin enhances spontaneous glutamatergic excitatory transmission in rat substantia gelatinosa neurons. Neuroscience 2005, 135, 485–495. [Google Scholar] [CrossRef]
- Von Allmen, C.E.; Schmitz, N.; Bauer, M.; Hinton, H.J.; Kurrer, M.O.; Buser, R.B.; Gwerder, M.; Muntwiler, S.; Sparwasser, T.; Beerli, R.R.; et al. Secretory phospholipase A2-IID is an effector molecule of CD4+CD25+ regulatory T cells. Proc. Natl. Acad. Sci. USA 2009, 106, 11673–11678. [Google Scholar] [CrossRef] [Green Version]
- Hartigan-O’Connor, D.J.; Poon, C.; Sinclair, E.; McCune, J.M. Human CD4+ regulatory T cells express lower levels of the IL-7 receptor alpha chain (CD127), allowing consistent identification and sorting of live cells. J. Immunol. Methods 2007, 319, 41–52. [Google Scholar] [CrossRef] [PubMed]
- Baecher-Allan, C.; Viglietta, V.; Hafler, D.A. Human CD4+CD25+ regulatory T cells. Semin. Immunol. 2004, 16, 89–98. [Google Scholar] [CrossRef]
- Gambineri, E.; Torgerson, T.R.; Ochs, H.D. Immune dysregulation, polyendocrinopathy, enteropathy, and X-linked inheritance (IPEX), a syndrome of systemic autoimmunity caused by mutations of FOXP3, a critical regulator of T-cell homeostasis. Curr. Opin. Rheumatol. 2003, 15, 430–435. [Google Scholar] [CrossRef] [PubMed]
- Fontenot, J.D.; Gavin, M.A.; Rudensky, A.Y. Foxp3 programs the development and function of CD4+CD25+ regulatory T cells. Nat. Immunol. 2003, 4, 330–336. [Google Scholar] [CrossRef]
- Hori, S.; Nomura, T.; Sakaguchi, S. Control of regulatory T cell development by the transcription factor Foxp3. Science 2003, 299, 1057–1061. [Google Scholar] [CrossRef] [Green Version]
- Seddiki, N.; Santner-Nanan, B.; Martinson, J.; Zaunders, J.; Sasson, S.; Landay, A.; Solomon, M.; Selby, W.; Alexander, S.I.; Nanan, R.; et al. Expression of interleukin (IL)-2 and IL-7 receptors discriminates between human regulatory and activated T cells. J. Exp. Med. 2006, 203, 1693–1700. [Google Scholar] [CrossRef]
- Kawashiri, S.Y.; Kawakami, A.; Okada, A.; Koga, T.; Tamai, M.; Yamasaki, S.; Nakamura, H.; Origuchi, T.; Ida, H.; Eguchi, K. CD4+CD25(high)CD127(low/-) Treg cell frequency from peripheral blood correlates with disease activity in patients with rheumatoid arthritis. J. Rheumatol. 2011, 38, 2517–2521. [Google Scholar] [CrossRef] [Green Version]
- Dejaco, C.; Duftner, C.; Grubeck-Loebenstein, B.; Schirmer, M. Imbalance of regulatory T cells in human autoimmune diseases. Immunology 2006, 117, 289–300. [Google Scholar] [CrossRef]
- Le Page, A.; Garneau, H.; Dupuis, G.; Frost, E.H.; Larbi, A.; Witkowski, J.M.; Pawelec, G.; Fulop, T. Differential Phenotypes of Myeloid-Derived Suppressor and T Regulatory Cells and Cytokine Levels in Amnestic Mild Cognitive Impairment Subjects Compared to Mild Alzheimer Diseased Patients. Front. Immunol. 2017, 8, 783. [Google Scholar] [CrossRef]
- Saresella, M.; Calabrese, E.; Marventano, I.; Piancone, F.; Gatti, A.; Calvo, M.G.; Nemni, R.; Clerici, M. PD1 negative and PD1 positive CD4+ T regulatory cells in mild cognitive impairment and Alzheimer’s disease. J. Alzheimers Dis. 2010, 21, 927–938. [Google Scholar] [CrossRef] [PubMed]
- Goldeck, D.; Witkowski, J.M.; Fulop, T.; Pawelec, G. Peripheral Immune Signatures in Alzheimer Disease. Curr. Alzheimer Res. 2016, 13, 739–749. [Google Scholar] [CrossRef]
- Qu, C.; Brinck-Jensen, N.-S.; Zang, M.; Chen, K. Monocyte-derived dendritic cells: Targets as potent antigen-presenting cells for the design of vaccines against infectious diseases. Int. J. Infect. Dis. 2014, 19, 1–5. [Google Scholar] [CrossRef] [PubMed] [Green Version]
- Baratelli, F.; Lin, Y.; Zhu, L.; Yang, S.C.; Heuze-Vourc’h, N.; Zeng, G.; Reckamp, K.; Dohadwala, M.; Sharma, S.; Dubinett, S.M. Prostaglandin E2 induces FOXP3 gene expression and T regulatory cell function in human CD4+ T cells. J. Immunol. 2005, 175, 1483–1490. [Google Scholar] [CrossRef] [PubMed] [Green Version]
- Mukaka, M.M. Statistics corner: A guide to appropriate use of correlation coefficient in medical research. Malawi Med. J. 2012, 24, 69–71. [Google Scholar] [PubMed]


Publisher’s Note: MDPI stays neutral with regard to jurisdictional claims in published maps and institutional affiliations. |
© 2021 by the authors. Licensee MDPI, Basel, Switzerland. This article is an open access article distributed under the terms and conditions of the Creative Commons Attribution (CC BY) license (https://creativecommons.org/licenses/by/4.0/).
Share and Cite
Jo, H.; Baek, H.; Park, S.-Y.; Goo, B.; Jung, W.-S.; Bae, H.; Nam, S.-S. The Responsiveness of Bee Venom Phospholipase A2 on Regulatory T Cells Correlates with the CD11c+CD206+Population in Human Peripheral Blood Mononuclear Cells. Toxins 2021, 13, 717. https://0-doi-org.brum.beds.ac.uk/10.3390/toxins13100717
Jo H, Baek H, Park S-Y, Goo B, Jung W-S, Bae H, Nam S-S. The Responsiveness of Bee Venom Phospholipase A2 on Regulatory T Cells Correlates with the CD11c+CD206+Population in Human Peripheral Blood Mononuclear Cells. Toxins. 2021; 13(10):717. https://0-doi-org.brum.beds.ac.uk/10.3390/toxins13100717
Chicago/Turabian StyleJo, Heejin, Hyunjung Baek, Seon-Young Park, Bonhyuk Goo, Woo-Sang Jung, Hyunsu Bae, and Sang-Soo Nam. 2021. "The Responsiveness of Bee Venom Phospholipase A2 on Regulatory T Cells Correlates with the CD11c+CD206+Population in Human Peripheral Blood Mononuclear Cells" Toxins 13, no. 10: 717. https://0-doi-org.brum.beds.ac.uk/10.3390/toxins13100717