Article

Validation of New ELISA Technique for Detection of Aflatoxin B1 Contamination in Food Products versus HPLC and VICAM

by
Elsayed Hafez
1,
Nourhan M. Abd El-Aziz
2,
Amira M. G. Darwish
2,
Mohamed G. Shehata
2,*,
Amira A. Ibrahim
1,
Asmaa M. Elframawy
3 and
Ahmed N. Badr
4
1
Department of Plant Protection and Biomolecular Diagnosis, Arid Lands Cultivation Research Institute (ALCRI), City of Scientific Research and Technological Applications (SRTA-City), Alexandria 21934, Egypt
2
Department of Food Technology, Arid Lands Cultivation Research Institute (ALCRI), City of Scientific Research and Technological Applications (SRTA-City), Alexandria 21934, Egypt
3
Nucleic Acids Research Department, Genetic Engineering & Biotechnology Research Institute (GEBRI), City of Scientific Research and Technological Applications (SRTA-City), Alexandria 21934, Egypt
4
Food Toxicology and Contaminants Department, National Research Centre, Dokki, Cairo 12622, Egypt
*
Author to whom correspondence should be addressed.
Submission received: 16 July 2021 / Revised: 8 October 2021 / Accepted: 8 October 2021 / Published: 21 October 2021
(This article belongs to the Special Issue Application of Novel Methods for Mycotoxins Analysis)

Abstract

:
Toxin-contaminated foods and beverages are a major source of illness, may cause death, and have a significant negative economic impact worldwide. Aflatoxin B1 (AFB1) is a potent toxin that may induce cancer after chronic low-level exposure. This study developed a quantitative recombinant AflR gene antiserum ELISA technique for aflatoxin B1 detection in contaminated food products. Aflatoxin B1 residuals from 36 food samples were analyzed with HPLC and VICAM. DNA was extracted from aflatoxin-contaminated samples and the AflR gene amplified using PCR. PCR products were purified and ligated into the pGEM-T vector. Recombinant plasmids were sequenced and transformed into competent E. coli (BL21). Molecular size and B-cell epitope prediction for the recombinant protein were assessed. The purified protein was used to induce the production of IgG antibodies in rabbits. Serum IgG was purified and labeled with alkaline phosphatase. Finally, indirect-ELISA was used to test the effectiveness of polyclonal antibodies for detection of aflatoxin B1 in food samples.
Key Contribution: The indirect-ELISA technique was compared with HPLC and the VICAM system in food samples. The new technique showed reasonable accuracy; cost- and time-effective detection of aflatoxin B1.

1. Introduction

Mycotoxins are toxic secondary metabolites produced naturally by many fungi under certain growth conditions. These toxins affect metabolic processes and cause disease and death in humans and animals [1]. Toxicological actions of mycotoxins are recognized but few of these compounds or their derivatives are identified as antibiotics, growth promoters, or other drugs. Major mycotoxins include aflatoxins, gliotoxin, citrinin, ergot alkaloids, fumonisins, ochratoxin, and patulin [2].
Humans do not produce antibodies to mycotoxins and cannot be immunized against their toxicity. Nearly 25% of food becomes inedible due to contamination with mycotoxins; aflatoxins are the most serious source of contamination [3]. In 1993, aflatoxin is classified as a class one carcinogen by the World Health Organization Cancer Research Institute. Aflatoxin causes hepatotoxicity in both humans and animals. Exposure to this toxin can lead to liver cancer and death. The chemical is a bifuran toxoid produced by strains of Aspergillus flavus and Aspergillus parasiticus. About 20 derivatives are recognized, for example, B1, B2, G1, G2, M1, and M2. Aflatoxin B1 (AFB1) is the most potent and carcinogenic [4]. Aflatoxins M1 and M2 are hydroxylated metabolites of aflatoxin B1 produced by animals and commonly exist in milk and dairy products. The toxins are not common in grains. AFB1 is detected on the surfaces of maize and peanuts.
Toxicity of and exposure to AFB1 has been extensively investigated. The toxin may result in severe disease, including carcinogenesis, mutagenesis, growth retardation, and immune suppression [5]. The aflatoxin-producing fungus, P. flavus, grows and produces aflatoxins on preharvest maize and on maize in storage [6]. Peanuts are also susceptible to Aspergillus infection in the field or during storage. Both maize and peanuts are rich nutrient sources for these fungi [7]. Aflatoxin-contaminated agricultural products may pose serious health risks to humans and animals and negatively affect international trade [8]. According to the Food and Drug Administration (FDA) in the USA, an acceptable aflatoxin level in food is 0 ppb.
Typically, high-performance liquid chromatography (HPLC) and liquid chromatography mass spectrometry (LC-MS) are used for quantification of aflatoxins. LC-MS/MS can detect trace levels, but some limits exist. Chemical detection is slower than spectral detection (hours vs. seconds) and tedious. Professional analysts and precise chemical instruments are required [9]. Thus, accurate, rapid, full-scale detection of AFB1 is important in assessing human health and economic impacts. Evaluating contaminated food directly for specific fungi using genes that control aflatoxin is a promising strategy [10]. Gallo et al. [11] reported such genes in the genome of aflatoxin-producing fungi. However, the authors’ method required costly instruments, amplification, isolation, and quantification along with trained personnel [12]. The method is quite complex and costly for routine use. This study aimed to develop a new cost- and time-effective quantitative method using modified recombinant AflR gene antiserum enzyme-linked immunoassay (ELISA) for aflatoxin B1 detection in contaminated food products.

2. Results and Discussion

2.1. The Aflatoxin B1 Detection with HPLC and VICAM

VICAM was less sensitive than HPLC analysis for aflatoxin AFB1 detection in several samples—peanut 2, flours 2 and 3, and milk-powder 3. HPLC is widely used for the analysis of aflatoxins for sensitivity and accuracy [13] (Table 1). HPLC is an excellent quantitative method in detection of aflatoxins [14], although it requires skilled operators, extensive sample preparation, and is a high-cost equipment [15].

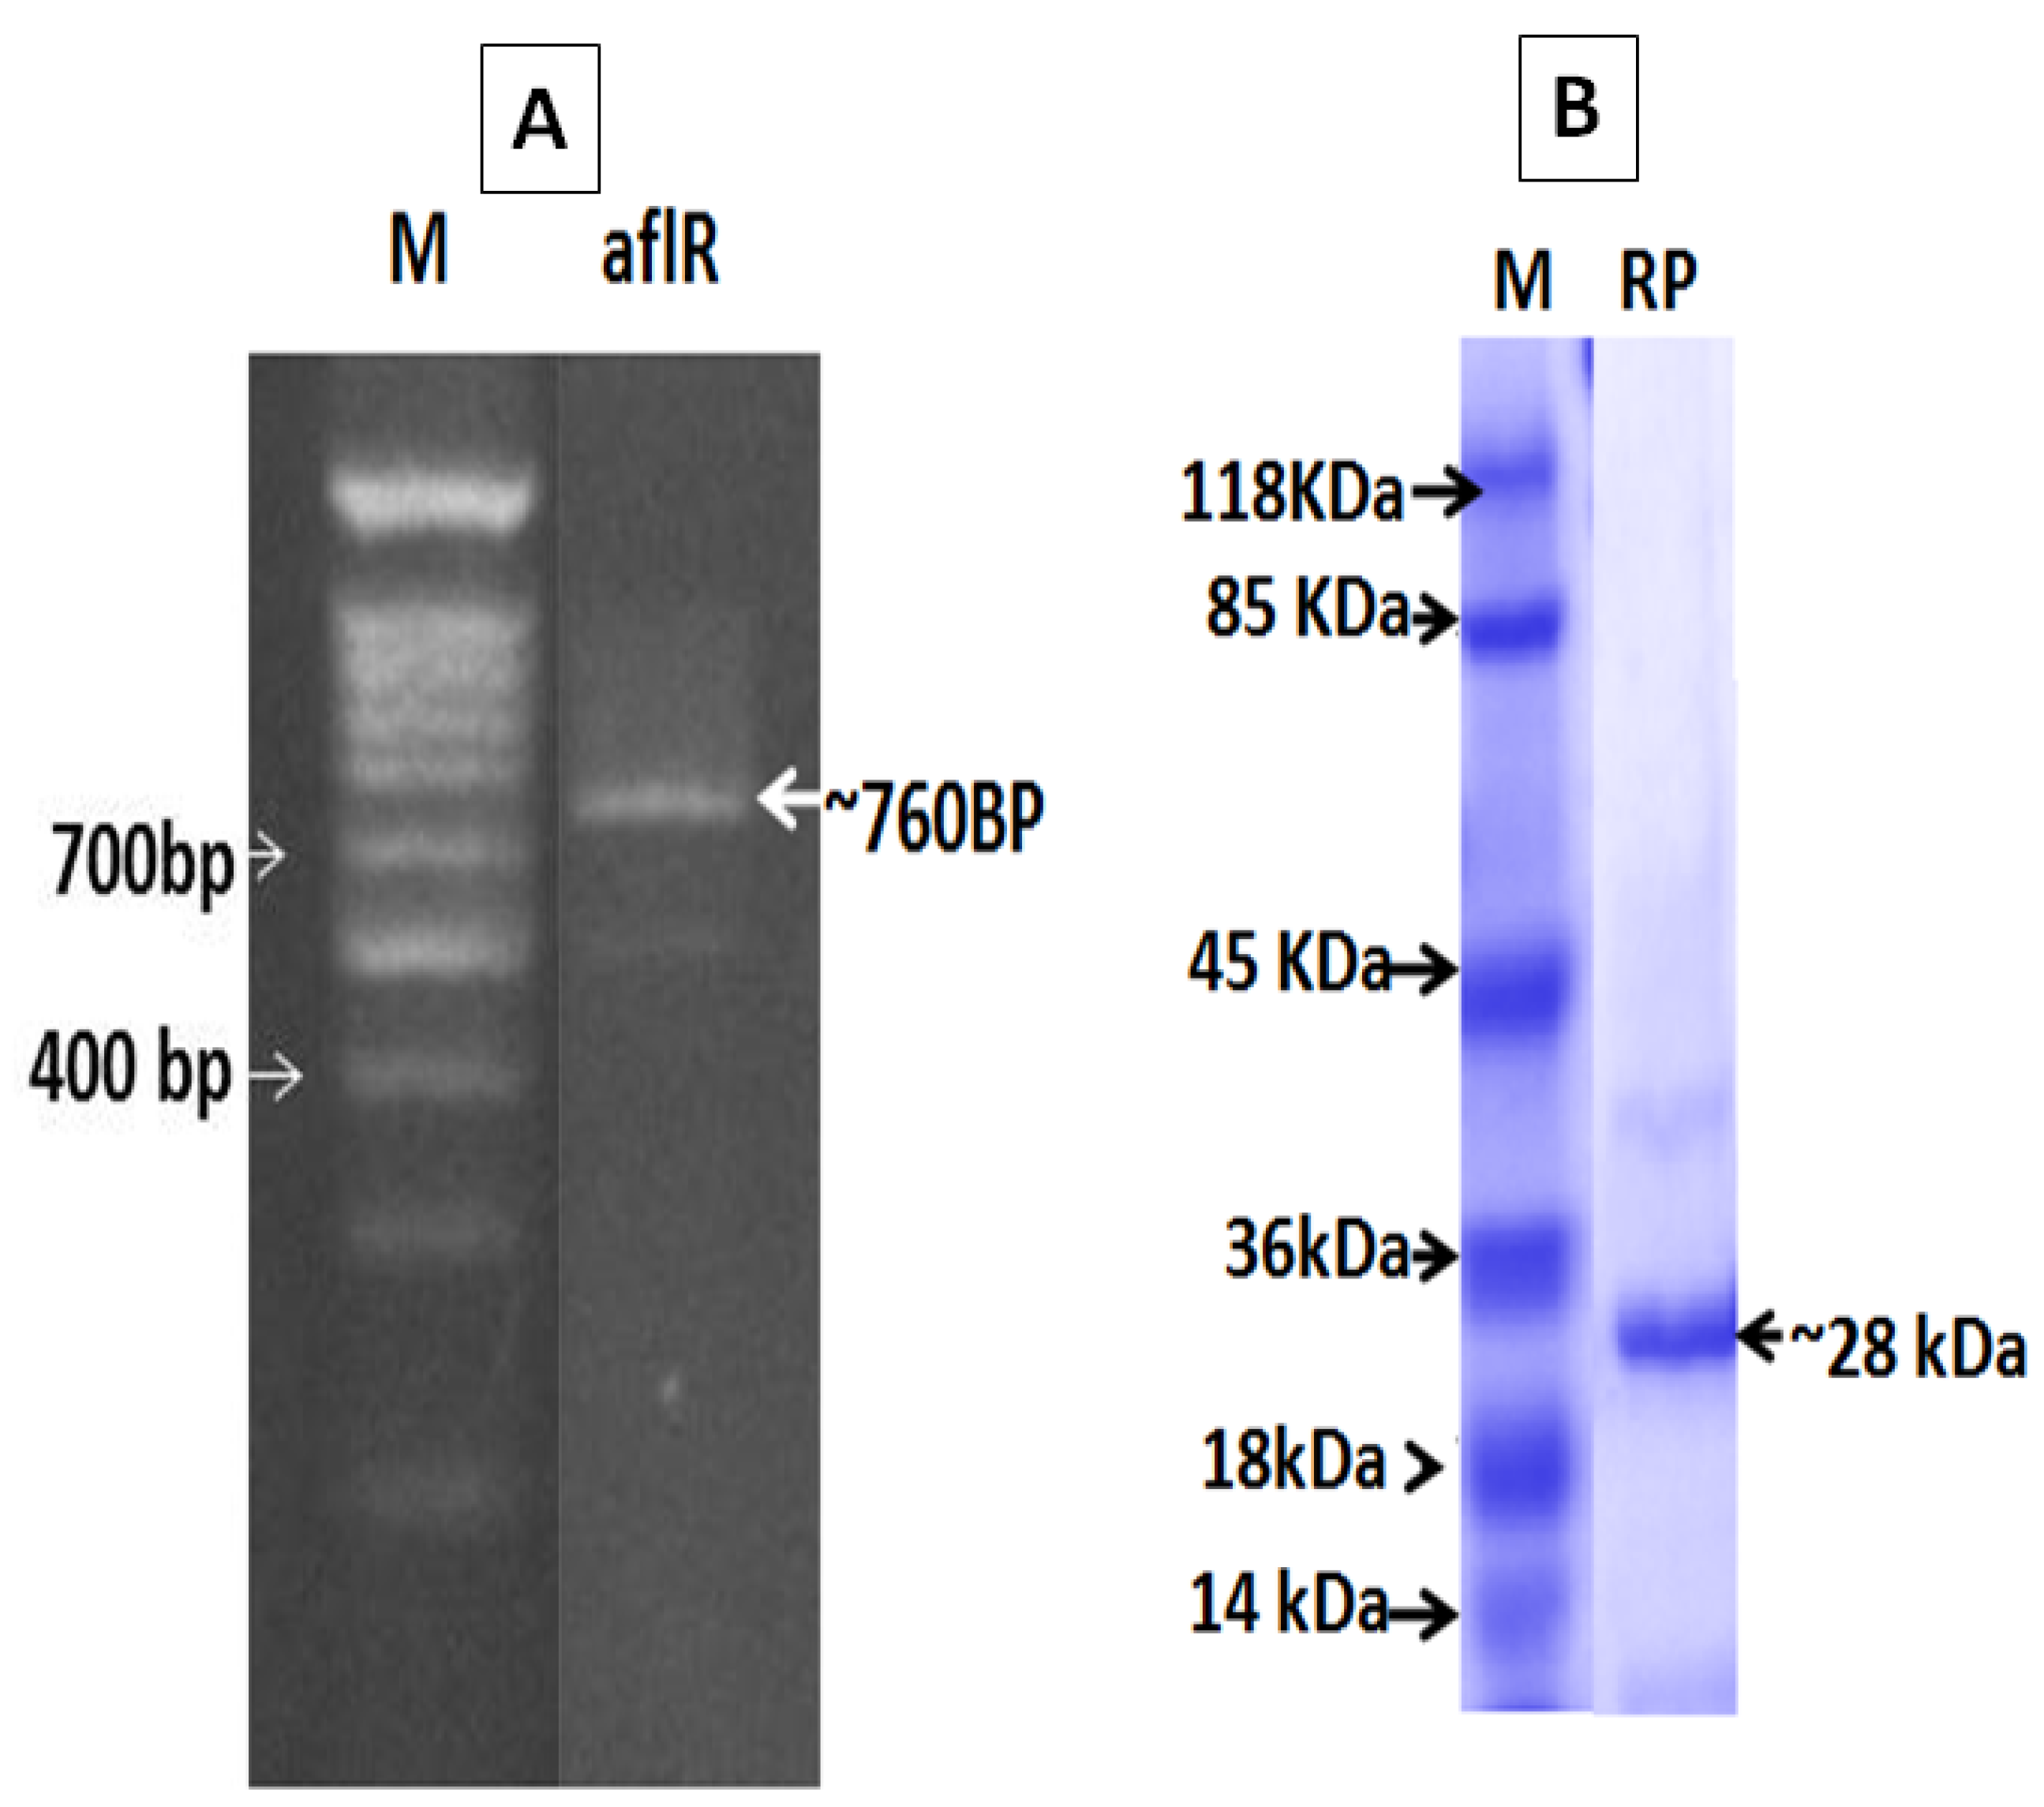
2.2. Molecular Detection and SDS-PAGE

A unique band at about 760 bp was observed in all positive samples (Figure 1A). Negative amplification was observed in flour contaminated with aflatoxin (50, 75, and 100 mg). Amplified DNA was cloned and in vitro transcribed protein was separated on SDS-PAGE (Figure 1B). SDS-PAGE analysis revealed a protein of about 28 kDa. Molecular weight determination regarded as first characterization step of protein was further used in toxin detection.

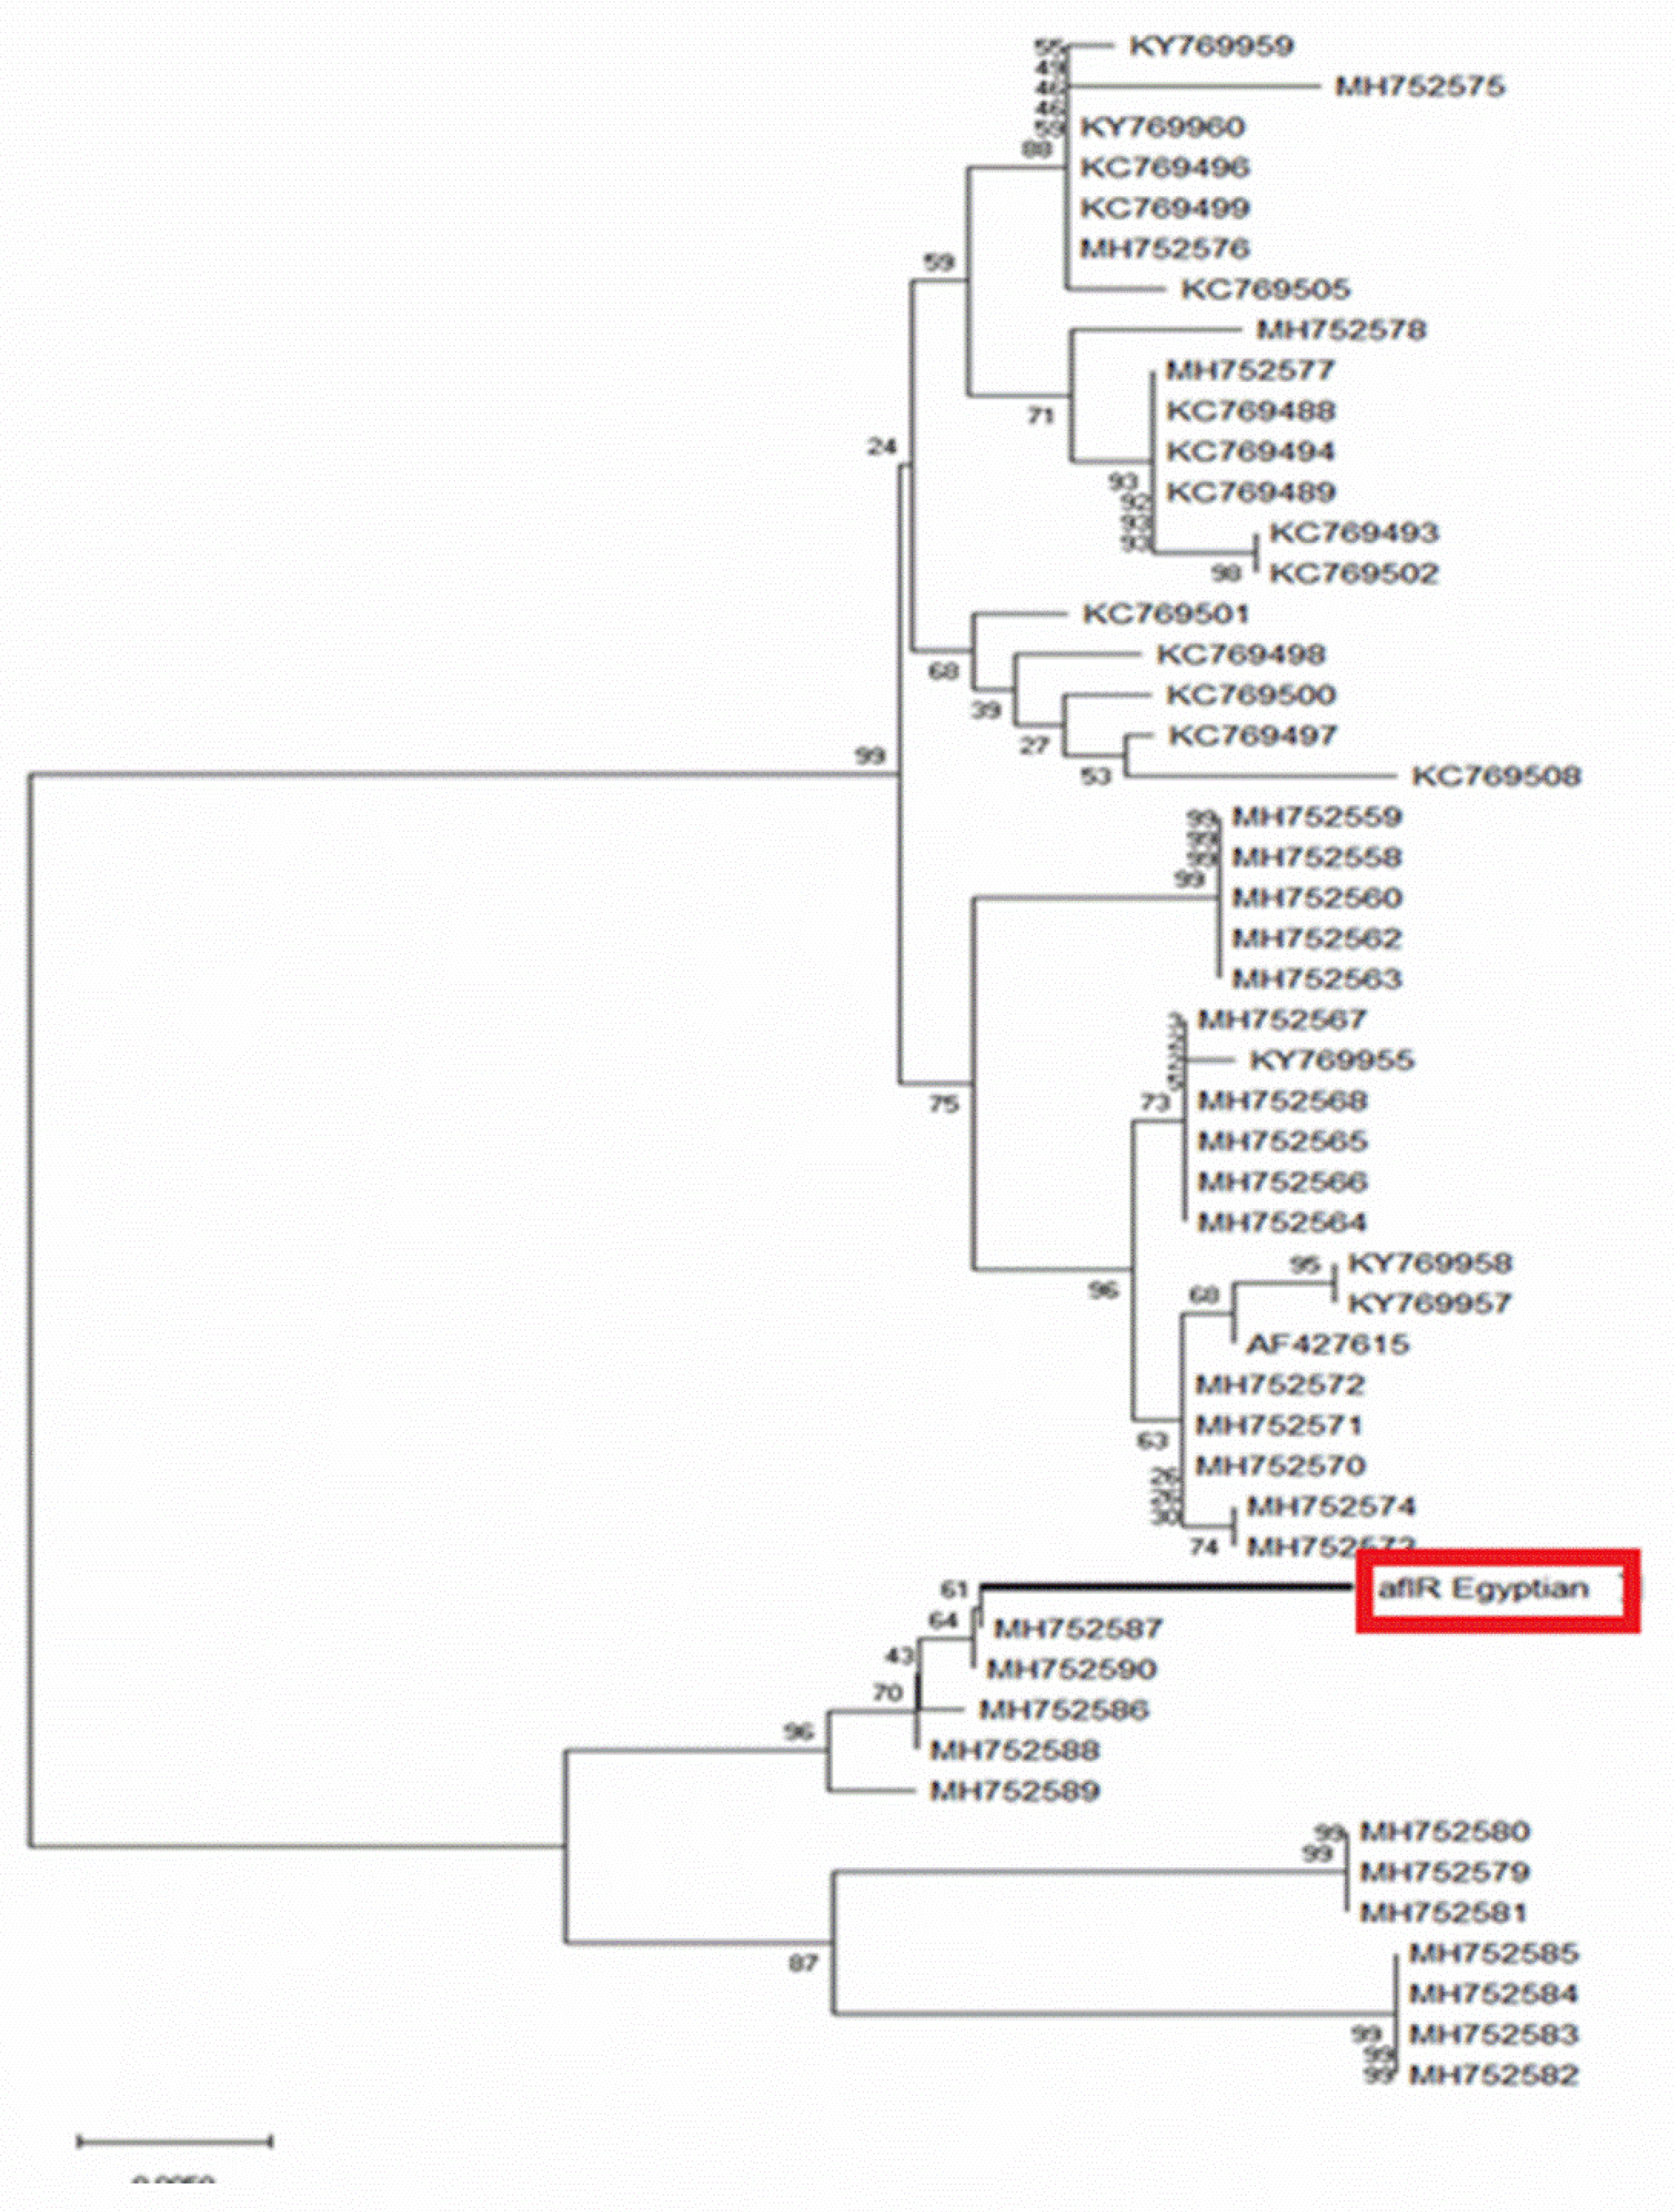
2.3. Sequence Analysis and Phylogenic Construction

The PCR product was purified and sequenced and a 750 bp fragment was obtained. The sequence was aligned using the NCBI analysis tool and showed 97% similarity with other AfIR genes listed in GeneBank. The sequence was compared with 50 sequences and a phylogenetic tree was constructed. An Egyptian AfIR gene was closely similar to AfIR gene MH752587 obtained from Aspergillus sp. PS-2018c isolate BN038G AFlR, Arizona, USA (Figure 2).

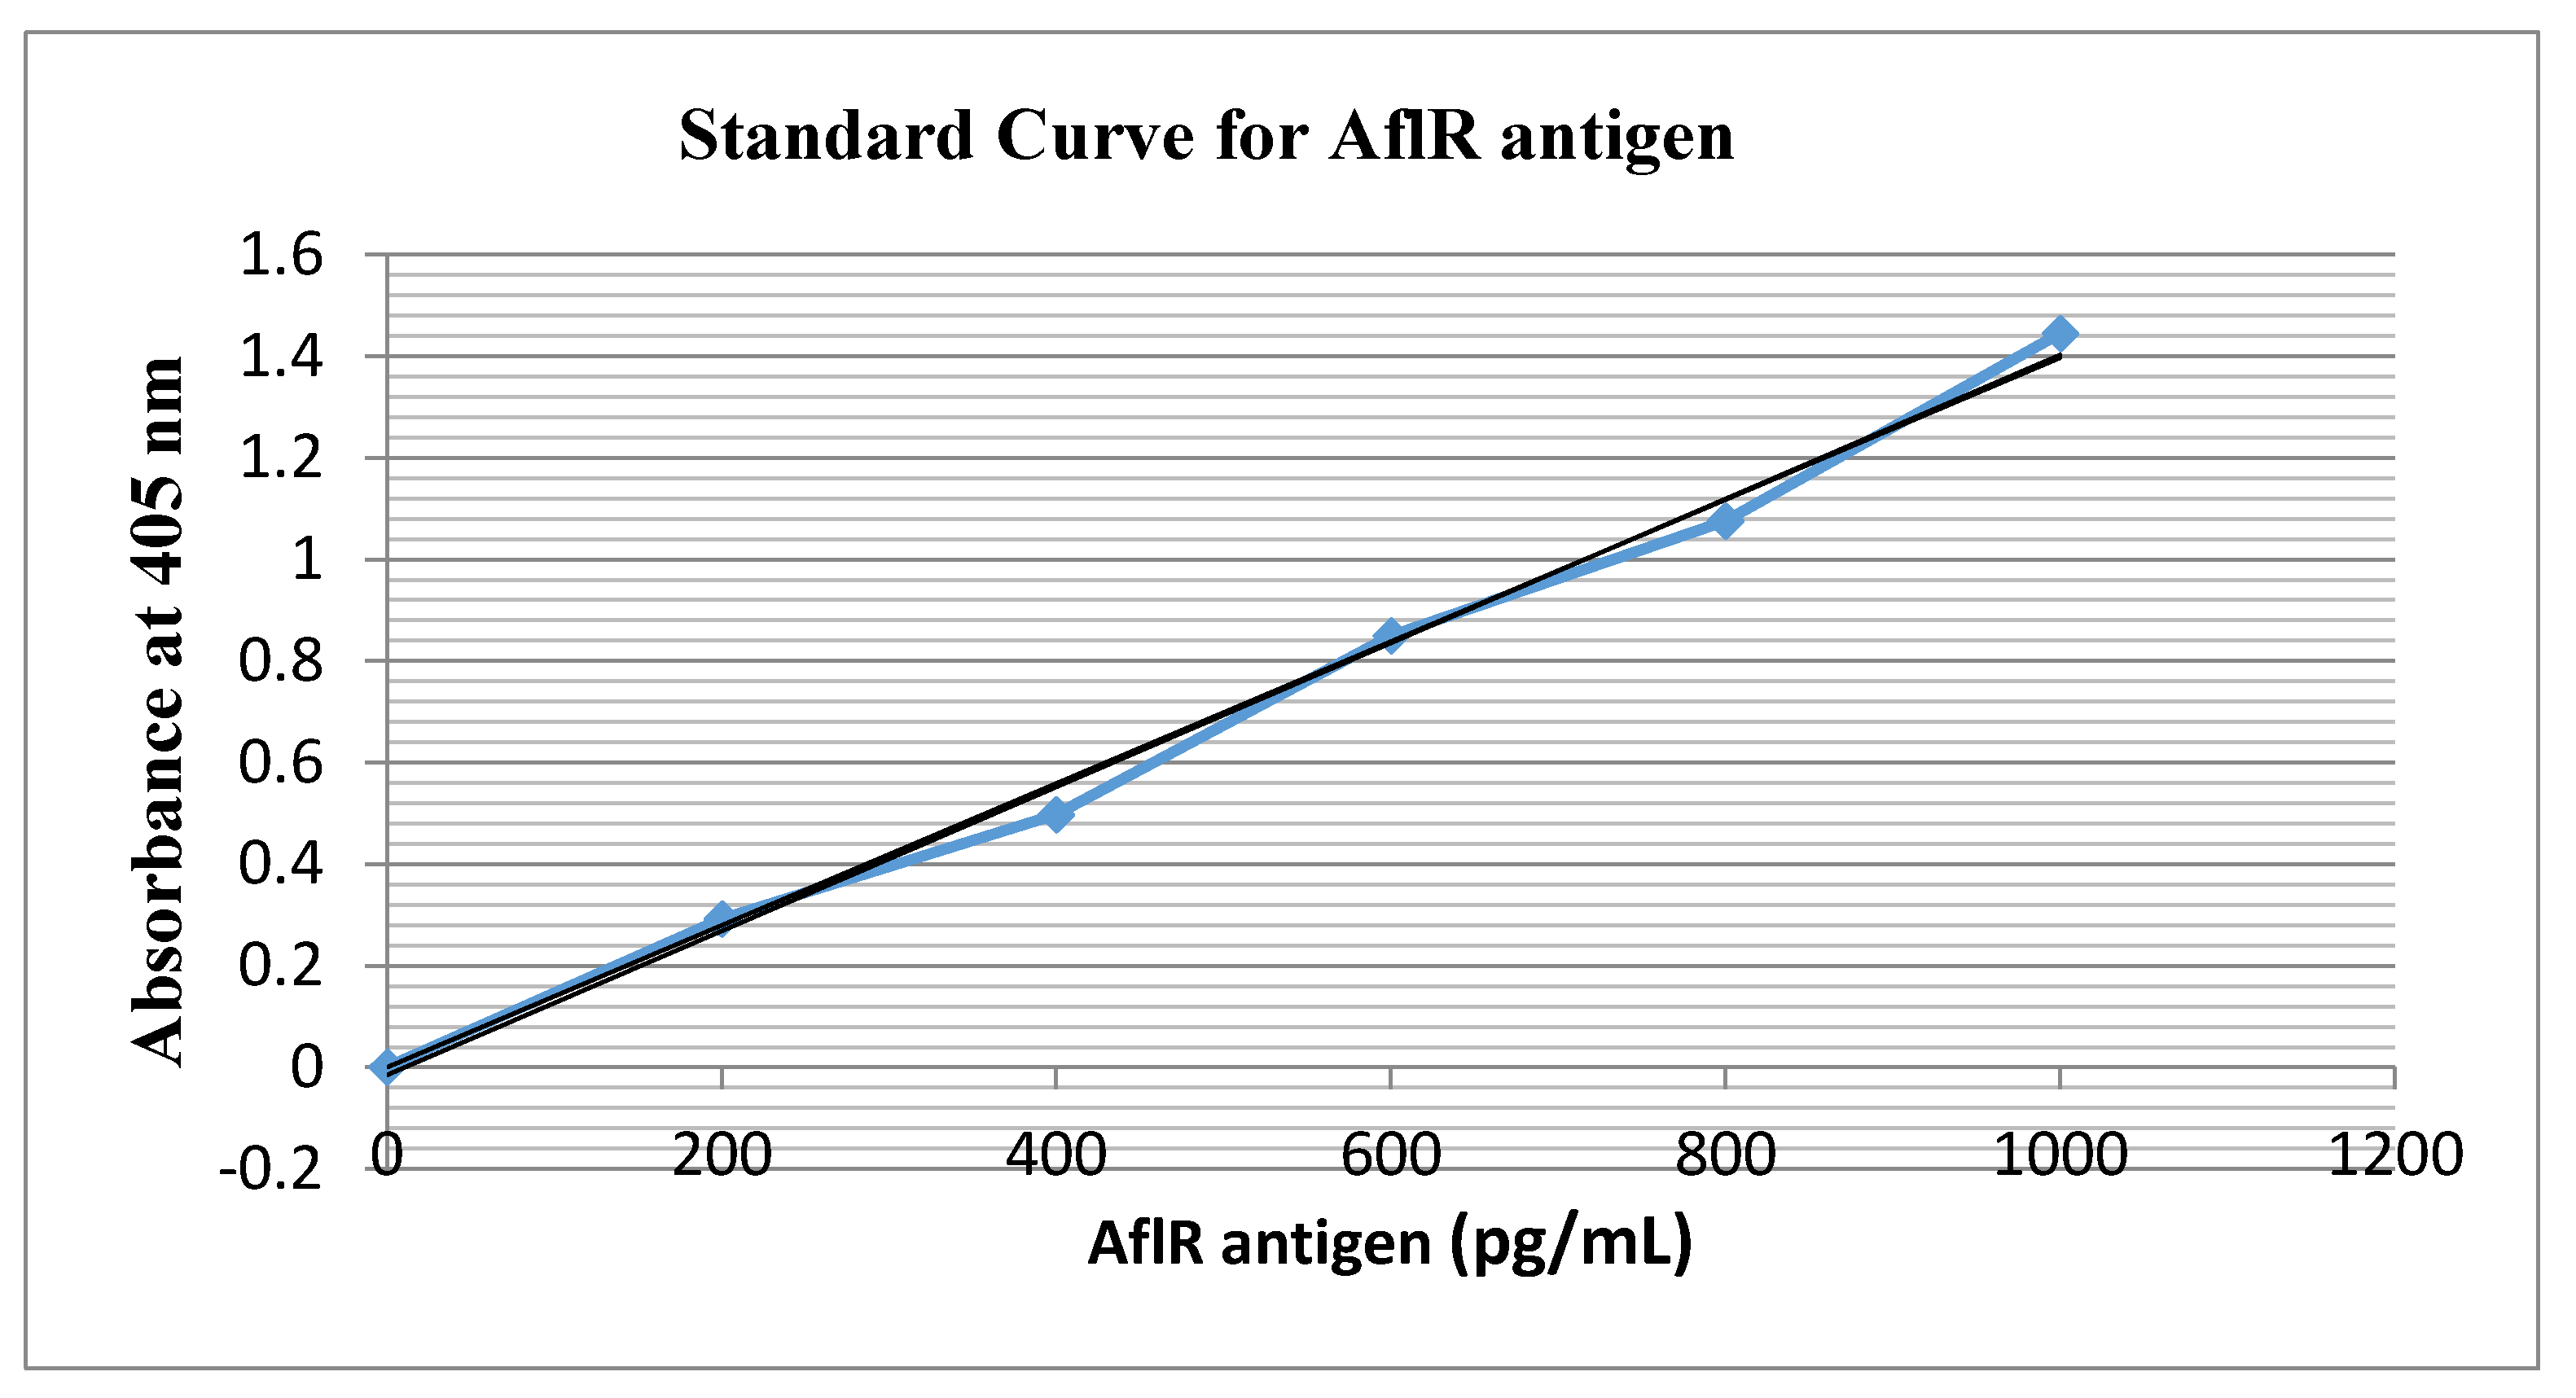
2.4. Antigenicity Test

A 256 residue amino acid sequence was deduced from the gene sequence (Table 2). Eight peptides showed antigenic activity by Kolaskar & Tongaonkar Antigenicity [16] Figure 3. Peptide lengths ranged from 8 to 14 amino acids. Their positions started from amino acid numbers 26, 66, 107, 136, 170, 186, 205, and 236 (Table 2). Epitope prediction using Kolaskar and Tongaonkar Antigenicity Prediction identifies the protein epitopes that are useful for diagnostic purposes and also in the development of peptide vaccines [17].

2.5. IgG Polyclonal Antibody Labeling and Purification

Serum obtained from immunized rabbits was fractionated using affinity chromatography protein G-Sepharose column and one band of conventional IgG with a molecular weight of 130 kDa was obtained. Moreover, two bands of a 42 kDa heavy chain and a 19 kDa light chain were separated under reducing conditions. Glutaraldehyde was used to prepare conjugates using a ratio of 4:1 of IgG and enzyme alkaline phosphatase (AP). IgG-AP conjugates were purified by gel filtration on a Sephacryl S200 column. AP (EC 3.1.3.1) is a stable enzyme its activity can be measured by many different substrates. The most common method of labeling immunoglobulin G (IgG) antibody with this enzyme uses the homobifunctional reagent glutaraldehyde [18].

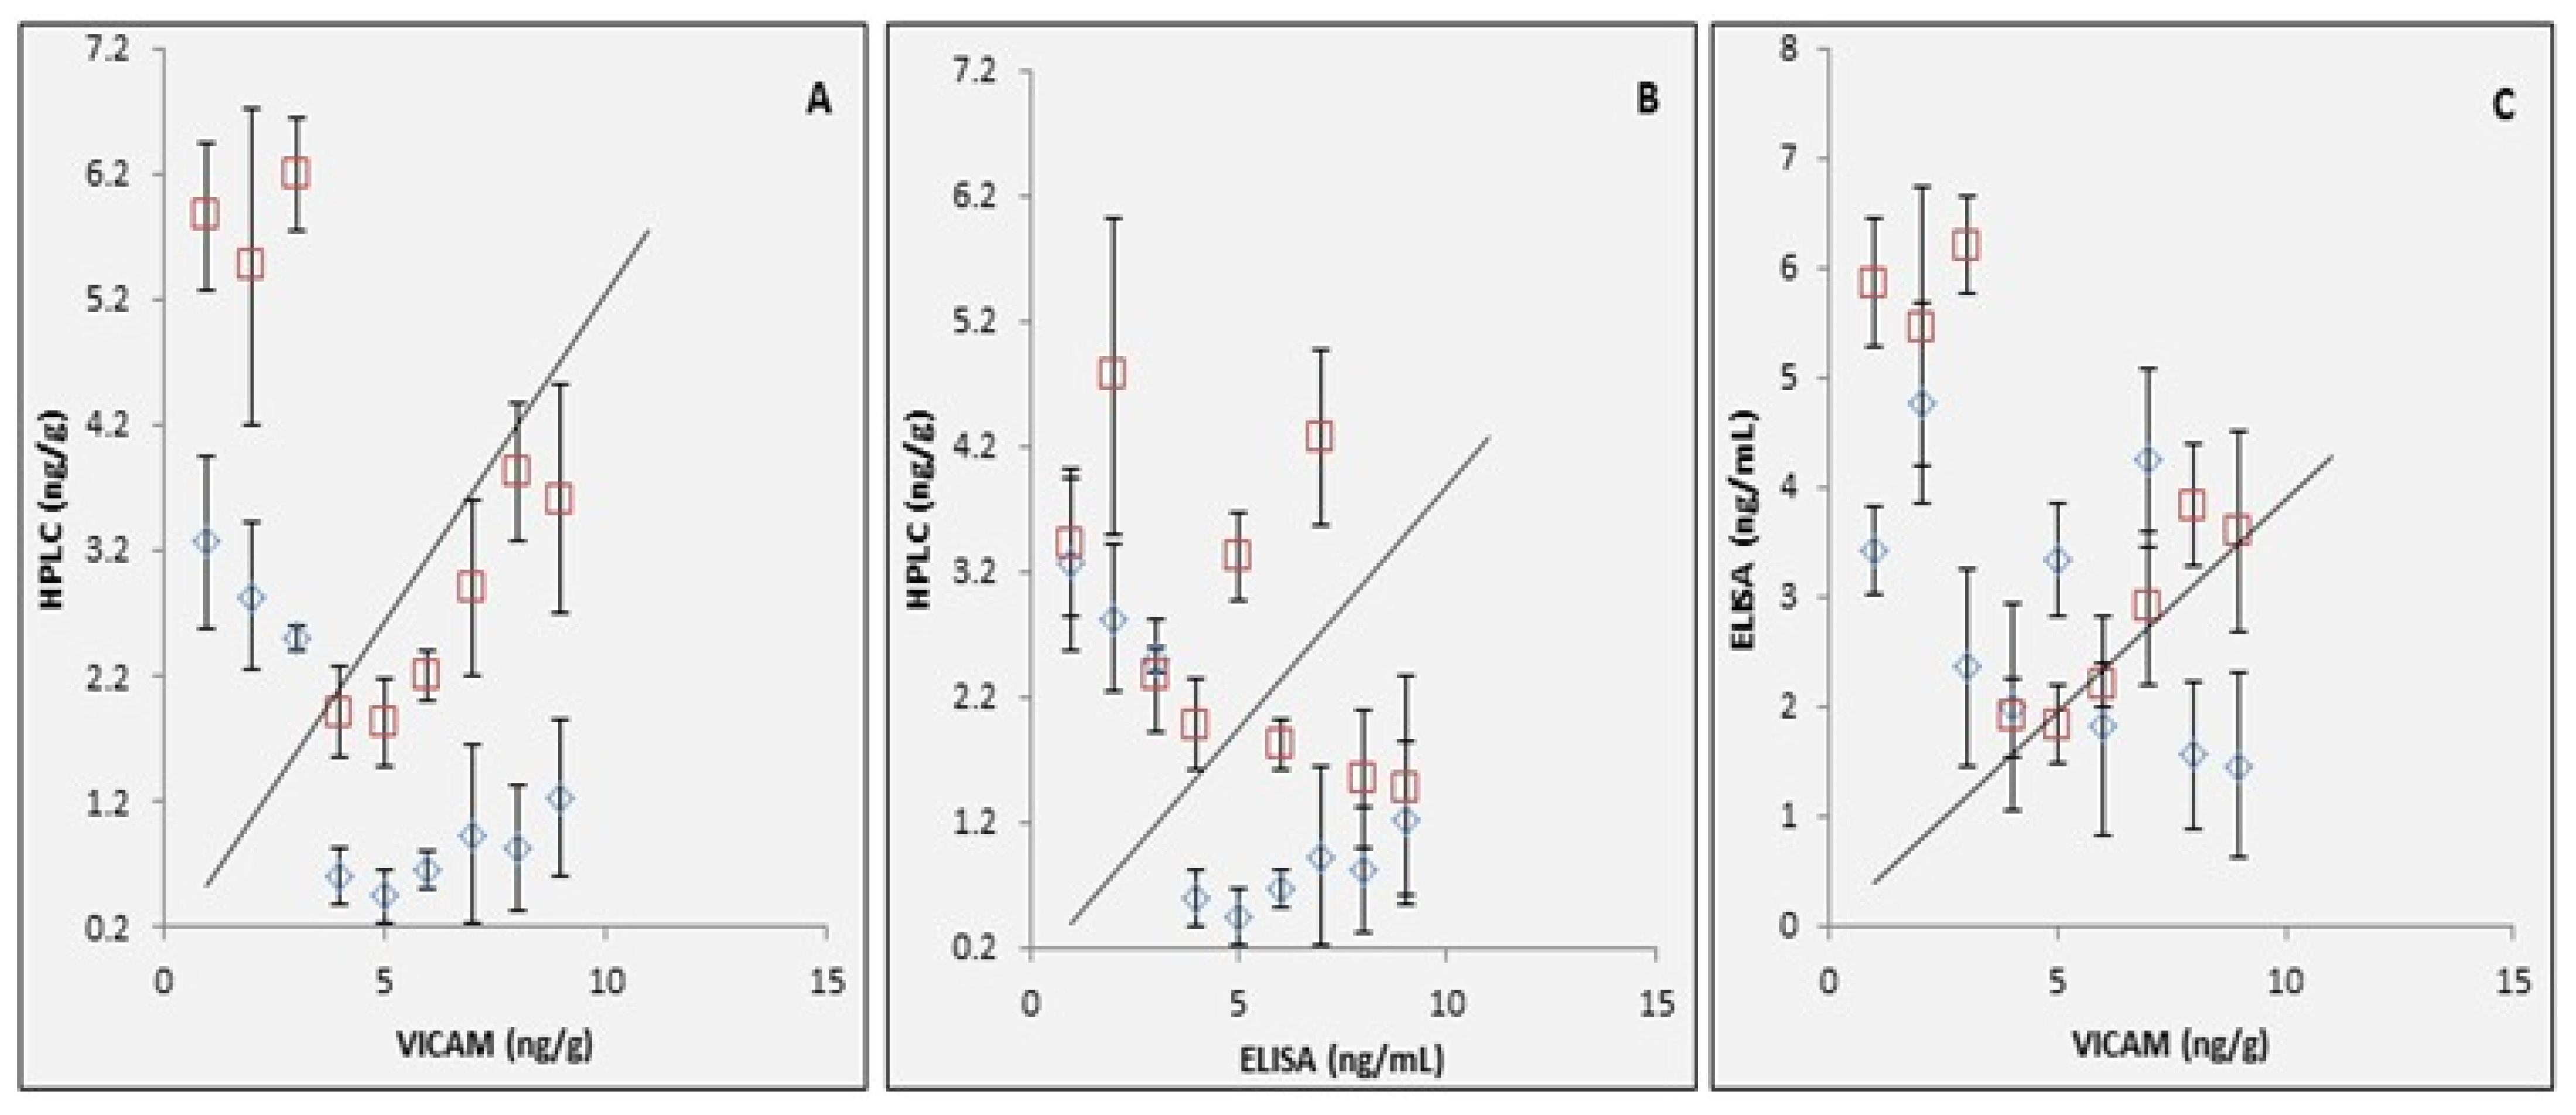
2.6. Validation of the Modified Recombinant AflR Gene Antiserum ELISA Technique with HPLC and VICAM

In definition, validation is establishing the performance specifications of a new diagnostic tool such as a new test, laboratory developed test or modified method. But verification is defined as one-time process to determine performance characteristics of a test before use in patient testing [19].
ELISA was unable to distinguish among antigens due to the presence of common epitopes on protein surfaces [20,21,22]. Sampling/sub-sampling variation significantly affects the accuracy of aflatoxin analysis [23]. Extracts of 36 samples were used for validation to minimize the impacts of such variation.
Recombinant antiserum detected AfIR recombinant protein within a concentration range 0–1000 pg/mL with a linear correlation between AfIR antigenic protein and absorbance at 405 nm (y = 0.0014x − 0.0148; R2 = 0.9946) (Figure 4). Non-significant differences among three samples of the same product, peanut, flour, or milk powder, were observed after HPLC (p > 0.05) (Table 3). The VICAM method showed similar results. However, the modified ELISA showed significant differences among toxin detections in these product samples. The serum-based analysis confirmed specific PCR results. No false negatives were observed in I-ELISA results and false positives were either nil or negligible.
Although the correlation between the data in Figure 5A,B (comparing HPLC against VICAM and ELISA) reflected that the correlation of HPLC against VICAM (Figure 5A) was better than ELISA. On the other hand, a good correlation was observed between ELISA and VICAM (Figure 5C). However, the represented modified ELISA technique is easier to use, economic as it does not need sophisticated chemicals or highly trained technicians, have a good sensitivity to detect low infection levels determining aflatoxin B1 in foods and can represent a successful alternative in case other approaches are hard to be reached in less developed communities. Previous observations were reported for validation of a competitive direct SUNQuik ELISA for aflatoxin in peanuts using a reference HPLC method and other methods, including a minicolumn and the VICAM Afla test system [24]. The comparison between HPLC, VICAM, and validated method I-ELISA with respect to limit of detection, precision and accuracy, time of analysis, cost of analysis, and use of organic solvents is summarized in Table 4.

2.7. Limitations of the Modified Recombinant AflR Gene Antiserum ELISA Technique

Our new established method has many limitations that must be clarified to determine and specify the application field of this method. First, our new ELISA technique does not measure the aflatoxins itself, hence, this type of test cannot be used for official control. However, it could be useful for auto control and rapid results and decision-making within a farm/company. Second, although this method is quantitative test, all positive results need to be confirmed with a confirmatory method such as HPLC or LC-MS as it is based on the measurement of a recombinant protein controlled by the gene responsible for aflatoxin biosynthesis, but not on the toxin itself.

3. Conclusions and Future Perspective

Aflatoxin B1 detection is an increasingly important health and economic issue. Accurate detection is essential to assess health problems in both humans and animals. Conventional detection methods are time-consuming and require expensive chemicals and apparatus (HPLC and VICAM). An accurate and rapid detection method that requires fewer chemicals is needed. We developed a specific quantitative detection technique (I-ELISA) using recombinant AflR protein. AflR is involved in aflatoxin biosynthesis. Comparison of results achieved from the new modified ELISA with other standardized methods HPLC and VICAM, revealed that the new ELISA technique can be used at many applications as an economic alternative to detect low levels of aflatoxin contamination. This modified technique may address problems associated with the reliable and rapid detection of aflatoxin B1 contamination in food products. The technique could be used to develop highly sensitive (0–1000 pg/mL) testing capabilities. In future, hybridoma cell culture antibody production technique can be used for production of antibodies against AfIR protein for large-scale manufacturing of rapid I-ELISA kit. This method will yield a production scale ranging from milligram to gram level with competitive pricing.

4. Materials and Methods

4.1. Sampling

Thirty-six food samples of three food products (12 samples each) were collected from a local market in Alexandria, Egypt. Products were prepared by different companies (4 packages each). Samples were peanuts (300 g packages), wheat flour (2 kg packages), and milk powder (500 g packages). Aflatoxin B1 was extracted for subsequent analysis.

4.2. HPLC Detection

One mL of each sample was centrifuged at 6000 rpm for 15 min, then filtered through a 0.45 μm hydrophobic polytetrafluoroethylene syringe filter in preparation for gel pores chromatographic (GPC) analysis. The supernatant was transferred to 1.5 mL micro-tubes and passed through an immune-affinity column at a rate of 1–2 drops/s. The column was washed twice with 10 mL water: methanol (90:10) at a flow rate of 3 mL/min. Aflatoxins were eluted by slowly passing 1 mL of methanol through the column. The clear eluent was then repassed through a 0.45 μm filter [25]. Subsequently, 100 μL of trifluoracetic acid and 200 μL n-hexane were added to samples and mixed by vortexing for 30 s. The vial was left for 15 min before addition of 900 μL of water: acetonitrile, 9:1 and remixing by vortexing. The hexane layer was then removed and samples were analyzed for AFs as previously reported [26] using a Waters HPLC system, Model 6000, a solvent delivery system, and a Model 720 system controller equipped with a fluorescence detector (Model 274) at excitation and emission wavelengths of 360 and 450 nm, respectively. Separation used 5 μm of sample, a Waters symmetry column (150 × 4.6 mm id), and a flow rate of 1 mL/min with an isocratic system of 1% acetic acid: methanol: acetonitrile (55:35:10).

4.3. AflA-Vt Detection

Afla-V strip tests utilize the proven sensitivity and selectivity of VICAM monoclonal antibodies to accurately detect and measure aflatoxins B1 at levels of 2 to 100 ppb. These samples were subjected to aflatoxin extraction and quantification using the VICAM fluorometry method. Briefly, representative samples (100 g) of shelled peanuts were added with 10 g of NaCl and 200 mL of methanol/water (80:20 v/v), homogenized using a Waring blender at high speed for 1 min and filtered through Whatman paper. Five ml of the filtrate was diluted with 20 mL HPLC water then re-filtered. Ten milliliter filtrate was purified with VICAM immunoaffinity columns (VICAM Aflatest, MA, USA) containing aflatoxin-specific (B1) monoclonal antibodies and washed with 10 mL HPLC water before the aflatoxin was eluted with 1 mL methanol. The eluted fraction was diluted twice with HPLC water and measured with the VICAM fluorometer (VICAM Series 4EX Fluorometer). All procedures were done according to the manufacturer’s instructions [27].

4.4. Specific PCR Detection Method

DNA from food samples was extracted using a QiaGene DNA extraction kit (QiaGene, Berlin, Germany). DNA was dissolved in DEPC-treated water, quantified spectrophotometrically and analyzed using 1.2% agarose gels. The AflR gene (744 bp) was amplified using specific primers. The PCR reaction consisted of 1 µL of DNA in 2.5 µL Taq polymerase buffer 10× (Promega, New York, NY, USA) containing a final concentration of 1 mM MgCl2, 0.2 Mm dNTPs, 20 pmol of each primer, and 0.2 µL Taq polymerase (5 U/µL) in a final reaction volume of 25 µL. The PCR reaction program was: initial denaturation at 95 °C for two minutes followed by 35 cycles of 58 °C for one min, 72 °C for one min, and 95 °C for 2 min. A final extension step at 72 °C for 5 min was included at the end of the reactions. PCR amplification products were separated in 1.5% agarose with 0.5× TBE buffer and visually analyzed with a gel documentation system (Syngene) [28]. Forward (5‘-TAAGCAGAATTCGAATAGCTTCGCAGGGTGGT-’3) and reverse (5‘-GAATAGCTTCGCAGGGTGGTGCGGCCGCTAAGCA-’3) primers were designed by Primer-Blast, NCBI.

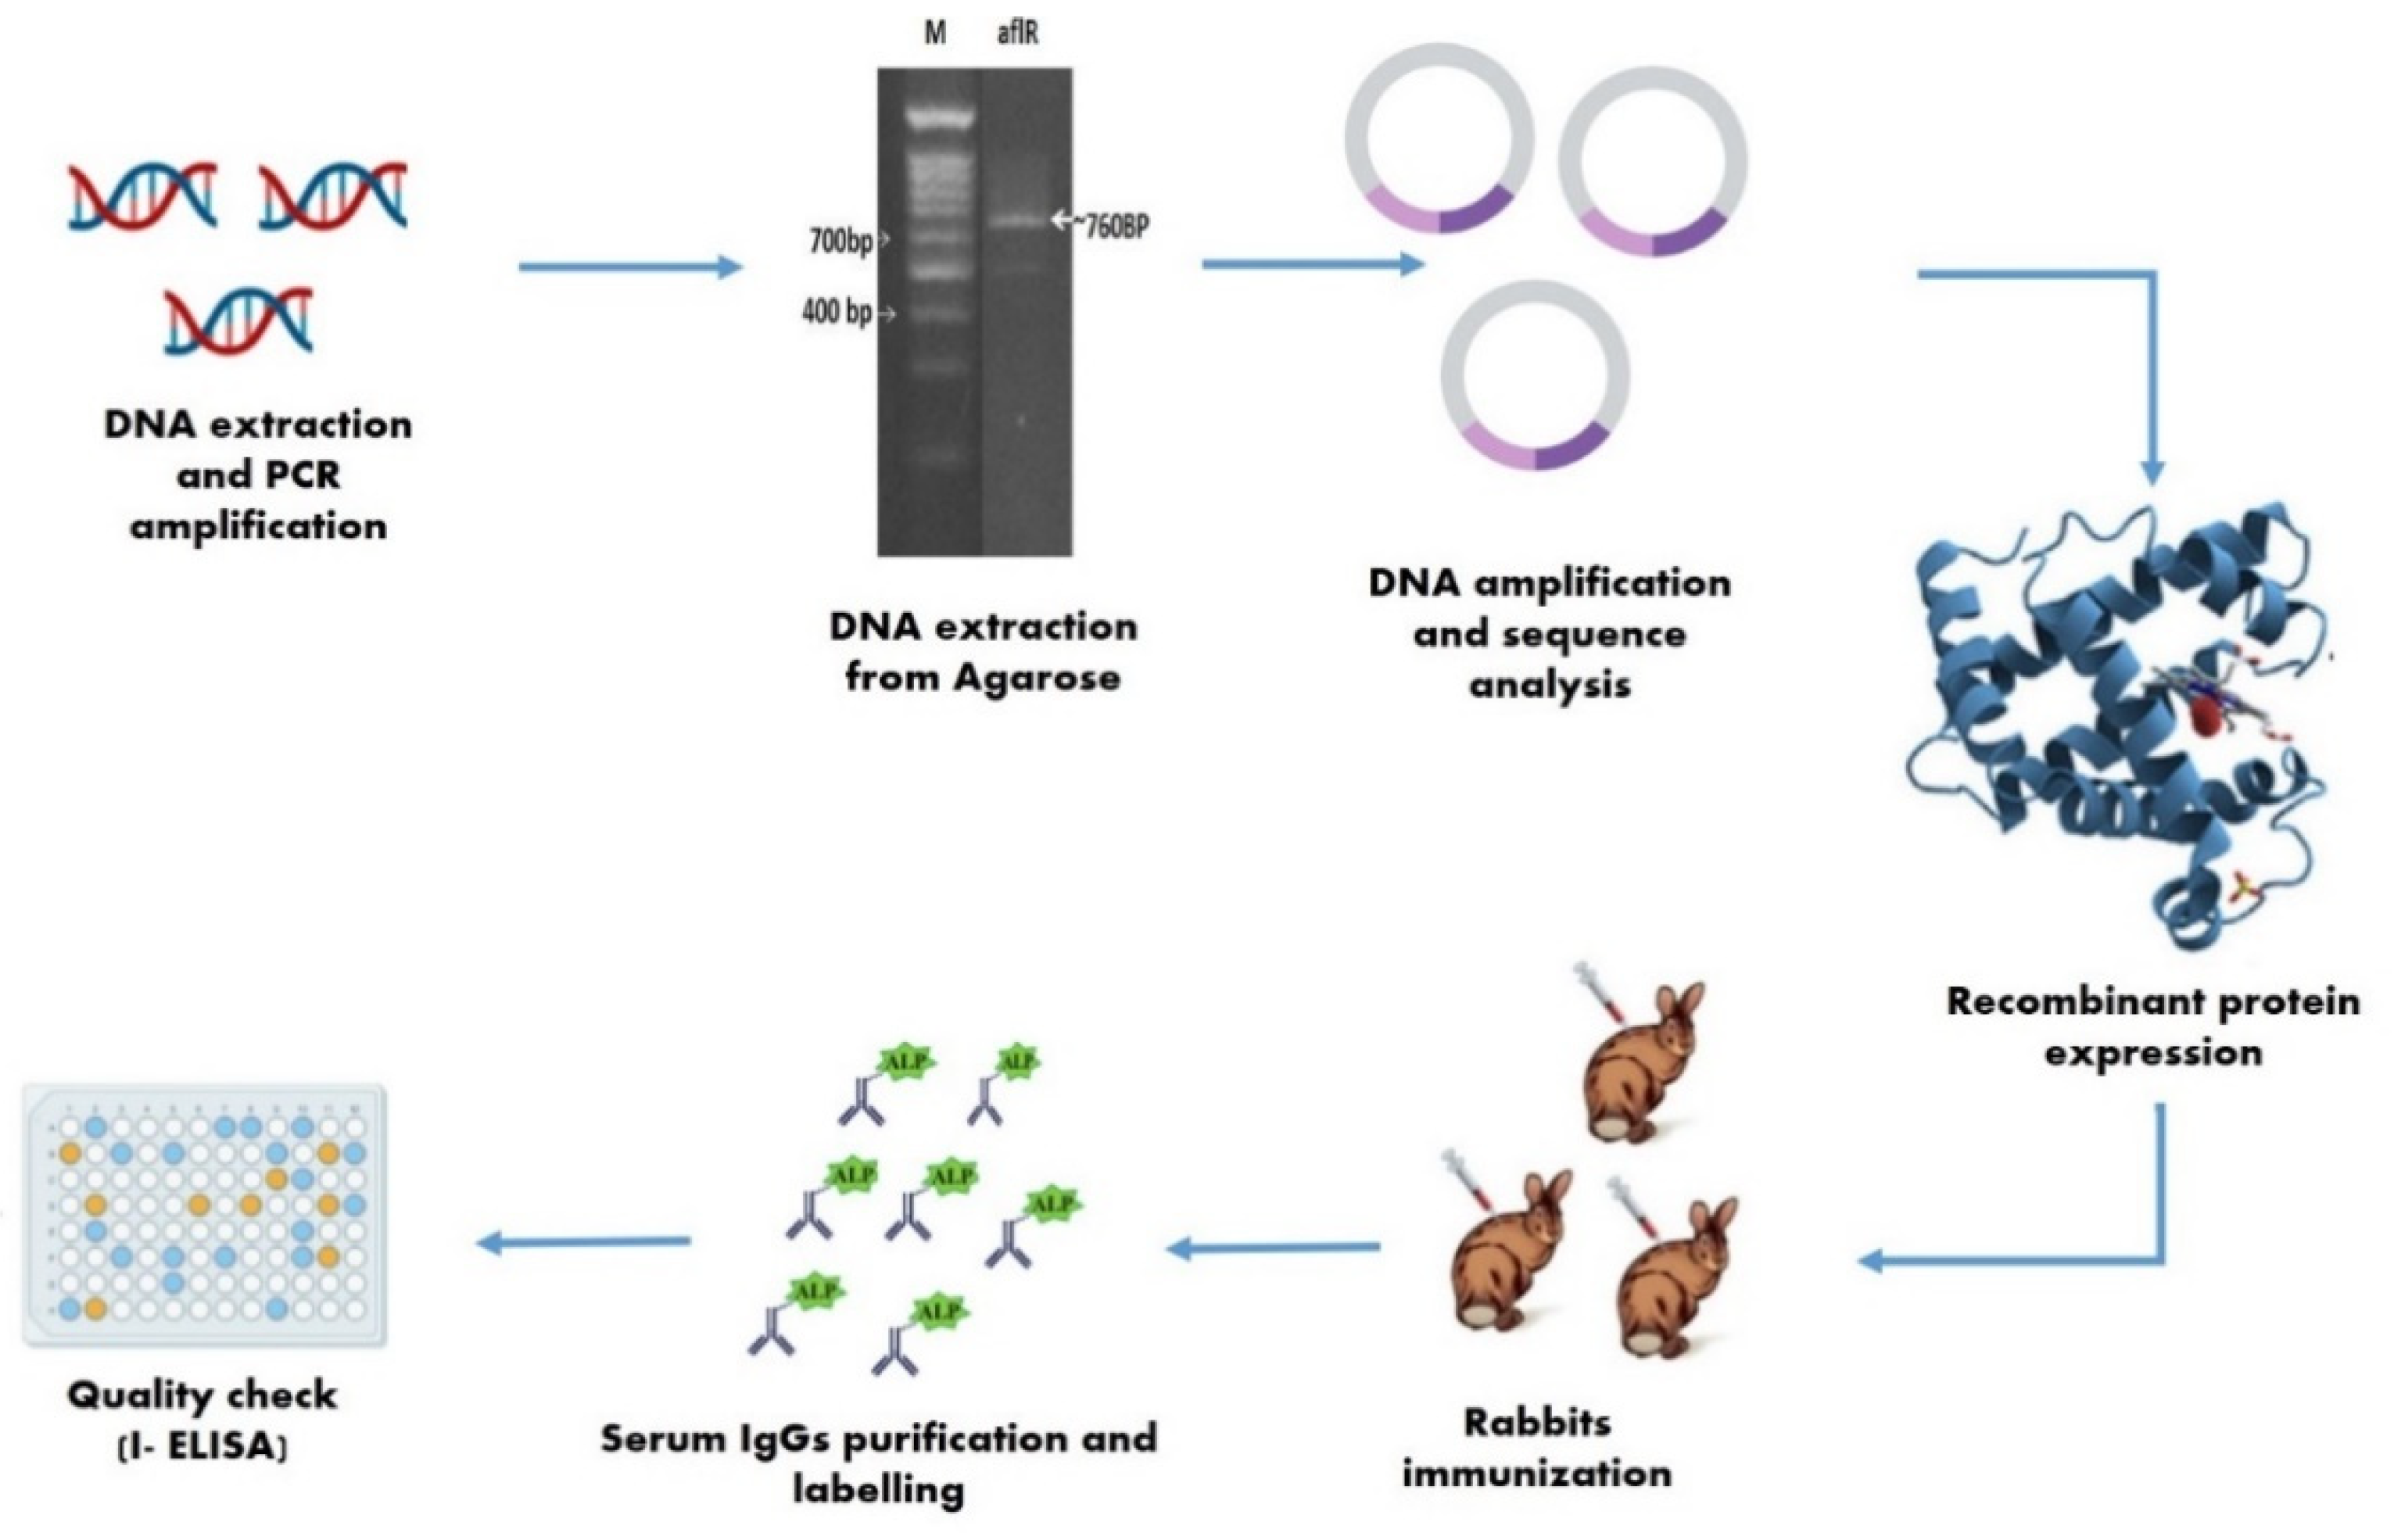
4.5. Detection via AflR Gene Analysis and Transformation

4.5.1. Cloning, Sequencing, and AflR Gene Transformation

The PCR product (Section 2.4) was excised from the gel and purified using a QIA quick gel extraction kit (Qiagen Inc., Berlin, Germany). Purified DNA was ligated into the pGEM-T vector (Promega Co., New York, NY, USA). Recombinant plasmids were directly sequenced using an automated sequencer (Macrogene Company, Seoul, Korea), with a universal vector primer. DNA homology searches were carried out using the NCB1 databases and the BLAST network service. EcoRI and NotI restriction enzymes were used for gene release and insertion into the pPROEX HTa expression vector (Life Technologies, New York, NY, USA). The recombinant plasmid was transformed into competent E. coli (BL21) cells and recombinant protein was recovered as previously described [29].

4.5.2. Molecular Size Determination of AflR Recombinant Protein

The recombinant protein was separated on 12% SDS PAGE and molecular size determined using a standard low range protein marker (BioRad, Hercules, CA, USA). Gel preparation, staining, and destaining were carried out following Laemmli [30].

4.5.3. Epitope Prediction and Antigenic Determination

B-cell epitope prediction analysis was performed following Kolaskar and Tongaonkar [16] to examine the epitope in different antigenic determinants.

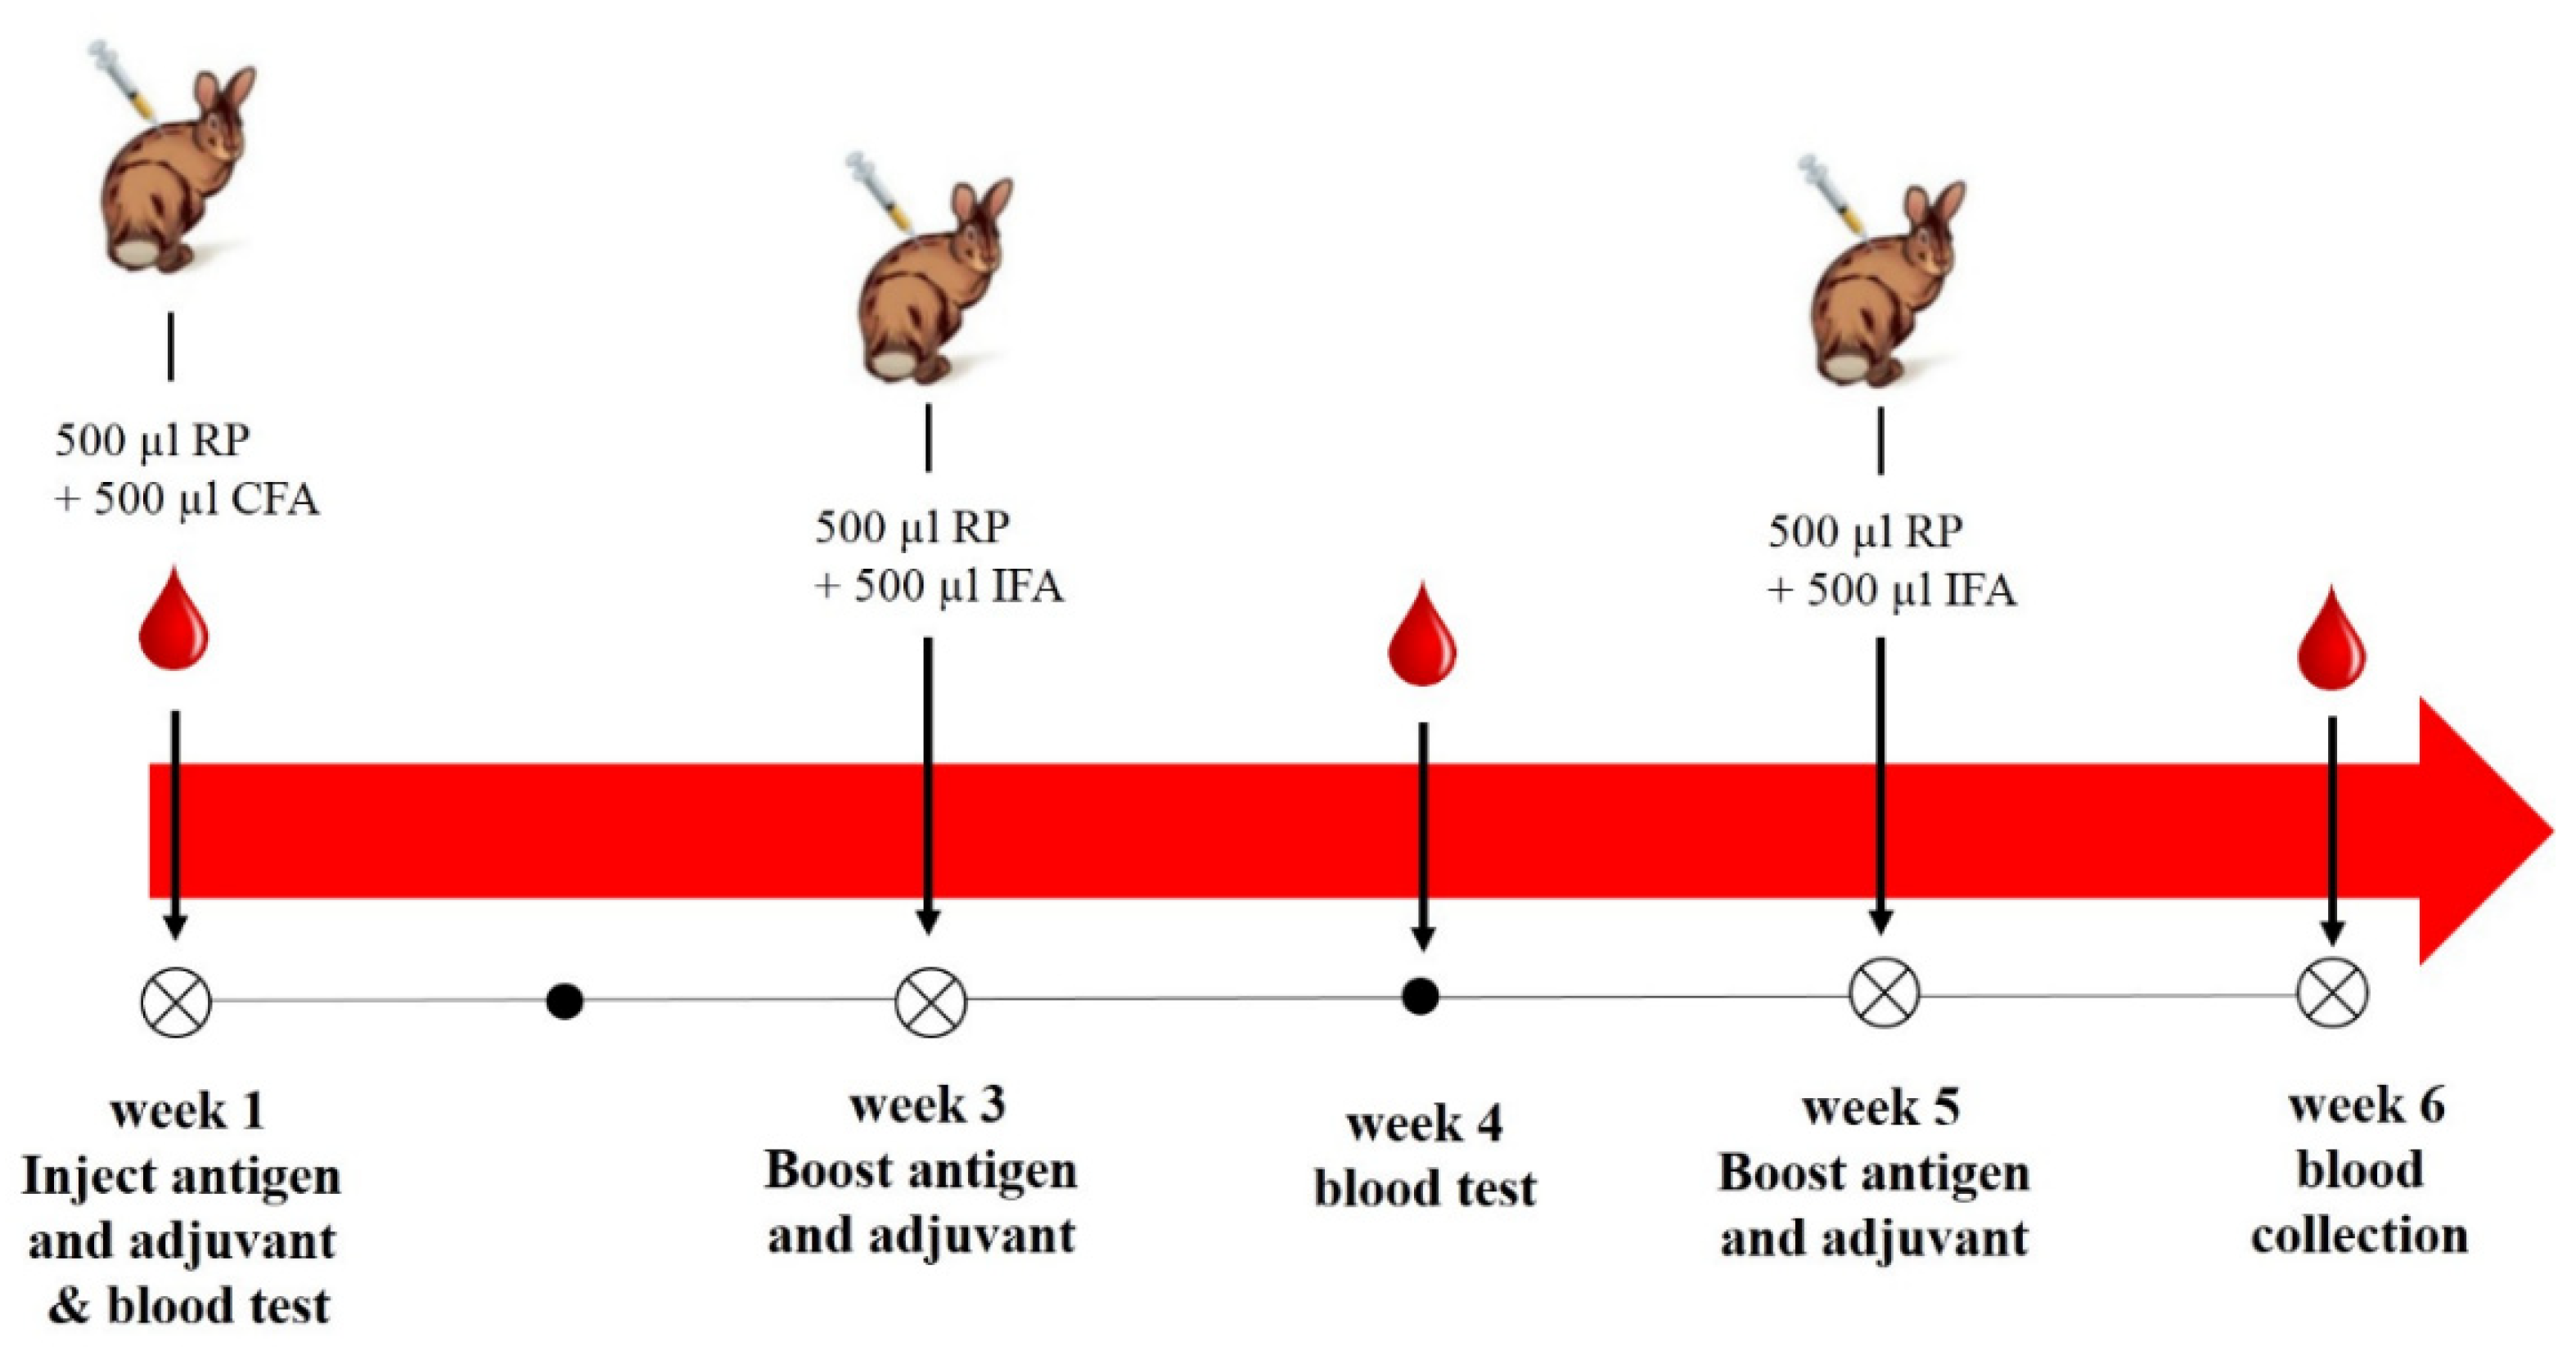
4.5.4. Immunization and Antibody Production

Rabbit Immunization with AflR Recombinant Protein

Ten male New Zealand White rabbits, age 10–16 weeks and weighing 3.5–4.0 kg were used. Physical examinations confirmed lack of abnormalities. Rabbits were housed in stainless steel and polycarbonate cages (Techniplastic, West Chester, PA, USA), at 18–21 °C, with 30–70% humidity, and a 12-h: 12-h light: dark cycle (lights on at 0600). Rabbits were fed 250 g of a commercial pelleted rabbit diet (diet 2030, Harlan Laboratories, Madison, WI, USA) twice daily and were allowed free access to municipal water via an automatic watering system (Edstrom Industries, Waterford, WI, USA). After one-week of acclimatization, rabbits were divided into control (4 animals) and treated (6 animals) groups. The latter animals were injected subcutaneously with 500 µL of purified protein (2 mg/mL) following the polyclonal antibody production protocol of Fishback et al. [31] with some modifications (Figure 6). The study was conducted after obtaining approval from the International Animal Care and Use Committees (IACUCs) IACUC # 30-1Y-0521 (date of approval 10 January 2018).
Three milliliter of blood was collected from the auricular artery of each rabbit on weeks 1 and 4 to monitor antibody production. On week 6, under deep anesthesia with a mixture of 22–50 mg/kg ketamine and 5–10 mg/kg xylazine, 3 mL of blood was collected by cardiac puncture. Blood was collected into BD Vacutainer serum separation tubes (BD, Franklin Lakes, NJ, USA), and kept upright at room temperature (20 ± 2 °C) for serum separation following the manufacturer’s instructions. Separated sera were stored at −80 °C until further analysis.

Serum IgG Purification and Fractionation

Rabbit sera were obtained by centrifugation of immunized rabbit blood at 4000 rpm for 5 min at 4 °C. IgG fractions were obtained by loading sera onto an affinity Protein G-Sepharose column. In brief, the IgG1 fraction was eluted with glycine buffer, pH 2.7, and the IgG3 fraction obtained by elution with glycine buffer, pH 3.5. All IgG fractions were immediately neutralized in a neutralization buffer (1 M Tris–HCl, pH 8.0, 150 mM NaCl, 5 mM EDTA) [32].

Labelling of Antibodies

Ten mg of alkaline phosphatase (AP) were mixed with purified IgGs (2.5 mg) in 5 mL of 50 mM phosphate buffer, pH 6.8. Mixtures were dialyzed against 2 L of 50 mM phosphate buffer for 24 h at 4 °C. One mL of 1.25% glutaraldehyde was added to each mixture and gently stirred for 2 h at room temperature (20 °C ± 2). Two hundred fifty µL of 0.2 M glycine solution was added followed by further stirring for 2 h. Mixtures then were dialyzed twice against 2 L of 1.0× PBS containing 1 mM magnesium chloride, followed by centrifugation at 10,000 rpm for 5 min to remove any precipitate [33]. Each conjugate was further purified on a Sephacryl S200 column (5 × 150 mm, GE Health care, Danderyd, Sweden) previously equilibrated with PBS and eluted with the same buffer.

4.5.5. Quality Checks

An indirect enzyme-linked immunosorbent assay (I-ELISA) was used to detect aflatoxin B1 in food samples using polyclonal antibodies. Antibodies were compared using an antiserum produced by Sigma (Berlin, Germany). One gram of contaminated food sample was extracted in 10 mL coating buffer. One hundred microliter of sample extract was added to each well. Plates were then incubated at 37 °C for 3 h and blocked with 200 μL of blocking buffer (1× PBS and 0.5% BSA) for 1 h at room temperature (20 °C ± 2). One hundred microlite concentration of 1:800 diluted secondary antibody alkaline phosphatase-conjugated (anti-rabbit antibody) was added and the mixture was incubated at 37 °C for 1 h. All washing steps between incubations used 1× PBS-T buffer. Finally, freshly prepared pNPP substrate was added; plates were incubated at room temperature for 30 min away from direct light, and the absorbance was measured at 405 nm. All experimental steps are summarized in Figure 7.

5. Statistical Analysis

Data were statistically analyzed using SPSS software (version 16). One-way analysis of variance was used to assess the significance of differences among means, with a significance threshold of p < 0.05. The Pearson correlation coefficient (r) was also calculated (p < 0.001) to assess the strength of linear relationships between variables.

Author Contributions

Conceptualization, E.H., N.M.A.E.-A., A.M.G.D., M.G.S., A.A.I., A.M.E. and A.N.B.; methodology, E.H., N.M.A.E.-A., A.M.G.D., M.G.S., A.A.I. and A.M.E.; software and static analysis, E.H., N.M.A.E.-A., A.M.G.D., M.G.S., A.A.I., A.M.E. and A.N.B.; formal analysis, E.H., N.M.A.E.-A., A.M.G.D., M.G.S. and A.N.B.; investigation and data curation, E.H., N.M.A.E.-A., A.M.G.D., M.G.S. and A.N.B.; resources, E.H., N.M.A.E.-A., A.M.G.D. and M.G.S.; writing—original draft preparation, E.H., N.M.A.E.-A., A.M.G.D. and M.G.S.; writing—review and editing, E.H., N.M.A.E.-A., A.M.G.D., M.G.S., A.A.I., A.M.E. and A.N.B. All authors have read and agreed to the published version of the manuscript.

Funding

This research received no external funding.

Institutional Review Board Statement

Animal experiment was conducted upon the approval of International Animal Care and Use Committees (IACUCs) (Permission number: IACUC # 30-1Y-0521, date of approval 10 January 2018).

Informed Consent Statement

Not applicable.

Conflicts of Interest

The authors declare no conflict of interest.

References

  1. Goud, K.Y.; Reddy, K.K.; Satyanarayana, M.; Kummari, S.; Gobi, K.V. A review on recent developments in optical and electrochemical aptamer-based assays for mycotoxins using advanced nanomaterials. Microchim. Acta 2019, 187, 29. [Google Scholar] [CrossRef]
  2. Hussain, K.K.; Malavia, D.; Johnson, E.M.; Littlechild, J.; Winlove, C.P.; Vollmer, F.; Gow, N.A.R. Biosensors and Diagnostics for Fungal Detection. J. Fungi 2020, 6, 349. [Google Scholar] [CrossRef] [PubMed]
  3. Bryła, M.; Waśkiewicz, A.; Podolska, G.; Szymczyk, K.; Jędrzejczak, R.; Damaziak, K.; Sułek, A. Occurrence of 26 Mycotoxins in the Grain of Cereals Cultivated in Poland. Toxins 2016, 8, 160. [Google Scholar] [CrossRef] [PubMed]
  4. Ezekiel, C.; Sulyok, M.; Babalola, D.; Warth, B.; Ezekiel, V.; Krska, R. Incidence and consumer awareness of toxigenic Aspergillus section Flavi and aflatoxin B1 in peanut cake from Nigeria. Food Control 2013, 30, 596–601. [Google Scholar] [CrossRef]
  5. Dai, Y.; Huang, K.; Zhang, B.; Zhu, L.; Xu, W. Aflatoxin B1-induced epigenetic alterations: An overview. Food Chem. Toxicol. 2017, 109, 683–689. [Google Scholar] [CrossRef] [PubMed]
  6. Payne, G.A.; Widstrom, N.W. Aflatoxin in maize. Crit. Rev. Plant Sci. 1992, 10, 423–440. [Google Scholar] [CrossRef]
  7. Shotwell, O.L.; Goulden, M.L.; Hesseltine, C.W. Aflatoxin: Distribution incontaminated corn. Cereal Chem. 1974, 51, 492–499. [Google Scholar]
  8. Filazi, A.; Tansel, U. Occurrence of Aflatoxins in Food. Aflatoxins Recent Adv. Future Prospect. 2013, 143–170. [Google Scholar] [CrossRef]
  9. Herzallah, S.M. Determination of aflatoxins in eggs, milk, meat and meat products using HPLC fluorescent and UV detectors. Food Chem. 2009, 114, 1141–1146. [Google Scholar] [CrossRef]
  10. Wagner, K.; Springer, B.; Pires, V.P.; Keller, P.M. Molecular detection of fungal pathogens in clinical specimens by 18S rDNA high-throughput screening in comparison to ITS PCR and culture. Sci. Rep. 2018, 8, 1–7. [Google Scholar] [CrossRef]
  11. Gallo, A.; Stea, G.; Battilani, P.; Logrieco, A.F.; Perrone, G. Molecular characterization of Aspergillus flavus population isolated from maize during the first outbreak of aflatoxin contamination in Italy. Phytopathol. Mediterr. 2012, 51, 198–206. [Google Scholar] [CrossRef]
  12. Alahi, M.E.E.; Mukhopadhyay, S.C. Detection methodologies for pathogen and toxins: A review. Sensors 2017, 17, 1885. [Google Scholar] [CrossRef]
  13. Maggira, M.; Ioannidou, M.; Sakaridis, I.; Samouris, G. Determination of Aflatoxin M1 in Raw Milk Using an HPLC-FL Method in Comparison with Commercial ELISA Kits—Application in Raw Milk Samples from Various Regions of Greece. Vet. Sci. 2021, 8, 46. [Google Scholar] [CrossRef]
  14. Vosough, M.; Bayat, M.; Salemi, A. Matrix-free analysis of aflatoxins in pistachio nuts using parallel factor modeling of liquid chromatography diode-array detection data. Anal. Chim. Acta 2010, 663, 11–18. [Google Scholar] [CrossRef] [PubMed]
  15. Sapsford, K.; Ngundi, M.; Moore, M.; Lassman, M.; Shriver-Lake, L.; Taitt, C.; Ligler, F. Rapid detection of food-borne contaminants using an array biosensor. Sens. Actuators B Chem. 2006, 113, 599–607. [Google Scholar] [CrossRef]
  16. Kolaskar, A.S.; Tongaonkar, P.C. A semi-empirical method for prediction of antigenic determinants on protein antigens. FEBS Lett. 1990, 276, 172–174. [Google Scholar] [CrossRef]
  17. Schmidt, A.M. Development and application of synthetic peptides as vaccines. Biotechnol. Adv. 1989, 7, 187–213. [Google Scholar] [CrossRef]
  18. Mahan, D.E.; Morrison, L.; Watson, L.; Haugneland, L.S. Phase change enzyme immunoassay. Anal. Biochem. 1987, 162, 163–170. [Google Scholar] [CrossRef]
  19. Gruzdys, V.; Cahoon, K.; Pearson, L.; Lehman, C.M. Method Verification Shows a Negative Bias between 2 Procalcitonin Methods at Medical Decision Concentrations. J. Appl. Lab. Med. 2019, 4, 69–77. [Google Scholar] [CrossRef]
  20. Harrison, B.D.; Barker, H.; Bock, K.R.; Guthrie, E.J.; Meredith, G.; Atkinson, M. Plant viruses with circular single-stranded DNA. Nat. Cell Biol. 1977, 270, 760–762. [Google Scholar] [CrossRef]
  21. Padidam, M.; Beachy, R.N.; Fauquet, C.M. Classification and identific-ation of geminiviruses using sequence comparison. J. Gen. Virol. 1995, 76, 249–263. [Google Scholar] [CrossRef]
  22. Abdel–Salam, A.M. Isolation and characterization of a whitefly-transmitted geminivirus associated with the leaf curl and mosaic symptoms on cotton in Egypt. Arab. J. Biotech. 1999, 2, 193–218. [Google Scholar]
  23. Whitaker, T.B. Detecting Mycotoxins in Agricultural Commodities. Mol. Biotechnol. 2003, 23, 61–72. [Google Scholar] [CrossRef]
  24. Lee, N.A.; Rachaputi, N.C.; Wright, G.C.; Krosch, S.; Norman, K.; Anderson, J.; Ambarwati, S.; Retnowati, I.; Dharmaputra, O.S.; Kennedy, I.R. Validation of analytical parameters of a competitive direct ELISA for aflatoxin B1in peanuts. Food Agric. Immunol. 2005, 16, 149–163. [Google Scholar] [CrossRef]
  25. Lee, S.D.; Yu, I.S.; Jung, K.; Kim, Y.S. Incidence and Level of Aflatoxins Contamination in Medicinal Plants in Korea. Mycobiology 2014, 42, 339–345. [Google Scholar] [CrossRef]
  26. Scaglioni, P.T.; Badiale-Furlong, E. Rice husk as an adsorbent: A new analytical approach to determine aflatoxins in milk. Talanta 2016, 152, 423–431. [Google Scholar] [CrossRef]
  27. Ertekin, Ö.; Pirinçci, Ş.Ş.; Öztürk, S. Monoclonal IgA Antibodies for Aflatoxin Immunoassays. Toxins 2016, 8, 148. [Google Scholar] [CrossRef]
  28. Saiki, R.K.; Gelfand, D.H.; Stoffel, S.; Scharf, S.J.; Higuchi, R.; Horn, G.T.; Mullis, K.B.; Erlich, H.A. Primer-directed enzymatic amplification of DNA with a thermostable DNA polymerase. Science 1988, 239, 487–491. [Google Scholar] [CrossRef] [PubMed]
  29. Rosano, G.L.; Ceccarelli, E.A. Recombinant protein expression in Escherichia coli: Advances and challenges. Front. Microbiol. 2014, 5, 172. [Google Scholar] [CrossRef] [PubMed]
  30. Laemmli, U.K. Cleavage of Structural Proteins during the Assembly of the Head of Bacteriophage T4. Nature 1970, 227, 680–685. [Google Scholar] [CrossRef] [PubMed]
  31. Fishback, J.E.; Stronsky, S.M.; Green, C.A.; Bean, K.D.; Froude, J.W. Erratum: Antibody production in rabbits administered Freund’s complete adjuvant and carprofen concurrently. Lab Anim. 2016, 45, 121. [Google Scholar] [CrossRef] [PubMed]
  32. Gianazza, E.; Arnaud, P. A general method for fractionation of plasma proteins. Dye-ligand affinity chromatography on immobilized Cibacron blue F3-GA. Biochem. J. 1982, 201, 129–136. [Google Scholar] [CrossRef] [PubMed]
  33. Avrameas, S. Coupling of enzymes to proteins with glutaraldehyde: Use of the conjugates for the detection of antigens and antibodies. Immunochemistry 1969, 6, 43–52. [Google Scholar] [CrossRef]
Figure 1. (A) PCR product amplified using the specific primers of the afIR gene (Aflatoxin B1). M: DNA marker and afIR the amplified gene in molecular size about 760 bp. (B) The recombinant protein of the in vitro transcribed afIR gene (Aflatoxin B1) with molecular size about 28 kDa.
Toxins 13 00747 g001
Figure 2. Phylogenetic tree for the amplified aflatoxin B1 based on the DNA nucleotide sequence and compared with the other 50 AFB1genes listed on gene bank. The phylogeny was constructed using Mega 6 program.
Toxins 13 00747 g002
Figure 3. The predicted antigenic activity of the recombinant protein (afIR).
Toxins 13 00747 g003
Figure 4. I-ELISA standard curve for AflR recombinant protein using purified serum IgG.
Toxins 13 00747 g004
Figure 5. Correlations between HPLC and VICAM (A), HPLC and ELISA (B), ELISA and VICAM (C).
Toxins 13 00747 g005
Figure 6. Polyclonal antibody production protocol.
Toxins 13 00747 g006
Figure 7. Summary of experimental steps.
Toxins 13 00747 g007
Table 1. HPLC and VICAM screening analysis of 36 food samples for aflatoxin detection.
SamplesHPLCVICAM
Peanut 1++++++
Peanut 2+++++
Peanut 3++++++
Flour 1++++
Flour 2+++++
Flour 3+++
Milk-powder 1++++
Milk-powder 2++
Milk-powder 3+++
+: refers to low aflatoxin contamination level; ++: refers to moderate aflatoxin contamination level; +++: refers to high aflatoxin contamination level.
Table 2. Predicted peptides with antigenic activity, their length, and positions.
No.StartEndPeptideLength>aflIR d Deduced Amino Acid Sequence
12633LMQVPKIY8MSHSYNTFAGWFINTPTGRTQGSLALMQVPKI
26676EHYLLFLVQFV11YLAGNKSFLGSQPAHDGLRYLEPEACMRAGQL
3107120TPQLVTFVYIHLDL14AEHYLLFLVQFVNRSRSSLVTRFQPRYVNKEC
4136143FTLCVPPRLA8TARQSLGQVRTPQLVTFVYIHLDLSARQRKGO
5170179PGRCVPPPRLA10ATLQEKAFTLCVFFPAFNSKLYSTPSSRPPRW
6186196IAVRVVPVQKC11LTIFPPGHIPGRCVPPRLAALESSGIAVRVVPVQKC
7205215VLGVSNVVLPV11DAPRRNRPVLGVSNVVLPVNTWSPSGWAAT
8227236RALPVPLIQL10RALPVPLIQLGDHQRVFLQPDRNRDIRRIT
Table 3. Comparative results obtained by HPLC, VICAM, specific PCR, and I-ELISA (ng/g).
SampleHPLC (ng/g)VICAM (ng/g)Specific PCRELISA
(ng/mL)
Peanut 13.26 ± 0.68 a5.86 ± 0.58 a+3.43 ± 0.40 a,b
Peanut 22.83 ± 0.58 a5.46 ± 1.26 a+4.76 ± 0.92 a
Peanut 32.50 ± 0.10 a6.20 ± 0.45 a+2.36 ± 0.90 b,c
Flour 10.60 ± 0.23 b1.90 ± 0.36 c+1.98 ± 0.94 b,c
Flour 20.44 ± 0.22 b1.83 ± 0.35 c+3.33 ± 0.51 a,b
Flour 30.66 ± 0.15 b2.20 ± 0.20 c+1.82 ± 1.01 c
Milk-powder 10.93 ± 0.71 b2.90 ± 0.70 b,c+4.26 ± 0.81 a
Milk-powder 20.82 ± 0.50 b3.83 ± 0.55 b+1.55 ± 0.67 c
Milk-powder 31.23 ± 0.62 b3.60 ± 0.91 b+1.46 ± 0.84 c
The mean values indicated in the same column within variable with different superscripts (a, b, and c) were significantly different (p < 0.05); +: present of fungal infection.
Table 4. Comparison between HPLC, VICAM, and validated method I-ELISA.
Parameters HPLCVICAMI-ELISA
Limit of detection<0.008 ng/mL<2 ng/mL<1 ng/mL
Time of analysis120 min90 min30 min
Cost of analysisHighModerateModerate
Use of organic solventsYesYesNo
Publisher’s Note: MDPI stays neutral with regard to jurisdictional claims in published maps and institutional affiliations.

