Indoxyl Sulfate Contributes to mTORC1-Induced Renal Fibrosis via The OAT/NADPH Oxidase/ROS Pathway

 , and
, and 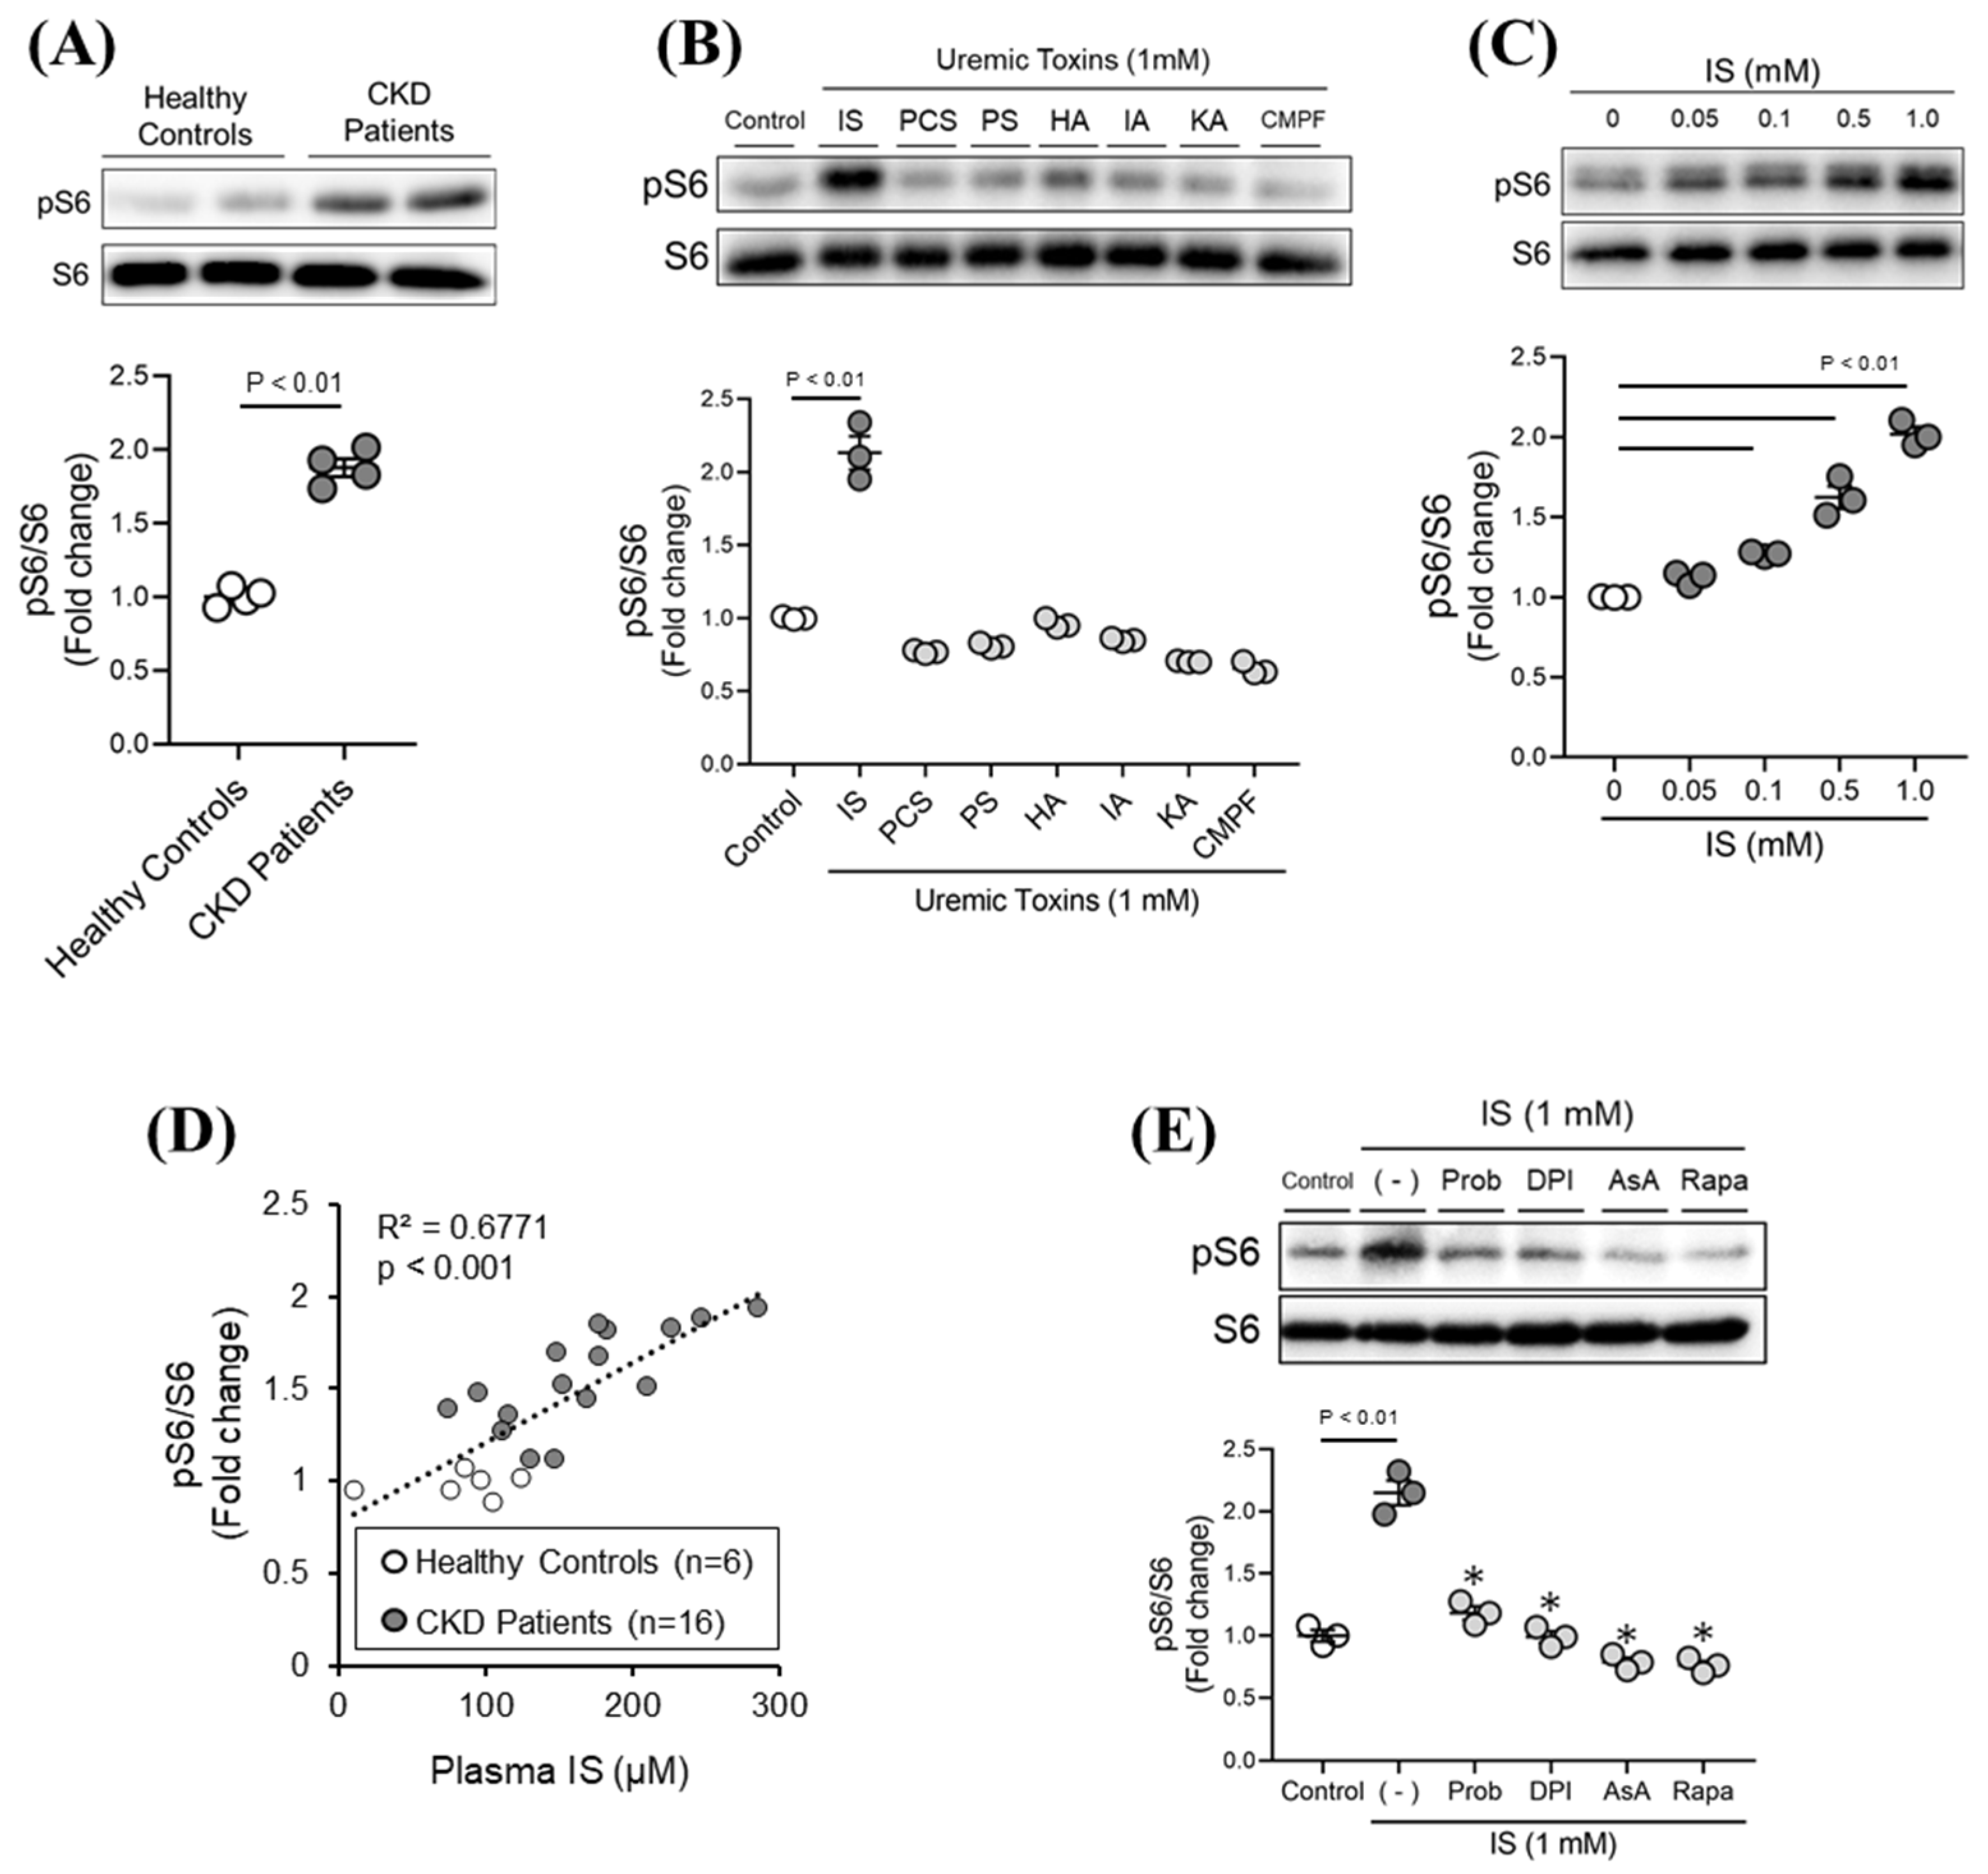
Abstract
:1. Introduction
2. Results
2.1. Effect of Various Uremic Toxins on mTORC1 Activity in Renal Tubular Epithelial Cells (HK-2)
2.2. Molecular Mechanism of IS-Induced mTORC1 Activation
2.3. Involvement of IS-Induced mTORC1 Activation in Fibrotic Responses of Tubular Epithelial Cells, Renal Fibroblasts, and Macrophages
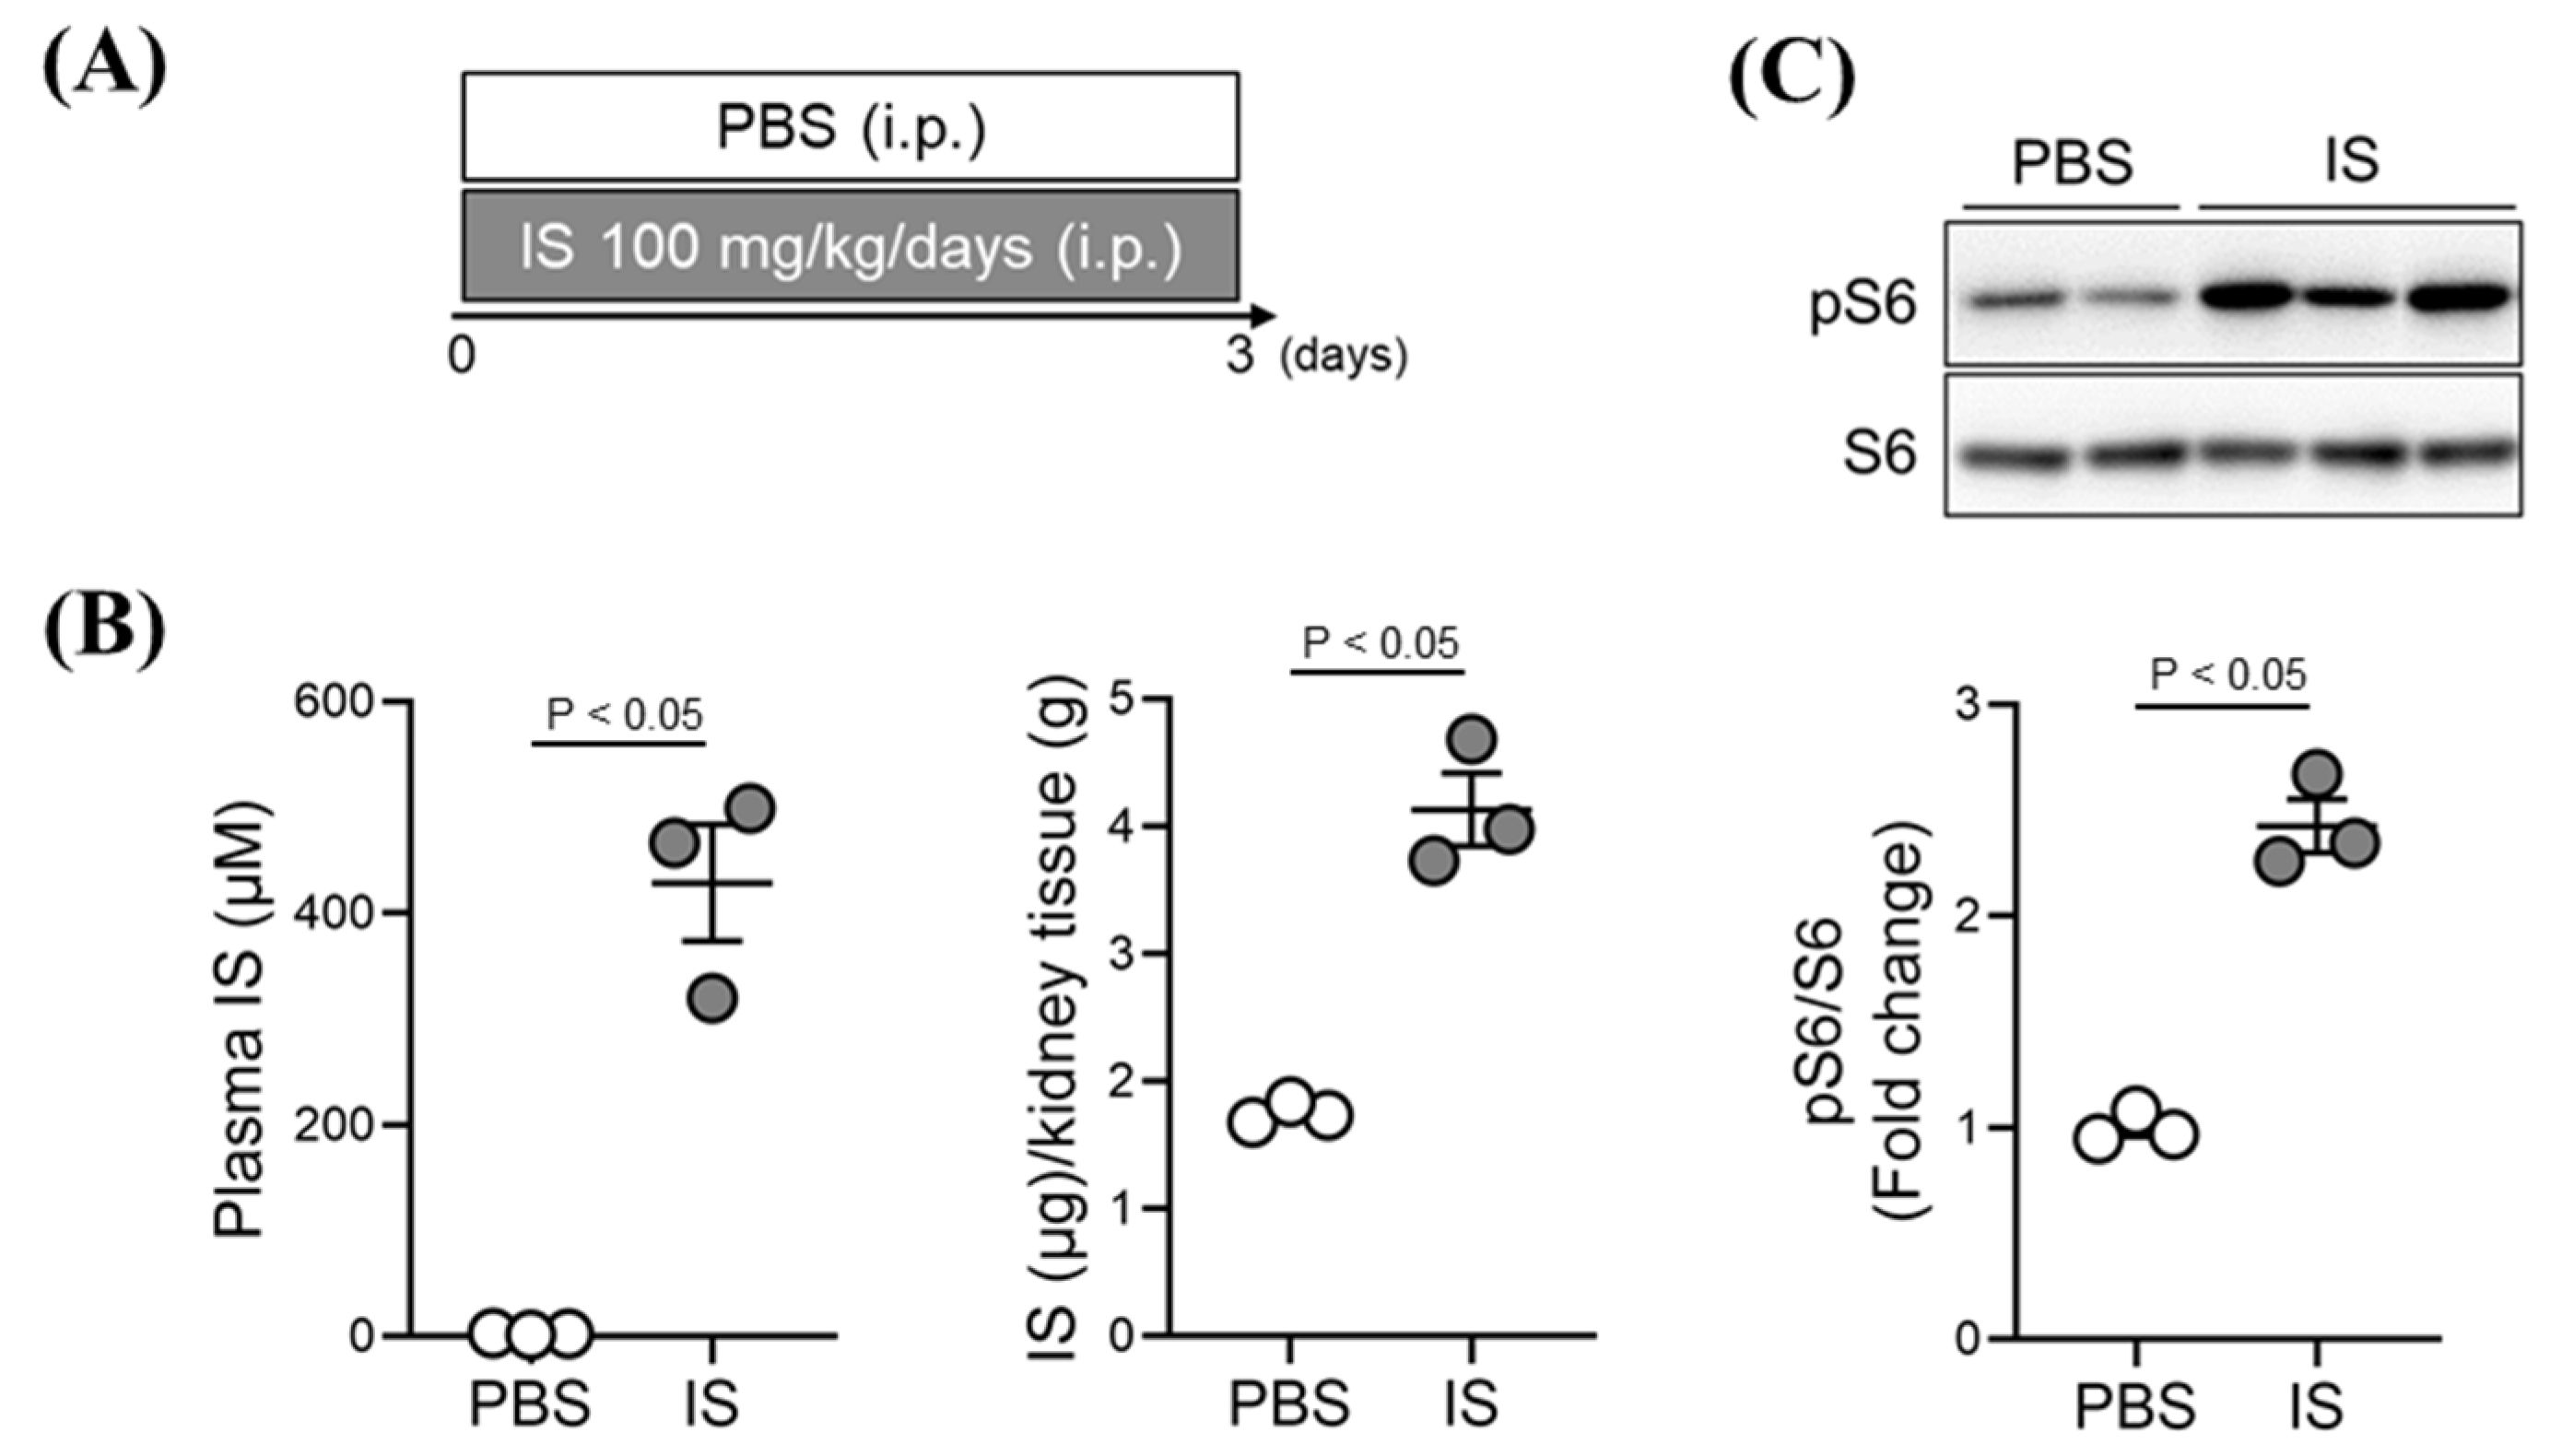
2.4. Effect of Exogenous IS-Overload on mTORC1 Activity in Renal Tissue of Healthy Mice
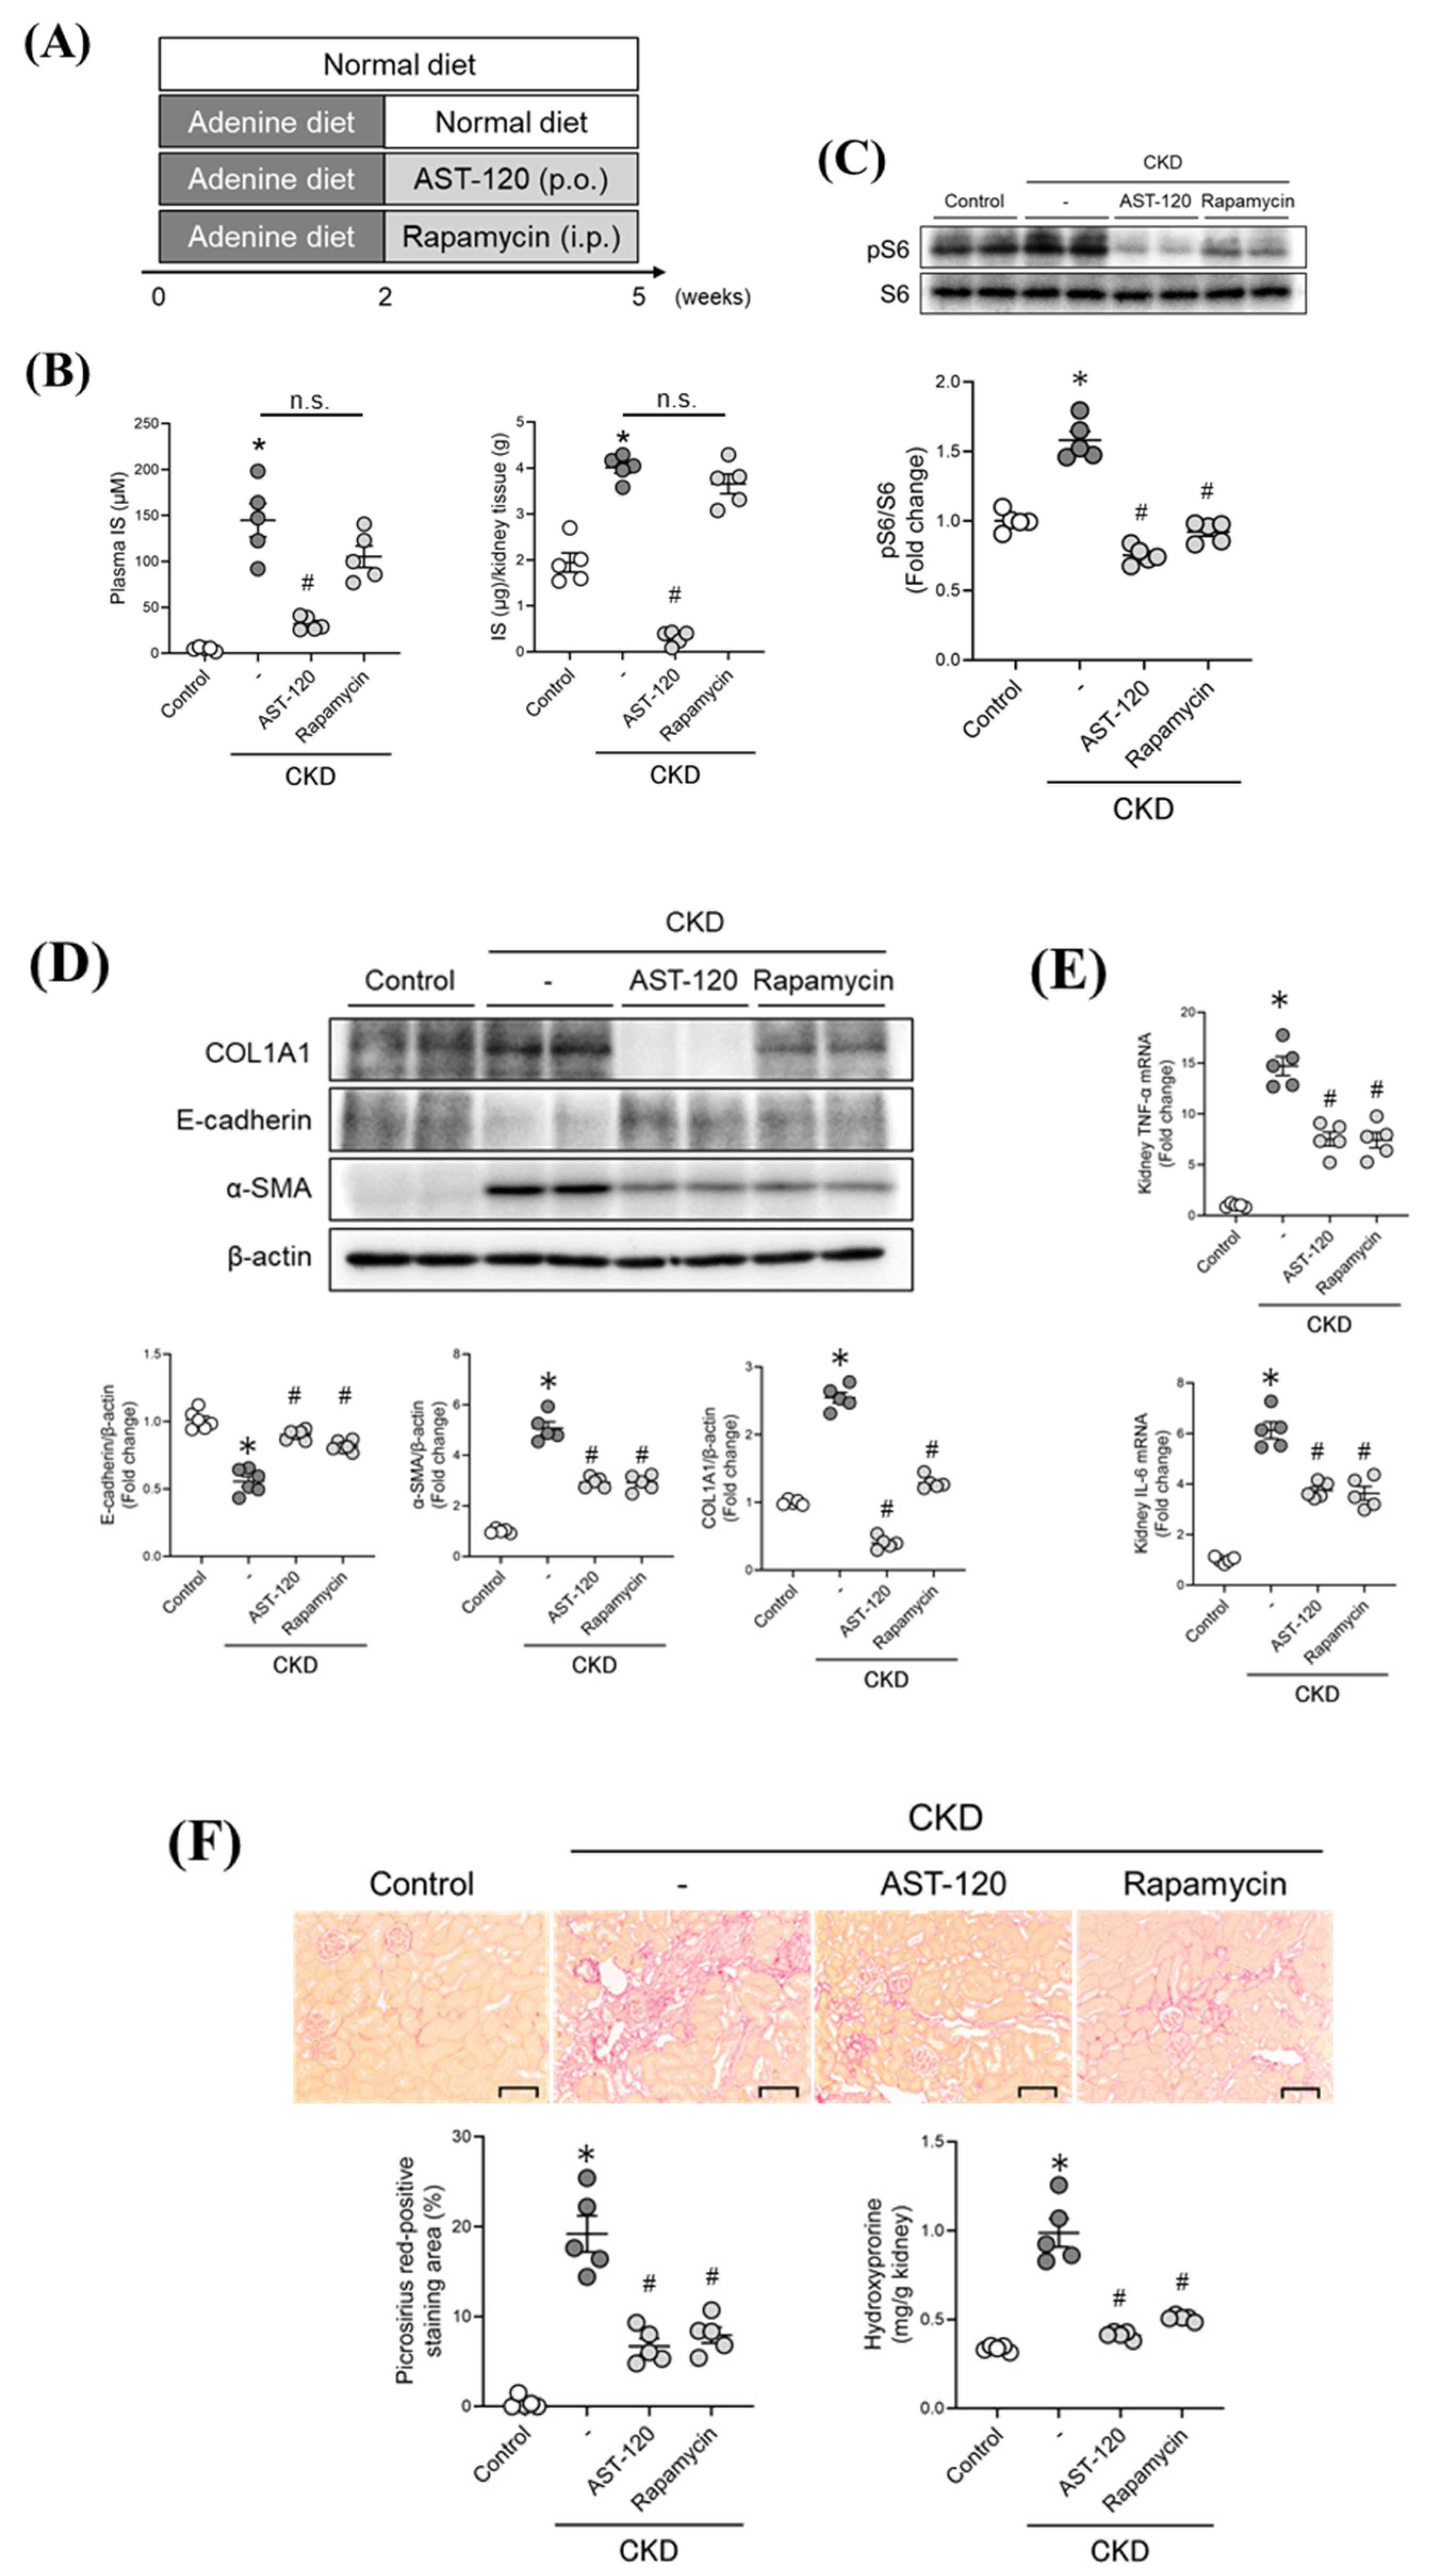
2.5. Therapeutic Intervention Involving Targeting the IS/mTORC1 Pathway in CKD Mice
3. Discussion
4. Conclusions
5. Materials and Methods
5.1. Chemicals and Materials
5.2. Cell Culture
5.3. Cell Experiments with Serum Samples from CKD Patients
5.4. Western Blot Analysis
5.5. Quantitative RT-PCR
5.6. HPLC Analysis
5.7. Animal Experiments
5.8. Histological Analysis
5.9. Hydroxyproline Assay
5.10. Statistical Analysis
Supplementary Materials
Author Contributions
Funding
Institutional Review Board Statement
Informed Consent Statement
Data Availability Statement
Acknowledgments
Conflicts of Interest
References
- Ruiz-Ortega, M.; Rayego-Mateos, S.; Lamas, S.; Ortiz, A.; Rodrigues-Diez, R.R. Targeting the progression of chronic kidney disease. Nat. Rev. Nephrol. 2020, 16, 269–288. [Google Scholar] [CrossRef]
- Gödel, M.; Hartleben, B.; Herbach, N.; Liu, S.; Zschiedrich, S.; Lu, S.; Debreczeni-Mór, A.; Lindenmeyer, M.T.; Rastaldi, M.P.; Hartleben, G.; et al. Role of mTOR in podocyte function and diabetic nephropathy in humans and mice. J. Clin. Invest. 2011, 121, 2197–2209. [Google Scholar] [CrossRef] [Green Version]
- Shillingford, J.M.; Murcia, N.S.; Larson, C.H.; Low, S.H.; Hedgepeth, R.; Brown, N.; Flask, C.A.; Novick, A.C.; Goldfarb, D.A.; Kramer-Zucker, A.; et al. The mTOR pathway is regulated by polycystin-1, and its inhibition reverses renal cystogenesis in polycystic kidney disease. Proc. Natl. Acad. Sci. USA 2006, 103, 5466–5471. [Google Scholar] [CrossRef] [PubMed] [Green Version]
- Zschiedrich, S.; Bork, T.; Liang, W.; Wanner, N.; Eulenbruch, K.; Munder, S.; Hartleben, B.; Kretz, O.; Gerber, S.; Simons, M.; et al. Targeting mTOR Signaling Can Prevent the Progression of FSGS. J. Am. Soc. Nephrol. 2017, 28, 2144–2157. [Google Scholar] [CrossRef] [Green Version]
- Tomita, I.; Kume, S.; Sugahara, S.; Osawa, N.; Yamahara, K.; Yasuda-Yamahara, M.; Takeda, N.; Chin-Kanasaki, M.; Kaneko, T.; Mayoux, E.; et al. SGLT2 Inhibition Mediates Protection from Diabetic Kidney Disease by Promoting Ketone Body-Induced mTORC1 Inhibition. Cell Metab. 2020, 32, 404–419.e406. [Google Scholar] [CrossRef] [PubMed]
- Zafar, I.; Ravichandran, K.; Belibi, F.A.; Doctor, R.B.; Edelstein, C.L. Sirolimus attenuates disease progression in an orthologous mouse model of human autosomal dominant polycystic kidney disease. Kidney Int. 2010, 78, 754–761. [Google Scholar] [CrossRef] [Green Version]
- Das, R.; Kim, S.J.; Nguyen, N.T.; Kwon, H.J.; Cha, S.K.; Park, K.S. Inhibition of the ERK1/2-mTORC1 axis ameliorates proteinuria and the fibrogenic action of transforming growth factor-β in Adriamycin-induced glomerulosclerosis. Kidney Int. 2019, 96, 927–941. [Google Scholar] [CrossRef]
- Li, H.; Peng, X.; Wang, Y.; Cao, S.; Xiong, L.; Fan, J.; Zhuang, S.; Yu, X.; Mao, H. Atg5-mediated autophagy deficiency in proximal tubules promotes cell cycle G2/M arrest and renal fibrosis. Autophagy 2016, 12, 1472–1486. [Google Scholar] [CrossRef] [PubMed] [Green Version]
- Jiang, M.; Wei, Q.; Dong, G.; Komatsu, M.; Su, Y.; Dong, Z. Autophagy in proximal tubules protects against acute kidney injury. Kidney Int. 2012, 82, 1271–1283. [Google Scholar] [CrossRef] [Green Version]
- Andrikopoulos, P.; Kieswich, J.; Pacheco, S.; Nadarajah, L.; Harwood, S.M.; O’Riordan, C.E.; Thiemermann, C.; Yaqoob, M.M. The MEK Inhibitor Trametinib Ameliorates Kidney Fibrosis by Suppressing ERK1/2 and mTORC1 Signaling. J. Am. Soc. Nephrol. 2019, 30, 33–49. [Google Scholar] [CrossRef] [Green Version]
- Padovano, V.; Podrini, C.; Boletta, A.; Caplan, M.J. Metabolism and mitochondria in polycystic kidney disease research and therapy. Nat. Rev. Nephrol. 2018, 14, 678–687. [Google Scholar] [CrossRef] [PubMed]
- Jiang, L.; Xu, L.; Mao, J.; Li, J.; Fang, L.; Zhou, Y.; Liu, W.; He, W.; Zhao, A.Z.; Yang, J.; et al. Rheb/mTORC1 signaling promotes kidney fibroblast activation and fibrosis. J. Am. Soc. Nephrol. 2013, 24, 1114–1126. [Google Scholar] [CrossRef] [PubMed] [Green Version]
- Yoshida, S.; Hong, S.; Suzuki, T.; Nada, S.; Mannan, A.M.; Wang, J.; Okada, M.; Guan, K.L.; Inoki, K. Redox regulates mammalian target of rapamycin complex 1 (mTORC1) activity by modulating the TSC1/TSC2-Rheb GTPase pathway. J. Biol. Chem. 2011, 286, 32651–32660. [Google Scholar] [CrossRef] [PubMed] [Green Version]
- Vanholder, R.; Schepers, E.; Pletinck, A.; Nagler, E.V.; Glorieux, G. The uremic toxicity of indoxyl sulfate and p-cresyl sulfate: A systematic review. J. Am. Soc. Nephrol. 2014, 25, 1897–1907. [Google Scholar] [CrossRef]
- Sakai, T.; Takadate, A.; Otagiri, M. Characterization of binding site of uremic toxins on human serum albumin. Biol. Pharm. Bull. 1995, 18, 1755–1761. [Google Scholar] [CrossRef] [Green Version]
- Wu, I.W.; Hsu, K.H.; Lee, C.C.; Sun, C.Y.; Hsu, H.J.; Tsai, C.J.; Tzen, C.Y.; Wang, Y.C.; Lin, C.Y.; Wu, M.S. p-Cresyl sulphate and indoxyl sulphate predict progression of chronic kidney disease. Nephrol. Dial. Transplant. 2011, 26, 938–947. [Google Scholar] [CrossRef] [PubMed] [Green Version]
- Nakano, T.; Katsuki, S.; Chen, M.; Decano, J.L.; Halu, A.; Lee, L.H.; Pestana, D.V.S.; Kum, A.S.T.; Kuromoto, R.K.; Golden, W.S.; et al. Uremic Toxin Indoxyl Sulfate Promotes Proinflammatory Macrophage Activation Via the Interplay of OATP2B1 and Dll4-Notch Signaling. Circulation 2019, 139, 78–96. [Google Scholar] [CrossRef] [PubMed]
- Enoki, Y.; Watanabe, H.; Arake, R.; Fujimura, R.; Ishiodori, K.; Imafuku, T.; Nishida, K.; Sugimoto, R.; Nagao, S.; Miyamura, S.; et al. Potential therapeutic interventions for chronic kidney disease-associated sarcopenia via indoxyl sulfate-induced mitochondrial dysfunction. J. Cachexia Sarcopenia Muscle 2017, 8, 735–747. [Google Scholar] [CrossRef]
- Watanabe, K.; Tominari, T.; Hirata, M.; Matsumoto, C.; Hirata, J.; Murphy, G.; Nagase, H.; Miyaura, C.; Inada, M. Indoxyl sulfate, a uremic toxin in chronic kidney disease, suppresses both bone formation and bone resorption. FEBS Open Bio. 2017, 7, 1178–1185. [Google Scholar] [CrossRef] [PubMed]
- Bobot, M.; Thomas, L.; Moyon, A.; Fernandez, S.; McKay, N.; Balasse, L.; Garrigue, P.; Brige, P.; Chopinet, S.; Poitevin, S.; et al. Uremic Toxic Blood-Brain Barrier Disruption Mediated by AhR Activation Leads to Cognitive Impairment during Experimental Renal Dysfunction. J. Am. Soc. Nephrol. 2020, 31, 1509–1521. [Google Scholar] [CrossRef]
- Tanaka, S.; Watanabe, H.; Nakano, T.; Imafuku, T.; Kato, H.; Tokumaru, K.; Arimura, N.; Enoki, Y.; Maeda, H.; Tanaka, M.; et al. Indoxyl Sulfate Contributes to Adipose Tissue Inflammation through the Activation of NADPH Oxidase. Toxins 2020, 12, 502. [Google Scholar] [CrossRef] [PubMed]
- Enoki, Y.; Watanabe, H.; Arake, R.; Sugimoto, R.; Imafuku, T.; Tominaga, Y.; Ishima, Y.; Kotani, S.; Nakajima, M.; Tanaka, M.; et al. Indoxyl sulfate potentiates skeletal muscle atrophy by inducing the oxidative stress-mediated expression of myostatin and atrogin-1. Sci. Rep. 2016, 6, 32084. [Google Scholar] [CrossRef]
- Liu, Y. Cellular and molecular mechanisms of renal fibrosis. Nat. Rev. Nephrol. 2011, 7, 684–696. [Google Scholar] [CrossRef]
- Kogot-Levin, A.; Hinden, L.; Riahi, Y.; Israeli, T.; Tirosh, B.; Cerasi, E.; Mizrachi, E.B.; Tam, J.; Mosenzon, O.; Leibowitz, G. Proximal Tubule mTORC1 Is a Central Player in the Pathophysiology of Diabetic Nephropathy and Its Correction by SGLT2 Inhibitors. Cell Rep. 2020, 32, 107954. [Google Scholar] [CrossRef]
- Yasuda, M.; Tanaka, Y.; Kume, S.; Morita, Y.; Chin-Kanasaki, M.; Araki, H.; Isshiki, K.; Araki, S.; Koya, D.; Haneda, M.; et al. Fatty acids are novel nutrient factors to regulate mTORC1 lysosomal localization and apoptosis in podocytes. Biochim. Biophys. Acta 2014, 1842, 1097–1108. [Google Scholar] [CrossRef]
- Kuwagata, S.; Kume, S.; Chin-Kanasaki, M.; Araki, H.; Araki, S.; Nakazawa, J.; Sugaya, T.; Koya, D.; Haneda, M.; Maegawa, H.; et al. MicroRNA148b-3p inhibits mTORC1-dependent apoptosis in diabetes by repressing TNFR2 in proximal tubular cells. Kidney Int. 2016, 90, 1211–1225. [Google Scholar] [CrossRef] [PubMed]
- Kumar, V.; Kurth, T.; Zheleznova, N.N.; Yang, C.; Cowley, A.W., Jr. NOX4/H(2)O(2)/mTORC1 Pathway in Salt-Induced Hypertension and Kidney Injury. Hypertension 2020, 76, 133–143. [Google Scholar] [CrossRef]
- Poesen, R.; Viaene, L.; Verbeke, K.; Claes, K.; Bammens, B.; Sprangers, B.; Naesens, M.; Vanrenterghem, Y.; Kuypers, D.; Evenepoel, P.; et al. Renal clearance and intestinal generation of p-cresyl sulfate and indoxyl sulfate in CKD. Clin. J. Am. Soc. Nephrol. 2013, 8, 1508–1514. [Google Scholar] [CrossRef] [PubMed] [Green Version]
- Nakagawa, K.; Itoya, M.; Takemoto, N.; Matsuura, Y.; Tawa, M.; Matsumura, Y.; Ohkita, M. Indoxyl sulfate induces ROS production via the aryl hydrocarbon receptor-NADPH oxidase pathway and inactivates NO in vascular tissues. Life Sci. 2021, 265, 118807. [Google Scholar] [CrossRef] [PubMed]
- Jansen, J.; Jansen, K.; Neven, E.; Poesen, R.; Othman, A.; van Mil, A.; Sluijter, J.; Sastre Torano, J.; Zaal, E.A.; Berkers, C.R.; et al. Remote sensing and signaling in kidney proximal tubules stimulates gut microbiome-derived organic anion secretion. Proc. Natl. Acad. Sci. USA 2019, 116, 16105–16110. [Google Scholar] [CrossRef] [Green Version]
- Kadowaki, D.; Anraku, M.; Sakaya, M.; Hirata, S.; Maruyama, T.; Otagiri, M. Olmesartan protects endothelial cells against oxidative stress-mediated cellular injury. Clin. Exp. Nephrol. 2015, 19, 1007–1014. [Google Scholar] [CrossRef]
- Poursaitidis, I.; Wang, X.; Crighton, T.; Labuschagne, C.; Mason, D.; Cramer, S.L.; Triplett, K.; Roy, R.; Pardo, O.E.; Seckl, M.J.; et al. Oncogene-Selective Sensitivity to Synchronous Cell Death following Modulation of the Amino Acid Nutrient Cystine. Cell Rep. 2017, 18, 2547–2556. [Google Scholar] [CrossRef] [Green Version]
- Ilatovskaya, D.V.; Blass, G.; Palygin, O.; Levchenko, V.; Pavlov, T.S.; Grzybowski, M.N.; Winsor, K.; Shuyskiy, L.S.; Geurts, A.M.; Cowley, A.W., Jr.; et al. A NOX4/TRPC6 Pathway in Podocyte Calcium Regulation and Renal Damage in Diabetic Kidney Disease. J. Am. Soc. Nephrol. 2018, 29, 1917–1927. [Google Scholar] [CrossRef] [PubMed] [Green Version]
- Kim, S.H.; Yu, M.A.; Ryu, E.S.; Jang, Y.H.; Kang, D.H. Indoxyl sulfate-induced epithelial-to-mesenchymal transition and apoptosis of renal tubular cells as novel mechanisms of progression of renal disease. Lab. Investig. 2012, 92, 488–498. [Google Scholar] [CrossRef] [Green Version]
- Ellis, R.J.; Small, D.M.; Ng, K.L.; Vesey, D.A.; Vitetta, L.; Francis, R.S.; Gobe, G.C.; Morais, C. Indoxyl Sulfate Induces Apoptosis and Hypertrophy in Human Kidney Proximal Tubular Cells. Toxicol. Pathol. 2018, 46, 449–459. [Google Scholar] [CrossRef] [PubMed] [Green Version]
- Milanesi, S.; Garibaldi, S.; Saio, M.; Ghigliotti, G.; Picciotto, D.; Ameri, P.; Garibotto, G.; Barisione, C.; Verzola, D. Indoxyl Sulfate Induces Renal Fibroblast Activation through a Targetable Heat Shock Protein 90-Dependent Pathway. Oxid. Med. Cell. Longev. 2019, 2019, 2050183. [Google Scholar] [CrossRef] [PubMed]
- Lv, J.; Chen, J.; Wang, M.; Yan, F. Klotho alleviates indoxyl sulfate-induced heart failure and kidney damage by promoting M2 macrophage polarization. Aging (Albany NY) 2020, 12, 9139–9150. [Google Scholar] [CrossRef]
- Hamza, E.; Metzinger, L.; Metzinger-Le Meuth, V. Uremic Toxins Affect Erythropoiesis during the Course of Chronic Kidney Disease: A Review. Cells 2020, 9, 2039. [Google Scholar] [CrossRef] [PubMed]
- Rhee, C.M.; Ahmadi, S.F.; Kovesdy, C.P.; Kalantar-Zadeh, K. Low-protein diet for conservative management of chronic kidney disease: A systematic review and meta-analysis of controlled trials. J. Cachexia Sarcopenia Muscle 2018, 9, 235–245. [Google Scholar] [CrossRef]
- Akizawa, T.; Asano, Y.; Morita, S.; Wakita, T.; Onishi, Y.; Fukuhara, S.; Gejyo, F.; Matsuo, S.; Yorioka, N.; Kurokawa, K. Effect of a carbonaceous oral adsorbent on the progression of CKD: A multicenter, randomized, controlled trial. Am. J. Kidney Dis. 2009, 54, 459–467. [Google Scholar] [CrossRef] [PubMed]
- Braun, W.E.; Schold, J.D.; Stephany, B.R.; Spirko, R.A.; Herts, B.R. Low-dose rapamycin (sirolimus) effects in autosomal dominant polycystic kidney disease: An open-label randomized controlled pilot study. Clin. J. Am. Soc. Nephrol. 2014, 9, 881–888. [Google Scholar] [CrossRef] [PubMed] [Green Version]
- Walz, G.; Budde, K.; Mannaa, M.; Nürnberger, J.; Wanner, C.; Sommerer, C.; Kunzendorf, U.; Banas, B.; Hörl, W.H.; Obermüller, N.; et al. Everolimus in patients with autosomal dominant polycystic kidney disease. N. Engl. J. Med. 2010, 363, 830–840. [Google Scholar] [CrossRef] [Green Version]
- Serra, A.L.; Poster, D.; Kistler, A.D.; Krauer, F.; Raina, S.; Young, J.; Rentsch, K.M.; Spanaus, K.S.; Senn, O.; Kristanto, P.; et al. Sirolimus and kidney growth in autosomal dominant polycystic kidney disease. N. Engl. J. Med. 2010, 363, 820–829. [Google Scholar] [CrossRef] [Green Version]
- Feigenbaum, J.; Neuberg, C.A. Simplified Method for the Preparation of Aromatic Sulfuric Acid Esters. J. Am. Chem. Soc. 1941, 63, 3529–3530. [Google Scholar] [CrossRef]
- Watanabe, H.; Miyamoto, Y.; Honda, D.; Tanaka, H.; Wu, Q.; Endo, M.; Noguchi, T.; Kadowaki, D.; Ishima, Y.; Kotani, S.; et al. p-Cresyl sulfate causes renal tubular cell damage by inducing oxidative stress by activation of NADPH oxidase. Kidney Int. 2013, 83, 582–592. [Google Scholar] [CrossRef] [Green Version]
- Kato, H.; Watanabe, H.; Imafuku, T.; Arimura, N.; Fujita, I.; Noguchi, I.; Tanaka, S.; Nakano, T.; Tokumaru, K.; Enoki, Y.; et al. Advanced oxidation protein products contribute to chronic kidney disease-induced muscle atrophy by inducing oxidative stress via CD36/NADPH oxidase pathway. J. Cachexia Sarcopenia Muscle 2021. [Google Scholar] [CrossRef] [PubMed]
- Watanabe, H.; Fujimura, R.; Hiramoto, Y.; Murata, R.; Nishida, K.; Bi, J.; Imafuku, T.; Komori, H.; Maeda, H.; Mukunoki, A.; et al. An acute phase protein α(1)-acid glycoprotein mitigates AKI and its progression to CKD through its anti-inflammatory action. Sci. Rep. 2021, 11, 7953. [Google Scholar] [CrossRef] [PubMed]
- Watanabe, H.; Noguchi, T.; Miyamoto, Y.; Kadowaki, D.; Kotani, S.; Nakajima, M.; Miyamura, S.; Ishima, Y.; Otagiri, M.; Maruyama, T. Interaction between two sulfate-conjugated uremic toxins, p-cresyl sulfate and indoxyl sulfate, during binding with human serum albumin. Drug Metab. Dispos. 2012, 40, 1423–1428. [Google Scholar] [CrossRef] [PubMed] [Green Version]
- Nishida, K.; Watanabe, H.; Murata, R.; Tokumaru, K.; Fujimura, R.; Oshiro, S.; Nagasaki, T.; Miyahisa, M.; Hiramoto, Y.; Nosaki, H.; et al. Recombinant Long-Acting Thioredoxin Ameliorates AKI to CKD Transition via Modulating Renal Oxidative Stress and Inflammation. Int. J. Mol. Sci. 2021, 22, 5600. [Google Scholar] [CrossRef] [PubMed]
- Oshiro, S.; Ishima, Y.; Maeda, H.; Honda, N.; Bi, J.; Kinoshita, R.; Ikeda, M.; Iwao, Y.; Imafuku, T.; Nishida, K.; et al. Dual Therapeutic Effects of an Albumin-Based Nitric Oxide Donor on 2 Experimental Models of Chronic Kidney Disease. J. Pharm. Sci. 2018, 107, 848–855. [Google Scholar] [CrossRef]


Publisher’s Note: MDPI stays neutral with regard to jurisdictional claims in published maps and institutional affiliations. |
© 2021 by the authors. Licensee MDPI, Basel, Switzerland. This article is an open access article distributed under the terms and conditions of the Creative Commons Attribution (CC BY) license (https://creativecommons.org/licenses/by/4.0/).
Share and Cite
Nakano, T.; Watanabe, H.; Imafuku, T.; Tokumaru, K.; Fujita, I.; Arimura, N.; Maeda, H.; Tanaka, M.; Matsushita, K.; Fukagawa, M.; et al. Indoxyl Sulfate Contributes to mTORC1-Induced Renal Fibrosis via The OAT/NADPH Oxidase/ROS Pathway. Toxins 2021, 13, 909. https://0-doi-org.brum.beds.ac.uk/10.3390/toxins13120909
Nakano T, Watanabe H, Imafuku T, Tokumaru K, Fujita I, Arimura N, Maeda H, Tanaka M, Matsushita K, Fukagawa M, et al. Indoxyl Sulfate Contributes to mTORC1-Induced Renal Fibrosis via The OAT/NADPH Oxidase/ROS Pathway. Toxins. 2021; 13(12):909. https://0-doi-org.brum.beds.ac.uk/10.3390/toxins13120909
Chicago/Turabian StyleNakano, Takehiro, Hiroshi Watanabe, Tadashi Imafuku, Kai Tokumaru, Issei Fujita, Nanaka Arimura, Hitoshi Maeda, Motoko Tanaka, Kazutaka Matsushita, Masafumi Fukagawa, and et al. 2021. "Indoxyl Sulfate Contributes to mTORC1-Induced Renal Fibrosis via The OAT/NADPH Oxidase/ROS Pathway" Toxins 13, no. 12: 909. https://0-doi-org.brum.beds.ac.uk/10.3390/toxins13120909