Article

Is the Cyanobacterial Bloom Composition Shifting Due to Climate Forcing or Nutrient Changes? Example of a Shallow Eutrophic Reservoir

1
ECOBIO (Ecosystems, Biodiversity, Evolution) UMR 6553, University Rennes 1, CNRS, 263 av. du général Leclerc, 35700 Rennes, France
2
Département Santé-Environnement, Agence Régionale de Santé de Bretagne, 32 bd de la Résistance, 56000 Vannes, France
3
Department of Biological Sciences, University of Quebec, C. P. 8888, Succ. Centre-Ville, Montréal, QC H3C 3P8, Canada
*
Author to whom correspondence should be addressed.
Submission received: 30 March 2021 / Revised: 5 May 2021 / Accepted: 11 May 2021 / Published: 13 May 2021

Abstract

:
Cyanobacterial blooms in eutrophic freshwater is a global threat to the functioning of ecosystems, human health and the economy. Parties responsible for the ecosystems and human health increasingly demand reliable predictions of cyanobacterial development to support necessary decisions. Long-term data series help with identifying environmental drivers of cyanobacterial developments in the context of climatic and anthropogenic pressure. Here, we analyzed 13 years of eutrophication and climatic data of a shallow temperate reservoir showing a high interannual variability of cyanobacterial development and composition, which is a less occurring and/or less described phenomenon compared to recurrant monospecific blooms. While between 2007–2012 Planktothrix agardhii dominated the cyanobacterial community, it shifted towards Microcystis sp. and then Dolichospermum sp. afterwards (2013–2019). The shift to Microcystis sp. dominance was mainly influenced by generally calmer and warmer conditions. The later shift to Dolichospermum sp. was driven by droughts influencing, amongst others, the N-load, as P remained unchanged over the time period. Both, climatic pressure and N-limitation contributed to the high variability of cyanobacterial blooms and may lead to a new equilibrium. The further reduction of P-load in parallel to the decreasing N-load is important to suppress cyanobacterial blooms and ameliorate ecosystem health.
Key Contribution: Long term (13 years) data were used to explain high variability in cyanobacterial bloom development and composition in a lowland reservoir; N-reduction and climatic forces (draughts increasing residence time) were identified as the main drivers. The phytoplankton community may be shifting from being dominated by Planktothrix sp. in the past to Microcystis sp. and Dolichospermum sp. in future, with the potential of increased production of cyanobacterial toxins.

1. Introduction

Recurrent and persistent mass developments (blooms) of cyanobacteria are one of the main outcomes of eutrophication of freshwater ecosystems, that is the natural increase in organic matter production and accumulation in an aquatic ecosystem, accelerated during the last decades by human activities [1,2,3,4]. Natural control of cyanobacterial blooms, e.g., by zooplankton, is limited by their low palatability owed to long filaments or colony formation and their low nutritional value, besides their toxicity [5]. Cyanobacterial dominance thus causes a misbalance and malfunctioning of the aquatic ecosystem by supressing the biodiversity of zooplankton, phytoplankton (via competition) and submerged macropytes (by shading), thereby disturbing trophic chains and fluxes [5,6,7]. The decay of phytoplankton including cyanobacteria consumes oxygen, affecting organisms in the water column and ultimately at the sediment. Bottom oxygen depletion limits phosphorus (P) fixation and enhances its release, thus accelerates eutrophication [8].
As various cyanobacteria produce bioactive or toxic metabolites, their mass development threatens organisms in the water body or depending on it [9,10,11]. To ensure human safety, many countries use thresholds of cyanobacterial cell densities combined with toxin concentration to restrict access for recreational activities, and the WHO has established guidelines of 1 µg L−1 of total microcystins in drinking water [12,13]. Managers and actors responsible for ecosystem and human health increasingly demand reliable predictions of seasonal cyanobacterial development as those regulations may cause financial consequences, including losses in income via recreational activities or increasing costs for drinking water purification. The different cyanobacteria genera comprise distinctive capabilities to form blooms or to produce specific toxins [6], which underlines the necessity to predict bloom formation, composition, duration and heterogeneity in a given water body.
Despite the urge to return or shift towards the dominance of eukaryotic phytoplankton, this remains difficult, as several physiological mechanisms enable cyanobacteria to outperform eukaryotic phytoplankton. Cyanobacteria grow better in low-light conditions, which occur either during mixing events or due to high phytoplankton biomass, moreover some cyanobacterial species possess gas-vesicles enabling them to adjust their light requirements via buoyancy in the water column [14]. They often benefit from faster uptake kinetics for CO2, a higher temperature optimum and lower N concentrations [14]. Additionally, several species are able to directly use dinitrogen as an N-source [8]. All of these features lead to a higher growth rate during summer, by which cyanobacteria can outcompete eukaryotic phytoplankton, leading to recurrent bloom situations.
Eutrophication is the main driver influencing cyanobacteria blooms, but temperature intensifies bloom frequency, duration and intensity [15]. Shallow lowland lakes suffer more from cyanobacteria because here nutrient loadings meet higher temperatures, and P is easily resuspended from the sediment due to their often polymictic character [6,16]. This applies even more to shallow reservoirs, which continuously receive nutrients (P, N) from the inflowing rivers, charging their sediments as they act as nutrient trap. If not reduced, eutrophication in combination with climate change will thus in future increase cyanobacterial blooms [6,17].
Due to the interaction of the driving factors and the differences from one water body to another, it remains difficult to foresee the development and density of a phytoplankton bloom, and particularly its species composition. Long-term data series help identify environmental drivers of cyanobacterial blooms’ occurrence and composition in the context of climatic and anthropogenic pressure and improve predictions for managers. Long term studies previously illustrated the trajectories of eutrophication. This knowledge was applied to reduce point source P pollution that led to a gradual decrease of phytoplanktonic biomass and/or changes in its composition towards eukaryotic species, as demonstrated for eight lakes or reservoirs of many examples by Fastner et al. [18]. The intensification of agricultural practices, however, increased again N and P flux towards adjacent waters, causing numerous lakes and reservoirs to experience or re-experience cyanobacterial blooms. Nevertheless, where effort has been made to reduce agricultural P and N emissions to a lake, it was followed by the amelioration of its water quality [19,20]. Long term (37 years) surveys showed changes in the cyanobacterial community composition towards diazotrophic species as consequence of N decrease while P remained constant, [21], whereas, in another lake, reduction in both N and P decreased also the proportion of N2 fixers in the phytoplankton community [20].
In accordance with their habitat characteristics in terms of depth, nutrient load, temperature, etc, the same species will dominate recurrent blooms in most lakes. Microcystis sp. continuously dominates for example Lake Taihu, China [22,23] or the Aguieira reservoir in Portugal [24], while Planktothrix agardhii perennially dominates shallow eutrophic water bodies in lowland areas of the Netherlands and Northern Germany [25,26]. Compared to large monospecific blooms, interannual variation amongst cyanobacterial dominance needs better understanding as it can be a good indicator for changes in climatic and anthropogenic pressure. Interannual variations may indicate a shift towards a new state of the composition of the bloom.
The investigated shallow reservoir has received its eutrophication with the incoming rivers during the past decades. It shows a high variability of cyanobacterial development between years, for which the driving factors are not yet identified. Aims were therefore 1) to characterize the seasonal dynamic of the nutrient pattern as well as the phytoplankton and zooplankton succession over a one-year period, and 2) to identify the driving factors of cyanobacterial development over 13 years of monitoring, testing the hypothesis that nutrients, phyto- and zooplankton in the reservoir differ along the transect from entrance to outlet (H1), and that even in this short time series, climatic forcing changes the dynamics of cyanobacterial blooms (H2).

2. Results

2.1. Seasonal Cycle

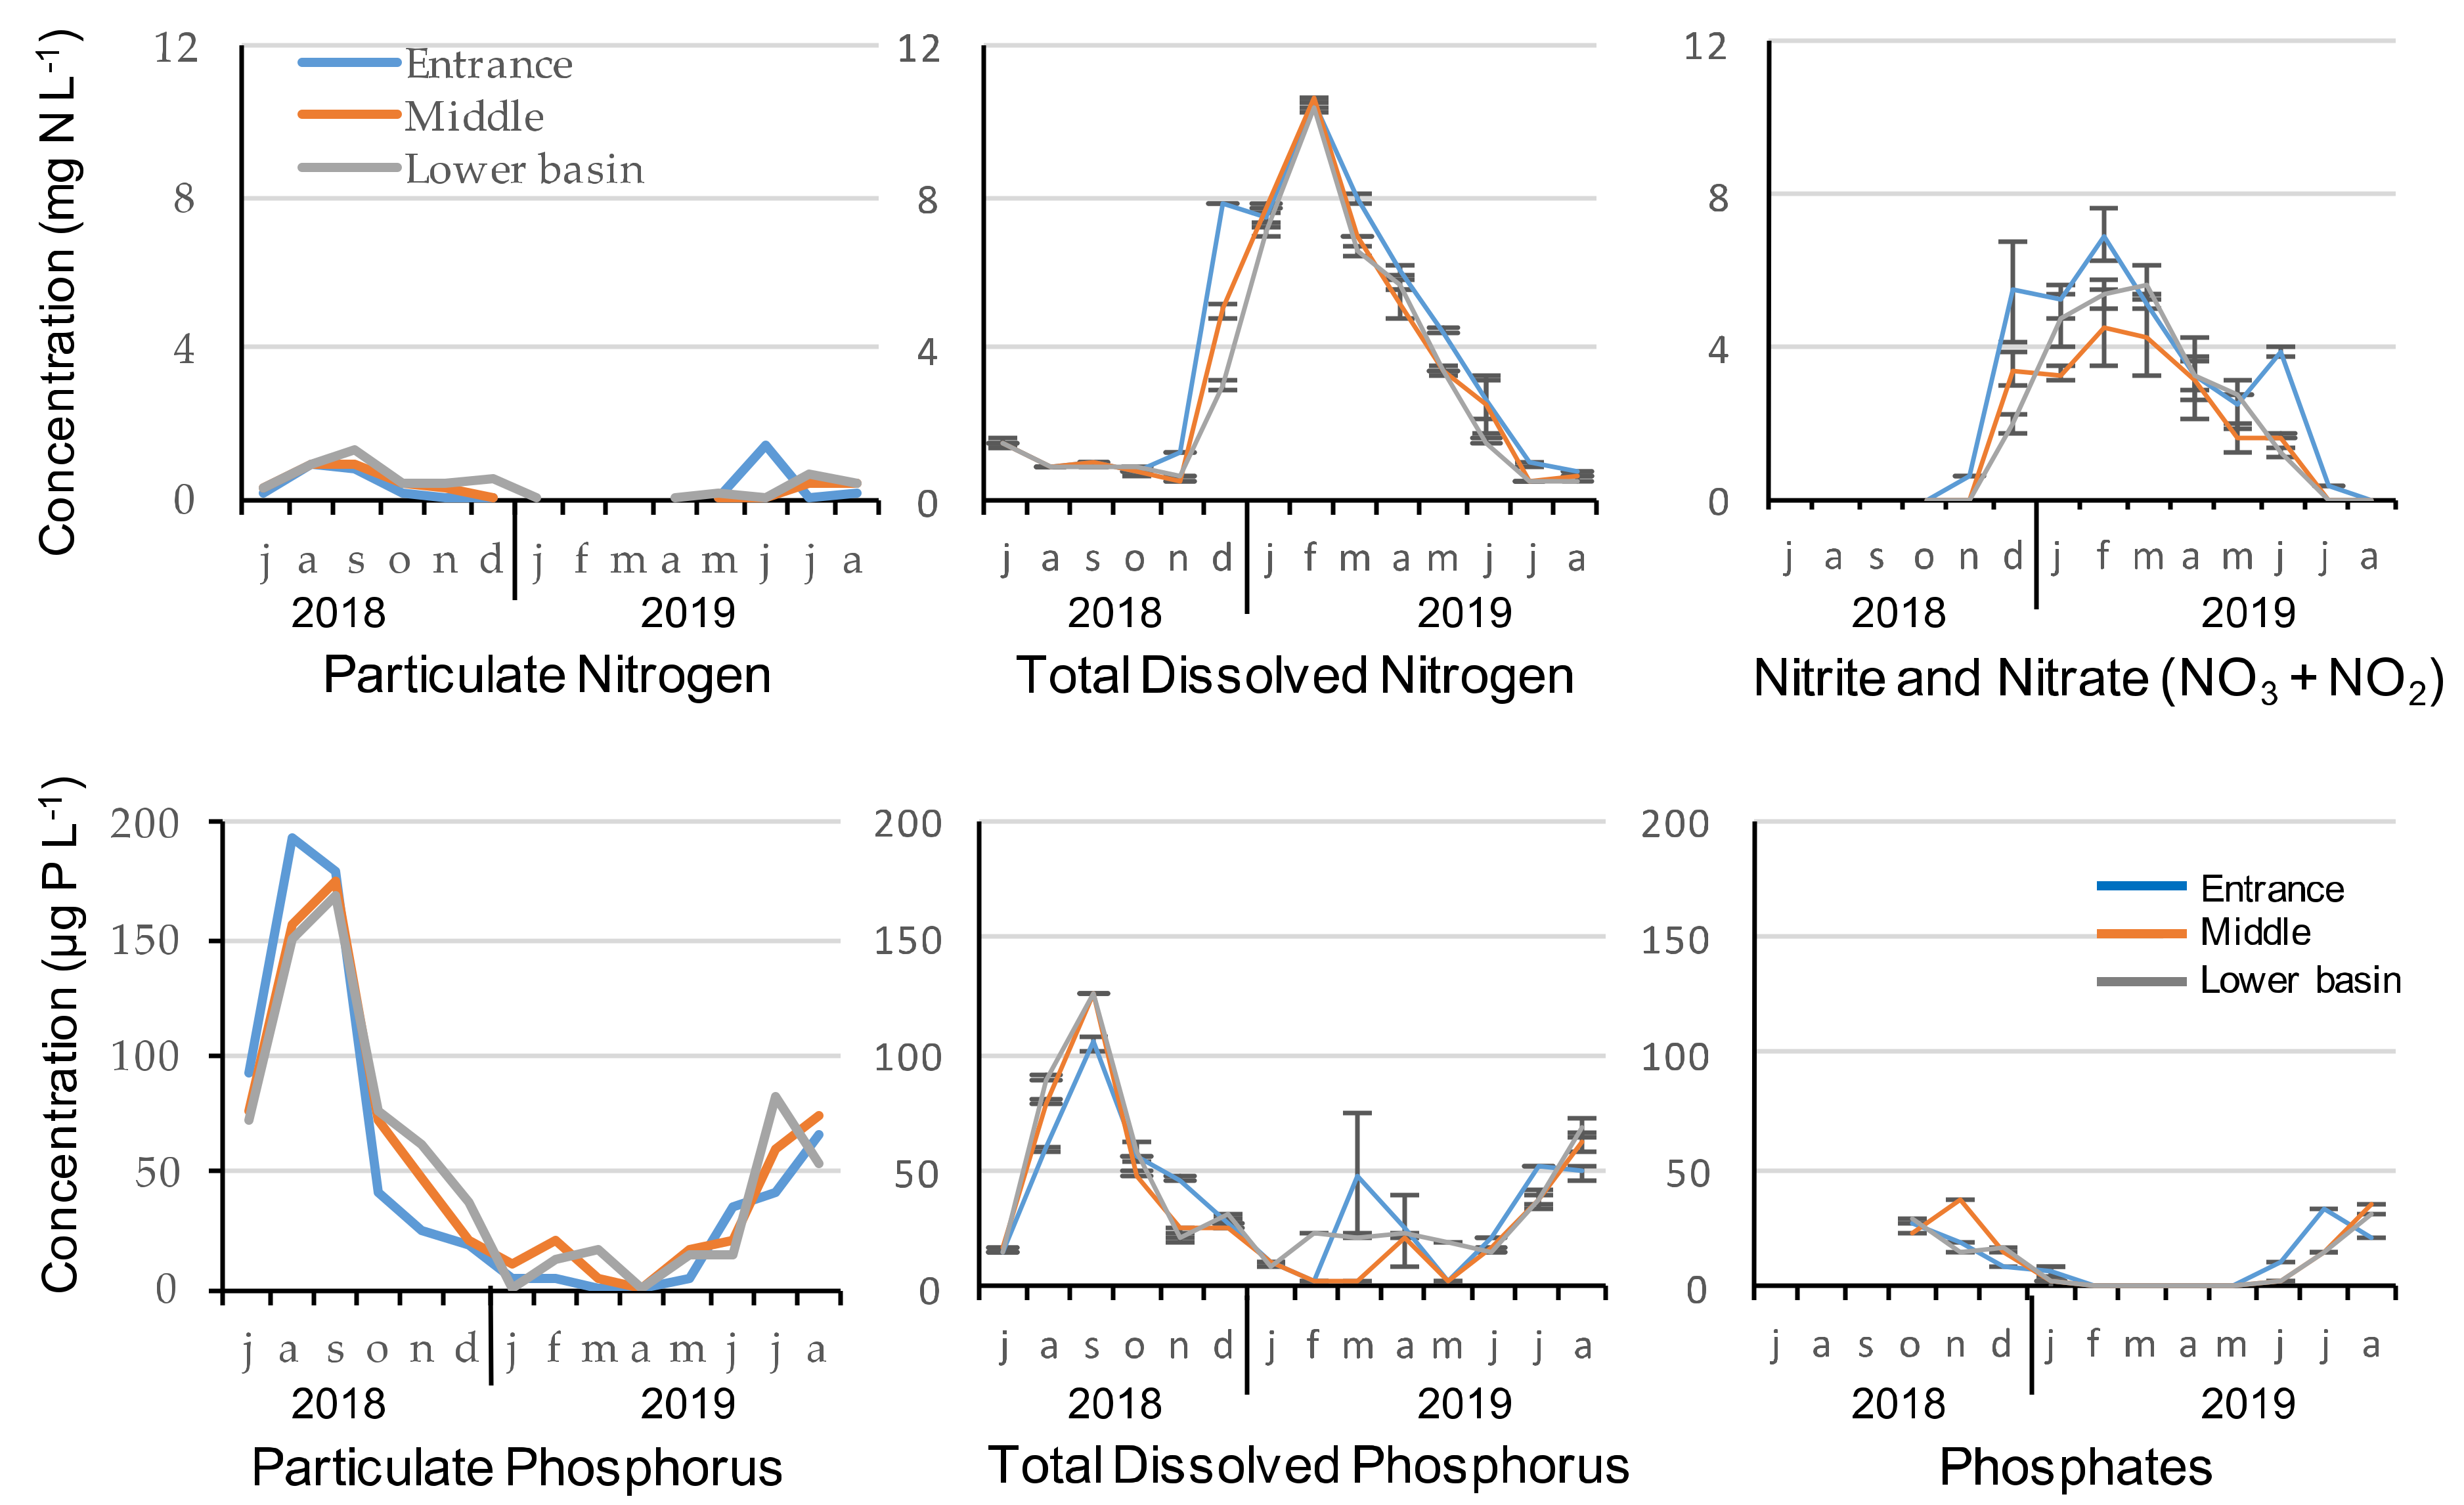
2.1.1. Nutrients’ Concentration

Nutrients’ concentrations were very similar at the entrance, in the middle and lower basin of the reservoir during the 2018–2019 seasonal cycle (Figure 1). No significant difference was observed between the three stations in terms of nutrient concentrations but nitrogen and phosphorus concentrations revealed different patterns of seasonal variability. Total dissolved nitrogen and nitrate–nitrite were highly correlated (Spearman correlations, rS > 0.92, p < 0.001) and reached maximum concentrations in winter. Particulate N was low, but still corresponded to the particulate P concentrations during that period. Using the theoretical composition of the phytoplankton with the Redfield ratio and the ratios given by Reynolds (2006), we find that 150 µg of P corresponds to 1.05 mg N/L (mass ratio of 47:7:1 for C:N:P) and are therefore consistent with particulate N concentrations of 1.25 mg N/L. During periods of high concentrations in N, dissolved nitrogen reached almost 100% of the total N from January to May, as particulate N remained below LOQ for several sampling dates. During that period, nitrate and nitrite accounted for 65% of the total dissolved nitrogen.
Particulate phosphorus, total dissolved phosphorus and phosphate maximum concentrations were recorded during summer, and both particulate P and TDP were correlated (Spearman correlations, rS = 0.65, p < 0.001). Phosphorus concentrations of all fractions were very low from January to May, but reached almost 180 μg L−1 for particulate P and 125 μg L−1 for TDP at the end of summer, in September 2018. From June to December, total phosphorus was mainly composed of particulate phosphorus for two thirds and TDP for one third. The dissolved fraction accounted on average for 49 ± 24 %, 40 ± 10 % and 40 ± 13 % at the entrance, middle and in the lower basin of the reservoir, respectively. Among this dissolved fraction, more than half was composed of phosphate (mean = 53 ± 10 %, 59 ± 23 % and 53 ± 12 % at the entrance, middle and in the lower basin of the reservoir, respectively). N/P Redfield ratios were low at the entrance of the reservoir (<10 with mean = 6 ± 4), while there were closer to 16 in the middle (>10 with mean = 12.6 ± 1.6) and the lower basin (>10 with mean = 14.9 ± 3.5; Table 1).

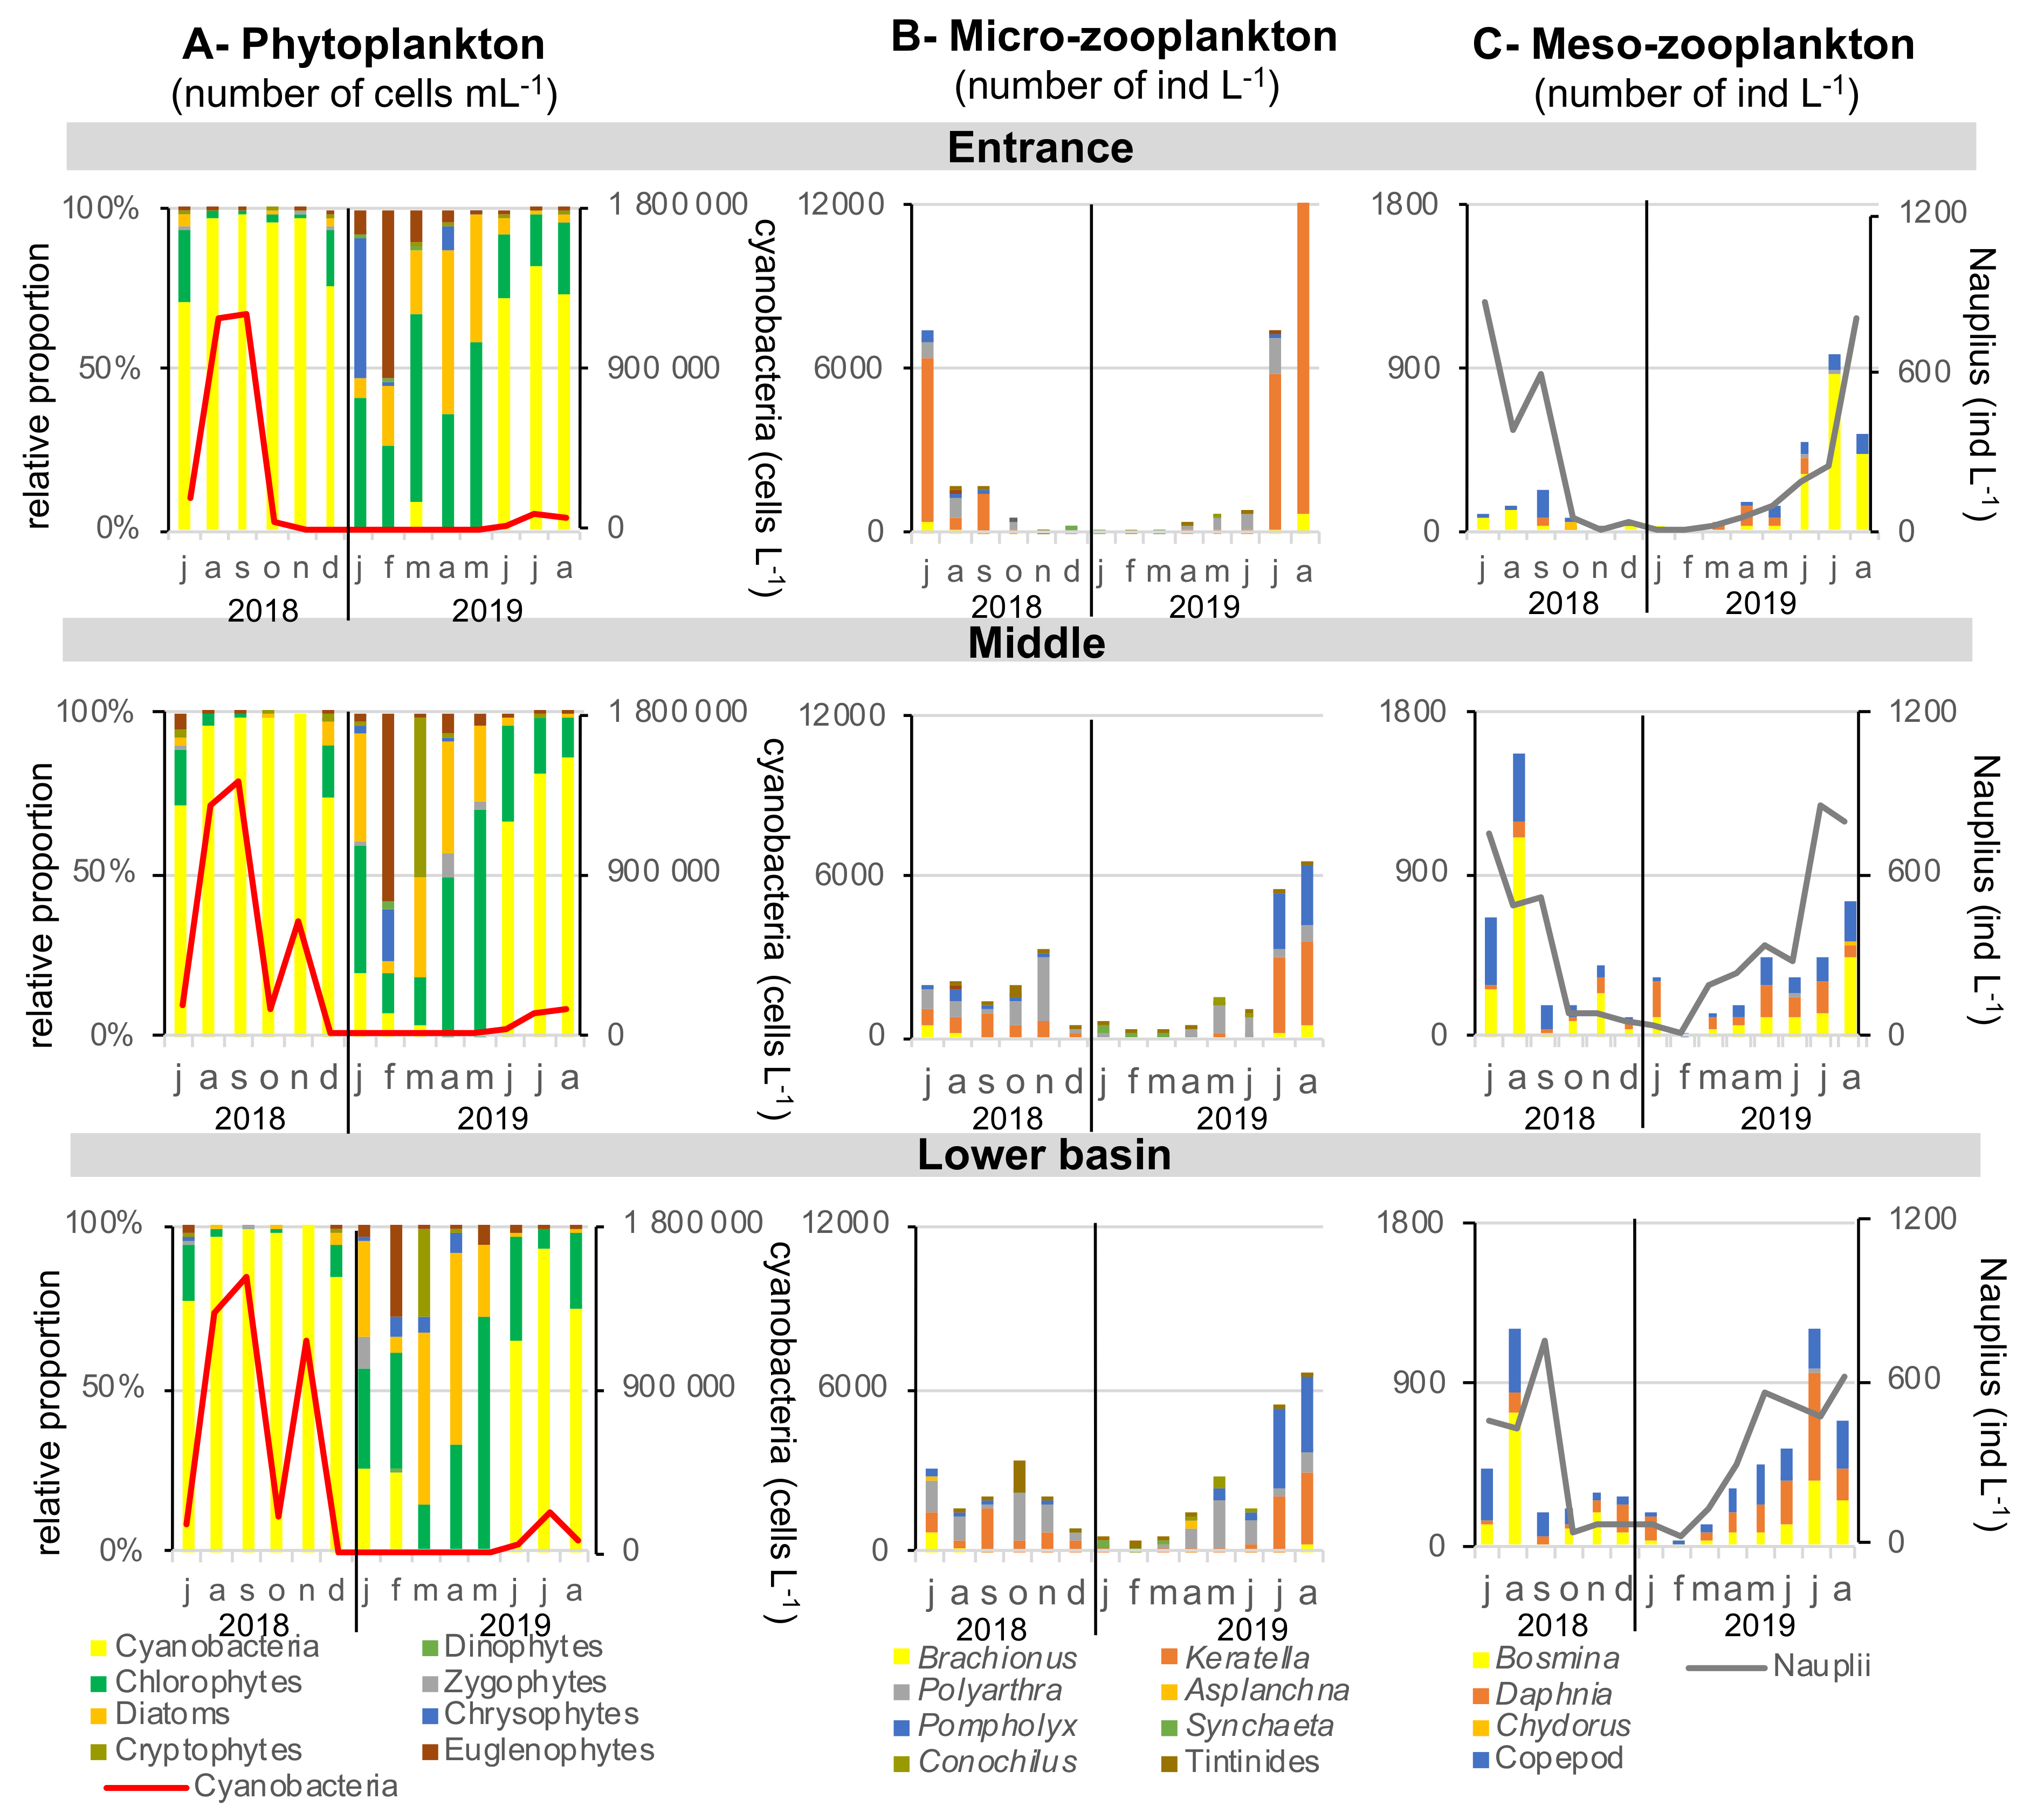
2.1.2. Phytoplankton

The relative proportions of the different groups of phytoplankton and the total abundance of cyanobacteria were very similar at the entrance, middle and in the lower basin, showing no significant difference (Figure 2A). The relative contribution of phytoplankton is calculated from cell number, biovolume being unfortunately unknown, as counting was performed at the genus level. Cyanobacteria dominated planktonic community from June to December 2018 and from June to at least August 2019. There were no cyanobacteria in winter and spring, and their concentrations reached 1,500,000 cells mL−1 in late summer (September 2018). A second bloom of cyanobacteria was observed during autumn 2018 in the middle and the lower basin, reaching 600,000 and 1,200,000 cells mL−1, respectively, in November. Cyanobacterial density was one order of magnitude lower during summer 2019. Phytoplankton eukaryotic community ranged from 200 cells mL−1 in winter to 72,000 cells mL−1 in early summer (July 2018). Chlorophytes were the most abundant in this community almost all yearlong, except in spring (March–April) during which diatoms or in february, where euglenophytes were dominating. In January, there was a co-domnance of chlorophytes with Chrysophytes at the entrance but with diatoms in the middle and lower basin.

2.1.3. Zooplankton

Zooplanktonic community abundance and composition was different between the entrance of the reservoir and middle–lower basin, apart from a common pattern of higher density during summers than winter (Figure 2B). Abundances of the rotifer Polyathra were significantly higher in the lower basin compared with the entrance (p < 0.05). The Cladocera Daphnia and copepods had also higher abundances in both the middle and lower basins compared with the entrance (p < 0.05). At the seasonal scale, the rotifer species Keratella strongly dominated the micro-zooplankton community during both summers at the entrance of the reservoir, reaching 6000 and 12,000 individuals L−1 in July 2018 and August 2019, respectively. In the middle and in the lower basin, Pompholyx and Polyarthra species accompanied Keratella, reaching a total maximum concentration of 3000 and 6000 individuals L−1 in July 2018 and August 2019, respectively. Concerning meso-zooplankton, the Cladoceran Bosmina genus dominated the community in the entire reservoir, together with copepods in a smaller proportion (Figure 2C). The total concentration of meso-zooplankton reached 1200 and 1500 individuals L−1 in the middle and the lower basin during summer 2018, while they were 4 to 5 times lower at the entrance of the reservoir (300 individuals L−1). During summer 2019, Daphnia developed in the middle and lower basin, dominating at 51% the community in July 2019 in the lower basin. Concentration of Nauplii was quite homogenous in the whole reservoir, ranging between few individuals in winter to 800 individuals L−1 in summer.

2.2. Inter-Annual Variability of Summer Periods

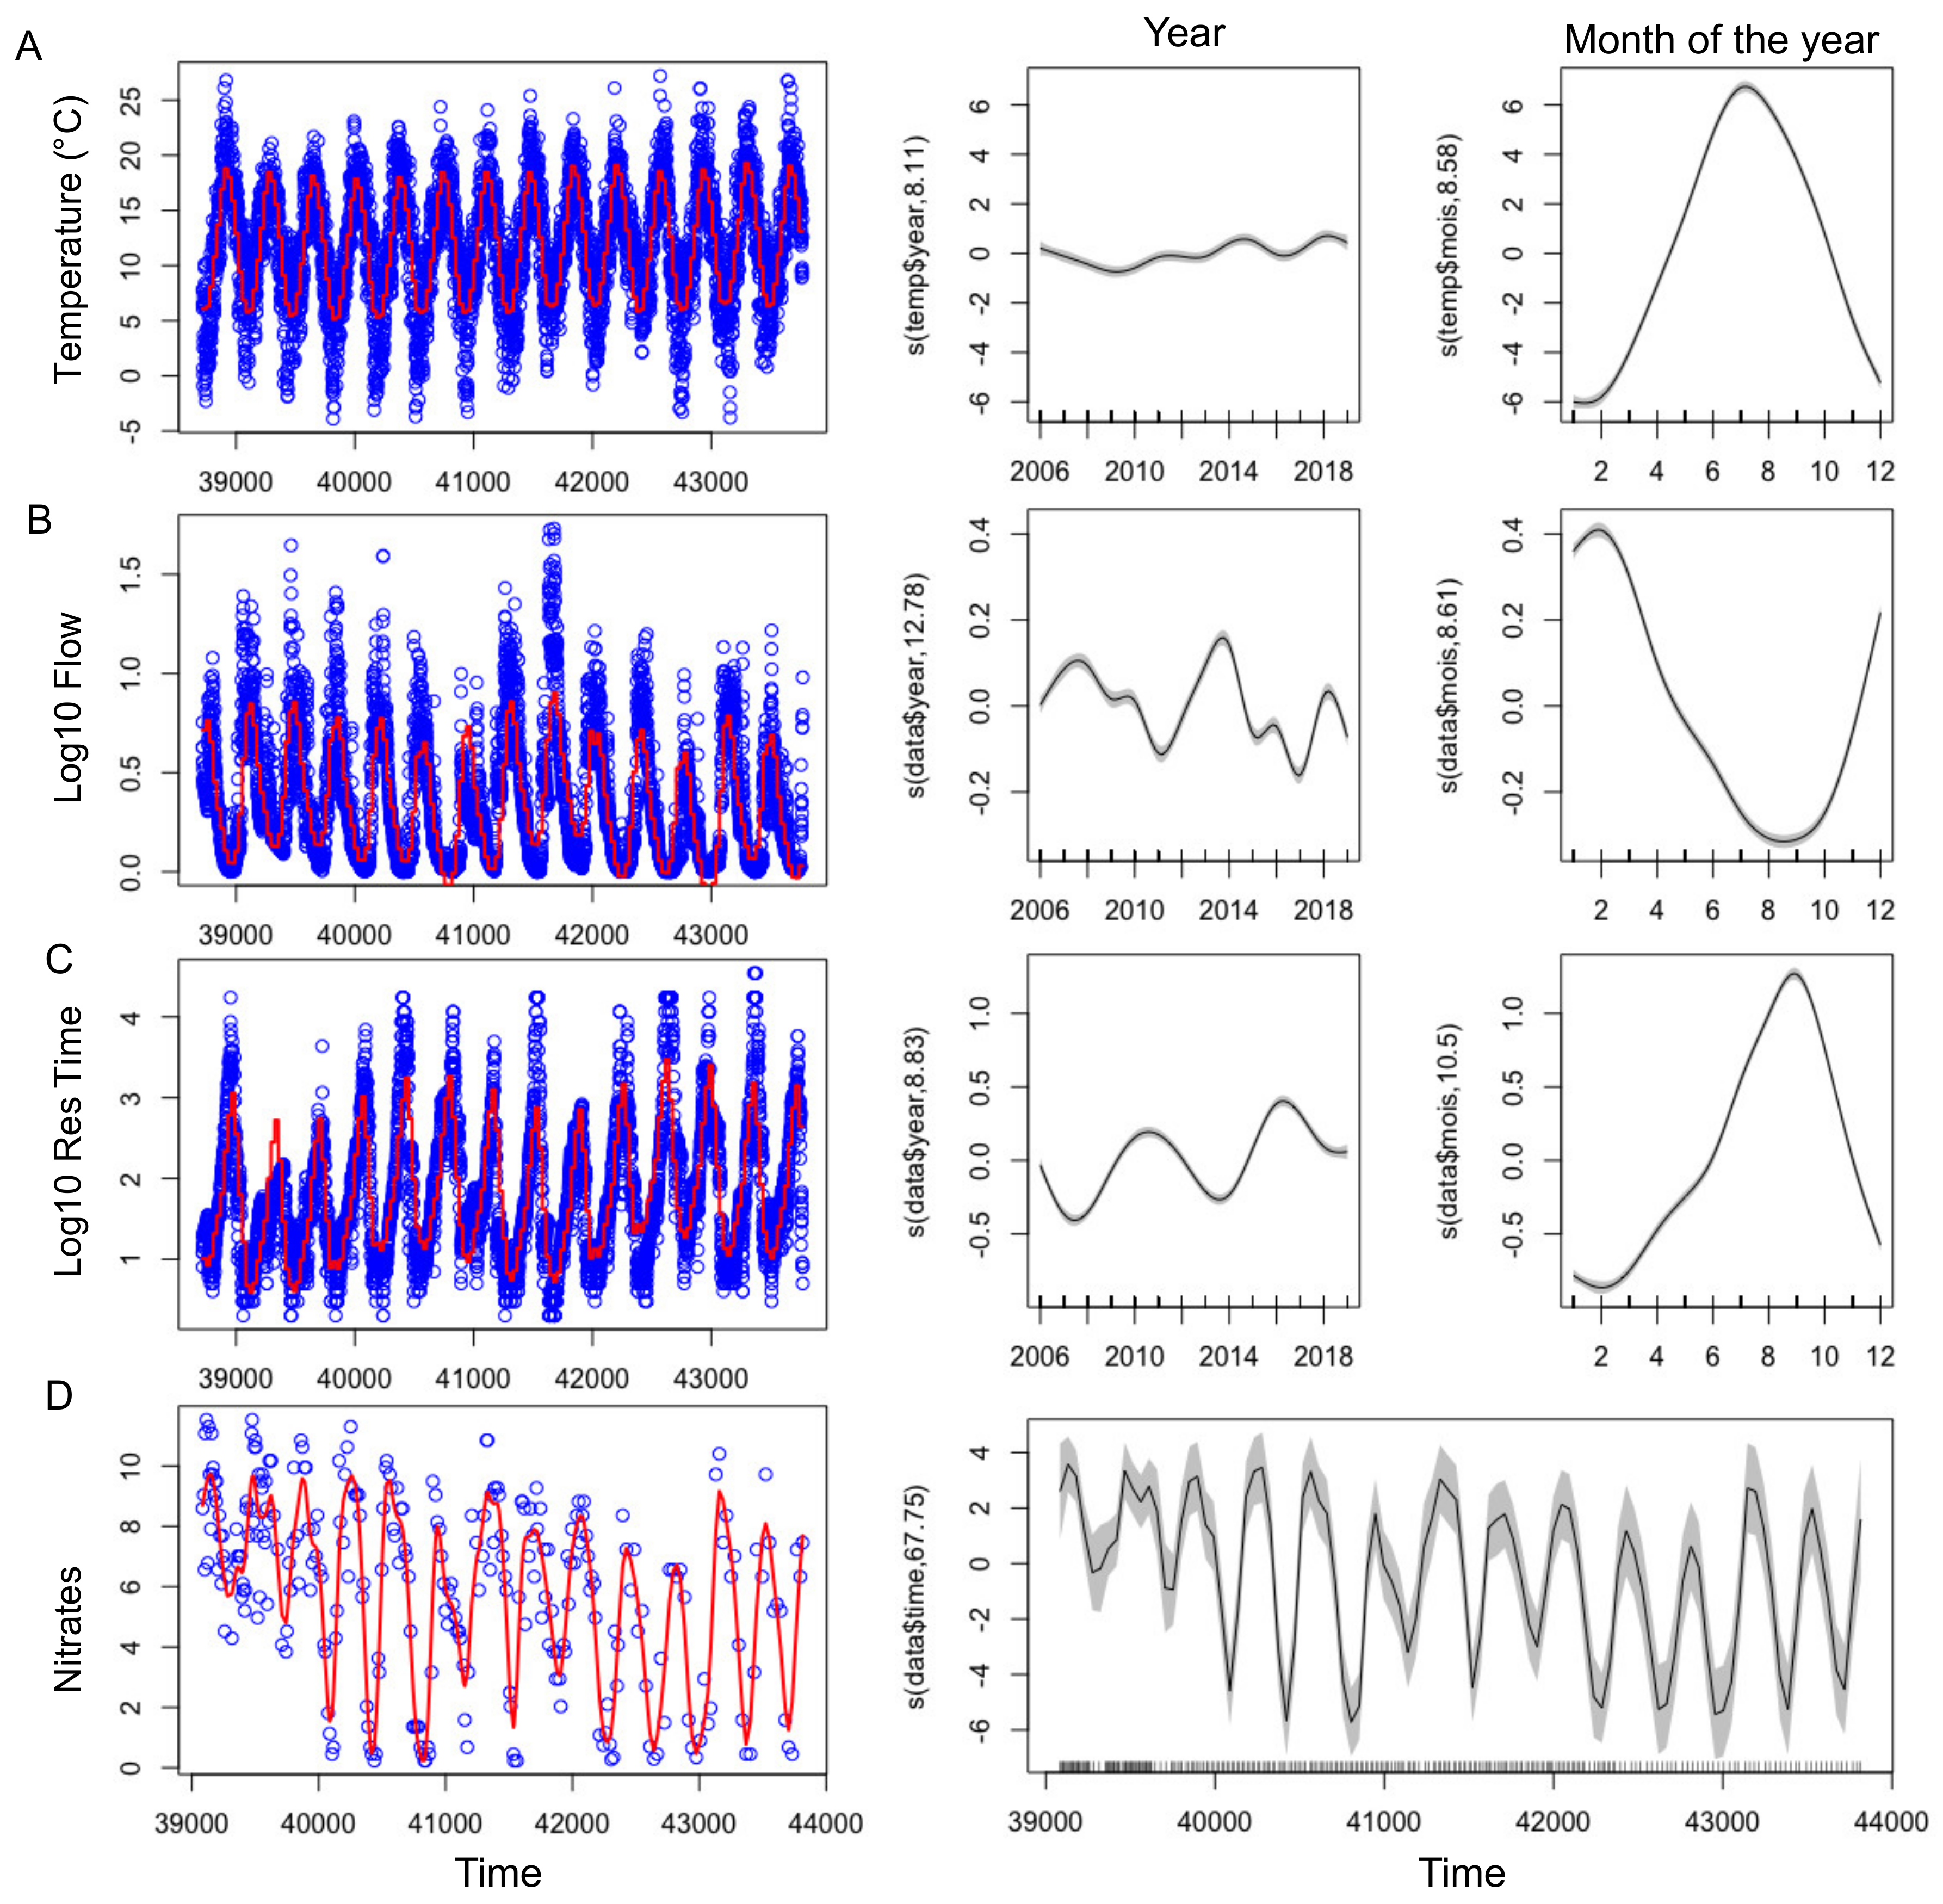
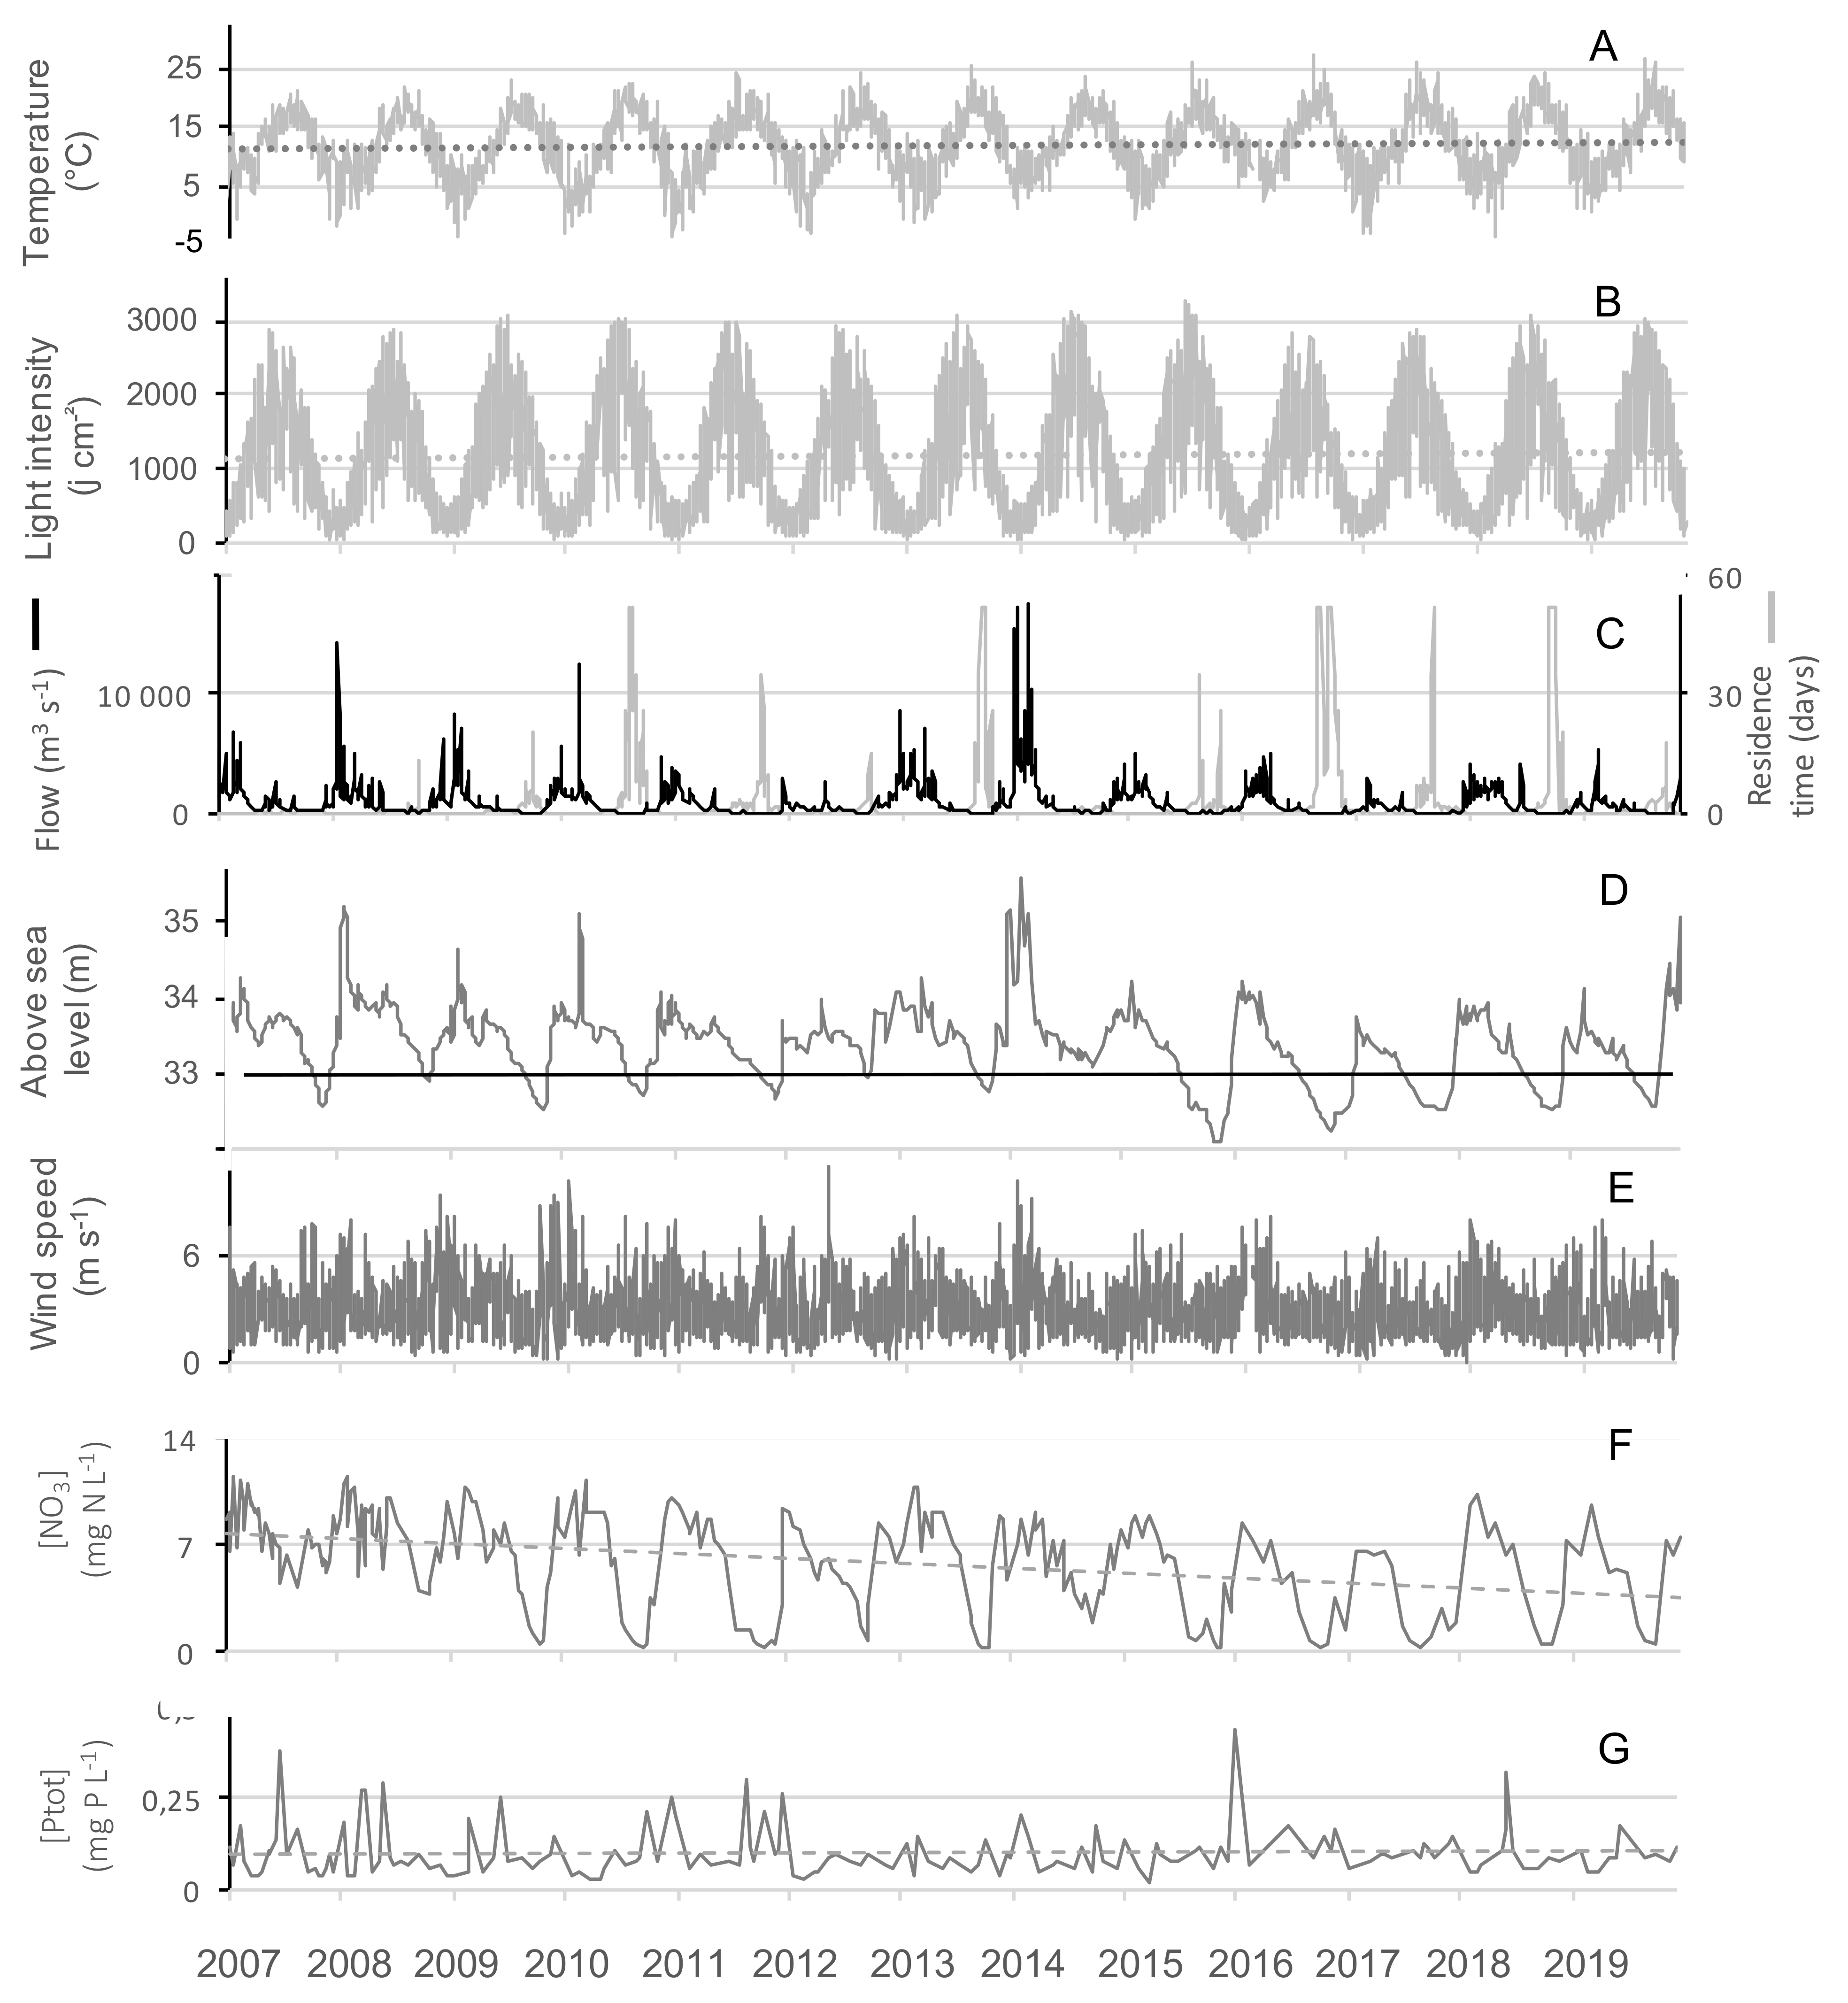
2.2.1. Abiotic Parameters

With the exception of 2010, summers from 2013-2019 were globally warmer, sunnier and dryer compared to 2007–2012 (Table 2). GAMs were applied successfully to temperature, nitrate concentrations, residence time and flow showing their significant changes over the tested time period (Figure 3, Figure S1 and Table 3). Even during this relatively short time period with respect to long term data, a slight increase of temperature was observed (Figure 3A, Figure 4A) During summers 2010 and 2013–2019, either warm temperature (≥20 days above 20 °C) or high light intensity (≥10 days above 2800 J m2) or dry months (less than 1.5 million m3 water entering into the reservoir) were recorded (Table 2). Before 2013 (except 2009), a strong and frequent wind was measured in the summers, with at least 19 days of wind with an average daily speed greater than 4 m s−1 (Figure 4E, Table 2). After 2013, only 2019 was classified as a windy summer. GAM could not be adjusted on wind due to the high daily variability and explained less than 4% of the deviance (not shown).
The biggest differences between the years of the study concerned the amount of water entering the reservoir during the hydrological year, ranging from 19 to 155 million m3 per year (Table 2). 2012, 2017 and 2019 were the driest hydrological years, having received less than 40 million m3. This increased the residence time and lowered the level, and water outflow stopped from July onwards (Figure 3B,C, Figure 4C,D). On the contrary, 2007, 2008 and 2014 presented high flow (Figure 3B) all year round (Table 2).

2.2.2. Nutrients

A strong seasonal pattern was observed for nitrates (Figure 3E and Figure 4F), with maximum concentrations in winter (11.5 mg N-NO3 L−1) and minimum ones in summer. Owing to the low data points (n = 283), GAM was not able to discouple the seasonal pattern from the interannual one, and we smooth only one independent variable, the time (Figure 3D). Nitrate concentrations slightly decreased over the studied period, and since 2009 concentrations were at the LOD at the end of summer periods, except in 2014 (Figure 3D and Figure 4F). Contrastingly, no seasonal pattern nor long-term tendency was observed for total phosphorus for the 2007–2019 period (Figure 4G). Total phosphorus concentration remained high with on average 100 ± 67 µg P-PO43 L−1 over the period studied.

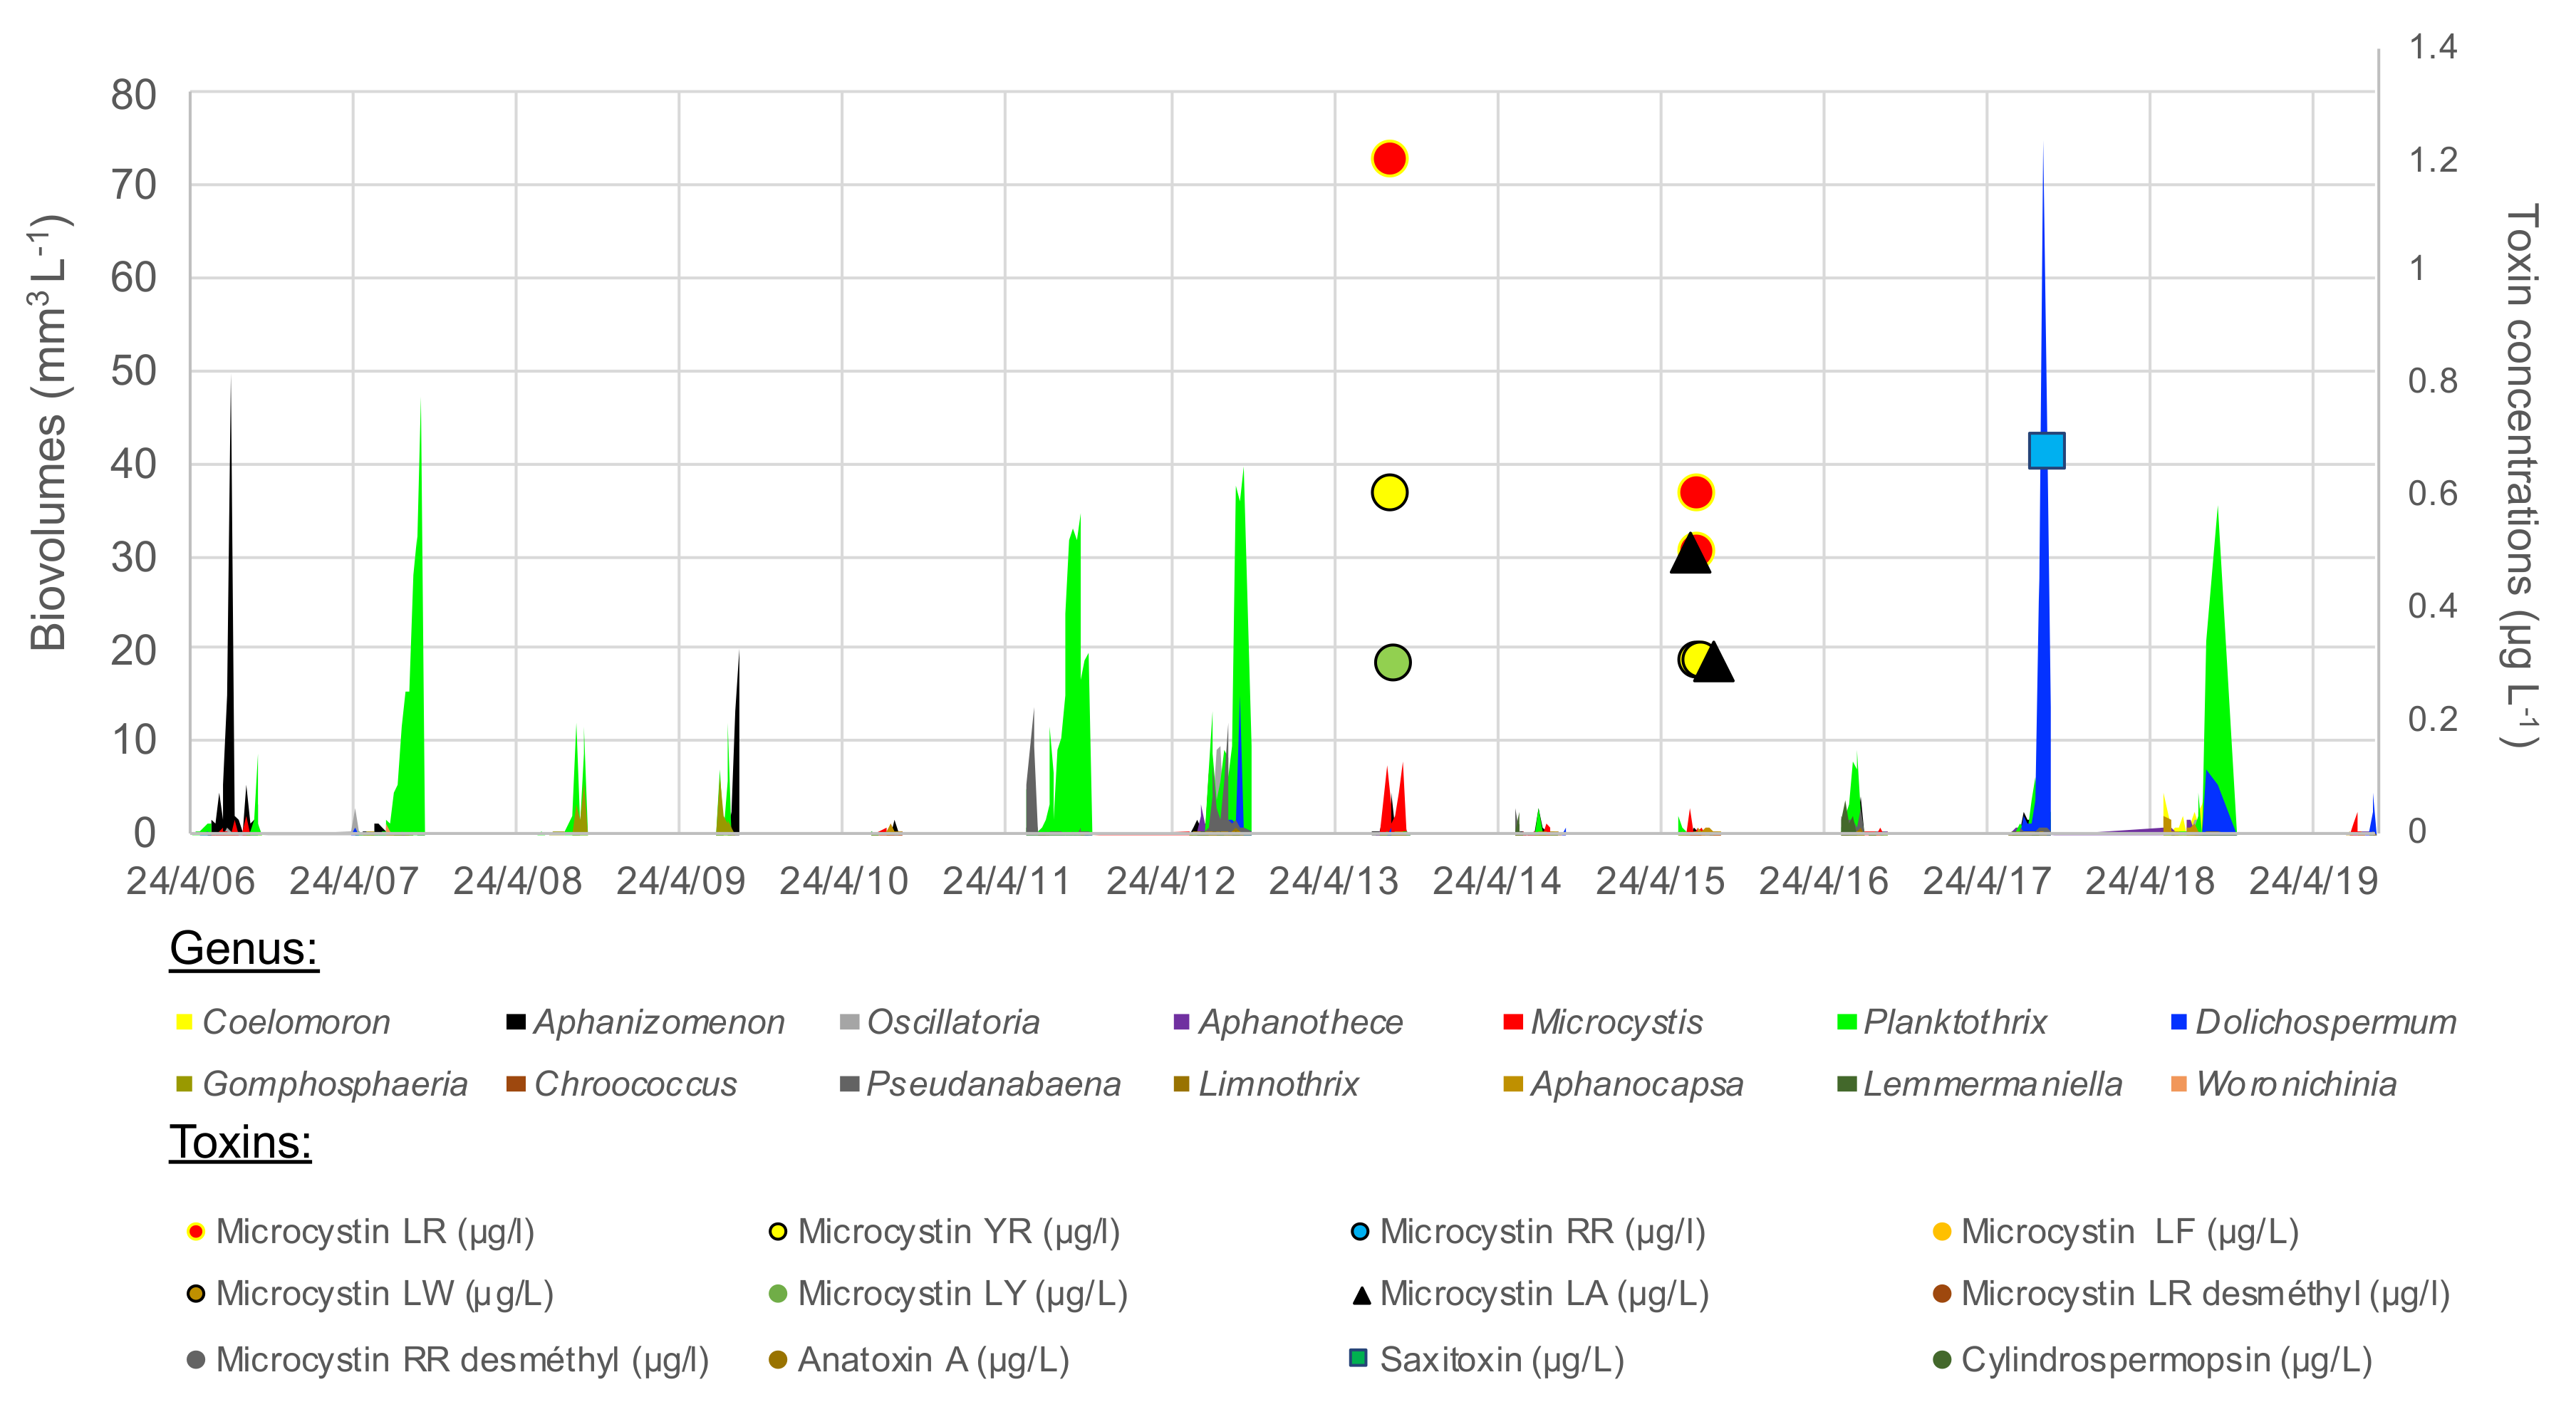
2.2.3. Cyanobacterial Blooms

The cyanobacterial community varied strongly interannually, even including years without blooms, 2010, 2014 and 2015 (Figure 5). Planktothrix agardhii was the most abundant species, dominating 6 of the 13 monitored years and reaching a biomass of at least 35–55 mm3 L−1 in 2007, 2011, 2012 and 2018. Microcystis (mainly M. aeruginosa) dominated in low densities in 2013, 2015 and early 2019, with associated detection of microcystin in low concentration in 2013 and 2015 (Figure 5, Table S1). Microcystis and microcystin (-LR, -RR, -YR, -LA, but not the demethylated congeners) were also detected in low density in 2018, a Planktothrix dominated year. Dolichospermum (mainly spiroides) dominated in huge densities in 2017 (75 mm3 L−1), and was present to a lesser extent in 2012, 2018 and 2019. Saxitoxin was detected in low concentration in 2017 and 2018. Anatoxin-a and cylindrospermopsin remained below LOD. Aphanizomenon dominated the cyanobacterial community in 2009. Aphanothece and Aphanocapsa (picocyanobacteria) dominated the cyanobacterial community in 2010 despite their very small biovolume per cell. All these species were present during summer 2014, but none dominated or bloomed.

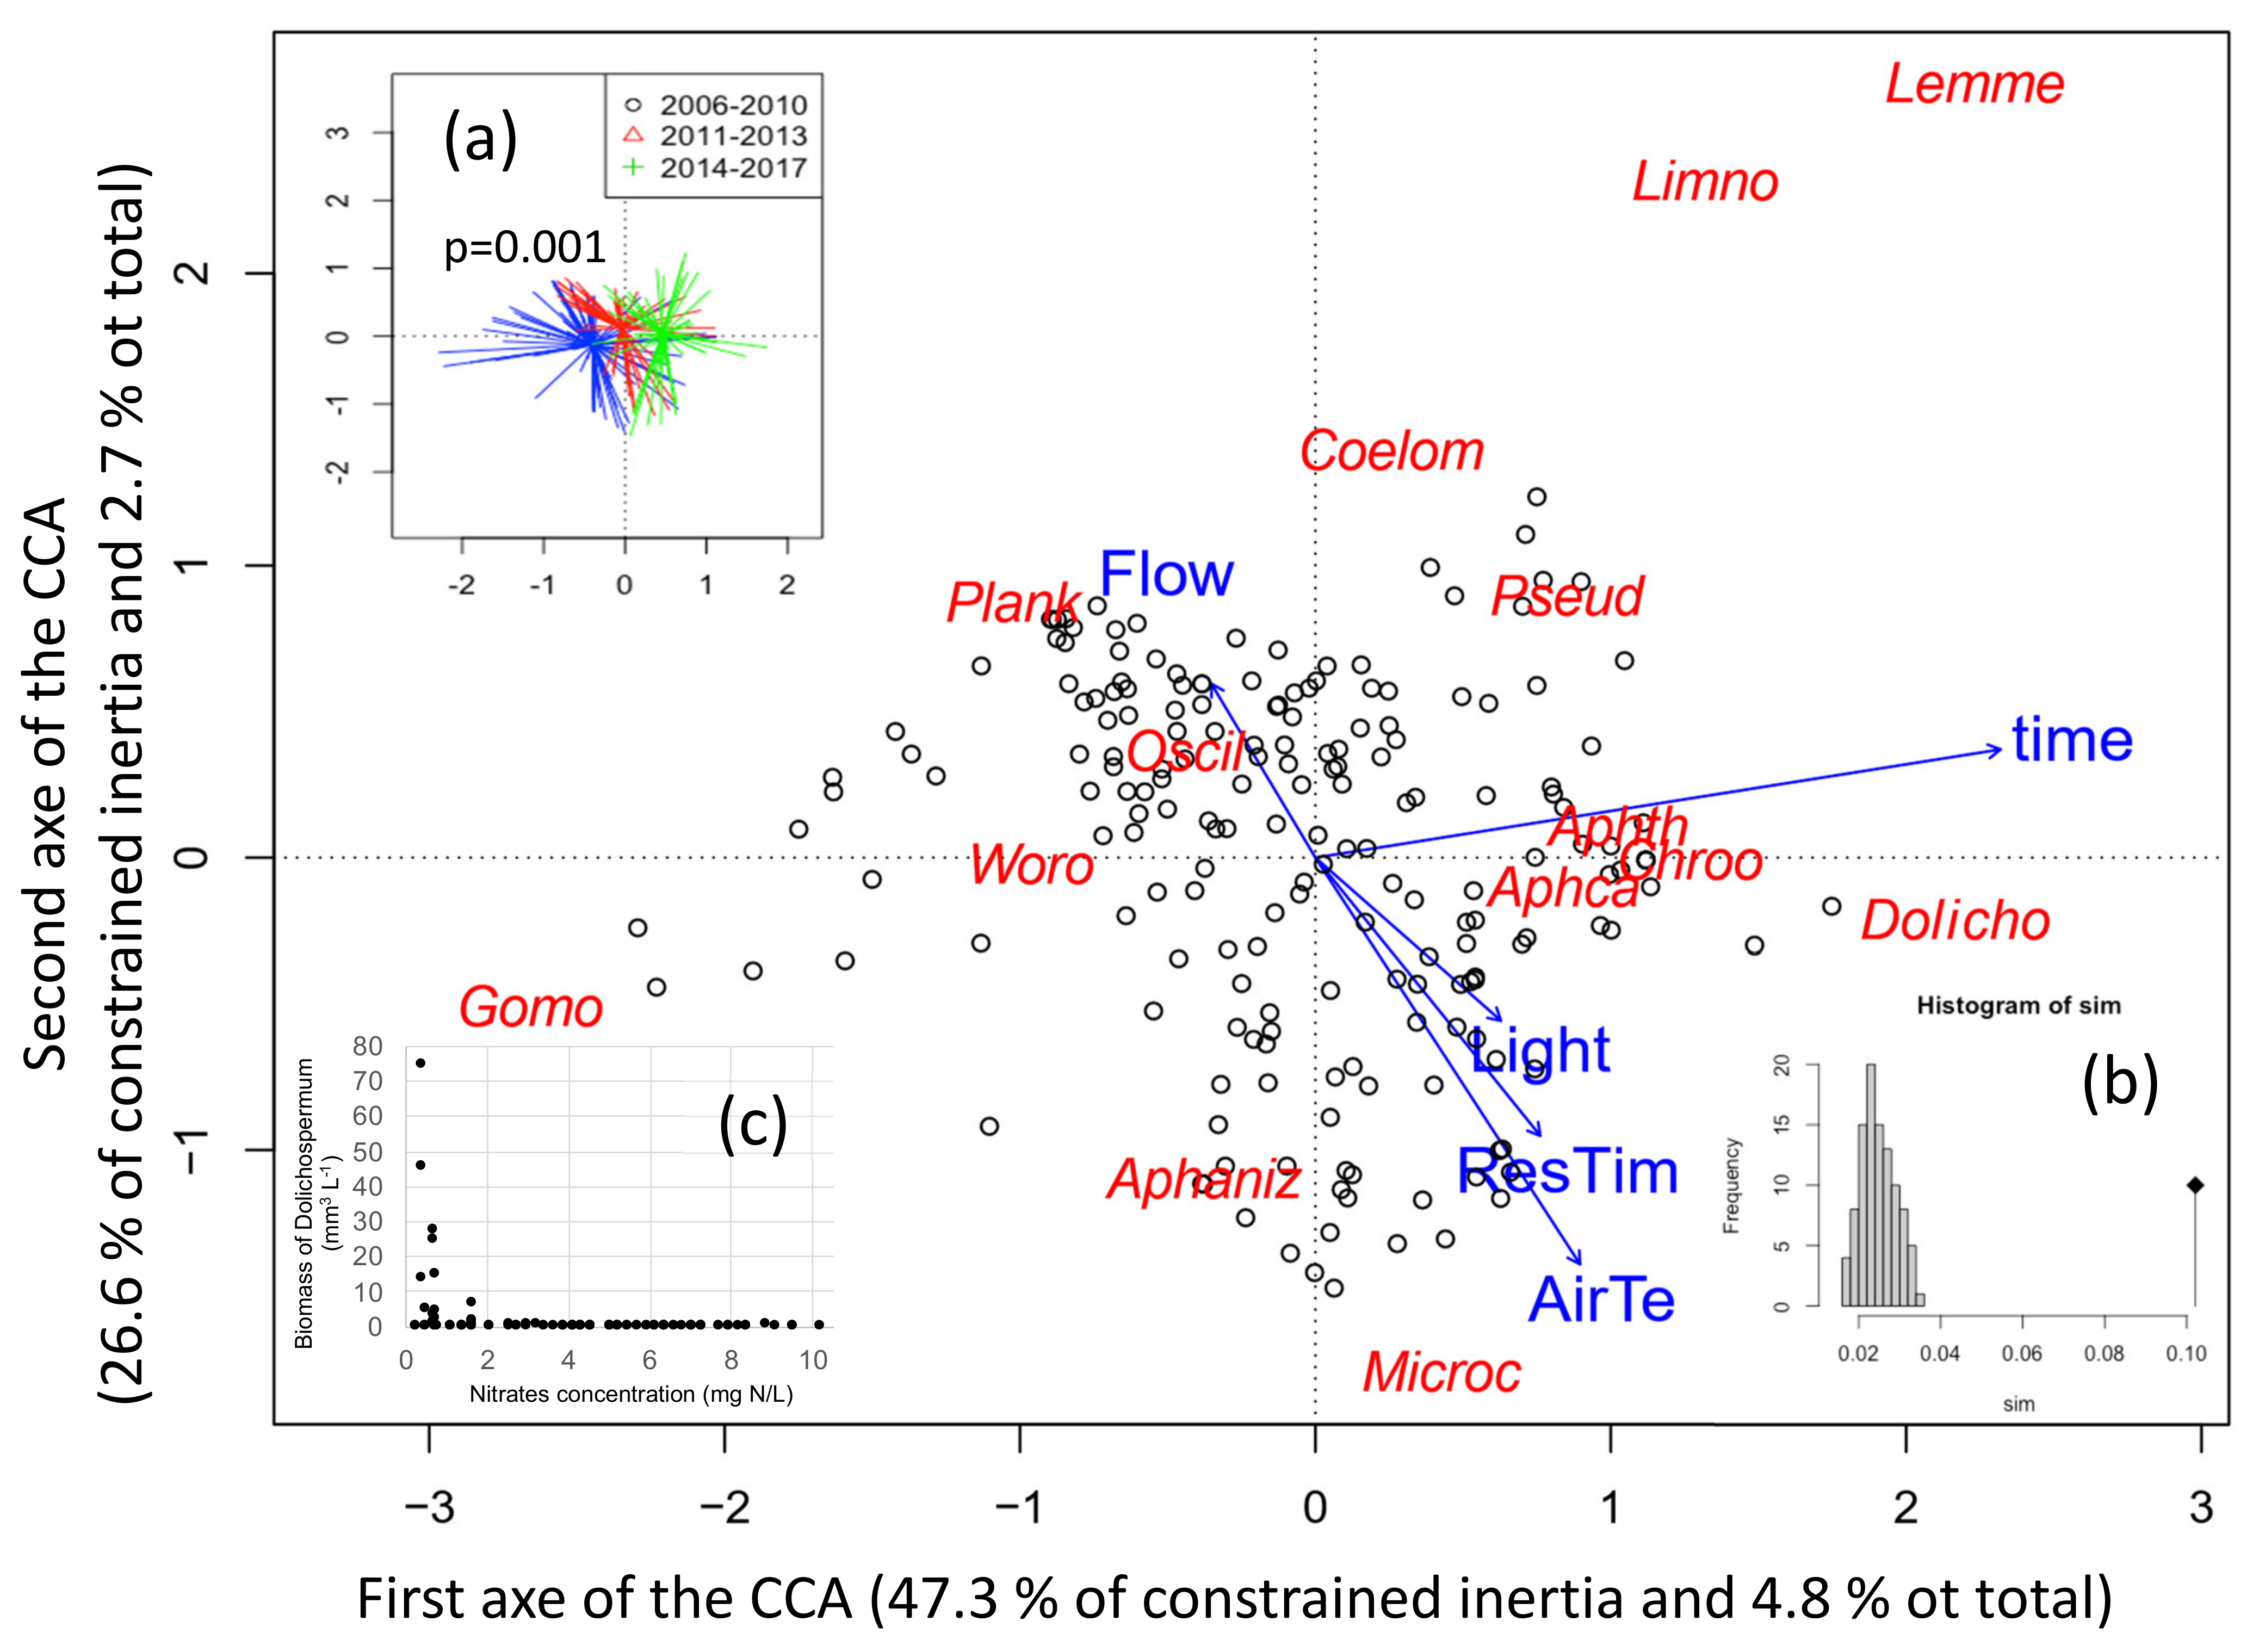
2.2.4. Coupling Blooming Species with Environmental Parameters

To link the cyanobacteria species composition depending on time and environmental parameters, a canonical correspondence analysis has been performed on 195 sampling dates performed during summer. The final CCA included four environmental variables and time, which explain 10.2% of the total variability in the species composition (Figure 6). The CCA discriminated the 12 cyanobacteria species of which 6 formed a bloom. The two first axes of the analysis presented here represent 7.5% of the total variability in species blooming (total inertia) and 73.9% of the constrained inertia. The first axis correlated with time (r = 0.92), hence when samples are grouped by sampling dates, old dates appear on the left while recent ones are on the right (Figure 6a). The first axis correlated moreover to air temperature (r = 0.35), residence time (r = 0.3) and light (r = 0.25) (all towards the positive side).
The first axis is also explained by Planktothrix (23.7%) and Gomphosphaeria (20.3%) on the negative side and Dolichospermum (14.2%), Aphanothece (13.9%), Lemmermaniella (8.3%) and Aphanocapsa (5.6%) on the positive side.
The second axis negatively correlates with air temperature (r=-0.73), residence time (r = −0.50) and light (r = −0.29), and positively with flow (r = 0.31) (Figure 6). Sampling dates with low flows thus coincide with high temperature, residence time and light. Air temperature and residence time thus contribute to both axes. The second axis is explained by Microcystis (28.2%) and Aphanizomenon (24.3%) on the negative side (bottom part – low flow), and by Planktothrix (18.2%), Lemmermaniella (11.7%), Coelomoron (7.0%) and Limnothrix (3.5%) on the positive side (upper part–high flow). All blooming species thus contributed at least to one of the two axes, while Planktothrix contributes negatively to both of them, in opposition with air temperature and residence time.
It should be noticed that nutrients were not included in the CCA analyses because they were measured less frequently and not necessarily at the same times than the phytoplankton community, moreover P concentrations did not change during the period of the data series. Dolichospermum sp. however seems to benefit below concentrations of 2 mg L−1 of nitrogen (Figure 6c): blooms of Dolichospermum were indeed only observed at very low nitrate concentrations.

3. Discussion

A low spatial variability but a high interannual variability in cyanobacteria biomass and composition have been revealed by this study. The seasonal cycle characterized this shallow reservoir as relatively homogeneous, with a similar evolution of nutrient concentrations and phytoplankton abundances, but different patterns for zooplankton along the increasing distance and depth from the entrance to the lower basin. These findings reject our first hypothesis assuming differeces concerning most parameters, but it could be accepted for the zooplankton dynamics after further investigations.
Maximum concentrations of phosphorus and nitrogen were both high, but with strong opposite seasonal patterns: the highest phosphorus concentrations occurred in summer when nitrogen was the lowest. Phosphorus concentrations of the lake were 3 times higher in the reservoir in summer 2018 compared to stations measured in headwaters of the incoming river Yvel [27]. As both nutrients usually enter during the wet winter months [28], their opposing seasonal pattern could indicate either enhanced uptake or denitrification for N, whereas the P concentrations exceeding those of the incoming water could have been released from the sediments during summer, as known from other lakes [20,29,30].
In summer, the Redfield N/P ratios in the total fraction were always below 20, confirming a deficiency of bioavailable N in the water column during this period [31]. This result is in line with an analyse of 369 German lakes concluding that N limitation seems to predominate during summer in shallow polymictic lakes [29].
Phytoplankton and zooplankton succession and densities were similar to many eutrophic water bodies. Total abundances of meso-zooplankton appeared high, but remained in agreement with other shallow eutrophic lakes [32,33,34]. Small zooplanktonic taxa seemed to dominate at the detriment of larger cladoceans, e.g., Daphnia sp., as known from eutrophic temperate lakes of both Europe [34] and the USA [35]. As sampling size was low in this study, more research focusing on zooplankton dynamics in that reservoir would be beneficial.
An interesting element in the seasonal cycle was the interannual variability between the two summers: while the bloom of cyanobacteria reached an exceptional high value of 1.5 million cells mL−1 in 2018, exceeding the limit allowing bathing by a factor of 15 in France and other countries [36], it was one order of magnitude inferior in 2019. At the same time, in the lower basin the zooplanktonic community switched from a dominance of Polyarthra and Bosmina during 2018 to a dominance of Keratella, Pompholyx and Daphnia in 2019, which could have been provoked by decreasing cyanobacteria in the phytoplankton community. Some zooplankton taxa such as the raptorial rotifer Polyarthra, or to a lesser extent the cladocerans Bosmina, are highly selective feeders avoiding cyanobacteria compared to filter feeders like Daphnia that thrive better in the absence of cyanobacteria [37,38,39,40]. A zooplankton community can also be top-down controlled by zooplanktivorous fish preferring large zooplankton such as Daphnia [41]. Despite the Lac-au-Duc reservoir being a frequented fishing site, the lack of published data on the fish compartment does not allow us to discuss their potential role in structuring the planktonic community.
The contrast of cyanobacteria abundance between the summer of 2018 and 2019 is in the range of the interannual variability of blooms’ intensity and species composition in the reservoir Lac-au-Duc observed during 13 years. Within the 2007–2019 period, densities of 40 to 80 mm3 L−1 were reached during five summers, while in the other eight summers it ranged at maximum from 1 to 20 mm3 L−1.
Towards the end of the time series (2018–2019), a dominance or co-dominance of Dolichospermum replaced the dominance of Planktothrix agardhii until 2013 together with a co-occurance of Microcystis (mainly aeruginosa) in low densities in 2013, 2015 and early 2019. This shift in 2013 of cyanobacterial dominance seems to correlate to dryer and warmer summers connected to an increase of water residence time, a slight decrease of wind and a decrease of N sources, which in total confirms our second hypothesis (climate forces as main drivers). Before 2013, with the exception of 2009, summers were indeed characterized by more windy days. Blooms of Planktothrix agardhii dominated during that first period, as this species tolerates low average insolation in turbid waters of polymictic lakes [26,41]. P. agardhii also grows best at temperatures between 10–20 °C [42], and may become disadvantaged by warmer temperatures. Additionally, at the regional scale in Brittany, P. agardhii was the dominant taxa of the freshwater cyanobacterial community between 2004 and 2011 [43].
Surprisingly, none of the measured microcystin congeners was detected during Planktothrix agardhii blooms despite Planktothrix sp. being able to form toxic blooms in temperate freshwater ecosystems [44,45]. Variation of toxin production can be explained by (i) presence/absence of mcy genes necessary for their synthesis and (ii) individual variation within mcy genotypes with inactivation or regulation at the level of genes expression [46,47]. Natural Planktothrix agardhii blooming populations can be composed of microcystin producing (mcy) and non-producing (non-mcy) genotypes, and their proportion can vary considerably [47,48,49]. Moreover, it was demonstrated on non-mcy strains of P. agardhii isolated from nine European freshwater bodies to have lost more than 90% of their mcy genes during evolutionary processes [50]. Based on the analyse of 138 Planktothrix strains from three continents, the variable spatial distribution of mcy and non-mcy genotypes was suggested to depend on ecophysiological adaptation [51]. In laboratory experiments, non-mcy strains of P. agardhii seem to have better fitness than mcy strains under non-limiting conditions [52]. Similar results were obtained for Microcystis: non-mcy strains dominated under optimal growth conditions [53]. The authors of these studies then hypothesized that when cyanobacteria grow under favourable environmental conditions, the cost of producing microcystins becomes too high compared to the advantages it can bring [52]. Based on these results, it is tempting to hypothesize that non-limiting growth conditions concerning P and N may have favoured the selection of non-mcy Planktothrix agardhii strains in the Lac-au-Duc reservoir. It would be interesting to verify the presence of mcy genes, especially since microcystin detections were demonstrated to negatively correlate to Planktothrix biovolume in several Brittany lakes [43], suggesting that non-mcy P. agardhii strains are prevalent at the regional scale. From the composition of the cyanobacterial bloom, also other toxins, such as anatoxin-a and cylindrospermopsin could have been expected [44,54], they were however never detected during the monitoring between 2007–2019.
Since summer 2013, Microcystis and Dolichospermum became dominant or codominant, related to generally calmer conditions. Both genera are known to benefit greatly from water column stability as they can regulate their buoyancy according to their requirements in the illuminated area of stable lakes [55,56,57]. Microcystis occurrence was moreover strongly related to light intensity and temperature, which enhances the stabilization of the water column and favoured the development and persistence of Microcystis blooms in other lakes as well [16,58]. Temperature also benefits directly cyanobacterial development through their growth rate [59], and has been the most important factor driving the development of Microcystis sp. as analysed in more than 1000 lakes [60]. At the regional scale, light intensity was identified as the main climatic driver for Microcystis sp. [43]. Despite dominant in 2013 and 2015, Microcystis abundances and associated toxin production remained low in Lac-au-Duc compared to other lakes (e.g., [16,24], suggesting that the favourable conditions for its development were not fully met. The optimal growth rate for Microcystis is well above 25 °C [59], a temperature rarely reached in Lac-au-Duc or in the surrounding region [43]. We can also hypothesize that Microcystis was limited by nitrogen in 2018 and 2019, when the species dominated in early summer but disappeared thereafter. Although Microcystis is able to use diverse forms of nitrogen, N availability appears to be an essential element controlling the development of this cyanobacteria and its toxin production [61,62].
This context of N limitation in Lac au Duc could also explain the emerging occurrence of the diazotrophic Dolichospermum in recent years, as underlined by the threshold above which its occurance decreases. Nitrate concentrations progressively declined during the last decade in the river entering the reservoir, as in other rivers at the regional scale [63]. Thus, N-fixation ability provides an ecological advantage for this cyanobacterium [41].
Indeed, the first occurrence of Dolichospermum in 2012 and its largest bloom in 2017 corresponded to the driest hydrological years of the time series, that is the years with the lowest nitrogen recharge. Drought also seems to have an impact on the hydrological functioning of the reservoir: from 2015 onwards, due to the succession of rather dry hydrological years, the water level remained low, when outflow stopped from beginning of July until autumn. Water movements were doubtless strongly reduced and this phenomenon was probably exacerbated during dry summers such as in 2017 and 2018, when the inflow of water ceased already in early summer. Air temperature, residence time and light contributed to both axis of the CCA, therefore jointly with time on the first axis, indicating that both parameters tend to increase over time. The occurrence of Dolichospermum was seems partly related to a long water residence time producing a favourable environment for these buoyant cyanobacteria. These results are in accordance with those of Hayes et al. (2015) who found evidence in 42 lakes from agricultural watersheds that droughts strongly influence the system towards N limitation and induce the development of diazotrophic cyanobacteria.
We hypothesize that the lake is in the progress to shift to a new equilibrium, dominated by N2 fixing cyanobacteria. This is potentially connected to toxin production, but evidence for a causal link between reduced N loading and diazotrophic cyanobacteria such as Dolichospermum abundance or biovolume is mixed [57]. In addition, evidence is increasing that N2 fixation cannot always compensate significantly for the N deficiency, underlying the need to continue reducing emission of both nitrogen and phosphorus in the catchment [20,64,65,66,67]. Thus, a further monitoring of the cyanobacterial community is recommended.
This study provides another proof for the necessity to apply a catchment wide approach to limit P and N entrance into lakes and reservoirs. While reducing N was successful, it remains difficult to reduce non-point source P, despite efforts undertaken by farmers in changing agricultural practices. Moreover, depending on the water-bodies’ bathymetry and the P stocked in the sediment, the time to reach and restore less eutrophe conditions needs to be taken into consideration. Many environmental parameters can be intercorrelated (nutrient availability, residence time, surface water temperature, stratification, etc.), making it impossible to separate the individual effect of these factors on a community. The complementary approach to such environmental surveys is to use very long term data, a multiple sites approach or mesocosms experiments. The intensity (frequency, stations and parameters) of long term sampling campaigns may present shortcomings, as in our case due to the restauration attempts with applications of CuSO4 amongst others, thus we were forced to eliminate several of the years, which may have weakened the data set.

4. Conclusions

To conclude, over only 13 years, two major shifts in the cyanobacterial community have been recorded: a first shift in 2013 from a mixing tolerant population of Planktothrix to a buoyant species, Microcystis, preferring more stable water conditions, influenced by generally calmer and warmer conditions. A second shift from 2017 onwards was driven simultaneously by droughts (representing the biggest change) and reduced N loadings favouring the diazothrophic Dolichospermum. Our study also points out that if P reduction is not successful, dominance of Microcystis sp. and Dolichospermum sp. potentially increase. It is tempting to predict that these buoyant cyanobacteria will replace the Planktothrix agardhii population permanently in the context of climate forcing favouring warmer and dryer conditions at the global scale if N and in particular P cannot be reduced below their requirements [45,68]. This could imply many changes in terms of potential toxin production and increased persistance of cyanobacterial populations from year to year with the growing stock of cells in sediment as both Microcystis and Dolichospermum have dormant cells, while Dolichospermum possesses in addition akinetes.
Changes can also concern curative actions as buoyant cyanobacteria are sensitive to artificial mixing for example, in contrast to Planktothrix [69]. Thus, it will be necessary to follow the evolution of future years to confirm or deny the persistent installation of Microcystis or Dolichospermum in relation to climatic variation.

5. Materials and Methods
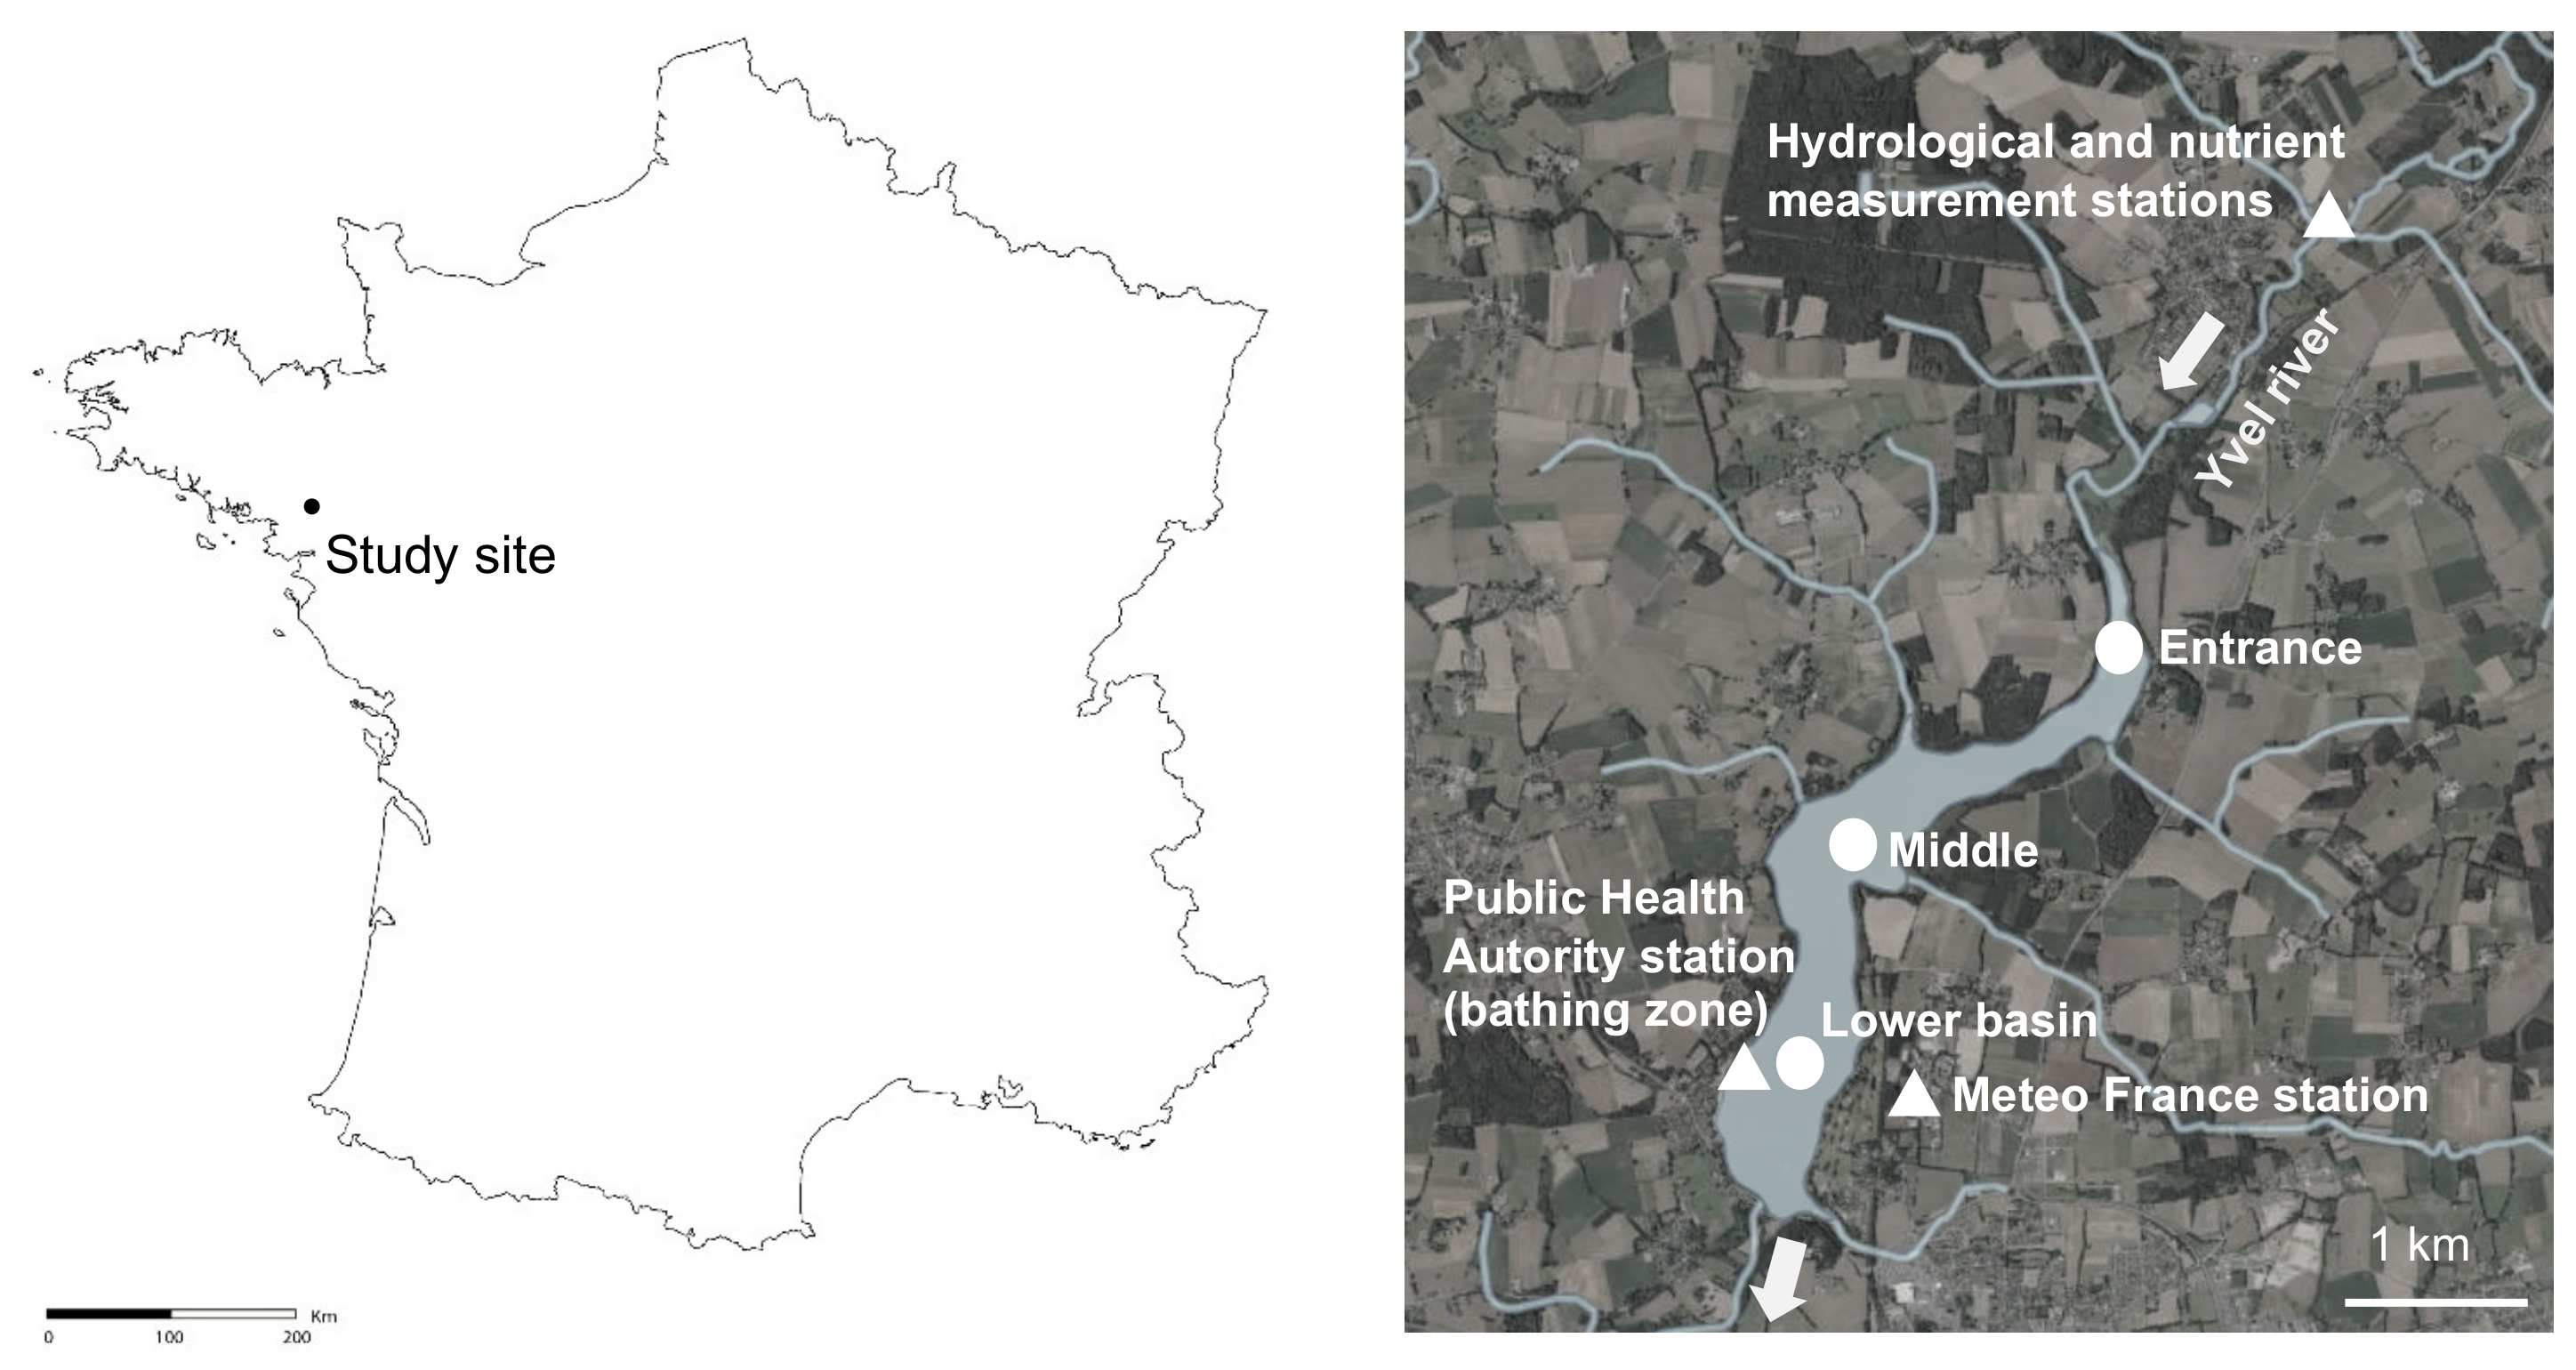
5.1. Study Site

The study site, called “Lac au Duc”, is one of the largest shallow water bodies (250 ha, 2.6-m depth in mean) in Brittany (western France, Figure 7). This 3-million m3 recreational and drinking water reservoir drains an agricultural catchment (37,000 ha) with the Yvel river as the main tributary. The lake is used for bathing, fishing and nautical activities.
Two types of monitoring data were used in this study: (i) data acquired monthly over a 2018–2019 seasonal cycle at three points in the lake and (ii) data acquired almost weekly over 13 summers, from 2007 to 2019 in a bathing zone. Additional environmental data were collected from governmental and meteorological data bases.

5.2. Seasonal Cycle 2018–2019

5.2.1. Sampling Sites and Sampling

To examine if nutrients, phyto- and zooplankton were evenly distributed in the reservoir we realized a seasonal cycle. Samples were collected from July 2018 to August 2019 at the entrance, in the middle and in the lower basin of the reservoir (Figure 7) from a boat. Duplicates of five liters of sub-surface water were collected with a 1 m vertical tube sampler at each point for nutrient, phytoplankton and zooplankton analyses. Duplicate samples for dissolved nutrient analyses were filtered on board on sterile Minisart CA 0.45 µm. Nutrient samples were kept at 4 °C until return to the lab, where they were stocked at −20 °C until analysis. Temperature and oxygen were measured along depth profiles with an Idronaut Ocean Seven 316 Plus CTD.

5.2.2. Nutrients

Particulate phosphorus, total dissolved phosphorus (TDP), particulate nitrogen and total dissolved nitrogen (TDN) were measured by colorimetry after digestion with persulfate according to [70], with a limit of detection of 6 µg P L−1 and 50 µg N L−1. Orthophosphate (PO43−) was analysed by the ammonium molybdate method [71] with a limit of detection of 3 µg P L−1. After nitrate (NO3) reduction into nitrite (NO2) with vanadium chloride, NO2 (originally present and reduced nitrates) was measured by colorimetry using sulphanilamide and N-1-naphthylethylenediamine dihydrochloride [72], with a limit of detection of 50 µg N L−1. Colorimetric measurements were realised using a Gallery Photometric Analyser Gallery Plus (Thermo Fisher, Saint Herblain, France).

5.2.3. Phytoplankton

For the seasonal cycle, microalgae and cyanobacteria composition was determined directly in the fresh sample when possible or were preserved in Lugols solution and stored at 4 °C. Identification were realized to the genus level according to Komárek. Phytoplankton cell counts were carried out with a Nageotte cell according to [73]. For large colonies, the number of cells was estimated using photos. Microscopic photos were used to assess the number of cells in colonies of picocyanobacterial, using Pegasus software. At least, 400 individuals were counted per sample. For both, a light microscope (Olympus BX 50, Rungis, France) was used. Prior to cell counts and identification, if necessary, microalgae and cyanobacteria were concentrated on a 1 μm Poretics polycarbonate membrane filter, thanks to a filtration pump but with low vacuum pressure. Transfer and resuspension of cells in 1 ml of water was done while the membrane was still wet. Intact colonial chlorophytes and cyanobacteria were checked on the microscope to ensure that damage due to the concentration of cells was low.

5.2.4. Zooplankton

Zooplankton was concentrated from two liters of water by filtering through a 50-µm net, then narcotized with soda water and preserved in 70% ethanol at 4 °C until counting. For counting, 1 mL of the concentrated sample was distributed on a Sedgewick-Rafter counting chamber. For each sample, a minimum of 400 rotifers were counted and identified at the genus or species level, according to USEPA protocol [74] with a Zeiss microscope, based on the identification manuals for rotifers [75] and cladocerans [76]. In low-abundance samples, the totality of the 1 ml was observed. In addition, crustaceans and cladocerans were counted.

5.3. Long Term Series 2007 to 2019

5.3.1. Phytoplankton and Toxins

Each summer since 2004 the regional public health authorities (French Agence Régionale de Santé, ARS) of Brittany monitor water from a bathing zone located in the lower basin of the reservoir (Figure 7). Depending on the bloom density, samples were collected weekly from June to September, except in 2009 (20/7 to 31/8) and 2010 (24/6 to 30/8). Monitoring stopped in mid-September in 2015–2019, while it continued until end of October in 2011 and 2012. Cyanobacteria abundance and species composition as well as toxin concentrations were analysed by local laboratories. Toxins were analysed with LC-MS/MS [77] after extraction with methanol. Microcystins analysed comprised the congeners microcystin—LR, YR, RR, LF, LW, LY, LA, desmethyl-LR and desmethyl RR with a limit of quantification (LOQ) of 0.3 μg L−1. MC-LR-eqivalents were calculated according to Wolf and Frank [78] and Fastner and Humpage [79] with MC-LR (1 per definition), MC-LA, MC-YR, MC-YM (1.0) and MC-RR (0.1). Saxitoxin was determined with an LOQ of 0.6 μg L−1, anatoxin LOQ < 0.3 μg L−1 and cylindrospermopsin LOQ < 0.6 μg L−1. All cyanobacterial cell densities data were converted to biovolume with the use of relevant geometric formulas and data literature [80,81], to account for differences in contribution from larger species and smaller species.

5.3.2. Abiotic Parameters

Daily meteorological data (air temperature, global radiation intensity and wind speed) were collected from Météo-France database from 2007 to 2019. Measurements were realised at the Météo-France station of Ploërmel, located 0.5 km from the reservoir (Figure 7). The light energy sensor broke in July 2017, from this date measurements from the Rennes-St-Jacques Météo-France station, located 60 km from the reservoir, were used. The number of days with an air temperature above 20 °C, or with solar radiations greater than 2800 J cm-2 were calculated. The water flow as well as nutrient concentrations were measured in the Yvel river, 3 km upstream the entrance of the reservoir (Figure 7). The water flow data were provided for the 2007–2019 period from the national database Hydro France [82] and corresponded to the daily mean values calculated from continuous stage records. From these data, we calculated the residence time of the water in the reservoir, knowing that its volume is approximately 3 million m3. To take into account the time needed between climate variation and phytoplankton response, hydrological and meteorological data were averaged over 6 days preceding the sampling date of cyanobacteria. Wind variation completed the average data. Windy summers were identified by the number of days of wind above a threshold of 4 m s−1 during a 24 h average following [82]. Monthly data for nitrate and total phosphorus concentrations were provided from the database of the Yvel-Yvet watershed manager (the Syndicat Mixte du Grand Bassin de l’Oust, SMGBO) from 2007 to 2019. By combining these nutrient data with flow data, we calculated the quantities of NO3 and Ptot entering the reservoir over the summer period or the complete hydrological year (November to November). The city of Ploërmel also provided reservoir water level data from the drinking water purification station.

5.3.3. Statistical Analyses

Despite being available, we discarded data from 2002 to 2005 as some copper sulphate treatments had been applied in the whole reservoir up to summer 2005. Treatments with calcium carbonate and hydrogen peroxide also took place, but locally in the bathing area, between 2013 and 2015 and in July 2018, respectively. During these years, except 2018, no significant difference was observed between the bathing area and the rest of the lake. We then chose to keep the data from the long-term monitoring bathing area for 2013–2015, while we used data from outside of the enclosed area only in 2018. Monitoring of nutrient concentrations started in 2007, thus data from 2006 were not used in analyses, leaving an extra year after the copper sulphate treatments.
All statistical analyses were performed in R Studio version 1.2.5019 [83]. In order to link cyanobacterial blooming genera with environmental parameters and characterize the sampling dates, a canonical correspondence analysis (CCA) was performed on Hellinger transformed genera biovolume (response matrix) and centred-reduced environmental parameters (explanatory variables). To reduce the number of explanatory variables, the ordistep function of the vegan package has been used to find the most parsimonious model based on Akaike Information Criterion (AIC). The less significant explanatory variables were eliminated from the CCA, in order to identify only the significant ones. The significance of the final CCA has been tested through a permutation test with the function envfit. A reference distribution under H0 from the data themselves is generated by permutations of rows and columns and by calculating the new percentage of constrained variance (sum of all canonical eigenvalues). The collinearity between explanatory parameters has also been checked.
We used generalized additive models (GAM) for time series of abiotic parameters, to analyze their temporal dynamics according to the season and the year. GAM takes into account the nonlinear response between the dependent variable (the abiotic parameter) and the explanatory variables (time, month of the year and year), using smooth functions called splines. Finally, the final shape of the relationship is determined by the data themselves. The independant variables in the initial model were the month of the year and the year, except for nitrates, for which it was only time (date) due to little data (Table 3). The best model was selected based on the gain in deviance explained (DE) relative to the initial model, while minimizing the Akaike’s information criterion (AIC). Models were adjusted using the R package ‘mgcv’ and the function gam() with the selection of the Restricted Maximum Likelihood (REML) method. The family was Gaussian and the link function was identity. A Log 10 transformation was done on the abiotic param when needed.

Supplementary Materials

The following are available online at https://0-www-mdpi-com.brum.beds.ac.uk/article/10.3390/toxins13050351/s1, Figure S1. Plots from the function gam.check () for each abiotic parameters: At the top left, the Q—Q plot compares the model residuals to a normal distribution., Table S1. Microcystin types meas-ured over the 2007–2019 summer periods.

Author Contributions

Conceptualization, M.L.M., A.P. and C.W.; methodology, M.L.M., A.P. and C.W.; formal analysis, M.L.M. and A.P.; investigation, M.L.M., M.C., L.B. and E.M.; resources, B.R.; data curation, A.P.; writing—original draft preparation, M.L.M.; writing—review and editing, A.P., C.W., L.B. and B.R.; visualization, M.L.M. and A.P.; supervision, C.W. and L.B.; project administration, C.W.; funding acquisition, C.W. All authors have read and agreed to the published version of the manuscript.

Funding

This research was funded by the Interreg CPES program 2017–2020 (https://www.cpes-interreg.eu; last accessed date 12 May 2021).

Institutional Review Board Statement

Not applicable.

Informed Consent Statement

Not applicable.

Data Availability Statement

Long term data series were obtained from the following sources: Cyanobacteria: ARS Bretagne, France; Temperature, radiation and wind speed: Meteo France, Ploermel, respectively, Rennes, St Jaques, nutrients: Syndicat Mixte du Grand Bassin de l’Oust, SMGBO, Bretagne, France.

Acknowledgments

We thank the French regional public health agency of Brittany for providing the data on cyanobacteria, and Meteo France and DREAL Bretagne-Hydro France for meteorological and hydrological data, respectively. We also thank the Syndicat Mixte du Grand Bassin de l’Oust for providing data on nutrients, as well as the city of Ploërmel for the data on the water level in the reservoir. The nautical base of Ploërmel is thanked for its help collecting samples. We thank also André-Jean Francez for his kind help in zooplankton identification, as well as Enora Briand for her useful comments on the discussion on microcystin production. Nutrient analysis were conducted at the Plateforme EcoChimie (EcoChim, UMS OSUR 3343).

Conflicts of Interest

The authors declare no conflict of interest. The funders had no role in the design of the study; in the collection, analyses, or interpretation of data; in the writing of the manuscript, or in the decision to publish the results.

References

  1. Smith, V.H.; Tilman, G.D.; Nekola, J.C. Eutrophication: Impacts of Excess Nutrient Inputs on Freshwater, Marine, and Terrestrial Ecosystems. Environ. Pollut. 1999, 100, 179–196. [Google Scholar] [CrossRef]
  2. Le Moal, M.; Gascuel-Odoux, C.; Menesguen, A.; Souchon, Y.; Etrillard, C.; Levain, A.; Moatar, F.; Pannard, A.; Souchu, P.; Lefebvre, A.; et al. Eutrophication: A New Wine in an Old Bottle? Sci. Total Environ. 2019, 651, 1–11. [Google Scholar] [CrossRef] [Green Version]
  3. O’Neil, J.M.; Davis, T.W.; Burford, M.A.; Gobler, C.J. The Rise of Harmful Cyanobacteria Blooms: The Potential Roles of Eutrophication and Climate Change. Harmful Algae 2012, 14, 313–334. [Google Scholar] [CrossRef]
  4. Paerl, H.W.; Otten, T.G. Blooms Bite the Hand That Feeds Them. Science 2013, 342, 433–434. [Google Scholar] [CrossRef]
  5. Ger, K.A.; Hansson, L.A.; Lurling, M. Understanding Cyanobacteria-Zooplankton Interactions in a More Eutrophic World. Freshw. Biol. 2014, 59, 1783–1798. [Google Scholar] [CrossRef] [Green Version]
  6. Huisman, J.; Codd, G.A.; Paerl, H.W.; Ibelings, B.W.; Verspagen, J.M.H.; Visser, P.M. Cyanobacterial Blooms. Nat. Rev. Microbiol. 2018, 16, 471–483. [Google Scholar] [CrossRef] [PubMed]
  7. Bockwoldt, K.A.; Nodine, E.R.; Mihuc, T.B.; Shambaugh, A.D.; Stockwell, J.D. Reduced Phytoplankton and Zooplankton Diversity Associated with Increased Cyanobacteria in Lake Champlain, USA. J. Contemp. Water Res. Educ. 2017, 160, 100–118. [Google Scholar] [CrossRef] [Green Version]
  8. Nurnberg, G.K.; LaZerte, B.D. More than 20 Years of Estimated Internal Phosphorus Loading in Polymictic, Eutrophic Lake Winnipeg, Manitoba. J. Great Lakes Res. 2016, 42, 18–27. [Google Scholar] [CrossRef]
  9. Carmichael, W.W. The Cyanotoxins. Adv. Bot. Res. 1997, 211–256. [Google Scholar] [CrossRef]
  10. Wiegand, C.; Pflugmacher, S. Ecotoxicological Effects of Selected Cyanobacterial Secondary Metabolites a Short Review. Toxicol. Appl. Pharmacol. 2005, 203, 201–218. [Google Scholar] [CrossRef]
  11. Metcalf, J.S.; Codd, G.A. Cyanotoxins. In Ecology of Cyanobacteria II; Springer: Berlin/Heidelberg, Germany, 2012; pp. 651–675. [Google Scholar]
  12. World Health Organization Guidelines for Drinking Water Quality, Addendum to Volume 2: Health Criteria and Other Supporting Information; WHO Publications: Geneva, Switzerland, 1998.
  13. Ibelings, B.W.; Backer, L.C.; Kardinaal, W.E.A.; Chorus, I. Current Approaches to Cyanotoxin Risk Assessment and Risk Management around the Globe. Harmful Algae 2014, 40, 63–74. [Google Scholar] [CrossRef] [Green Version]
  14. Dokulil, M.T.; Teubner, K. Cyanobacterial Dominance in Lakes. Hydrobiologia 2000, 438, 1–12. [Google Scholar] [CrossRef]
  15. Taranu, Z.E.; Gregory-Eaves, I.; Leavitt, P.R.; Bunting, L.; Buchaca, T.; Catalan, J.; Domaizon, I.; Guilizzoni, P.; Lami, A.; McGowan, S.; et al. Acceleration of Cyanobacterial Dominance in North Temperate-Subarctic Lakes during the Anthropocene. Ecol. Lett. 2015, 18, 375–384. [Google Scholar] [CrossRef]
  16. Jöhnk, K.D.; Huisman, J.; Sharples, J.; Sommeijer, B.; Visser, P.M.; Stroom, J.M. Summer Heatwaves Promote Blooms of Harmful Cyanobacteria: Heatwaves Promote Harmful Cyanobacteria. Glob. Chang. Biol. 2008, 14, 495–512. [Google Scholar] [CrossRef] [Green Version]
  17. Kosten, S.; Huszar, V.L.M.; Becares, E.; Costa, L.S.; van Donk, E.; Hansson, L.A.; Jeppesenk, E.; Kruk, C.; Lacerot, G.; Mazzeo, N.; et al. Warmer Climates Boost Cyanobacterial Dominance in Shallow Lakes. Glob. Chang. Biol. 2012, 18, 118–126. [Google Scholar] [CrossRef]
  18. Fastner, J.; Abella, S.; Litt, A.; Morabito, G.; Vörös, L.; Pálffy, K.; Straile, D.; Kümmerlin, R.; Matthews, D.; Phillips, M.G.; et al. Combating Cyanobacterial Proliferation by Avoiding or Treating Inflows with High P Load—Experiences from Eight Case Studies. Aquat. Ecol. 2016, 50, 367–383. [Google Scholar] [CrossRef] [Green Version]
  19. Jeppesen, E.; Sondergaard, M.; Jensen, J.P.; Havens, K.E.; Anneville, O.; Carvalho, L.; Coveney, M.F.; Deneke, R.; Dokulil, M.T.; Foy, B.; et al. Lake Responses to Reduced Nutrient Loading—An Analysis of Contemporary Long-Term Data from 35 Case Studies. Freshw. Biol. 2005, 50, 1747–1771. [Google Scholar] [CrossRef]
  20. Shatwell, T.; Köhler, J. Decreased Nitrogen Loading Controls Summer Cyanobacterial Blooms without Promoting Nitrogen-fixing Taxa: Long-term Response of a Shallow Lake. Limnol. Oceanogr. 2019, 64, S166–S178. [Google Scholar] [CrossRef] [Green Version]
  21. Schindler, D.W.; Hecky, R.E.; Findlay, D.; Stainton, M.; Parker, B.; Paterson, M.; Beaty, K.; Lyng, M.; Kasian, S. Eutrophication of Lakes Cannot Be Controlled by Reducing Nitrogen Input: Results of a 37-Year Whole-Ecosystem Experiment. Proc. Natl. Acad. Sci. 2008, 105, 11254–11258. [Google Scholar] [CrossRef] [Green Version]
  22. Liu, X.; Lu, X.H.; Chen, Y.W. The Effects of Temperature and Nutrient Ratios on Microcystis Blooms in Lake Taihu, China: An 11-Year Investigation. Harmful Algae 2011, 10, 337–343. [Google Scholar] [CrossRef]
  23. Deng, J.; Salmaso, N.; Jeppesen, E.; Qin, B.; Zhang, Y. The Relative Importance of Weather and Nutrients Determining Phytoplankton Assemblages Differs between Seasons in Large Lake Taihu, China. Aquat. Sci. 2019, 81, 48. [Google Scholar] [CrossRef]
  24. Vasconcelos, V.; Morais, J.; Vale, M. Microcystins and Cyanobacteria Trends in a 14 Year Monitoring of a Temperate Eutrophic Reservoir (Aguieira, Portugal). J. Environ. Monit. 2011, 13, 668–672. [Google Scholar] [CrossRef] [PubMed]
  25. Rücker, J.; Wiedner, C.; Zippel, P. Factors controlling the dominance of Planktothrix agardhii and Limnothrix redekei in eutrophic shallow lakes. In Shallow Lakes’ 95; Springer: Dordrecht, The Netherlands, 1997; pp. 107–115. [Google Scholar]
  26. Kurmayer, R.; Deng, L.; Entfellner, E. Role of Toxic and Bioactive Secondary Metabolites in Colonization and Bloom Formation by Filamentous Cyanobacteria Planktothrix. Harmful Algae 2016, 54, 69–86. [Google Scholar] [CrossRef] [PubMed] [Green Version]
  27. Casquin, A.; Gu, S.; Dupas, R.; Petitjean, P.; Gruau, G.; Durand, P. River Network Alteration of C-N-P Dynamics in a Mesoscale Agricultural Catchment. Sci. Total Environ. 2020, 749. [Google Scholar] [CrossRef]
  28. Sondergaard, M.; Jensen, J.P.; Jeppesen, E. Seasonal Response of Nutrients to Reduced Phosphorus Loading in 12 Danish Lakes. Freshw. Biol. 2005, 50, 1605–1615. [Google Scholar] [CrossRef]
  29. Dolman, A.M.; Mischke, U.; Wiedner, C. Lake-Type-Specific Seasonal Patterns of Nutrient Limitation in German Lakes, with Target Nitrogen and Phosphorus Concentrations for Good Ecological Status. Freshw. Biol. 2016, 61, 444–456. [Google Scholar] [CrossRef]
  30. Sondergaard, M.; Jensen, J.P.; Jeppesen, E.; Møller, P.H. Seasonal Dynamics in the Concentrations and Retention of Phosphorus in Shallow Danish Lakes after Reduced Loading. Aquat. Ecosyst. Health Manag. 2002, 5, 19–29. [Google Scholar] [CrossRef]
  31. Guildford, S.J.; Hecky, R.E. Total Nitrogen, Total Phosphorus, and Nutrient Limitation in Lakes and Oceans: Is There a Common Relationship? Limnol. Oceanogr. 2000, 45, 1213–1223. [Google Scholar] [CrossRef] [Green Version]
  32. Abrantes, N.; Antunes, S.; Pereira, M.; Gonçalves, F. Seasonal Succession of Cladocerans and Phytoplankton and Their Interactions in a Shallow Eutrophic Lake (Lake Vela, Portugal). Acta Oecologica 2006, 29, 54–64. [Google Scholar] [CrossRef]
  33. Cazzanelli, M.; Warming, T.P.; Christoffersen, K.S. Emergent and Floating-Leaved Macrophytes as Refuge for Zooplankton in a Eutrophic Temperate Lake without Submerged Vegetation. Hydrobiologia 2008, 605, 113–122. [Google Scholar] [CrossRef]
  34. Zingel, P.; Haberman, J. A comparison of zooplankton densities and biomass in Lakes Peipsi and Võrtsjärv (Estonia): Rotifers and crustaceans versus ciliates. In European Large Lakes Ecosystem Changes and Their Ecological and Socioeconomic Impacts; Springer: Dordrecht, The Netherlands, 2007; pp. 153–159. [Google Scholar]
  35. Moody, E.K.; Wilkinson, G.M. Functional Shifts in Lake Zooplankton Communities with Hypereutrophication. Freshw. Biol. 2019, 64, 608–616. [Google Scholar] [CrossRef]
  36. Chorus, I.; Bartram, J. Toxic Cyanobacteria in Water: A Guide to Their Public Health Consequences, Monitoring and Management; CRC Press: Boca Raton, FL, USA, 1999; ISBN 1-4822-9506-7. [Google Scholar]
  37. Barnett, A.J.; Finlay, K.; Beisner, B.E. Functional Diversity of Crustacean Zooplankton Communities: Towards a Trait-Based Classification. Freshw. Biol. 2007, 52, 796–813. [Google Scholar] [CrossRef]
  38. Obertegger, U.; Flaim, G. Community Assembly of Rotifers Based on Morphological Traits. Hydrobiologia 2015, 753, 31–45. [Google Scholar] [CrossRef]
  39. Burian, A.; Kainz, M.J.; Schagerl, M.; Yasindi, A. Species-Specific Separation of Lake Plankton Reveals Divergent Food Assimilation Patterns in Rotifers. Freshw. Biol. 2014, 59, 1257–1265. [Google Scholar] [CrossRef] [Green Version]
  40. Jeppesen, E.; Jensen, J.P.; Sondergaard, M.; Lauridsen, T.; Landkildehus, F. Trophic Structure, Species Richness and Biodiversity in Danish Lakes: Changes along a Phosphorus Gradient. Freshw. Biol. 2000, 45, 201–218. [Google Scholar] [CrossRef]
  41. Reynolds, C.S. The Ecology of Phytoplankton; Cambridge University Press: Cambridge, UK, 2006; ISBN 1-139-45489-7. [Google Scholar]
  42. Suda, S. Taxonomic Revision of Water-Bloom-Forming Species of Oscillatorioid Cyanobacteria. Int. J. Syst. Evol. Microbiol. 2002, 52, 1577–1595. [Google Scholar] [CrossRef]
  43. Pitois, F.; Thoraval, I.; Baures, E.; Thomas, O. Geographical Patterns in Cyanobacteria Distribution: Climate Influence at Regional Scale. Toxins 2014, 6, 509–522. [Google Scholar] [CrossRef]
  44. Sivonen, K.; Jones, G. Cyanobacterial Toxins. Toxic Cyanobacteria Water A Guide Public Health Conseq. Monit. Manag. 1999, 1, 43–112. [Google Scholar]
  45. Paerl, H.W.; Huisman, J. Climate—Blooms like It Hot. Science 2008, 320, 57–58. [Google Scholar] [CrossRef] [Green Version]
  46. Dittmann, E.; Neilan, B.A.; Erhard, M.; vonDohren, H.; Borner, T. Insertional Mutagenesis of a Peptide Synthetase Gene That Is Responsible for Hepatotoxin Production in the Cyanobacterium Microcystis Aeruginosa PCC 7806. Mol. Microbiol. 1997, 26, 779–787. [Google Scholar] [CrossRef]
  47. Kurmayer, R.; Christiansen, G.; Fastner, J.; Borner, T. Abundance of Active and Inactive Microcystin Genotypes in Populations of the Toxic Cyanobacterium Planktothrix Spp. Environ. Microbiol. 2004, 6, 831–841. [Google Scholar] [CrossRef] [PubMed]
  48. Yepremian, C.; Gugger, M.F.; Briand, E.; Catherine, A.; Berger, C.; Quiblier, C.; Bernard, C. Microcystin Ecotypes in a Perennial Planktothrix Agardhii Bloom. Water Res. 2007, 41, 4446–4456. [Google Scholar] [CrossRef]
  49. Briand, E.; Gugger, M.; Francois, J.C.; Bernard, C.; Humbert, J.F.; Quiblier, C. Temporal Variations in the Dynamics of Potentially Microcystin-Producing Strains in a Bloom-Forming Planktothrix Agardhii (Cyanobacterium) Population. Appl. Environ. Microbiol. 2008, 74, 3839–3848. [Google Scholar] [CrossRef] [PubMed] [Green Version]
  50. Christiansen, G.; Molitor, C.; Philmus, B.; Kurmayer, R. Nontoxic Strains of Cyanobacteria Are the Result of Major Gene Deletion Events Induced by a Transposable Element. Mol. Biol. Evol. 2008, 25, 1695–1704. [Google Scholar] [CrossRef] [PubMed]
  51. Kurmayer, R.; Blom, J.F.; Deng, L.; Pernthaler, J. Integrating Phylogeny, Geographic Niche Partitioning and Secondary Metabolite Synthesis in Bloom-Forming Planktothrix. ISME J. 2015, 9, 909–921. [Google Scholar] [CrossRef] [PubMed]
  52. Briand, E.; Yéprémian, C.; Humbert, J.; Quiblier, C. Competition between Microcystin-and Non-microcystin-producing Planktothrix Agardhii (Cyanobacteria) Strains under Different Environmental Conditions. Environ. Microbiol. 2008, 10, 3337–3348. [Google Scholar] [CrossRef] [PubMed]
  53. Briand, E.; Bormans, M.; Quiblier, C.; Salencon, M.J.; Humbert, J.F. Evidence of the Cost of the Production of Microcystins by Microcystis Aeruginosa under Differing Light and Nitrate Environmental Conditions. PLoS ONE 2012, 7. [Google Scholar] [CrossRef]
  54. De la Cruz, A.A.; Hiskia, A.; Kaloudis, T.; Chernoff, N.; Hill, D.; Antoniou, M.G.; He, X.; Loftin, K.; O’Shea, K.; Zhao, C.; et al. A Review on Cylindrospermopsin: The Global Occurrence, Detection, Toxicity and Degradation of a Potent Cyanotoxin. Environ. Sci. Process. Impacts 2013, 15, 1979. [Google Scholar] [CrossRef]
  55. Ibelings, B.W.; Mur, L.R.; Walsby, A.E. Diurnal Changes in Buoyancy and Vertical-Distribution in Populations of Microcystins in 2 Shallow Lakes. J. Plankton Res. 1991, 13, 419–436. [Google Scholar] [CrossRef]
  56. Huisman, J.; Sharples, J.; Stroom, J.M.; Visser, P.M.; Kardinaal, W.E.A.; Verspagen, J.M.H.; Sommeijer, B. Changes in Turbulent Mixing Shift Competition for Light between Phytoplankton Species. Ecology 2004, 85, 2960–2970. [Google Scholar] [CrossRef] [Green Version]
  57. Li, X.C.; Dreher, T.W.; Li, R.H. An Overview of Diversity, Occurrence, Genetics and Toxin Production of Bloom-Forming Dolichospermum (Anabaena) Species. Harmful Algae 2016, 54, 54–68. [Google Scholar] [CrossRef] [Green Version]
  58. Harke, M.J.; Steffen, M.M.; Gobler, C.J.; Otten, T.G.; Wilhelm, S.W.; Wood, S.A.; Paerl, H.W. A Review of the Global Ecology, Genomics, and Biogeography of the Toxic Cyanobacterium, Microcystis Spp. Harmful Algae 2016, 54, 4–20. [Google Scholar] [CrossRef] [Green Version]
  59. Thomas, M.K.; Litchman, E. Effects of Temperature and Nitrogen Availability on the Growth of Invasive and Native Cyanobacteria. Hydrobiologia 2016, 763, 357–369. [Google Scholar] [CrossRef]
  60. Rigosi, A.; Carey, C.C.; Ibelings, B.W.; Brookes, J.D. The Interaction between Climate Warming and Eutrophication to Promote Cyanobacteria Is Dependent on Trophic State and Varies among Taxa. Limnol. Oceanogr. 2014, 59, 99–114. [Google Scholar] [CrossRef] [Green Version]
  61. Gobler, C.J.; Burkholder, J.M.; Davis, T.W.; Harke, M.J.; Johengen, T.; Stow, C.A.; Van de Waal, D.B. The Dual Role of Nitrogen Supply in Controlling the Growth and Toxicity of Cyanobacterial Blooms. Harmful Algae 2016, 54, 87–97. [Google Scholar] [CrossRef]
  62. Chaffin, J.D.; Davis, T.W.; Smith, D.J.; Baer, M.M.; Dick, G.J. Interactions between Nitrogen Form, Loading Rate, and Light Intensity on Microcystis and Planktothrix Growth and Microcystin Production. Harmful Algae 2018, 73, 84–97. [Google Scholar] [CrossRef]
  63. Dupas, R.; Minaudo, C.; Gruau, G.; Ruiz, L.; Gascuel-Odoux, C. Multidecadal Trajectory of Riverine Nitrogen and Phosphorus Dynamics in Rural Catchments. Water Resour. Res. 2018, 54, 5327–5340. [Google Scholar] [CrossRef]
  64. Lewis, W.M.; Wurtsbaugh, W.A. Control of Lacustrine Phytoplankton by Nutrients: Erosion of the Phosphorus Paradigm. Int. Rev. Hydrobiol. 2008, 93, 446–465. [Google Scholar] [CrossRef]
  65. Moss, B.; Jeppesen, E.; Sondergaard, M.; Lauridsen, T.L.; Liu, Z.W. Nitrogen, Macrophytes, Shallow Lakes and Nutrient Limitation: Resolution of a Current Controversy? Hydrobiologia 2013, 710, 3–21. [Google Scholar] [CrossRef]
  66. Scott, J.T.; Grantz, E.M. N-2 Fixation Exceeds Internal Nitrogen Loading as a Phytoplankton Nutrient Source in Perpetually Nitrogen-Limited Reservoirs. Freshw. Sci. 2013, 32, 849–861. [Google Scholar] [CrossRef]
  67. Kolzau, S.; Dolman, A.M.; Voss, M.; Wiedner, C. The Response of Nitrogen Fixing Cyanobacteria to a Reduction in Nitrogen Loading. Int. Rev. Hydrobiol. 2018, 103, 5–14. [Google Scholar] [CrossRef]
  68. Paerl, H.W.; Scott, J.T.; McCarthy, M.J.; Newell, S.E.; Gardner, W.S.; Havens, K.E.; Hoffman, D.K.; Wilhelm, S.W.; Wurtsbaugh, W.A. It Takes Two to Tango: When and Where Dual Nutrient (N & P) Reductions Are Needed to Protect Lakes and Downstream Ecosystems. Environ. Sci. Technol. 2016, 50, 10805–10813. [Google Scholar] [CrossRef] [PubMed] [Green Version]
  69. Mantzouki, E.; Visser, P.M.; Bormans, M.; Ibelings, B.W. Understanding the Key Ecological Traits of Cyanobacteria as a Basis for Their Management and Control in Changing Lakes. Aquat. Ecol. 2016, 50, 333–350. [Google Scholar] [CrossRef]
  70. Grasshoff, P. Methods of Seawater Analysis. Verlag Chemie. FRG 1983, 419, 61–72. [Google Scholar]
  71. US EPA United States Environmental Protection Agency. Method 365.1: Determination of Phosphorus by Semi-Automated Colorimetry; O’Dell, J.W., Ed.; Office of Research and Development: Cincinnati, OH, USA, 1993. [Google Scholar]
  72. US EPA United States Environmental Protection Agency. Method 353.2. Determination of Nitrate-Nitrite Nitrogen by Automated Colorimetry; O’Dell, J.W., Ed.; Office of Research and Development: Cincinnati, OH, USA, 1993. [Google Scholar]
  73. Brient, L.; Lengronne, M.; Bertrand, E.; Rolland, D.; Sipel, A.; Steinmann, D.; Baudin, I.; Legeas, M.; Le Rouzic, B.; Bormans, M. A Phycocyanin Probe as a Tool for Monitoring Cyanobacteria in Freshwater Bodies. J. Environ. Monit. 2008, 10, 248–255. [Google Scholar] [CrossRef]
  74. US EPA United States Environmental Protection Agency. Standard Operating Procedure for Zooplankton Analysis (Method LG403). Great Lakes Natl. Off. 2016. Available online: https://www.epa.gov/sites/production/files/2017-01/documents/sop-for-zooplankton-analysis-201607-22pp.pdf (accessed on 1 May 2018).
  75. Pourriot, R.; Francez, A.-J. Introduction Pratique à La Systématique Des Organismes Des Eaux Continentales Françaises.-8: Rotifères. Publ. De La Société Linnéenne De Lyon 1986, 55, 148–176. [Google Scholar] [CrossRef]
  76. Amoros, C. Introduction Pratique à La Systématique Des Organismes Des Eaux Continentales Françaises-5. Crustacés Cladocères. Publ. De La Société Linnéenne De Lyon 1984, 53, 72–107. [Google Scholar]
  77. Méthode Interne ME 230; Laboratoire Départemental d’analyses Du Morbihan: Brittany, France, 2016.
  78. Wolf, H.U.; Frank, C. Toxicity Assessment of Cyanobacterial Toxin Mixtures. Environ. Toxicol. 2002, 17, 395–399. [Google Scholar] [CrossRef]
  79. Fastner, J.; Humpage, A. Chapter 2.1.; Hepatotoxic cyclic peptides—Microcystins and Nodularins. In Toxic Cyanobacteria in Water: A Guide to Their Public Health Consequences, Monitoring and Management; CRC Press: Boca Raton, FL, USA, 2021; pp. 21–52. [Google Scholar]
  80. US EPA Method LG 401, Standard Operating Procedure for Phytoplankton Analysis. Environ. Monit. Syst. Lab. 2003.
  81. Rimet, F.; Druart, J.C. A Trait Database for Phytoplankton of Temperate Lakes. Ann. De Limnol. Int. J. Limnol. 2018, 54. [Google Scholar] [CrossRef] [Green Version]
  82. HydroFrance. Available online: Http://Www.Hydro.Eaufrance.Fr/ (accessed on 10 January 2020).
  83. R Core Team. R: A Language and Environment for Statistical Computing; Software Version R Version 3.6.1 (2019-07-05); R Foundation for Statistical Computing: Vienna, Austria, 2019. [Google Scholar]
Figure 1. Nutrients concentration at the entrance, middle and in the lower basin of the reservoir during the 2018–2019 seasonal cycle.
Toxins 13 00351 g001
Figure 2. Phytoplankton and zooplankton dynamics over 2018–2019 seasonal cycle at the entrance, middle and in the lower basin of the reservoir. No statistical differences were observed between abundances of the three stations, except for Polyarthra (rotifer), copepods and Daphnia, for which the entrance present a lower abundance than the lower basin (p < 0.05).
Toxins 13 00351 g002
Figure 3. (left) Time series of the abiotic factors (blue points), showing the adjusted GAM (Table 3) in red. (right) Smooth fit with confidence bands performed with mgcv’s gam function, showing the effect of year and month (or time for Nitrates) on the abiotic factors.
Toxins 13 00351 g003
Figure 4. Time series of (A) the air temperature, (B) the light intensity, (C) the residence time and the river inflow, (D) the lake water level, (E) the mean daily wind speed, (F) the nitrates and (G) the total phosphorus concentration over 13 years (2007–2019). The light grey areas mark the summer periods. The different dotted lines show tendencies over the 13 years period. The black line in plot D indicates the hight above sea level of the outflow.
Toxins 13 00351 g004
Figure 5. Cyanobacterial genus (in biovolumes, areas) and toxins’ concentrations (points) over 2007–2019 summer periods in the lower basin of the reservoir.
Toxins 13 00351 g005
Figure 6. Distance biplot of the Canonical Correspondence Analysis (CCA) linking cyanobacterial biovolumes to environmental parameters measured during the six previous days. Data from summer periods between 2006 and 2017 were used. (a) Significant change of cyanobacteria composition with time was tested by permutation test (function envfit). (b) Histogramm of the permutation test for the ordination model. (c) Biomass of Dolichospermum depending on nitrates concentration, showing a threshold effect. ResTim: water residence time, AirTe: mean air temperature, Light: mean daily global radiation, Flow: mean river inflow, and time: sampling dates as open circles. The less significant environmental variables (rainfall, wind in intensity and variability) were eliminated from the analysis based on Akaike Information Criterion (AIC). Cyanobacteria genus by alphabetic order are: Aphaniz: Aphanizomenon; Aphca: Aphanocpasa, Aphth: Ahanothece, Chroo: Chroococcus, Coelom: Coelomoron, Dolicho: Dolichospermum; Gomo: Gomphosphaeria, Lemne: Lemmermaniella, Limno: Limnothrix, Microc: Microcystis; Oscill: Oscillatoria, Plank: Planktothrix agardhii, Pseud: Pseudanabaena, Woro: Woronichinia.
Toxins 13 00351 g006
Figure 7. Localization of the Lac-au-Duc in France and stations monitored during the 2018–2019 seasonal cycle (round) for the 13 summer period analyses (triangle). Maps extracted from Geoportail.
Toxins 13 00351 g007
Table 1. N/P Redfield ratios of the particulate matter at the entrance, middle and in the lower basin of the reservoir, respectively. N/P Redfield ratios were calculated only for the July–November period, as during the rest of the year, there was no particulate nitrogen and/or phosphorus concentrations were below limit of quantification.
N/P Ratios of the Particulate Matter
EntranceMiddleLower Basin
2018July5.4510.1610.34
August10.6712.9914.62
September10.0012.4316.41
October7.6111.6211.18
November1.1512.2313.83
2019July0.2815.4517.80
August6.7813.1619.92
Mean ± SD5.99 ± 4.0312.58 ± 1.6214.87 ± 3.46
Table 2. Hydrological and meteorological characterisation of summer periods between 2007 and 2019. “Annual river inflow” was measured between November of the previous year and October, while “Summer river inflow” was measured between June and September. Dates of downstream flow stop (out of the lake) are indicated and depends on the water level (overflow). The date of the autumn increase in river inflow is also indicated in the last column.
Number of Days
from June to September
River Inflow in the Reservoir:Date at Which Downstream Flow is Closed to 0 Date of Autumn Discharge Beginning
With Water Temperature
> 20 °C
With Light > 2800 J cm2With Daily Wind
> 4m s−1
Annual River Inflow (m3)Summer River Inflow (m3)
20072 days1 days25 days104,466,49914,288,573outflow all year round
2008 4 days6 days29 days82,705,1906,988,378outflow all year round
2009 10 days5 days11 days72,962,5543,228,85426/08/200917/11/2009
2010 19 days15 days27 days74,001,686900,54727/07/201007/10/2010
2011 11 days9 days33 days53,371,440879,98424/09/201115/12/2011
2012 14 days3 days22 days30,433,2773,377,46214/09/201205/10/2012
2013 25 days10 days18 days105,320,4773,085,60312/09/201306/11/2013
2014 18 days16 days7 days155,305,0372,709,418outflow all year
2015 12 days18 days18 days68,434,7621,434,93105/07/201523/11/2015
2016 20 days1 days7 days62,350,9062,336,68825/07/201626/01/2017
2017 23 days3 days11 days19,428,6821,200,26903/07/201715/12/2017
2018 30 days8 days10 days71,447,0987,710,25023/07/201807/12/2018
2019 25 days13 days29 days38,914,9062,677,62212/07/201926/10/2019
Table 3. Summary of the GAM results performed on the abiotic parameters, with their smoothing functions. Plots are shown in Figure S1. Adj., adjusted.
Dependant Variable (Number of Data Points)GAMs ModelSmoothing FunctionsEstimated Degrees of FreedomFisher Testp-Value
Adj. R2DE (%)REML
Temperature
(n = 5019)
0.770.1%12598S (year)8.10512.044.92 × 10−16
S (month)8.584 1292.95<2 × 10⁻¹⁶
Log10 Res Time (n = 5052)0.71972%3360.3S (year)8.829129.8<2 × 10⁻¹⁶
S (month, k = 12)10.4971073.5<2 × 10⁻¹⁶
Nitrates (n = 283)0.81786.1%612.37S (time)67.7515.15<2 × 10⁻¹⁶
Flow
(n = 5027)
0.65165.2%−970.35S (year)12.7871.01<2 × 10⁻¹⁶
S (month)8.618.61<2 × 10⁻¹⁶
Publisher’s Note: MDPI stays neutral with regard to jurisdictional claims in published maps and institutional affiliations.

