Article

The Regulatory Mechanism of Water Activities on Aflatoxins Biosynthesis and Conidia Development, and Transcription Factor AtfB Is Involved in This Regulation

1
Institute of Food Science and Technology, Chinese Academy of Agricultural Sciences, Beijing 100193, China
2
Qingdao Tianxiang Foods Group Co., Qingdao 266737, China
3
School of Food Science and Engineering, Foshan University, Foshan 528231, China
4
Shandong Institute of Commerce and Technology, Jinan 250103, China
*
Authors to whom correspondence should be addressed.
These authors contributed equally to this work.
Submission received: 23 March 2021 / Revised: 2 June 2021 / Accepted: 18 June 2021 / Published: 21 June 2021
(This article belongs to the Special Issue Research on Pathogenic Fungi and Mycotoxins in China)

Abstract

:
Peanuts are frequently infected by Aspergillus strains and then contaminated by aflatoxins (AF), which brings out economic losses and health risks. AF production is affected by diverse environmental factors, especially water activity (aw). In this study, A. flavus was inoculated into peanuts with different aw (0.90, 0.95, and 0.99). Both AFB1 yield and conidia production showed the highest level in aw 0.90 treatment. Transcriptional level analyses indicated that AF biosynthesis genes, especially the middle- and later-stage genes, were significantly up-regulated in aw 0.90 than aw 0.95 and 0.99. AtfB could be the pivotal regulator response to aw variations, and could further regulate downstream genes, especially AF biosynthesis genes. The expressions of conidia genes and relevant regulators were also more up-regulated at aw 0.90 than aw 0.95 and 0.99, suggesting that the relative lower aw could increase A. flavus conidia development. Furthermore, transcription factors involved in sexual development and nitrogen metabolism were also modulated by different aw. This research partly clarified the regulatory mechanism of aw on AF biosynthesis and A. flavus development and it would supply some advice for AF prevention in food storage.
Key Contribution: This research revealed the regulatory mechanism of aw on AF biosynthesis and A. flavus development, and transcription factor AtfB is involved in the regulation. These results will provide some possible targets for AF prevention in food storage.

1. Introduction

Peanut is an important economical crop for oil production and nutritious addition in human consumption. However, aflatoxigenic Aspergillus strains infection and aflatoxins (AF) contamination bring out immense human health risks and huge economic losses for the peanut industry. AF are the polyketide-derived furanocoumarins with strong carcinogenicity that associated with both acute and chronic toxicity for animals and humans [1]. More than 28% hepatocellular carcinoma cases are induced by AF contamination in the world [2]. Among the diverse AF, aflatoxin B1 (AFB1), as the most toxic and dangerous one, is usually high-level-produced by some aflatoxigenic Aspergillus strains [3]. Therefore, investigating A. flavus growth and metabolism, especially AF biosynthesis, is extremely essential for controlling AF contamination.
The AF biosynthesis and fungal development of A. flavus are affected by diverse environmental factors, such as water activity (aw), temperature, pH, carbon source, nitrogen source, and oxidative stress. Based on the definition of U. S. Food and Drug Administration (FDA), aw of a food is the ratio between the vapor pressure of the food itself, when in a completely undisturbed balance with the surrounding air media, and the vapor pressure of distilled water under identical conditions. So, aw as a parameter to measure the freely available water in food or substrate is directly related to the food microbial growth in a specific condition [4]. More importantly, aw was regarded as a central environmental factor, and could co-modulate the fungal development and toxin production of Aspergillus spp. with other environmental factors [5,6,7]. Previous studies reported that the proper aw conditions for AF biosynthesis were dependent on the other environmental factors, for example, temperature, pH, light, and especially culture substrates [5,8,9]. However, few researchers focused on the effect of peanut substrates with different aw on A. flavus development and AF production.
As the most important characters of A. flavus, AF biosynthesis has been well researched in past decades. More than 20 structural genes, located in the 80-kb AF cluster, are involved in the series enzymatic reactions, and transform acetyl-CoA to AFB1, AFB2, AFG1, and AFG2 [10]. Two pathway specific regulators, DNA binding protein AflR and transcriptional co-activator AflS, are affected by other regulators or environmental factors, and then modulate the structural genes’ transcriptions [9,11]. AF production are also regulated by plenty of global regulators including the velvet complex, MAPK pathway factors, oxidative-stress-related regulators, G-protein receptors, oxylipin proteins, as well as many oxidative stress transcription factors (TFs) [10,12]. All AF biosynthetic enzymes and AF regulators constitute an extremely complicated system, and diverse environmental factors affect AF production by adjusting the expression of the AF regulatory system. In previous studies, the expression of AF structural genes could have been affected by diverse aw, and the ratio of aflS/aflR was more down-regulated in aw 0.99 than aw 0.96 [6,8,9,13]. However, the mechanism of aw on AF biosynthesis regulation is still unclear.
Transcriptome analysis is regarded as an effective and efficient method to discover the new regulatory mechanisms. In previous studies, the optimal aw for AF biosynthesis were in the range of 0.90–0.99 at the different environmental combinations [6,8,9,13]. In this study, the aw of shelled peanuts were adjusted as 0.90, 0.95, 0.99, and the AF production and fungal growth were confirmed at different aw. By comprehensive transcriptional analysis, AF cluster genes, conidia development genes, and several TFs were significantly up-regulated at aw 0.90, and AtfB was regarded as the critical TFs for AF regulation in diverse aw. This work contributes to better understanding of the regulatory mechanism of aw on A. flavus development and AF biosynthesis, and it is helpful to reduce the AF contamination in peanuts storage.

2. Results

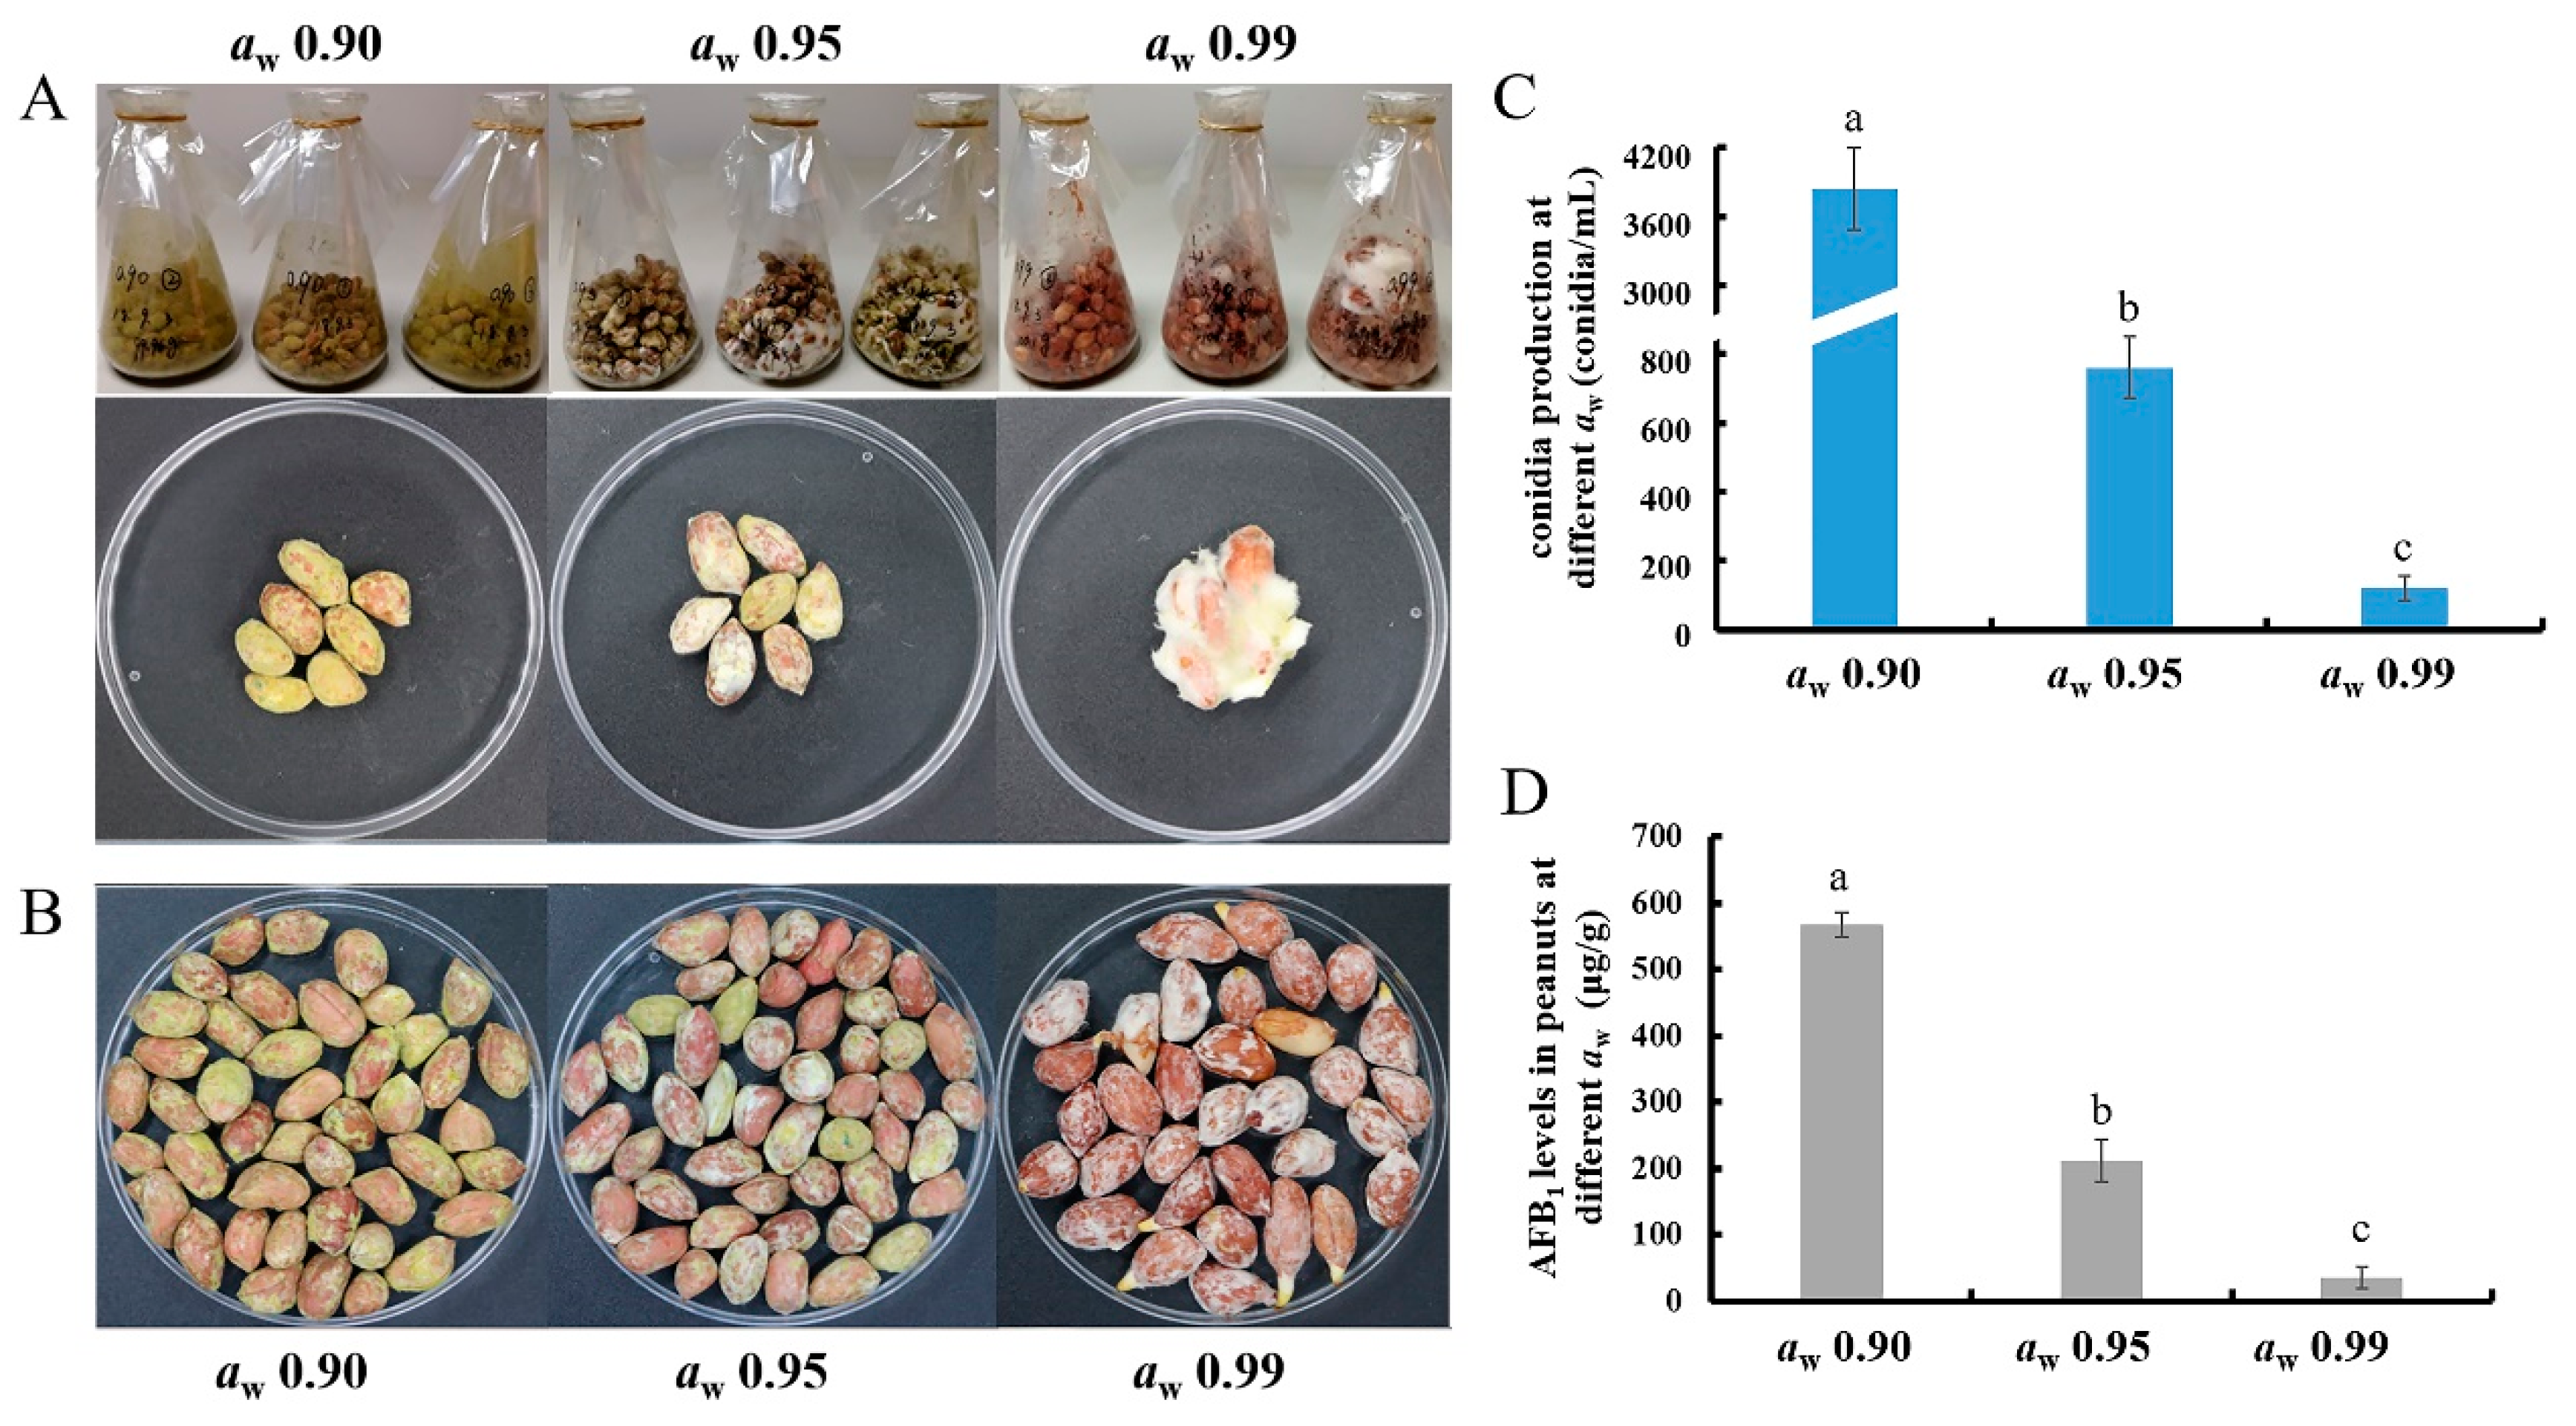
2.1. Water Activity Affects the Conidia Production and the AFB1 Production of A. flavus in Peanuts

After 10 days cultivation, almost all of the peanuts at aw 0.90 were covered by the green conidia and mycelia, while the conidia and the green color were significantly less at aw 0.95 (Figure 1A,B). At aw 0.99, peanuts were only coated by white mycelia, but without obvious conidia production (Figure 1A,B). After counting the peanut-washed suspensions by hemocytometer, the conidia concentrations were more than 3800 conidia/mL in aw 0.90, and less than 800 conidia/mL in aw 0.95, but few conidia were in aw 0.99 treatment (Figure 1C). The AFB1 levels in contaminated peanuts in different aw treatments were also examined (Figure 1D). At aw 0.90, 568 μg/g AFB1 were detected, while AFB1 levels were significantly decreased at aw 0.95 and 0.99, with 212 μg/g and 36 μg/g, respectively (Figure 1D). So, these results concluded that in shelled peanuts with aw 0.90–0.99, the conidia development and AFB1 production of A. flavus were increased in the relatively lower aw conditions.

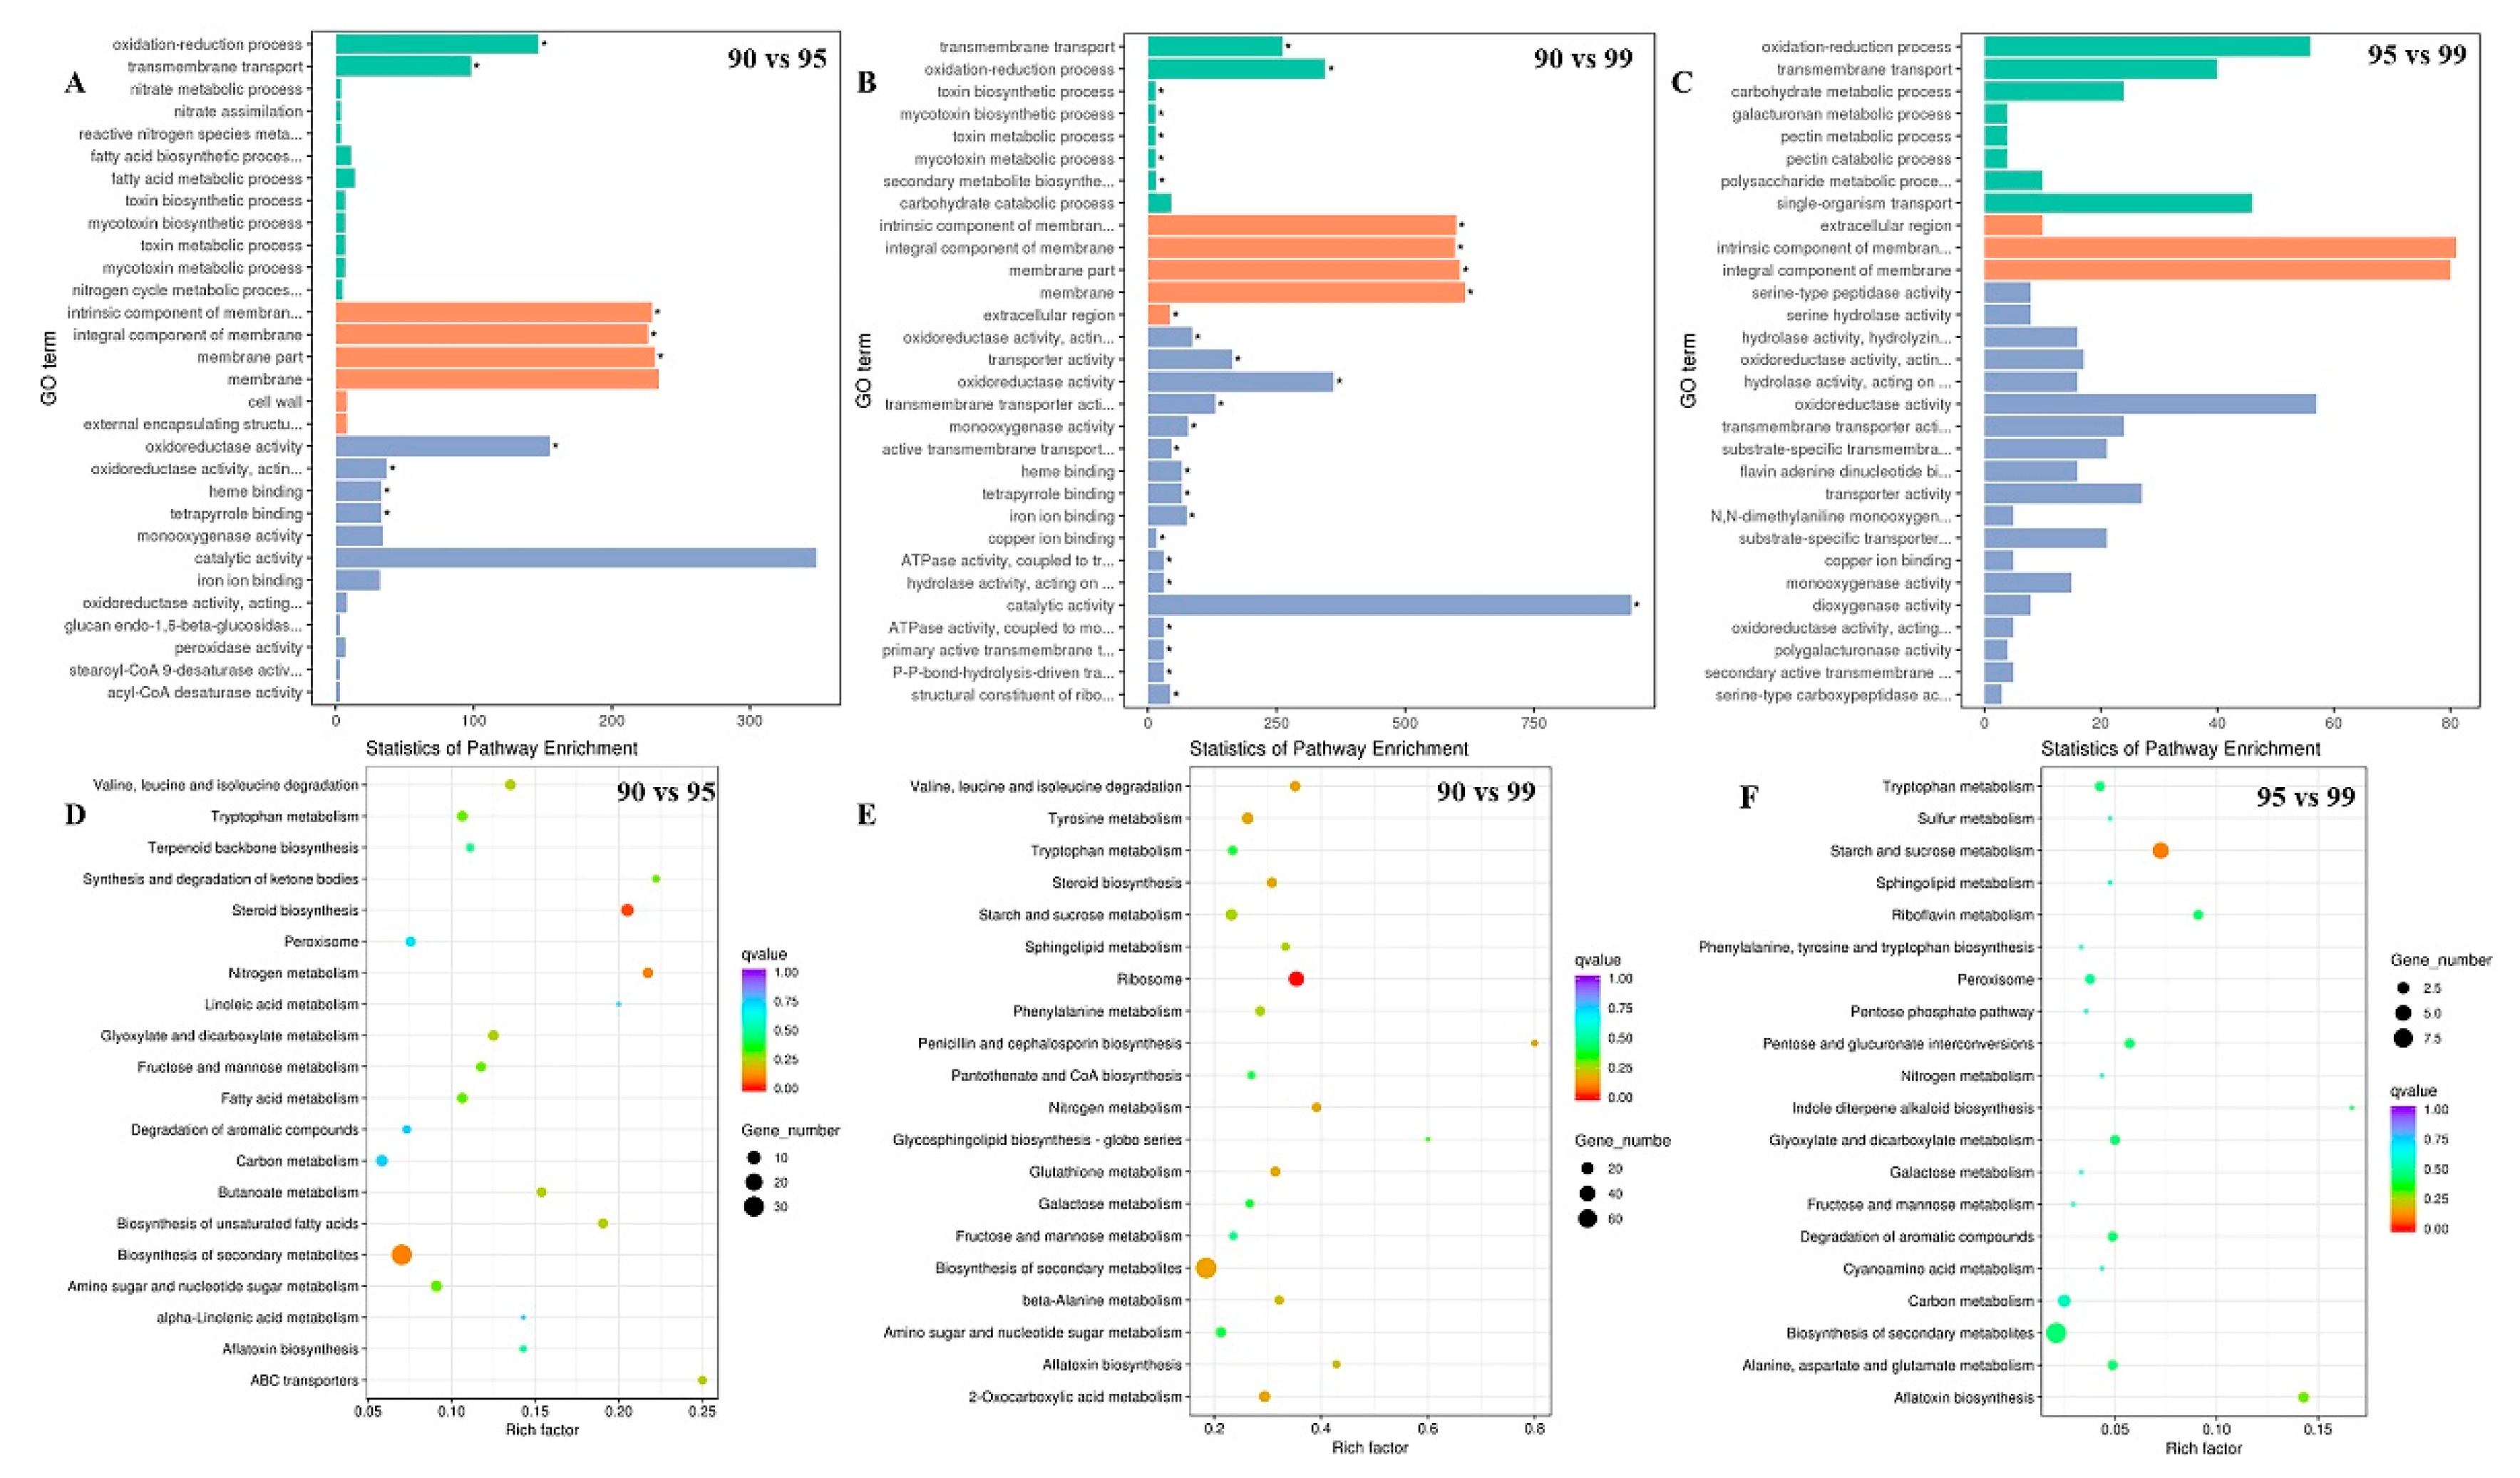
2.2. Transcriptome Analyses of the A. flavus Genes Expressions in Different Water Activity

To explore the regulatory mechanisms of aw on A. flavus development and AF biosynthesis in peanuts, transcriptome analyses were performed. A total of 14,472 genes were mapped to the A. flavus NRRL3357 genome and 671 novel genes were identified from the transcriptome data. Compared with aw 0.95 treatment, 834 DEGs of A. flavus in aw 0.90 were up-regulated, while 148 DEGs were down-regulated (Figure 2A). A total of 2667 DEGs with 1760 up-regulated and 907 down-regulated were identified in a comparison of aw 0.90 vs. 0.99 (Figure 2B). In a comparison of aw 0.95 vs. 0.99, 233 genes were increased, and 95 genes were decreased (Figure 2C). A heat map of the DEGs clustering also showed the obviously differential expression pattern among the three aw conditions, of which the most genes were up-regulated in aw 0.90 treatment, while two thirds of the genes were down-regulated at aw 0.99 (Figure 2D). GO annotation analysis of the comparisons of aw 0.90 vs. 0.95 and aw 0.90 vs. 0.99 found that DEGs were enriched in oxidation-reduction process and transmembrane transport in biological process, the intrinsic component of the membrane, the integral component of the membrane, the membrane part, the membrane in the cellular component, and catalytic activity in molecular function (Figure 3A,B). DEGs in aw 0.95 vs. 0.99 were enriched in similar GO items, such as oxidation-reduction process, single-organism transport, transmembrane transport in biological process, the intrinsic component of membrane, the integral component of the membrane in the cellular component, and oxidoreductase activity in molecular function (Figure 3C). KEGG pathway annotation revealed DEGs of the different aw comparisons were mainly enriched in biosynthesis of secondary metabolites, steroid biosynthesis, nitrogen metabolism, ribosome, valine, leucine and isoleucine degradation, and starch and sucrose metabolism (Figure 3D–F).

2.3. Expression Changes of AF Cluster Genes in Different aw Conditions

Based on transcriptomic analyses, the transcriptional variations of AF cluster genes were listed in Table 1. In comparison of aw 0.90 vs. 0.95, 24 of 34 AF biosynthetic genes were significantly up-regulated. The 25 genes of the AF cluster were apparently increased in aw 0.90 than aw 0.99, and 15 AF biosynthesis genes were significantly up-regulated in aw 0.95 than aw 0.99. Among these genes, aflV, aflO, aflI, aflLa, and aflL showed the most obviously increased in aw 0.90, but the expression of initial steps genes, aflA and aflB, were not increased in comparisons of aw 0.90 vs. 0.95 and aw 0.95 vs. 0.99. The expressions in different aw treatments of the pathway-specific regulators, AflR and AflS, showed up-regulations, but were not significantly changed in aw 0.90 vs. 0.95 and aw 0.95 vs. 0.99. All these results suggested that transcriptional expressions of the AF cluster genes could be affected by different aw levels.

2.4. Varying Expressions of Diverse Regulator-Associated AF Biosynthesis in Different aw Conditions

The expression changes of AF biosynthesis-related regulators were listed in Table S1. The majority regulators’ expressions, such as the velvet complex genes, the MAPK pathway genes, and the GPCRs genes, were not significantly different in diverse aw conditions. However, the bZIP TF, AtfB, was obviously changed at different aw conditions, and the atfB levels showed to be significantly up-regulated in comparisons of aw 0.90 vs. 0.99 and aw 0.95 vs. 0.99 (Table S1). The other AF production-related TFs were not noticed any differently at different aw (Table S1). The transcriptional expressions of the oxylipin genes ppoB were significantly up-regulated at lower aw, while ppoA and ppoC showed similar levels in different aw comparisons (Table S1). The calcium-binding protein caleosin gene, AfPXG, and the cAMP-dependent protein kinase gene, pkaC, were not apparently changed in aw 0.90 vs. 0.95, whereas they showed significantly increased levels in aw 0.90 vs. 0.99 and aw 0.95 vs. 0.99 (Table S1). Concerning SakA, homologous with HogA in Saccharomyces cerevisiae, its transcriptional expressions were down-regulated at the lower aw, but significantly changed only in comparison of aw 0.90 vs. 0.99 (Table S1).

2.5. Different Expression of the Genes Controlling Conidia Production in Different Water Activities

The transcriptional expressions of several conidia developmental and regulatory genes were also analyzed in transcriptome analyses (Table 2). Six conidial development proteins, including conidiation-specific family protein (AFLA_044790), conidiation proteins Con6 and Con10, conidial hydrophobin RodA and RodB, and conidial pigment biosynthesis oxidase Arb2, showed significantly up-regulated transcription in the lower aw conditions (Table 2). However, conidial-pigment-biosynthesis-related gene arp1 and conidiophore-development-related gene hymA showed no difference at different aw (Table 2). Several pieces of research reported that the velvet complex and the developmental signal biosynthesis protein FluG could affect the conidia production. However, veA, laeA, velB, and fluG showed similar expression in diverse aw (Table 2). The transcriptional expressions of the developmental regulator FlbA and the conidiation-related TFs, FlbC and StuA, were also not significantly different at aw 0.90, 0.95, and 0.99 conditions (Table 2). However, the C2H2 type conidia developmental TF gene brlA and the developmental regulator genes, vosA and wetA, showed to be significantly more up-regulated at aw 0.90 than in aw 0.95 and 0.99 (Table 2). Taken together, the expressions of conidia developmental proteins and their regulators could be affected by different aw conditions.

2.6. The Effects of Diverse Water Activities on Transcription Factors

The TFs’ expressions in different aw were additionally analyzed in this study. In a total of 271 TFs (annotated in this transcriptome data), 29 transcriptional factors showed significant variations in the comparison of aw 0.90 vs. 0.99 (Table 3). Among them, 20 genes were significantly up-regulated at aw 0.90, while the other nine genes were significantly down-regulated. With the exception of the two mentioned TFs, BrlA and AtfB, the TFs, including LeuB, RosA, NosA, AbaA, and MeaB, were also significantly increased at aw 0.90 compared to aw 0.99. In the comparison of aw 0.90 vs. 0.95, the expressions of TF genes, AFLA_029620 (abaA), AFLA_040300, AFLA_082850 (brlA), and Novel 00457 were up-regulated at aw 0.90. In the comparison of aw 0.95 vs. 0.99, only nosA, atfB, and brlA levels were increased. So, several TFs genes were affected by aw conditions, and further regulated the transcriptions of downstream genes.

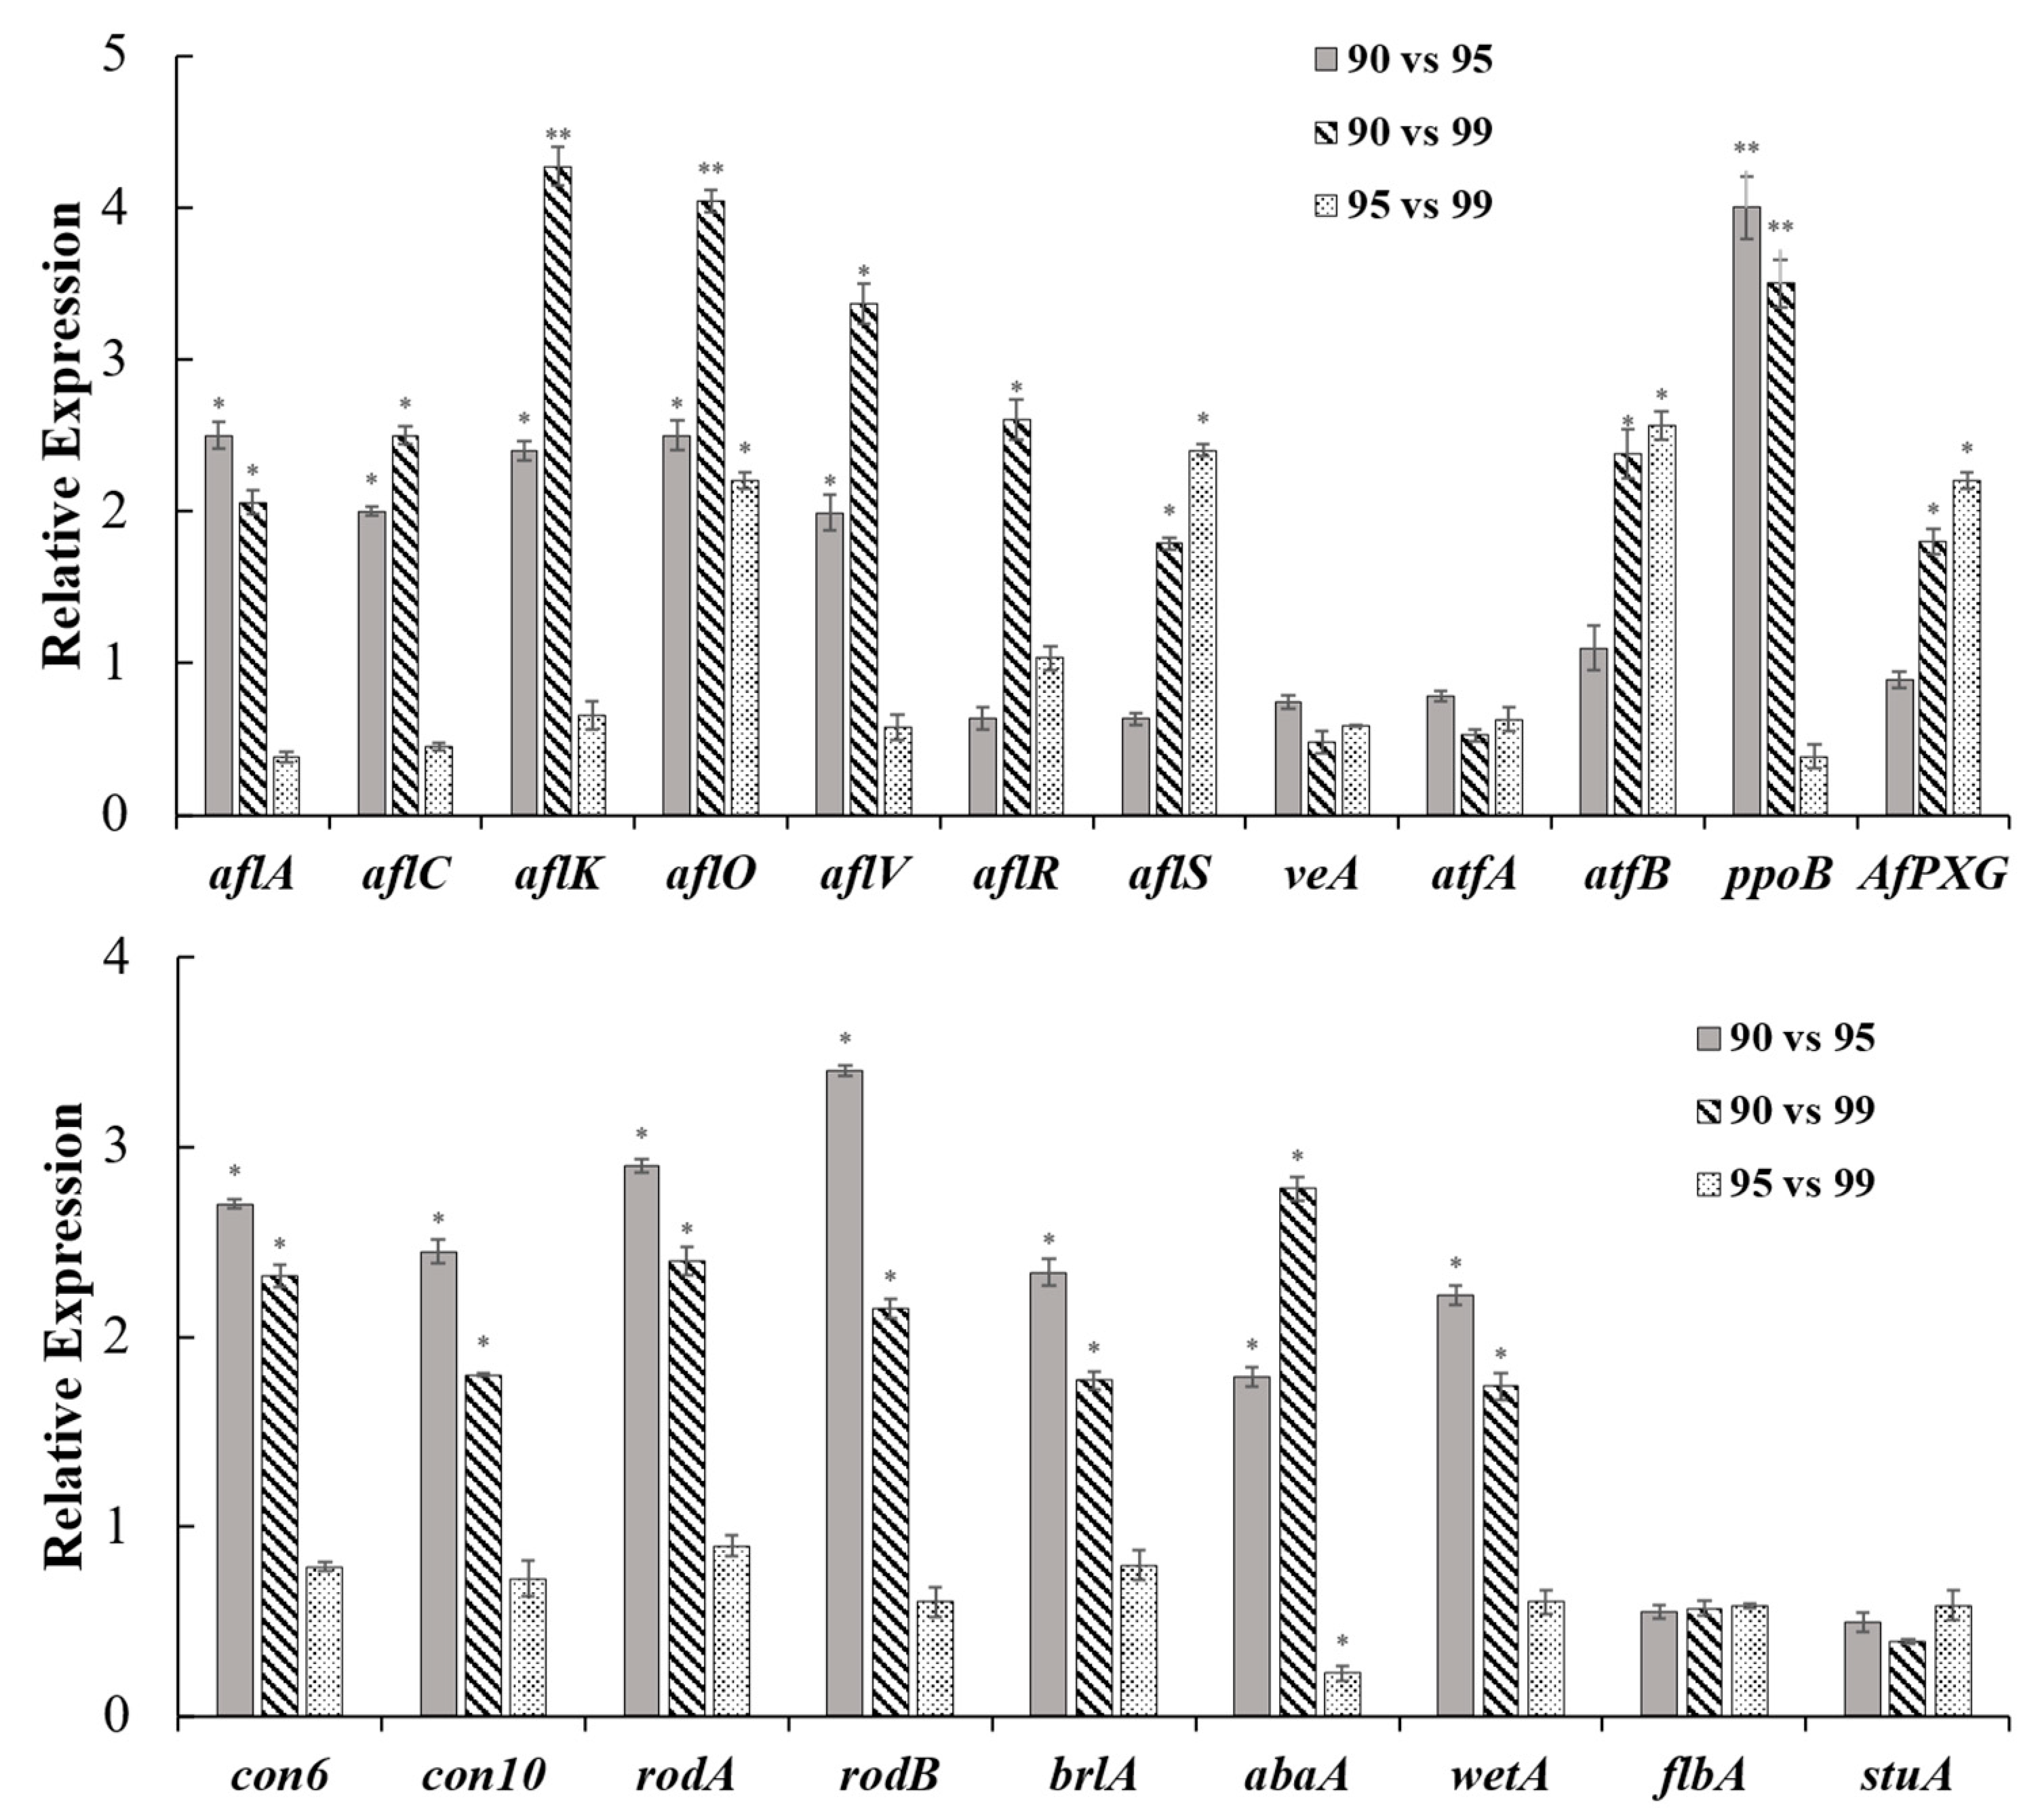
2.7. RT-qRCR Analyses of Genes Expressions Involved in AF Biosynthesis and Conidia Development
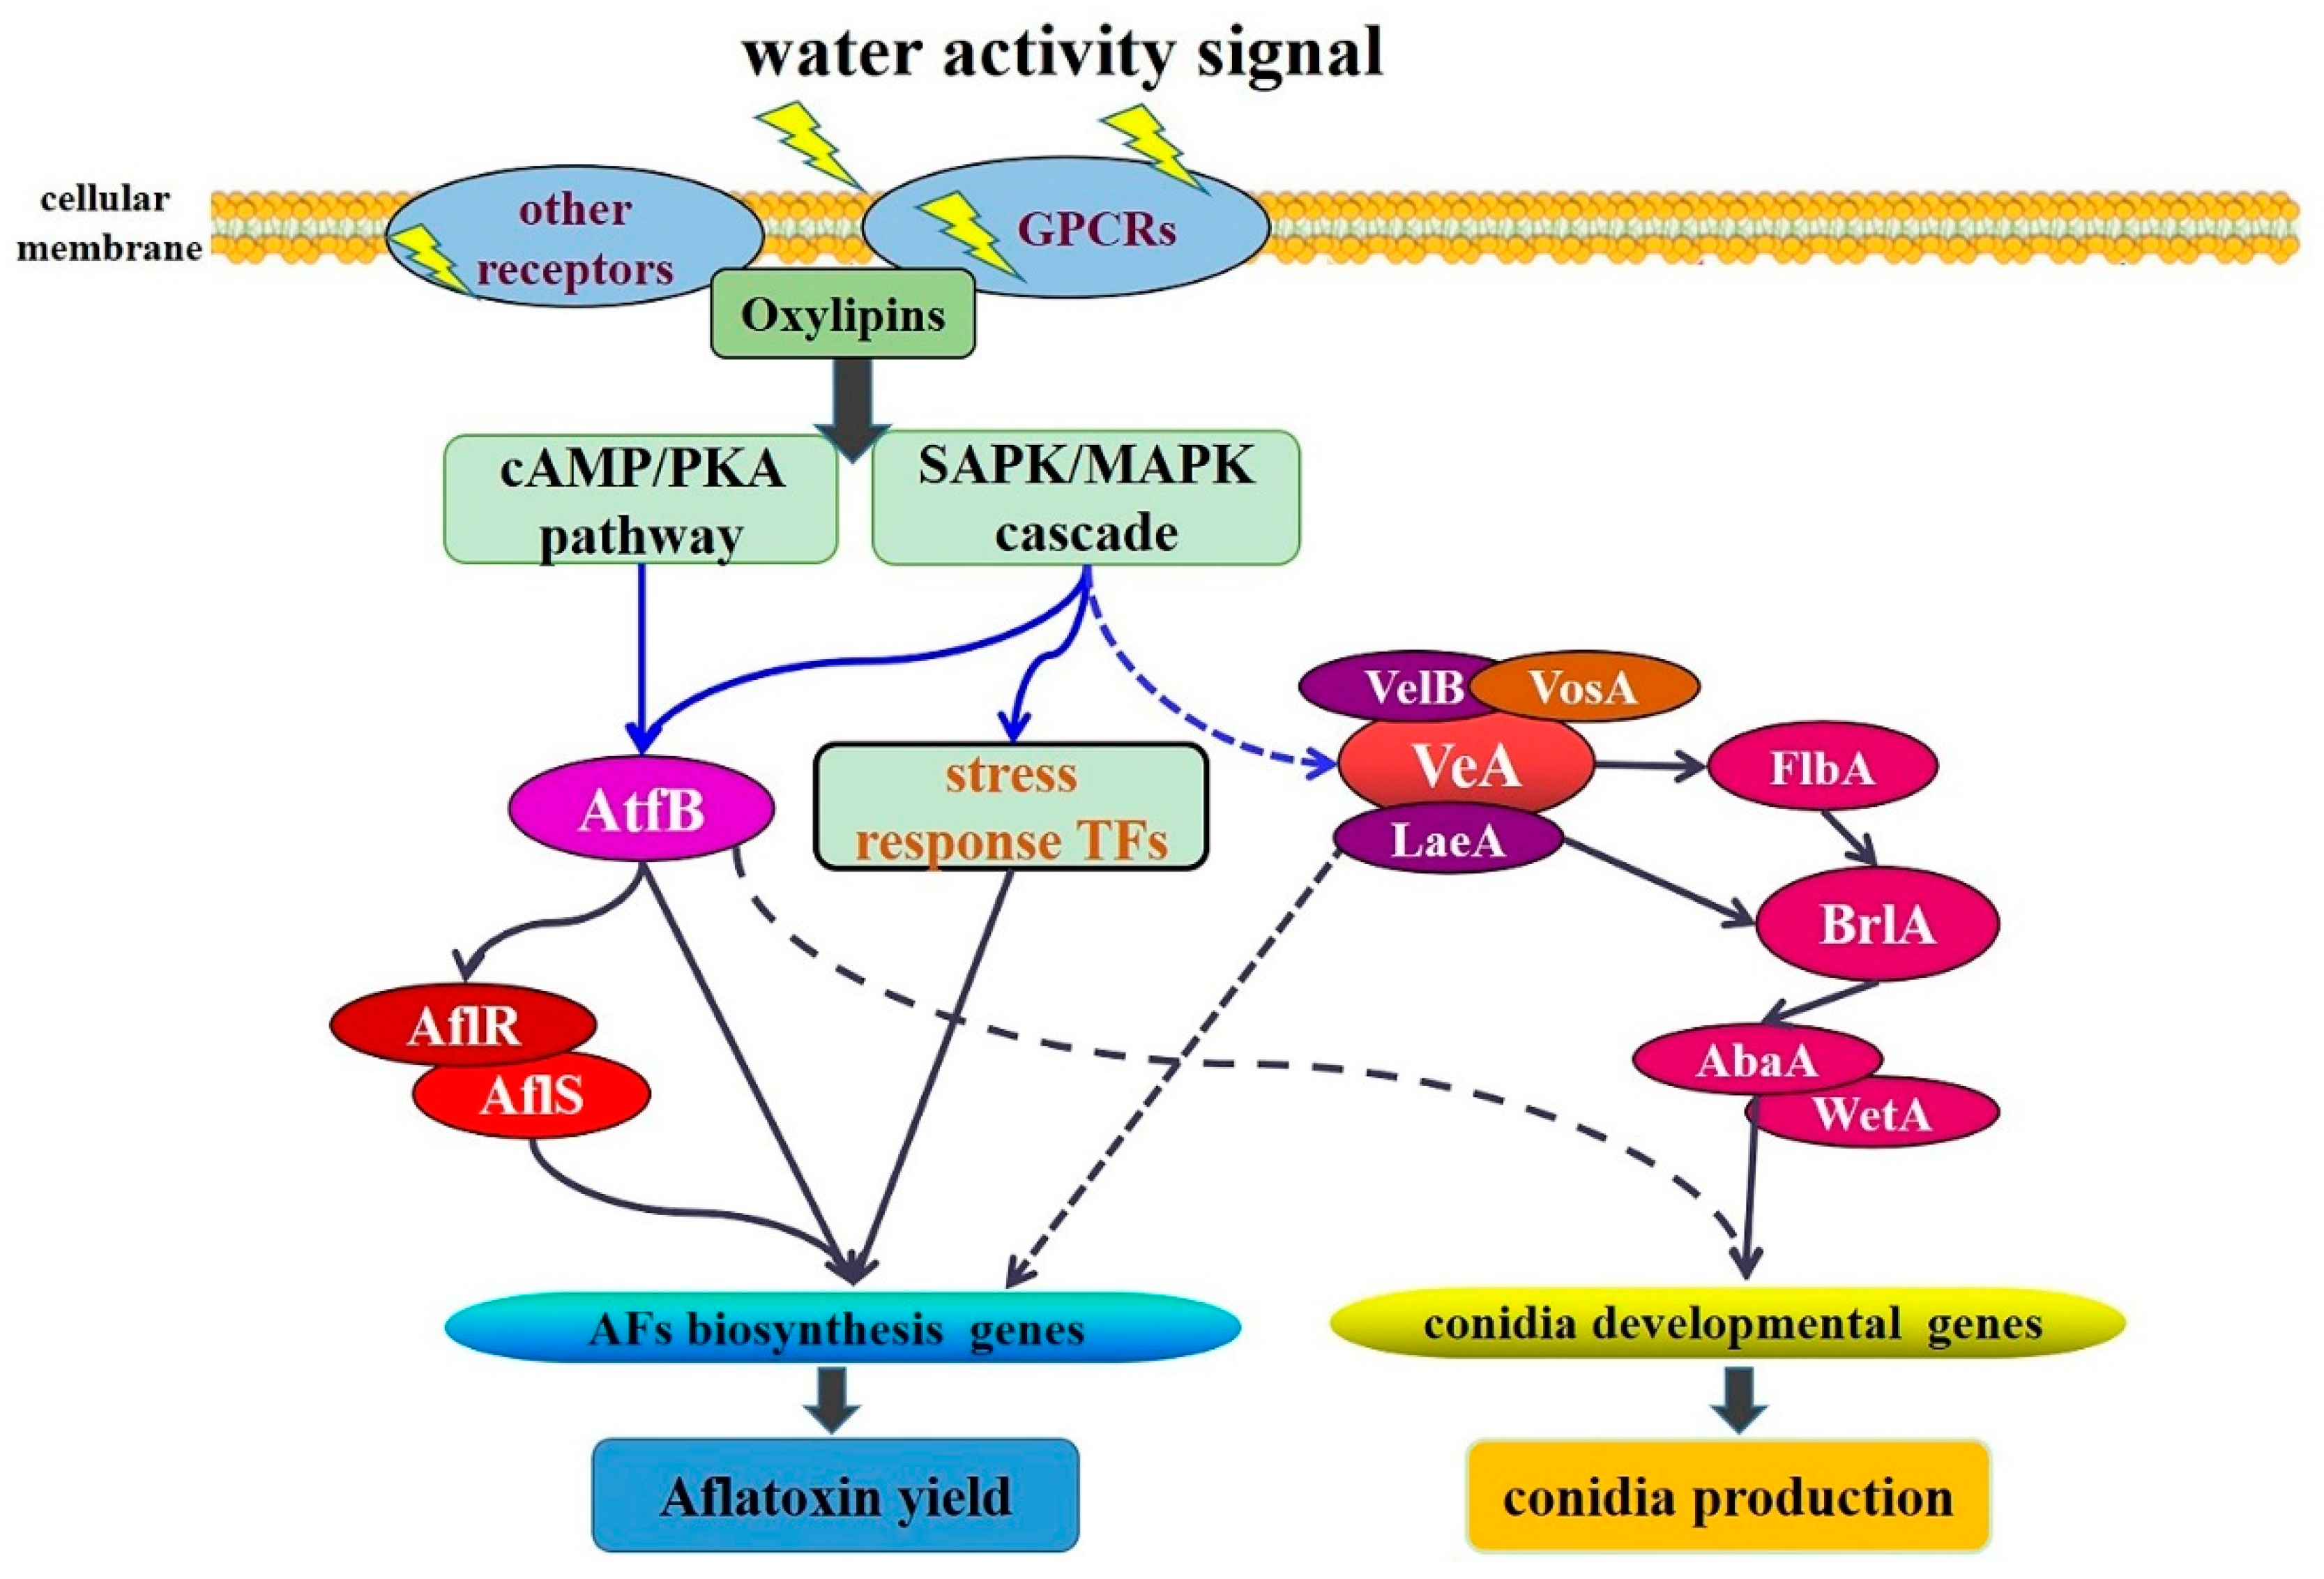
RT-qPCR was performed for confirming the transcriptome results. Similar with transcriptome data, aflA and aflC were up-regulated at aw 0.90 compared with aw 0.95 and 0.99, and aflK, aflO, and aflV were more drastically increased. Additionally, aflO in comparison to aw, 0.90 vs. 0.99 showed the biggest difference with 4.04-log2FoldChange. The aflR was only significantly changed in aw 0.90 vs. 0.99, while aflS levels were increased at aw 0.90 and 0.95 compared to aw 0.99 (Figure 4A). The transcripts of atfB, ppoB, and AfPXG were significantly up-regulated under the lower aw conditions, but the expressions of veA and atfA were not significantly changed (Figure 4A). The conidia developmental genes, con6, con10, rodA, and rodB, were significantly up-regulated at aw 0.90 compared with aw 0.95 and 0.99. The conidial regulators, brlA, abaA, and wetA were also obviously increased at aw 0.90, but the other two regulators, flbA and stuA, had no obvious variations (Figure 4B). In order to verify our results, we also investigated these genes’ expressions in other Aspergillus strains at different aw conditions. In A. flavus CA14, all AF cluster genes’ expressions were similar with A. flavus NRRL3357, but with the exception of atfB, the expression of atfA was also up-regulated in aw 0.90 compared than aw 0.99 (Figure S1). In A. flavus ACCC32656, both atfA and atfB were increased in the lower aw conditions, but the aflA and aflC were not significantly changed (Figure S1). For the conidiation, the conidial genes’ expressions were similar in different strains, while the wetA in ACC32656 were not significantly varied in diverse aw conditions.

3. Discussion

In this paper, the aw 0.90 of peanuts showed the maximum AFB1 production after 10 days cultivation (Figure 1D). Abdel-Hadi et al. found that A. flavus in peanuts would produce the maximum amounts of AFB1 at aw 0.90–0.95 after 3 weeks storage [13]. Liu et al. indicated that AFB1 levels were obviously increased in aw 0.95, followed by aw 0.90, but were suppressed in aw 0.99 [6]. The relatively low peanut aw could be suitable for AF production, and aw 0.99 could not be a proper condition for AF biosynthesis. We believed that the condition of aw 0.99 could be a stress signal for A. flavus. However, in other studies, the results could be opposite. Zhang et al. found that A. flavus produced more AFB1 in aw 0.99 than at aw 0.93 in YES medium, and Medina et al. noticed that AFB1 levels of maize were lower in aw 0.91 than 0.99 [8,9]. It seems like the suitable aw levels could be varied depending on diverse substrates. Different temperatures also influence the optimum aw for AF biosynthesis. The optimal aw for AF biosynthesis was 0.92 upon 28 °C, while it increased to 0.96 at the lower temperature [14]. Further, the effect of aw on AF production was apparently modulated by the stages of cultivation, maturity, and storage [15]. Strain-specificity is another important reason for different AF productions, such as A. flavus CA14 showing the highest AF production in aw 0.95 [6], but A. flavus NRRL3357 showing the most AF levels in aw 0.90. Taken all this, it is concluded that aw is a crucial factor for AF biosynthesis, and the effect of aw on AF production is dependent on other environmental factors, such as temperature, substrates, pH, cultivation time, and different strains. Because of the diverse experiment conditions, it is hard to get a consistent result. So, in this study, we focused our research on the regulatory mechanism of aw on AF biosynthesis.
AF cluster gene expressions are directly related to AF biosynthesis. There are some studies reporting the variations of AF gene expression in different aw. Most AF genes had higher expression levels at lower aw [6], and aflD showed higher expression at aw 0.90 [13]. In this study, we examined the transcriptional expressions of AF cluster genes by RNA-seq and RT-qPCR analyses (Table 1 and Figure 4A). The majority of genes (27/34) in AF clusters were significantly up-regulated at the relatively lower aw (90 and 95) (Table 1). These results differed from previous reports [16,17], but were similar with Liu et al. [6]. The AF biosynthetic initial-genes, aflA, aflB, aflC, and aflD, showed slight or moderate variations at different aw (Table 1 and Figure 4A). Abdel-Hadi et al. suggested the initial step gene aflD was a good indicator of AFB1 production [13]. However, in our study, aflD expressions in aw 0.95 vs. 0.99 were not significantly different, and were mildly changed in aw 0.95 vs. 0.99 and aw 0.95 vs. 0.99 (Table 1). Ehrlich suggested that the later stages of AFB1 biosynthesis were more critical than the beginning stages [18]. In our study, the AF cluster genes in medium or later stages, such as aflI, aflO, aflP, aflQ, aflK, and aflV, showed more drastic variations in different aw conditions. All the above information indicated that AF biosynthesis was influenced by different aw, especially the biosynthetic process from norsolorinic acid (NOR) to O-methylsterigmatocystin (OMST).
Transcriptions of AF biosynthetic genes are mainly regulated by the cluster-specific regulators, AflR and AflS, which directly bind to the promoter region of AF cluster genes [19]. In our research, aflR and aflS levels in A. flavus NRRL3357 and ACCC32656 showed the moderate increases at aw 0.90 vs. 0.95, while no significant variations of aflR and aflS were noticed in the other two aw comparisons (Table 1 and Figure 4A). However, in A. flavus CA14, aflR and aflS were increased in aw 0.90 compared with aw 0.99 (Figure S1), suggesting the AF cluster-specific regulators might be affected in different strains upon the diverse aw. There are also many studies that found that the ratio of aflS/aflR should have the closer correlation with AF productions [9,11,17]. However, in this research, the ratios of aflS/aflR were still similar in different aw treatments. So, the transcriptional changes of AF structural genes could not be only caused by the changes of aflR and aflS, but other regulators could play more important roles.
Furthermore, there are some papers reporting that the expressions of AF cluster genes were influenced by different environmental factors. However, few of them focused on how aw affected AF genes’ expression, and what the critical regulator response to aw is. In this study, to deeply investigate the reasons of AF gene variations in different aw, the comprehensive transcriptomic analysis was performed, and the oxidation-stress-related TFs, AtfA, AtfB, AP-1, MsnA, MtfA, and SrrA, were also examined, which could control the AF cluster gene transcriptions by directly binding [12,20,21]. However, in this study, the above TF genes, with the exception of AtfB, showed similar transcriptional expressions at different aw (Table S2 and Figure 4A). The atfB expression was significantly different in different aw conditions (Table S2 and Figure 4A), suggesting AtfB should be a key responder of aw conditions. AtfB, as a member of CREB family protein, could recognize the CRE binding sites (5′-TG/TACGTC/AA-3′), and start the target gene transcript [12]. In A. parasiticus, in the upstream noncoding regions of aflB, aflD, aflM, aflO, and aflR, were found the CRE sites, which could be directly bound by AtfB [22]. So, their transcriptional expressions were positively correlated with atfB expression. Suppression of AtfB could significantly reduce the AF genes’ mRNA levels and the AF production [23]. Similarly, in this study, significantly more down-regulation of atfB was found at aw 0.95 and 0.99 than aw 0.90; subsequently, most AF genes and AF productions also were decreased at the higher aw conditions. In recent research, AtfB was suppressed by methyl jasmonate, and subsequently, down-regulated AF gene expressions [24]. So, AtfB is a critical regulator for sensing and response to environmental changes, and then could modulate downstream genes, such as AF cluster genes in A. flavus. Additionally, we also tested the atfB expression in other Aspergillus strains, of which the atfB in A. flavus CA14 and A. flavus ACCC 32656 were significantly up-regulated in aw 0.90 (Figure S1). All these results that confirmed the differential expression of atfB in different aw treatments might play a vital role in the changes of AF genes’ expressions and AF production.
The environmental signals could be sensed by the membrane protein, transferred by the phosphorylation signal, and responded to by TFs. For example, the oxidation stresses up-regulate SAPK/MAPK signaling cascade, and then activate AtfB for binding to the target promoters [12]. In this study, sakA2 (AFLA_099500), a kinase of MAPK pathway, is slightly down-regulated in aw 0.90 vs. 0.99, suggesting it could be affected by different aw conditions (Table S2). However, we did not find other differential transcriptional expressions of MAPK genes in different aw conditions (Table S2). It could be explained that the MAPK cascade transmits the signal by phosphorylation, and the effect of different aw on MAPK genes could be at a post-transcriptional level. pkaC, an encoding cAMP-dependent protein kinase catalytic subunit, was significantly more down-regulated at aw 0.99 than at aw 0.90 and 0.95 (Table S2). The cAMP/PKA pathway can also regulate AF biosynthesis partly through AtfB [23,25], and AtfB responds to carbon sources and oxidative stress through the cAMP pathway [22]. It is a reasonable hypothesis that pkaC levels are modulated at different aw levels, and then affect AtfB expression by the cAMP signaling pathway.
In previous studies, the conidia production and conidia germination of Aspergillus strains and Penicillium strains were significantly affected by different aw levels [26,27]. We also noticed that the apparently decreased conidia production at aw 0.99 in peanuts (Figure 1C), and transcriptions of conidial genes, were also significantly decreased at aw 0.99 (Table 2 and Figure 4B). The con6 and con10, as the representatives of conidiation genes, are conserved in filamentous fungi and preferentially expressed during the conidia development [28]. In A. nidulans, conF (homologous with con6) and conJ (homologous with con10) were increased with light exposure [29]. Similarly, their expressions at different aw were obviously changed (Table 2 and Figure 4B), suggesting that con genes may be affected by diverse environmental factors. RodA and RodB, as the hydrophobin proteins, help conidia dispersion and attachment [30], and their transcriptions were also increased at the lower aw (Table 2 and Figure 4B). It is also noticed that the conidial pigment-related gene, arb2, was significantly down-regulated in aw 0.99 (Table 2). It could partly explain why the green color was faded in the higher aw conditions (Figure 1A,B).
Conidia-relevant regulators, BrlA, AbaA, VosA, and WetA, were also significantly increased in aw 0.90, and decreased in aw 0.99 (Table 2 and Figure 4B). BrlA, as the C2H2 zinc finger TF, governs the wetA and abaA expressions, and positively regulates conidia production [31]. The transcript of abaA is promoted by BrlA in the middle stages of conidia development, and involved in the differentiation and functionality of phialides [32]. Lack of AbaA leads to the decreased and aberrant conidia production [33]. wetA is regulated by AbaA during the late phase of conidia development, and plays a role in the conidial wall component biosynthesis [34]. Based on previous research, deletion of any of the three genes could interfere with the conidial genes’ expression and conidial development. In this study, few conidia were produced at aw 0.99, and conidiation-related genes were also significantly down-regulated. It is supposed that aw might regulate conidia development through the BrlA-AbaA-WetA cascade. In addition, the brlA expressions of both A. flavus CA14 and A. flavus ACCC 32656 were significantly up-regulated in lower aw, but wetA in A. flavus ACCC 32656 showed no change in different treatments (Figure S1), suggesting that other regulators might be affected by wetA expression in A. flavus ACCC 32656. VosA is also a multifunctional regulator, interacting with VelB and VelC, and controls conidial trehalose amount and conidial germination in A. fumigatus [35,36]. We also noticed significantly increased vosA expression at aw 0.90, but no obvious difference in other velvet complex genes (veA, velB, and velC). The other conidial regulators, FluG, FlbA, FlbC, FlbD, and StuA, [37], were not significantly regulated at diverse aw (Table 2 and Figure 4B). Furthermore, AtfB was positively relevant with conidia production in A. oryzae [38], suggesting AtfB could also be a conidial regulator. In this study, AF production, conidia development, as well as atfB expression, showed similar changes in diverse aw conditions, suggesting that AtfB might be a critical linker of fungal development and secondary metabolism.
Taken together, the deduced regulatory pathway of different aw effects on AF biosynthesis and conidia development were presented in Figure 5. As Figure 5 shows, different aw signals affect cellular signaling pathways by modulating the expressions of GPCRs and oxylipins genes; then, several TFs, especially AtfB, are activated by SAPK/MAPK and cAMP/PKA pathways through the multistep phosphorelay systems [12,25]; the up-regulated AtfB can directly bind to the promoter regions of AflR, AflS, and AF biosynthetic genes, and subsequently enhance AF production [12,22]. BrlA, as the central regulator of conidiation, could be up-regulated by aw 0.90, then motivate AbaA and WetA, and subsequently regulate conidial gene expressions. There are still a lot ambiguous specific regulations in this pathway, and more research is needed to clarify the regulatory mechanism of aw on AF production and A. flavus development.
For better revealing of the transcriptional regulations in different aw, we also detected the expressions of diverse TFs. Among 271 annotated TFs, 29 TFs were significantly changed, including leuB, rosA, nosA, abaA, meaB, brlA, atfB, etc. (Table 3). NosA and RosA, as the Zn(II)6Cys6 class activators, are homologous with Pro1 in Sordaria macrospora, and regulate sexual development in Aspergillus [39]. However, RosA represses sexual development in the early stage, while NosA is necessary for primordium maturation [40]. The significant increase of nosA and rosA was observed at aw 0.90 vs. 0.99, suggesting that sexual development of A. flavus may be affected by diverse aw levels. MeaB as the methylammonium-resistant protein, is involved in nitrogen metabolite repression, and positively regulates sterigmatocystin production in A. nidulans [41]. However, in A. flavus, meaB was up-regulated at the higher aw condition, and was negatively relevant with AF production (Table 3). LeuB/Leu3 participates in branched-chain amino acids biosynthesis, gdhA expression, as well as nitrogen metabolism, and physically interacts with AreA [42,43]. Moreover, by KEGG analysis, DEGs were obviously enriched in nitrogen metabolite (Figure 3). All information indicated that nitrogen metabolite of A. flavus in peanuts was also affected by diverse aw levels.

4. Conclusions

In this study, A. flavus strain NRRL3357 was inoculated in peanuts with diverse aw (0.90, 0.95, and 0.99). The changes of AFB1 yield and conidia production showed the highest level in aw 0.90, followed by aw 0.95, and the minimal level in aw 0.99. Based on transcriptome data and RT-qPCR analyses, we noticed that (1) most of the AF biosynthesis genes were more up-regulated in aw 0.90 than aw 0.95 and 0.99; (2) the initial-step AF genes were slightly or moderately changed, while the middle- or later-step genes showed drastic responses to different aw conditions; (3) several kinases, membrane proteins, and TFs were affected by different aw, and AtfB could be the central TF for regulating the transcriptional expressions of downstream genes, especially AF structural genes; (4) conidia development genes and the conidial regulator genes were up-regulated in aw 0.90; (5) sexual-development-relevant TFs, NosA and RosA, and nitrogen-metabolite-relevant TFs, MeaB and LeuB, were significantly changed at diverse aw.

5. Materials and Methods

5.1. Fungal Strain and Conidia Suspension Preparation

A. flavus NRRL3357 and ACCC32656 were kindly provided by Professor Wenbing Yin (Institute of Microbiology, Chinese Academy of Sciences, Beijing, China). A. flavus CA14 was kindly provided by Professor Shihua Wang (Fujian Agriculture and Forestry University, Fujian, China). The strains were stored at −80 °C and re-cultivated on PDA medium (200 g potato, 20 g glucose, and 20 g agar in 1 L distilled water) at 28 °C in the dark. Conidia were harvested from PDA plates after 7 days inoculation by 0.01% Tween 20, and the suspension concentration was counted by hemocytometer, and was adjusted as 107 conidia/mL.

5.2. Adjustment of Peanut Water Activities and Inoculation of A. flavus Conidia Suspension

The method of aw adjusting was followed as that by Liu et al. with some modifications. The aw levels were detected by the Aqualab 4TE (Decagon Devices, Pullman, WA, USA), and the aw curve of peanuts was performed in pre-experiment for accurately defining the amount of water added into the peanuts [6]. For adjusting the specific aw, 100 g of peanuts were put into zip-lock bags, irradiated with UV light for 2 h, and then the determined amount of water was added to them to obtain targeted aw levels (aw 0.90, 0.95, and 0.99). All treatments were placed in 4 °C overnight for the stable aw levels.
Then these treated peanuts were transferred into the 500 mL sterile flasks, and incubated in 10 mL of the 107 conidia/mL conidia suspension. Fungi in different aw levels were cultivated at 28 °C for 10 days in the polyethylene boxes, which contained the glycerol-water solution for maintaining the relatively constant humidity. Peanut kernels without inoculating conidia suspension were prepared as a negative control. Each flask was shaken once a day. Three biological replicates were performed for all treatments.

5.3. Conidia Assessment and AFB1 Detection

After 10 days cultivation, 25 g of inoculated peanuts with different aw were added 100 mL sterilized H2O, fiercely shaken for 30 min, filtered with non-woven fabric, and conidia of the solution was counted by a hemocytometer.
AFB1 concentration was detected by HPLC analysis. An amount of 25 g of peanut samples were finely grounded, 125 mL 70% methanol water and 5 g NaCl were added, and fiercely vibrated for 30 min. AFB1 extractions was purified by ToxinFast immunoaffinity columns as per the manufacturer’s instructions (Huaan Magnech Biotech, Beijing, China), and were examined by an Agilent 1220 Infinity Ⅱ HPLC system coupled with a fluorescence detector and a post-column derivation system (Huaan Magnech Biotech, Beijing, China). The excitation wavelength was 360 nm, and the emission wavelength was 430 nm. The HPLC system was matched with the Agilent TC-C18 column (250 mm × 4.6 mm, 5 μm particle size, Agilent). An amount of 20 μL AFB1 samples were injected each time, 70% methanol solution was the mobile phase, and the retention time was about 5.7 min. AFB1 standards were purchased from Sigma-Aldrich (St. Louis, MO, USA).

5.4. Total RNA Extraction

RNA samples for transcriptome analysis and RT-qPCR were performed three times by replications. Mycelia were harvested from the inoculated peanuts’ seed coats after 10 days cultivation. An amount of 1 g samples (the mixture of peanut seed coat and A. flavus mycelia) were grounded to powder after treated by liquid nitrogen, then 600 μL lysis buffer was added, and then the RNA was extracted as per the manufacturer’s instructions (Aidlab, Beijing, China). Genomic DNA was removed by DNase I (Takara, Dalian, China), and RNA quality was evaluated by NanoDrop 2000 spectrophotometer (Thermo Fisher, Waltham, MA, USA) and Agilent 2100 Bioanalyzer (Agilent, Santa Clara, CA, USA).

5.5. RNA Sequencing and Transcriptome Processing

The mRNA was sequenced by Novogene (Beijing, China). Briefly, mRNA was purified from total RNA with oligo-dT magnetic beads. The non-strand-specific libraries were constructed by NEB Next UltraTM RNA Library Prep Kit for Illumina (NEB, USA), and sequenced by the Illumina Hiseq 4000 platform (Illumina Inc., San Diego, CA, USA). Clean reads were harvested by removing the low-quality reads and adaptor, and then mapped to the reference genome (BioProject: PRJNA13284) with HISAT 1.31 [44]. The read counts were used to assess genes’ transcriptions [45]. The differentially expressed genes (DEGs) were evaluated with padj ≤ 0.05 and log2ratio ≥ 1 or ≤1. The Gene Ontology (GO) functional analysis and Kyoto Encyclopedia of Genes and Genomes (KEGG) pathway analysis of DEGs were performed with the FungiFun and KAAS, respectively [46,47].

5.6. RT-qPCR Analysis

Total RNA was used for reverse transcription, and cDNA synthesis was with a two-step cDNA synthesis kit (TaKaRa, Dalian, China). The Analytic Jena Q-tower system (Analytik-Jena, Jena, Germany) was used for qPCR assays with the 20 μL reaction system, including 5 μL cDNA product, 0.5 μL of each primer, and 10 μL SYBR Green mix (TaKaRa, Dalian, China). All primers are listed in Table S2. The qPCR program was settled as before, which is one cycle of 3 min at 95 °C followed by 40 cycles of 10 s at 95 °C and 40 s at 65 °C, and the melting curve was analyzed from 60 °C to 90 °C with 0.5 °C incremental increases. The internal reference was used with actin. The transcriptional expression was based on the CT value, and the differences were calculated with the 2−ΔΔCT method.

5.7. Statistical Analysis

Three biological replicates were performed for all experiments. The means with standard deviations represented the results. AFB1 yields and conidia productions in different treatments were calculated with one-way analysis of variance (ANOVA) by SPSS 18.0, and statistical differences were evaluated by Tukey’s test with p < 0.05. Student’s t test was applied in RT-qPCR with * p < 0.05 and ** p < 0.01.

Supplementary Materials

The following are available online at https://0-www-mdpi-com.brum.beds.ac.uk/article/10.3390/toxins13060431/s1, Figure S1: Transcriptional expression analyses of diverse genes by RT-qPCR, Table S1: Comparisons of several global regulators in different aw by transcriptome analysis, Table S2: Primers used for qPCR analysis.

Author Contributions

Conceptualization, X.Y.; data curation, Q.Y.; formal analysis, C.N.; funding acquisition, Y.L. and Y.Z.; investigation, X.L., X.M. and Q.Y.; project administration, X.Y.; resources, Q.Y., Y.L., Y.Z. and F.X.; supervision, F.X.; validation, X.M.; writing—original draft, L.M. and X.L.; Writing—review & editing, X.L. All authors have read and agreed to the published version of the manuscript.

Funding

This research was funded by National Natural Science Foundation of China (32001813 and 31972179), Qingdao Science and Technology Benefit the People Demonstration and Guidance Special Project (21-1-4-NY-4-NSH), Key R&D Program of Zhangjiakou (19120002D), and National Agricultural Science and Technology Innovation Program (CAAS-ASTIP-2021-IFST).

Institutional Review Board Statement

Not applicable.

Informed Consent Statement

Not applicable.

Data Availability Statement

All data are provided in the manuscript.

Conflicts of Interest

The authors declare no conflict of interest.

References

  1. Zhang, F.; Zhong, H.; Han, X.; Guo, Z.; Yang, W.; Liu, Y.; Yang, K.; Zhuang, Z.; Wang, S. Proteomic profile of Aspergillus flavus in response to water activity. Fungal Biol. 2015, 119, 114–124. [Google Scholar] [CrossRef]
  2. Ren, Y.; Jin, J.; Zheng, M.; Yang, Q.; Xing, F. Ethanol Inhibits Aflatoxin B(1) Biosynthesis in Aspergillus flavus by Up-Regulating Oxidative Stress-Related Genes. Front. Microbiol. 2019, 10, 2946. [Google Scholar] [CrossRef] [Green Version]
  3. Wu, F. Perspective: Time to face the fungal threat. Nature 2014, 516, S7. [Google Scholar] [CrossRef] [PubMed]
  4. Abdel-Hadi, A.; Schmidt-Heydt, M.; Parra, R.; Geisen, R.; Magan, N. A systems approach to model the relationship between aflatoxin gene cluster expression, environmental factors, growth and toxin production by Aspergillus flavus. J. R. Soc. Interface 2012, 9, 757–767. [Google Scholar] [CrossRef] [Green Version]
  5. Tai, B.; Chang, J.; Liu, Y.; Xing, F. Recent progress of the effect of environmental factors on Aspergillus flavus growth and aflatoxins production on foods. Food Qual. Saf. 2020, 4, 21–28. [Google Scholar] [CrossRef]
  6. Liu, X.; Guan, X.; Xing, F.; Lv, C.; Dai, X.; Liu, Y. Effect of water activity and temperature on the growth of Aspergillus flavus, the expression of aflatoxin biosynthetic genes and aflatoxin production in shelled peanuts. Food Control. 2017, 82, 325–332. [Google Scholar] [CrossRef]
  7. Passamani, F.R.; Hernandes, T.; Lopes, N.A.; Bastos, S.C.; Santiago, W.D.; Cardoso, M.; Batista, L.R. Effect of temperature, water activity, and pH on growth and production of ochratoxin A by Aspergillus niger and Aspergillus carbonarius from Brazilian grapes. J. Food Prot. 2014, 77, 1947–1952. [Google Scholar] [CrossRef] [PubMed]
  8. Medina, A.; Gilbert, M.K.; Mack, B.M.; GR, O.B.; Rodríguez, A.; Bhatnagar, D.; Payne, G.; Magan, N. Interactions between water activity and temperature on the Aspergillus flavus transcriptome and aflatoxin B(1) production. Int. J. Food Microbiol. 2017, 256, 36–44. [Google Scholar] [CrossRef] [PubMed] [Green Version]
  9. Zhang, F.; Guo, Z.; Zhong, H.; Wang, S.; Yang, W.; Liu, Y.; Wang, S. RNA-Seq-based transcriptome analysis of aflatoxigenic Aspergillus flavus in response to water activity. Toxins 2014, 6, 3187–3207. [Google Scholar] [CrossRef] [PubMed] [Green Version]
  10. Yu, J. Current understanding on aflatoxin biosynthesis and future perspective in reducing aflatoxin contamination. Toxins 2012, 4, 1024–1057. [Google Scholar] [CrossRef] [Green Version]
  11. Yu, J.; Fedorova, N.D.; Montalbano, B.G.; Bhatnagar, D.; Cleveland, T.E.; Bennett, J.W.; Nierman, W.C. Tight control of mycotoxin biosynthesis gene expression in Aspergillus flavus by temperature as revealed by RNA-Seq. FEMS Microbiol. Lett. 2011, 322, 145–149. [Google Scholar] [CrossRef] [PubMed] [Green Version]
  12. Hong, S.Y.; Roze, L.V.; Linz, J.E. Oxidative stress-related transcription factors in the regulation of secondary metabolism. Toxins 2013, 5, 683–702. [Google Scholar] [CrossRef] [Green Version]
  13. Abdel-Hadi, A.; Carter, D.; Magan, N. Temporal monitoring of the nor-1 (aflD) gene of Aspergillus flavus in relation to aflatoxin B₁ production during storage of peanuts under different water activity levels. J. Appl. Microbiol. 2010, 109, 1914–1922. [Google Scholar] [CrossRef] [PubMed] [Green Version]
  14. Lv, C.; Jin, J.; Wang, P.; Dai, X.; Liu, Y.; Zheng, M.; Xing, F. Interaction of water activity and temperature on the growth, gene expression and aflatoxin production by Aspergillus flavus on paddy and polished rice. Food Chem. 2019, 293, 472–478. [Google Scholar] [CrossRef]
  15. Peromingo, B.; Rodríguez, A.; Bernáldez, V.; Delgado, J.; Rodríguez, M. Effect of temperature and water activity on growth and aflatoxin production by Aspergillus flavus and Aspergillus parasiticus on cured meat model systems. Meat Sci. 2016, 122, 76–83. [Google Scholar] [CrossRef] [PubMed]
  16. Gallo, A.; Solfrizzo, M.; Epifani, F.; Panzarini, G.; Perrone, G. Effect of temperature and water activity on gene expression and aflatoxin biosynthesis in Aspergillus flavus on almond medium. Int. J. Food Microbiol. 2016, 217, 162–169. [Google Scholar] [CrossRef]
  17. Schmidt-Heydt, M.; Abdel-Hadi, A.; Magan, N.; Geisen, R. Complex regulation of the aflatoxin biosynthesis gene cluster of Aspergillus flavus in relation to various combinations of water activity and temperature. Int. J. Food Microbiol. 2009, 135, 231–237. [Google Scholar] [CrossRef] [PubMed] [Green Version]
  18. Ehrlich, K.C. Predicted roles of the uncharacterized clustered genes in aflatoxin biosynthesis. Toxins 2009, 1, 37–58. [Google Scholar] [CrossRef] [PubMed] [Green Version]
  19. Yu, J.; Chang, P.K.; Ehrlich, K.C.; Cary, J.W.; Bhatnagar, D.; Cleveland, T.E.; Payne, G.A.; Linz, J.E.; Woloshuk, C.P.; Bennett, J.W. Clustered pathway genes in aflatoxin biosynthesis. Appl. Environ. Microbiol. 2004, 70, 1253–1262. [Google Scholar] [CrossRef] [Green Version]
  20. Caceres, I.; El Khoury, R.; Bailly, S.; Oswald, I.P.; Puel, O.; Bailly, J.D. Piperine inhibits aflatoxin B1 production in Aspergillus flavus by modulating fungal oxidative stress response. Fungal Genet Biol. 2017, 107, 77–85. [Google Scholar] [CrossRef]
  21. Zhuang, Z.; Lohmar, J.M.; Satterlee, T.; Cary, J.W.; Calvo, A.M. The Master Transcription Factor mtfA Governs Aflatoxin Production, Morphological Development and Pathogenicity in the Fungus Aspergillus flavus. Toxins 2016, 8, 29. [Google Scholar] [CrossRef] [PubMed]
  22. Roze, L.V.; Chanda, A.; Wee, J.; Awad, D.; Linz, J.E. Stress-related transcription factor AtfB integrates secondary metabolism with oxidative stress response in aspergilli. J. Biol. Chem. 2011, 286, 35137–35148. [Google Scholar] [CrossRef] [PubMed] [Green Version]
  23. Wee, J.; Hong, S.Y.; Roze, L.V.; Day, D.M.; Chanda, A.; Linz, J.E. The Fungal bZIP Transcription Factor AtfB Controls Virulence-Associated Processes in Aspergillus parasiticus. Toxins 2017, 9, 287. [Google Scholar] [CrossRef] [PubMed] [Green Version]
  24. Li, X.; Ren, Y.; Jing, J.; Jiang, Y.; Yang, Q.; Luo, S.; Xing, F. The inhibitory mechanism of methyl jasmonate on Aspergillus flavus growth and aflatoxin biosynthesis and two novel transcription factors are involved in this action. Food Res. Int. 2021, 140, 110051. [Google Scholar] [CrossRef] [PubMed]
  25. Roze, L.V.; Miller, M.J.; Rarick, M.; Mahanti, N.; Linz, J.E. A novel cAMP-response element, CRE1, modulates expression of nor-1 in Aspergillus parasiticus. J. Biol. Chem. 2004, 279, 27428–27439. [Google Scholar] [CrossRef] [PubMed] [Green Version]
  26. Long, N.; Vasseur, V.; Coroller, L.; Dantigny, P.; Rigalma, K. Temperature, water activity and pH during conidia production affect the physiological state and germination time of Penicillium species. Int. J. Food Microbiol. 2017, 241, 151–160. [Google Scholar] [CrossRef]
  27. Pardo, E.; Lagunas, U.; Sanchis, V.; Ramos, A.J.; Marín, S. Influence of water activity and temperature on conidial germination and mycelial growth of ochratoxigenic isolates of Aspergillus ochraceus on grape juice synthetic medium. Predictive models. J. Sci. Food Agric. 2005, 85, 1681–1686. [Google Scholar] [CrossRef]
  28. Olmedo, M.; Ruger-Herreros, C.; Luque, E.M.; Corrochano, L.M. A complex photoreceptor system mediates the regulation by light of the conidiation genes con-10 and con-6 in Neurospora crassa. Fungal Genet Biol. 2010, 47, 352–363. [Google Scholar] [CrossRef]
  29. Suzuki, S.; Sarikaya Bayram, Ö.; Bayram, Ö.; Braus, G.H. conF and conJ contribute to conidia germination and stress response in the filamentous fungus Aspergillus nidulans. Fungal Genet Biol. 2013, 56, 42–53. [Google Scholar] [CrossRef] [Green Version]
  30. Pedersen, M.H.; Borodina, I.; Moresco, J.L.; Svendsen, W.E.; Frisvad, J.C.; Søndergaard, I. High-yield production of hydrophobins RodA and RodB from Aspergillus fumigatus in Pichia pastoris. Appl. Microbiol. Biotechnol. 2011, 90, 1923–1932. [Google Scholar] [CrossRef]
  31. Twumasi-Boateng, K.; Yu, Y.; Chen, D.; Gravelat, F.N.; Nierman, W.C.; Sheppard, D.C. Transcriptional profiling identifies a role for BrlA in the response to nitrogen depletion and for StuA in the regulation of secondary metabolite clusters in Aspergillus fumigatus. Eukaryot Cell 2009, 8, 104–115. [Google Scholar] [CrossRef] [PubMed] [Green Version]
  32. Sewall, T.C.; Mims, C.W.; Timberlake, W.E. abaA controls phialide differentiation in Aspergillus nidulans. Plant Cell 1990, 2, 731–739. [Google Scholar] [CrossRef] [PubMed] [Green Version]
  33. Andrianopoulos, A.; Timberlake, W.E. The Aspergillus nidulans abaA gene encodes a transcriptional activator that acts as a genetic switch to control development. Mol. Cell. Biol. 1994, 14, 2503–2515. [Google Scholar] [CrossRef] [PubMed] [Green Version]
  34. Marshall, M.A.; Timberlake, W.E. Aspergillus nidulans wet A activates spore-specific gene expression. Mol. Cell. Biol. 1991, 11, 55–62. [Google Scholar] [CrossRef] [PubMed] [Green Version]
  35. Park, H.S.; Nam, T.Y.; Han, K.H.; Kim, S.C.; Yu, J.H. VelC positively controls sexual development in Aspergillus nidulans. PLoS ONE 2014, 9, e89883. [Google Scholar] [CrossRef] [Green Version]
  36. Park, H.S.; Bayram, O.; Braus, G.H.; Kim, S.C.; Yu, J.H. Characterization of the velvet regulators in Aspergillus fumigatus. Mol. Microbiol. 2012, 86, 937–953. [Google Scholar] [CrossRef]
  37. Ni, M.; Yu, J.H. A novel regulator couples sporogenesis and trehalose biogenesis in Aspergillus nidulans. PLoS ONE 2007, 2, e970. [Google Scholar] [CrossRef] [Green Version]
  38. Sakamoto, K.; Arima, T.H.; Iwashita, K.; Yamada, O.; Gomi, K.; Akita, O. Aspergillus oryzae atfB encodes a transcription factor required for stress tolerance in conidia. Fungal Genet Biol. 2008, 45, 922–932. [Google Scholar] [CrossRef]
  39. Vienken, K.; Fischer, R. The Zn(II)2Cys6 putative transcription factor NosA controls fruiting body formation in Aspergillus nidulans. Mol. Microbiol. 2006, 61, 544–554. [Google Scholar] [CrossRef]
  40. Soukup, A.A.; Farnoodian, M.; Berthier, E.; Keller, N.P. NosA, a transcription factor important in Aspergillus fumigatus stress and developmental response, rescues the germination defect of a laeA deletion. Fungal Genet Biol. 2012, 49, 857–865. [Google Scholar] [CrossRef] [Green Version]
  41. Wong, K.H.; Hynes, M.J.; Todd, R.B.; Davis, M.A. Transcriptional control of nmrA by the bZIP transcription factor MeaB reveals a new level of nitrogen regulation in Aspergillus nidulans. Mol. Microbiol. 2007, 66, 534–551. [Google Scholar] [CrossRef] [PubMed]
  42. Downes, D.J.; Davis, M.A.; Kreutzberger, S.D.; Taig, B.L.; Todd, R.B. Regulation of the NADP-glutamate dehydrogenase gene gdhA in Aspergillus nidulans by the Zn(II)2Cys6 transcription factor LeuB. Microbiology 2013, 159, 2467–2480. [Google Scholar] [CrossRef] [PubMed] [Green Version]
  43. Polotnianka, R.; Monahan, B.J.; Hynes, M.J.; Davis, M.A. TamA interacts with LeuB, the homologue of Saccharomyces cerevisiae Leu3p, to regulate gdhA expression in Aspergillus nidulans. Mol. Genet Genom. 2004, 272, 452–459. [Google Scholar] [CrossRef] [PubMed]
  44. Kim, D.; Langmead, B.; Salzberg, S.L. HISAT: A fast spliced aligner with low memory requirements. Nat. Methods 2015, 12, 357–360. [Google Scholar] [CrossRef] [PubMed] [Green Version]
  45. Trapnell, C.; Williams, B.A.; Pertea, G.; Mortazavi, A.; Kwan, G.; van Baren, M.J.; Salzberg, S.L.; Wold, B.J.; Pachter, L. Transcript assembly and quantification by RNA-Seq reveals unannotated transcripts and isoform switching during cell differentiation. Nat. Biotechnol. 2010, 28, 511–515. [Google Scholar] [CrossRef] [PubMed] [Green Version]
  46. Priebe, S.; Linde, J.; Albrecht, D.; Guthke, R.; Brakhage, A.A. FungiFun: A web-based application for functional categorization of fungal genes and proteins. Fungal Genet Biol. 2011, 48, 353–358. [Google Scholar] [CrossRef] [PubMed]
  47. Kanehisa, M.; Araki, M.; Goto, S.; Hattori, M.; Hirakawa, M.; Itoh, M.; Katayama, T.; Kawashima, S.; Okuda, S.; Tokimatsu, T.; et al. KEGG for linking genomes to life and the environment. Nucleic Acids Res. 2008, 36, D480–D484. [Google Scholar] [CrossRef] [PubMed]
Figure 1. The differences of AFB1 yield and conidia production in peanuts in different aw. (A) The inoculated peanuts with different aw were placed in flasks for 10 days’ cultivation, and (B) 25 g treated peanuts were used for AFB1 detection and conidia examination. (C) A. flavus conidia from peanuts were counted by hemocytometer, and (D) AFB1 levels in different aw peanuts were detected by HPLC. All experiments were performed in three independent biological replicates, and results were represented as means ± SD. Samples marked with different letters show a significant difference at p < 0.05.
Toxins 13 00431 g001
Figure 2. Transcriptomic analyses of Aspergillus flavus in different aw. The volcano plots of the pairwise comparisons in (A) aw 0.90 vs. 0.95, (B) aw 0.90 vs. 0.99, and (C) aw 0.95 vs. 0.99. Up-regulated and down-regulated genes were showed with red spots and blue spots, respectively, and no significantly changed genes were presented with black spots. (D) Cluster analysis of DEGs in diverse aw. Up-regulated and down-regulated genes were represented in red and blue, respectively. The transcriptomic analyses were performed in three independent biological replicates.
Toxins 13 00431 g002
Figure 3. GO annotation and KEGG enrichment of DEGs in different aw. Bar charts demonstrated the GO-enriched results in comparisons of (A) aw 0.90 vs. 0.95, (B) aw 0.90 vs. 0.99, and (C) aw 0.95 vs. 0.99. The number of enriched genes and the names of GO terms are showed in X-axis and Y-axis, respectively. Biological process, cellular components, and molecular function were represented by the green bars, orange bars, and blue bars, respectively. The top 20 enriched KEGG pathways were showed in (D) aw 0.90 vs. 0.95, (E) aw 0.90 vs. 0.99, and (F) aw 0.95 vs. 0.99. The rich factors and the pathway names are showed in X-axis and Y-axis, respectively. The size of spots represented the number of enriched genes, and different colors described the q-value.
Toxins 13 00431 g003
Figure 4. Transcriptional expression analyses of diverse genes by RT-qPCR. The RT-qPCR analysis of (A) AF biosynthesis-related genes and (B) conidia developmental genes in different aw conditions. The different aw comparisons were showed as diverse bars. Three independent biological replicates were performed in each condition, and data were presented as means ± SD. t tests were applied for significance analyses with * p < 0.05 and ** p < 0.01.
Toxins 13 00431 g004
Figure 5. Hypothetical regulatory mechanism of aw on AF biosynthesis and conidia development. The confirmed regulatory pathway and deduced regulatory pathway were presented as solid lines and dashed lines, respectively. TFs stands for transcription factors.
Toxins 13 00431 g005
Table 1. Comparisons of AF biosynthesis cluster genes in different aw by transcriptome analysis.
Gene_ID
(AFLA_)
GeneGene FunctionLog2 (90/95)Log2 (90/99)Log2 (95/99)
139100aflYeSer-Thr protein phosphatase family protein−0.45−1.21−0.78
139110aflYdsugar regulator−0.86−0.330.50
139120aflYcglucosidase−0.42−0.59−0.19
139130aflYbputative hexose transporter−0.13−0.59−0.48
139140aflYaNADH oxidase3.94 *4.05 *0.09
139150aflYhypothetical protein4.96 *5.20 *0.24
139160aflXmonooxygenase4.58 *5.92 *1.33
139170aflWmonooxygenase4.42 *6.23 *1.81 *
139180aflVcytochrome P450 monooxygenase5.33 *12.53 *7.18 *
139190aflKVERB synthase4.79 *11.23 *6.43 *
139200aflQcytochrome P450 monooxigenase5.14 *11.79 *6.65 *
139210aflPO-methyltransferase A5.05 *11.05 *5.99 *
139220aflOO-methyltransferase B5.03 *12.05 *10.83 *
139230aflIcytochrome P450 monooxigenase6.21 *13.05 *6.95 *
139240aflLahypothetical protein5.40 *14.05 *8.11 *
139250aflLP450 monooxygenase4.73 *13.77 *9.03 *
139260aflGcytochrome P450 monooxygenase4.22 *6.17 *1.94 *
139270aflNahypothetical protein0.831.320.48
139280aflNmonooxygenase4.05*7.46 *3.39 *
139290aflMahypothetical protein4.30 *9.85 *5.53 *
139300aflMketoreductase4.53 *12.29 *7.74 *
139310aflENOR reductase4.34 *7.97 *3.63 *
139320aflJesterase4.06 *6.95 *2.89 *
139330aflHshort chain alcohol dehydrogenase3.64 *5.06 *1.41
139340aflSpathway regulator0.543.51 *0.96
139360aflRtranscription activator0.431.82 *1.37
139370aflBfatty acid synthase beta subunit1.222.59 *1.36
139380aflAfatty acid synthase alpha subunit1.732.06 *0.31
139390aflDreductase3.35 *3.73 *0.37
139400aflCahypothetical protein4.19 *4.46 *0.26
139410aflCpolyketide synthase2.85 *2.73 *−0.14
139420aflTtransmembrane protein−0.100.220.31
139430aflUP450 monooxygenase−0.830.150.96
139440aflFdehydrogenase−0.61−0.160.44
Transcriptome analyses were performed in three biological replicates. Data were calculated with read counts. The values 90/95, 90/99, and 95/99 represented the comparisons of aw 0.90 vs. 0.95, aw 0.90 vs. 0.99, and aw 0.95 vs. 0.99, respectively. Significances were marked as * with padj < 0.05 and log2ratio ≥ 1 or ≤1.
Table 2. Comparisons of conidia-development-related genes in different aw by transcriptome analysis.
Gene_ID
(AFLA_)
Gene AnnotationLog2 (90/95)Log2 (90/99)Log2 (95/99)
044790conidiation-specific family protein0.423.54 *3.11 *
044800conidiation protein Con6, putative3.18 *8.32 *5.13 *
083110conidiation-specific protein (Con10), putative2.78 *6.32 *3.54 *
098380conidial hydrophobin RodA/RolA6.49 *8.68 *2.18 *
014260conidial hydrophobin RodB/HypB3.21 *3.10 *−0.13
006180conidial pigment biosynthesis oxidase Arb2/brown25.76 *6.39 *0.61
016140conidial pigment biosynthesis scytalone dehydratase Arp1−1.57−1.47−0.08
079710conidiophore development protein HymA−0.010.880.87
082850C2H2 type conidiation transcription factor BrlA3.62 *5.90 *2.27 *
029620transcription factor AbaA4.19 *2.52 *−1.69
134030developmental regulator FlbA−0.11−1.10−1.01
137320C2H2 conidiation transcription factor FlbC−1.101.121.21
080170MYB family conidiophore development protein FlbD−0.60−0.870.28
026900developmental regulator VosA2.45 *1.42 *−1.05
046990APSES transcription factor StuA0.241.070.81
052030developmental regulatory protein WetA2.10 *2.60 *0.48
101920extracellular developmental signal biosynthesis protein FluG0.060.400.32
Transcriptome analyses were performed in three biological replicates. Data were calculated with read counts. The values of 90/95, 90/99, and 95/99 represented the comparisons of aw 0.90 vs. 0.95, aw 0.90 vs. 0.99, and aw 0.95 vs. 0.99, respectively. Significances were marked as * with padj < 0.05 and log2ratio ≥ 1 or ≤1.
Table 3. Comparisons of different TFs in different aw by transcriptome analysis.
Gene ID
(AFLA_)
Gene Descriptionlog2 (90/95)log2 (90/99)log2 (95/99)
013240C6 transcription factor, putative−2.41−2.10 *0.30
015790C6 transcription factor (Leu3), putative0.191.96 *1.74
021930C6 transcription factor RosA0.531.74 *1.19
023040C6 transcription factor, putative−3.02−4.27 *−1.25
025720C6 transcription factor NosA2.462.46 *2.21 *
029620transcription factor AbaA4.19 *2.52 *−1.69
030580C2H2 transcription factor PacC, putative−0.50−2.02 *−1.53
031790bZIP transcription factor (MeaB), putative−0.56−1.80 *−1.26
033480C6 transcription factor, putative1.021.85 *0.81
035590C6 transcription factor, putative−0.162.75 *2.25
040300C6 transcription factor, putative2.36 *2.750.37
051900zinc knuckle transcription factor (CnjB), putative0.482.73 *2.23
056780C6 transcription factor, putative−0.84−2.27 *−1.44
059510fungal specific transcription factor, putative−0.95−1.76 *−0.84
070970C6 transcription factor, putative0.601.61 *1.00
074200C6 transcription factor, putative−0.76−1.90 *−1.16
076320C6 transcription factor, putative1.242.61 *1.35
078500bZIP transcription factor, putative0.922.65 *1.72
082850C2H2 type conidiation transcription factor BrlA3.62 *5.90 *2.27 *
083460C6 transcription factor RosA-like, putative−1.64−1.91 *−0.28
083560C6 transcription factor, putative0.722.01 *1.28
084720C6 transcription factor, putative0.682.56 *1.87
085880BTB domain transcription factor, putative1.141.42 *0.27
087810bZIP transcription factor, putative0.512.69 *2.17
094010bZIP transcription factor (Atf21), putative1.063.69 *2.60 *
095090C6 transcription factor, putative1.875.79 *3.90
109220C6 transcription factor, putative0.771.95 *1.16
Novel00457fungal specific transcription factor [Aspergillus oryzae RIB40]1.72 *2.25 *−0.52
Novel00611transcription factor [Aspergillus oryzae RIB40]−1.08−3.22 *−2.16
Transcriptome analyses were performed in three biological replicates. Data were calculated with read counts. The values of 90/95, 90/99, and 95/99 represented the comparisons of aw 0.90 vs. 0.95, aw 0.90 vs. 0.99, and aw 0.95 vs. 0.99, respectively. Significances were marked as * with padj < 0.05 and log2ratio ≥ 1 or ≤1.
Publisher’s Note: MDPI stays neutral with regard to jurisdictional claims in published maps and institutional affiliations.

