Evaluation of Inner Exposure of Horses to Zearalenone (ZEN), Deoxynivalenol (DON) and Their Metabolites in Relation to Colic and Health-Related Clinical-Chemical Traits

 ,
,  , , ,
, , ,
Abstract
:1. Introduction
2. Results
2.1. Screening
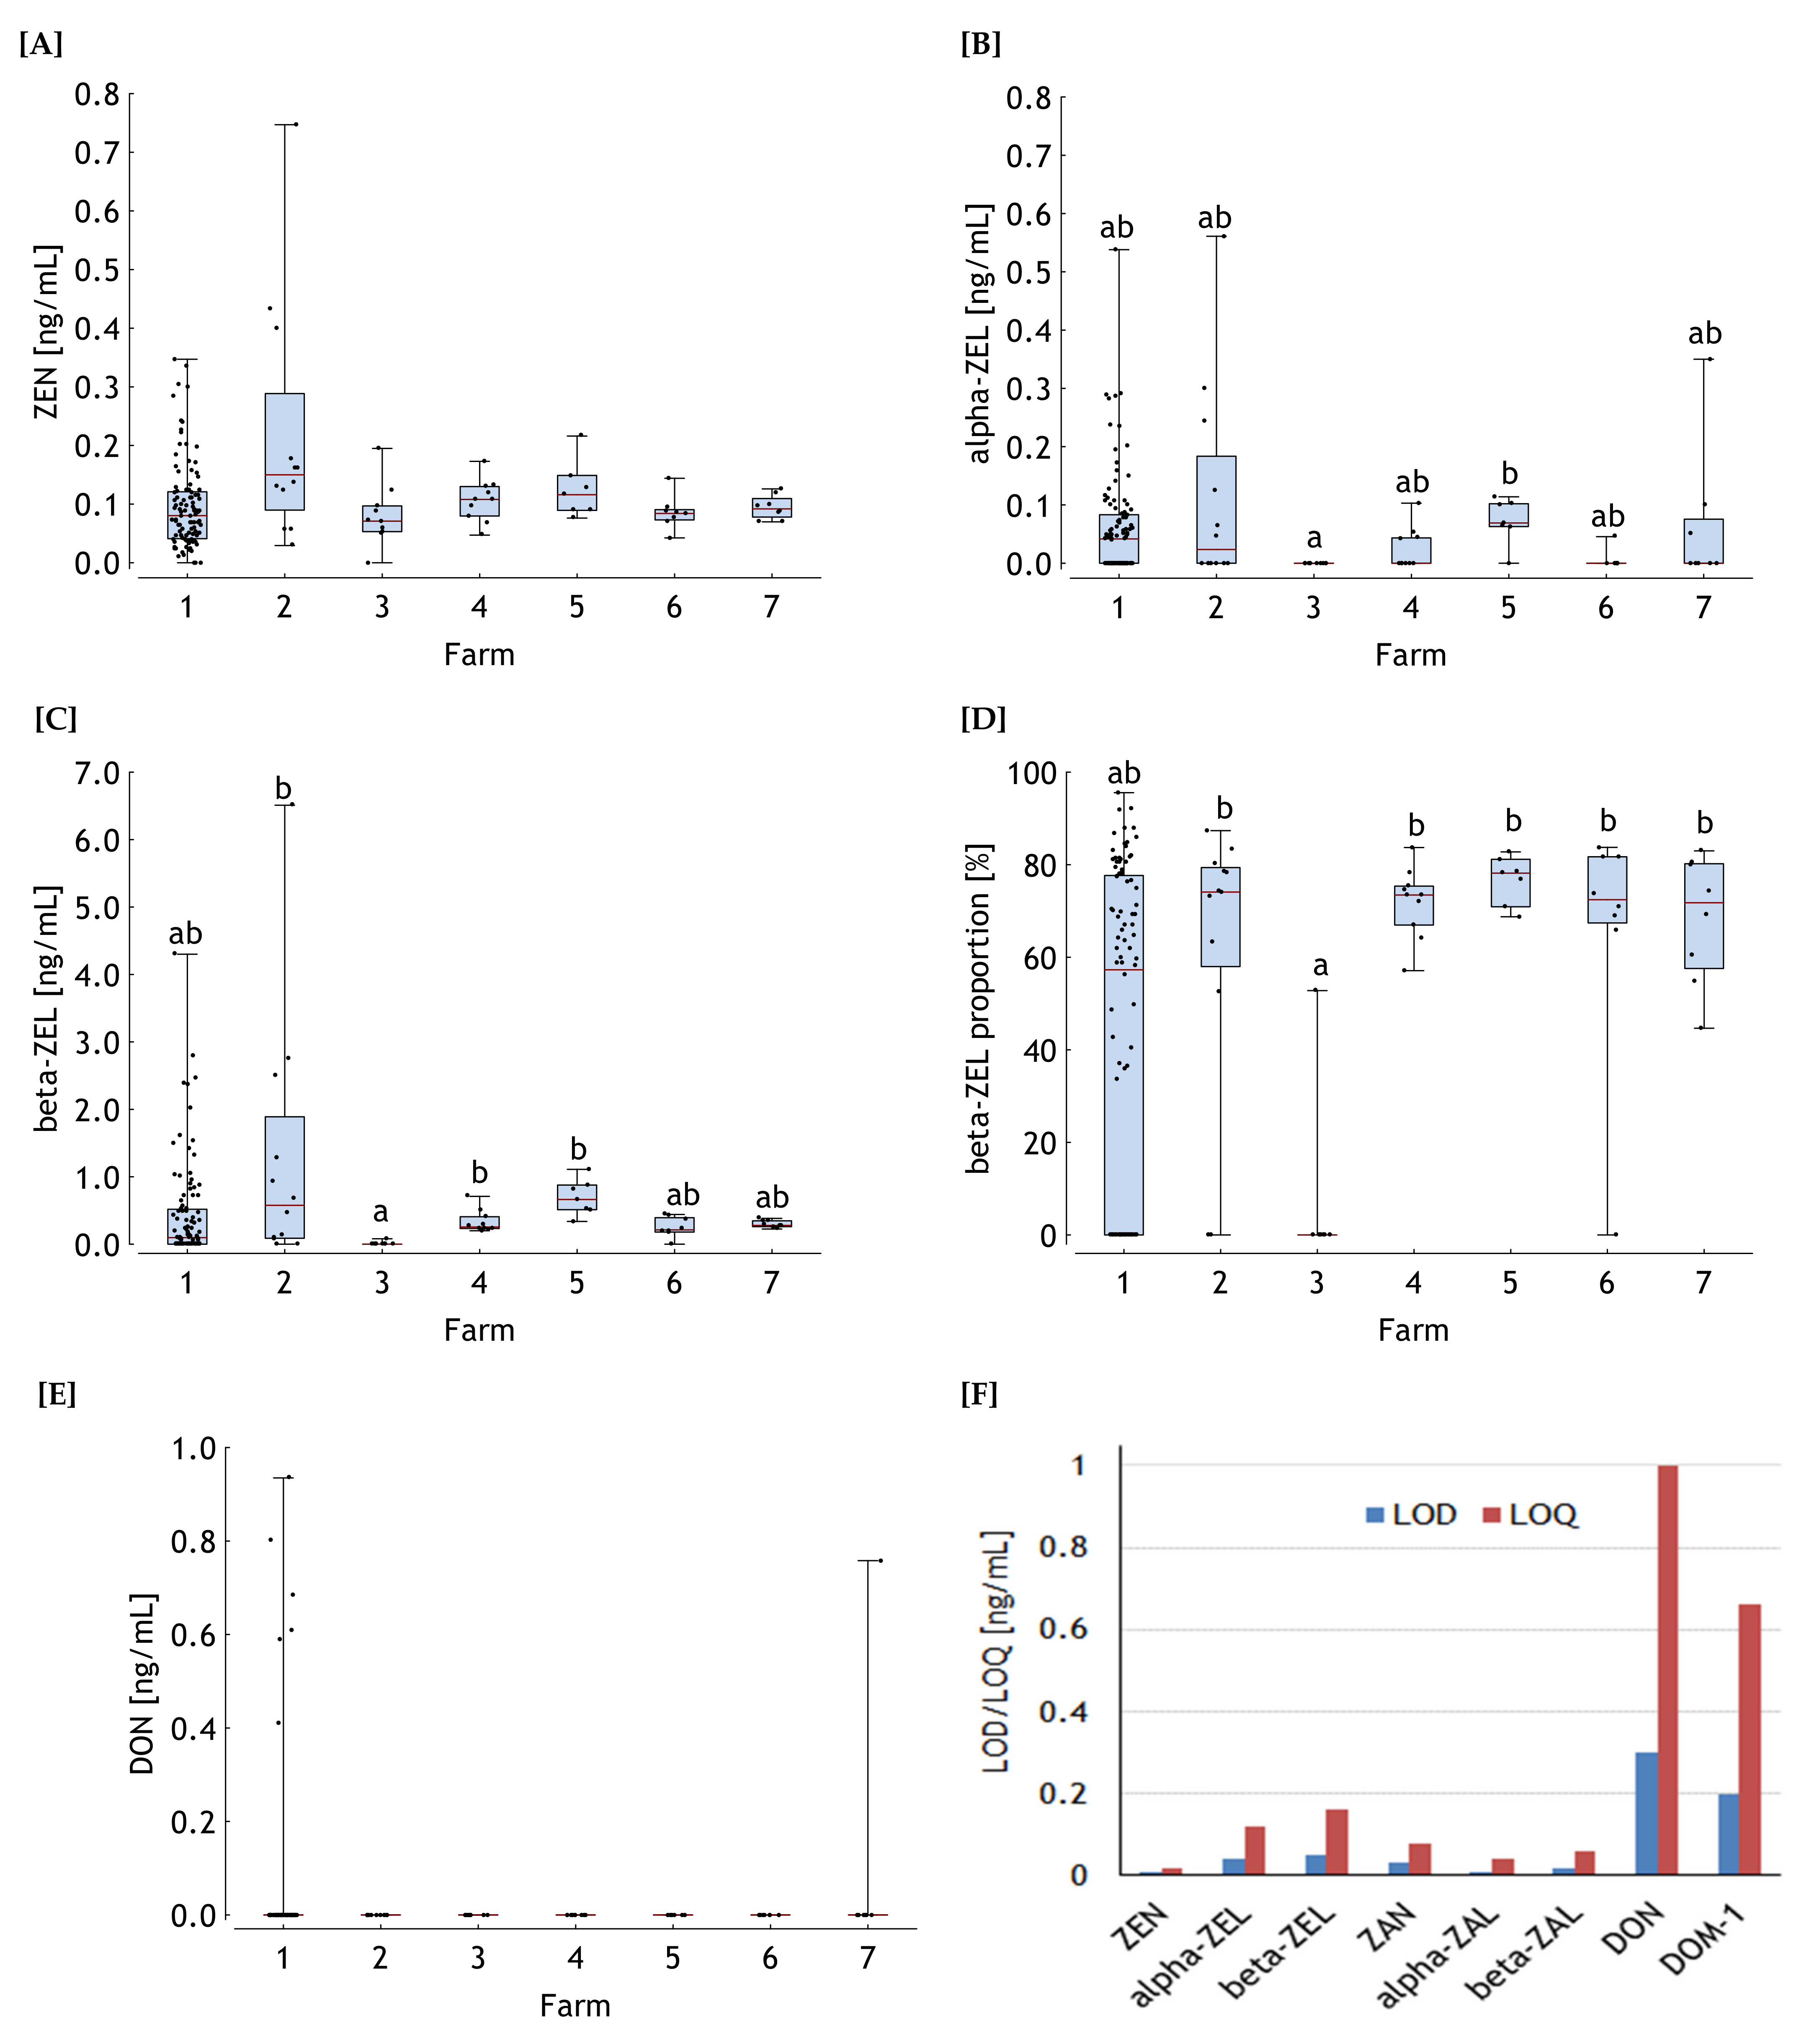
2.1.1. Mycotoxin Residues
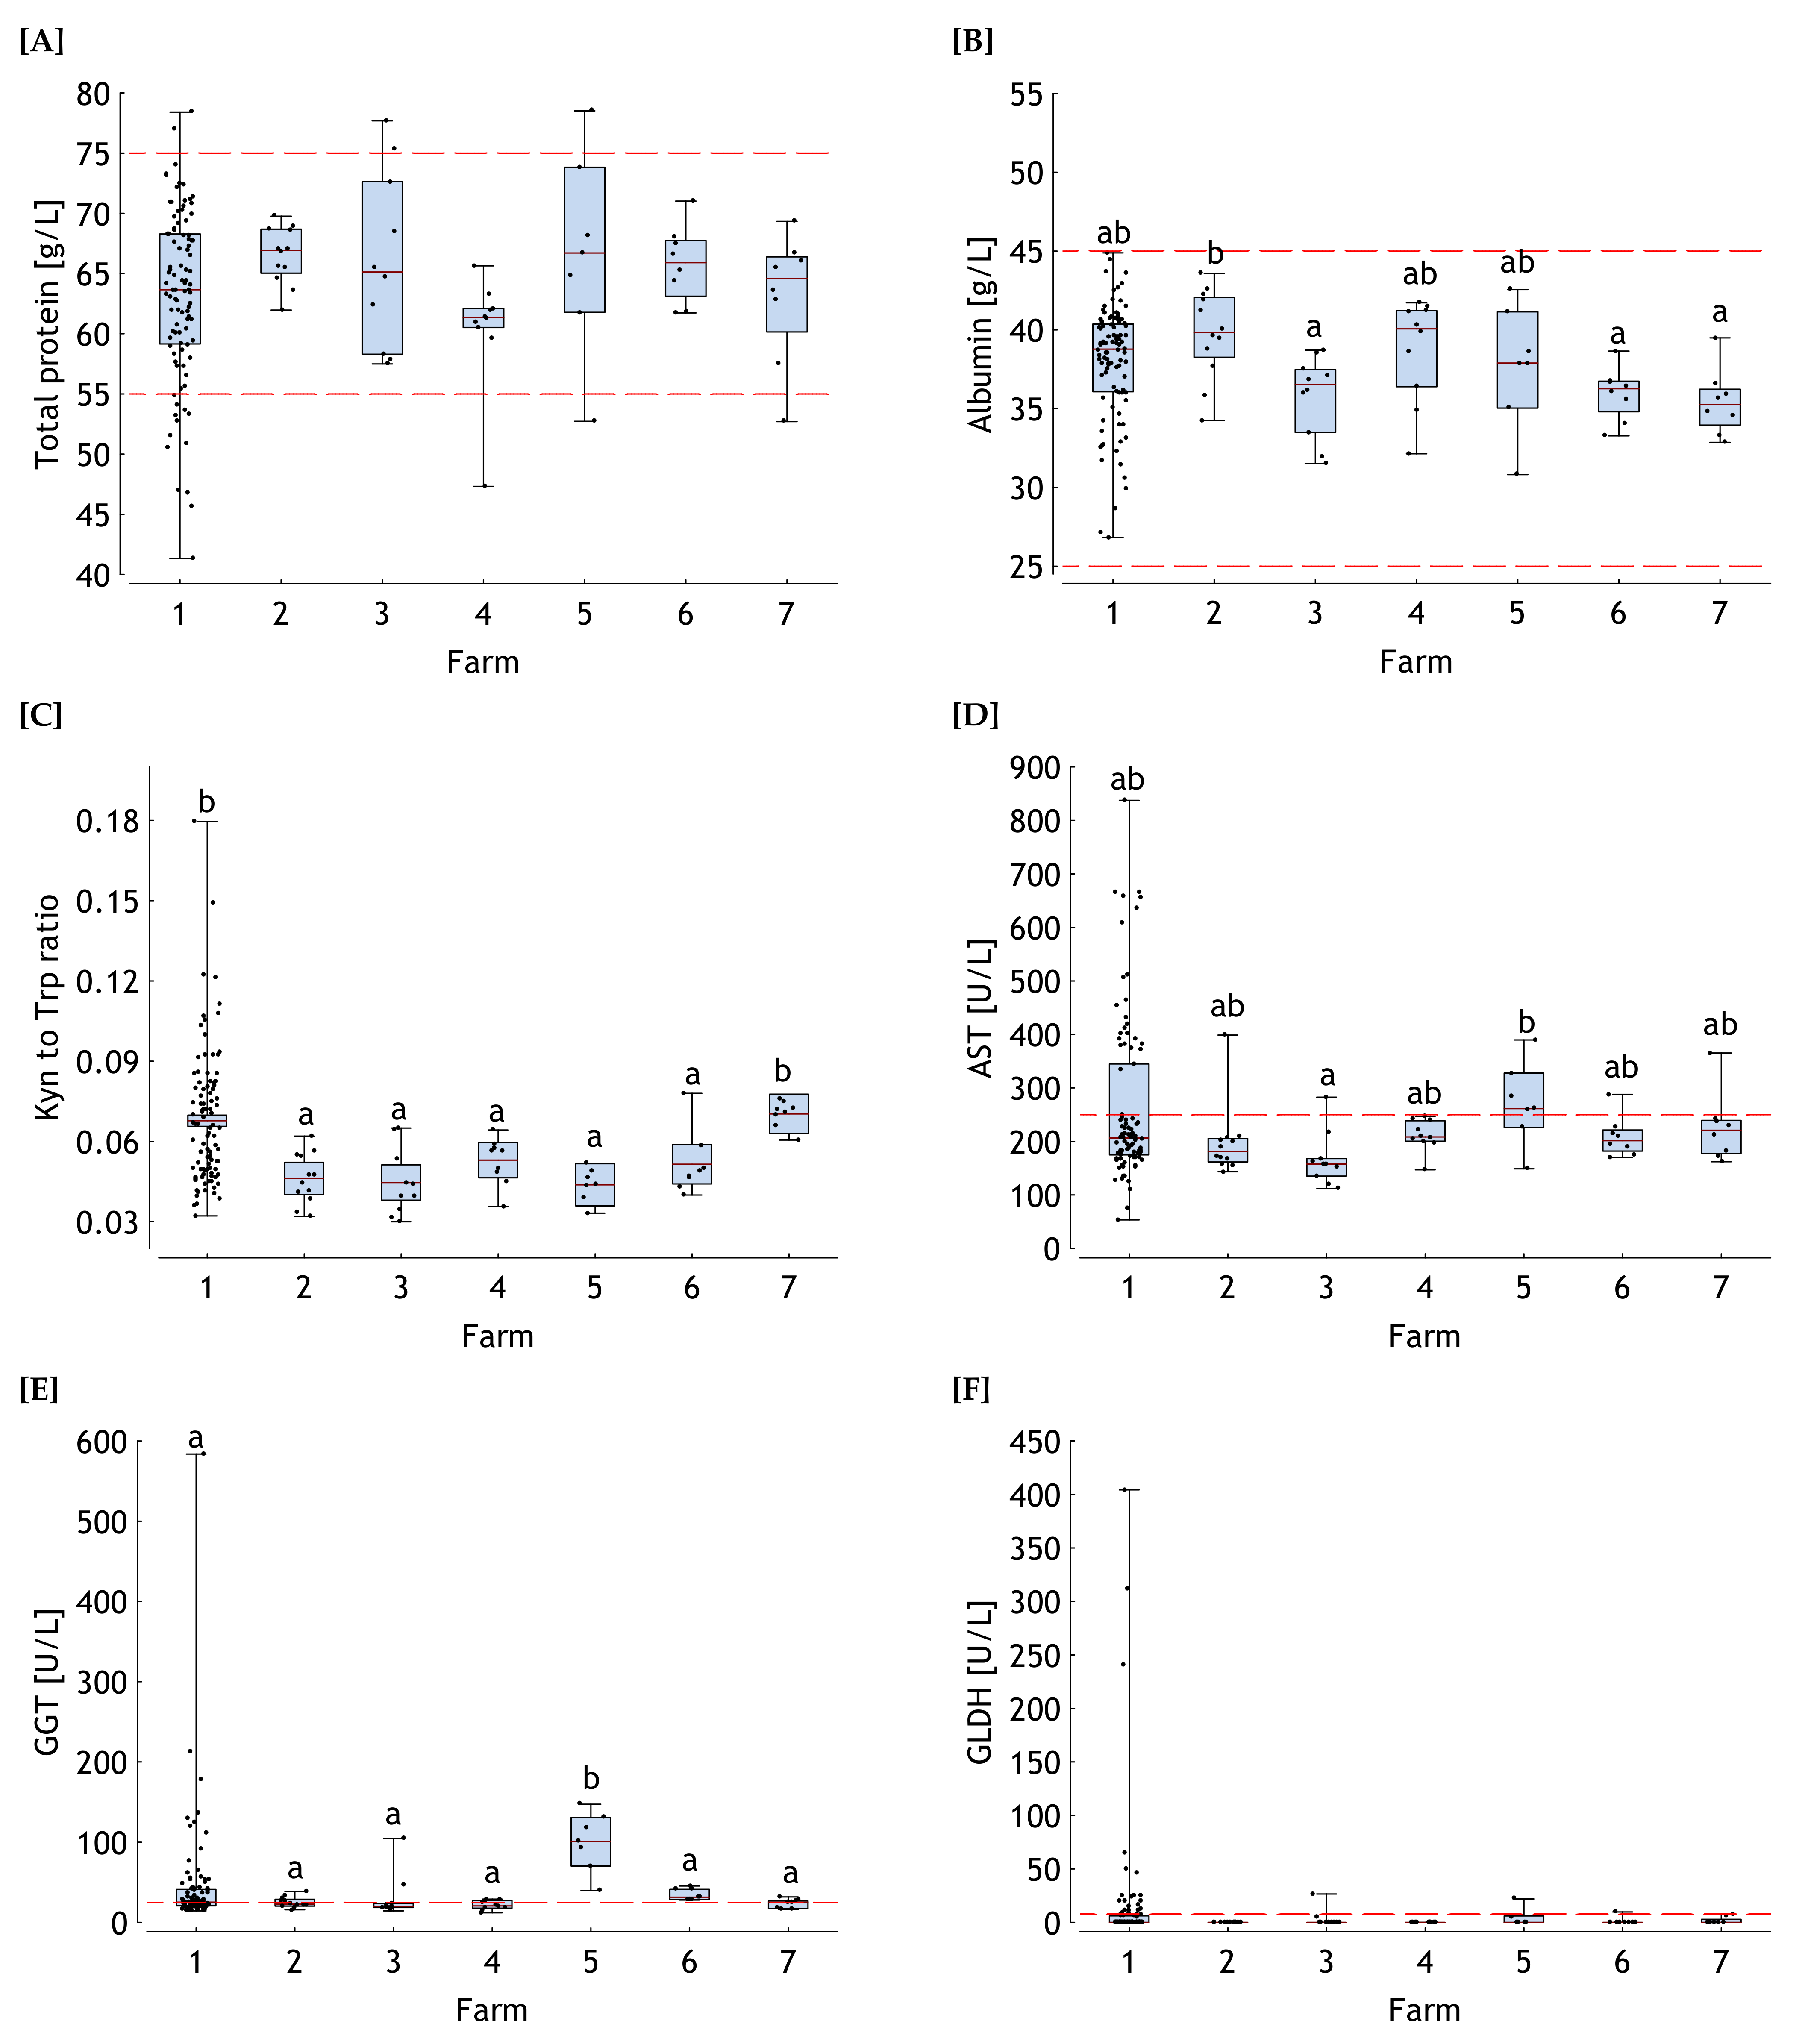
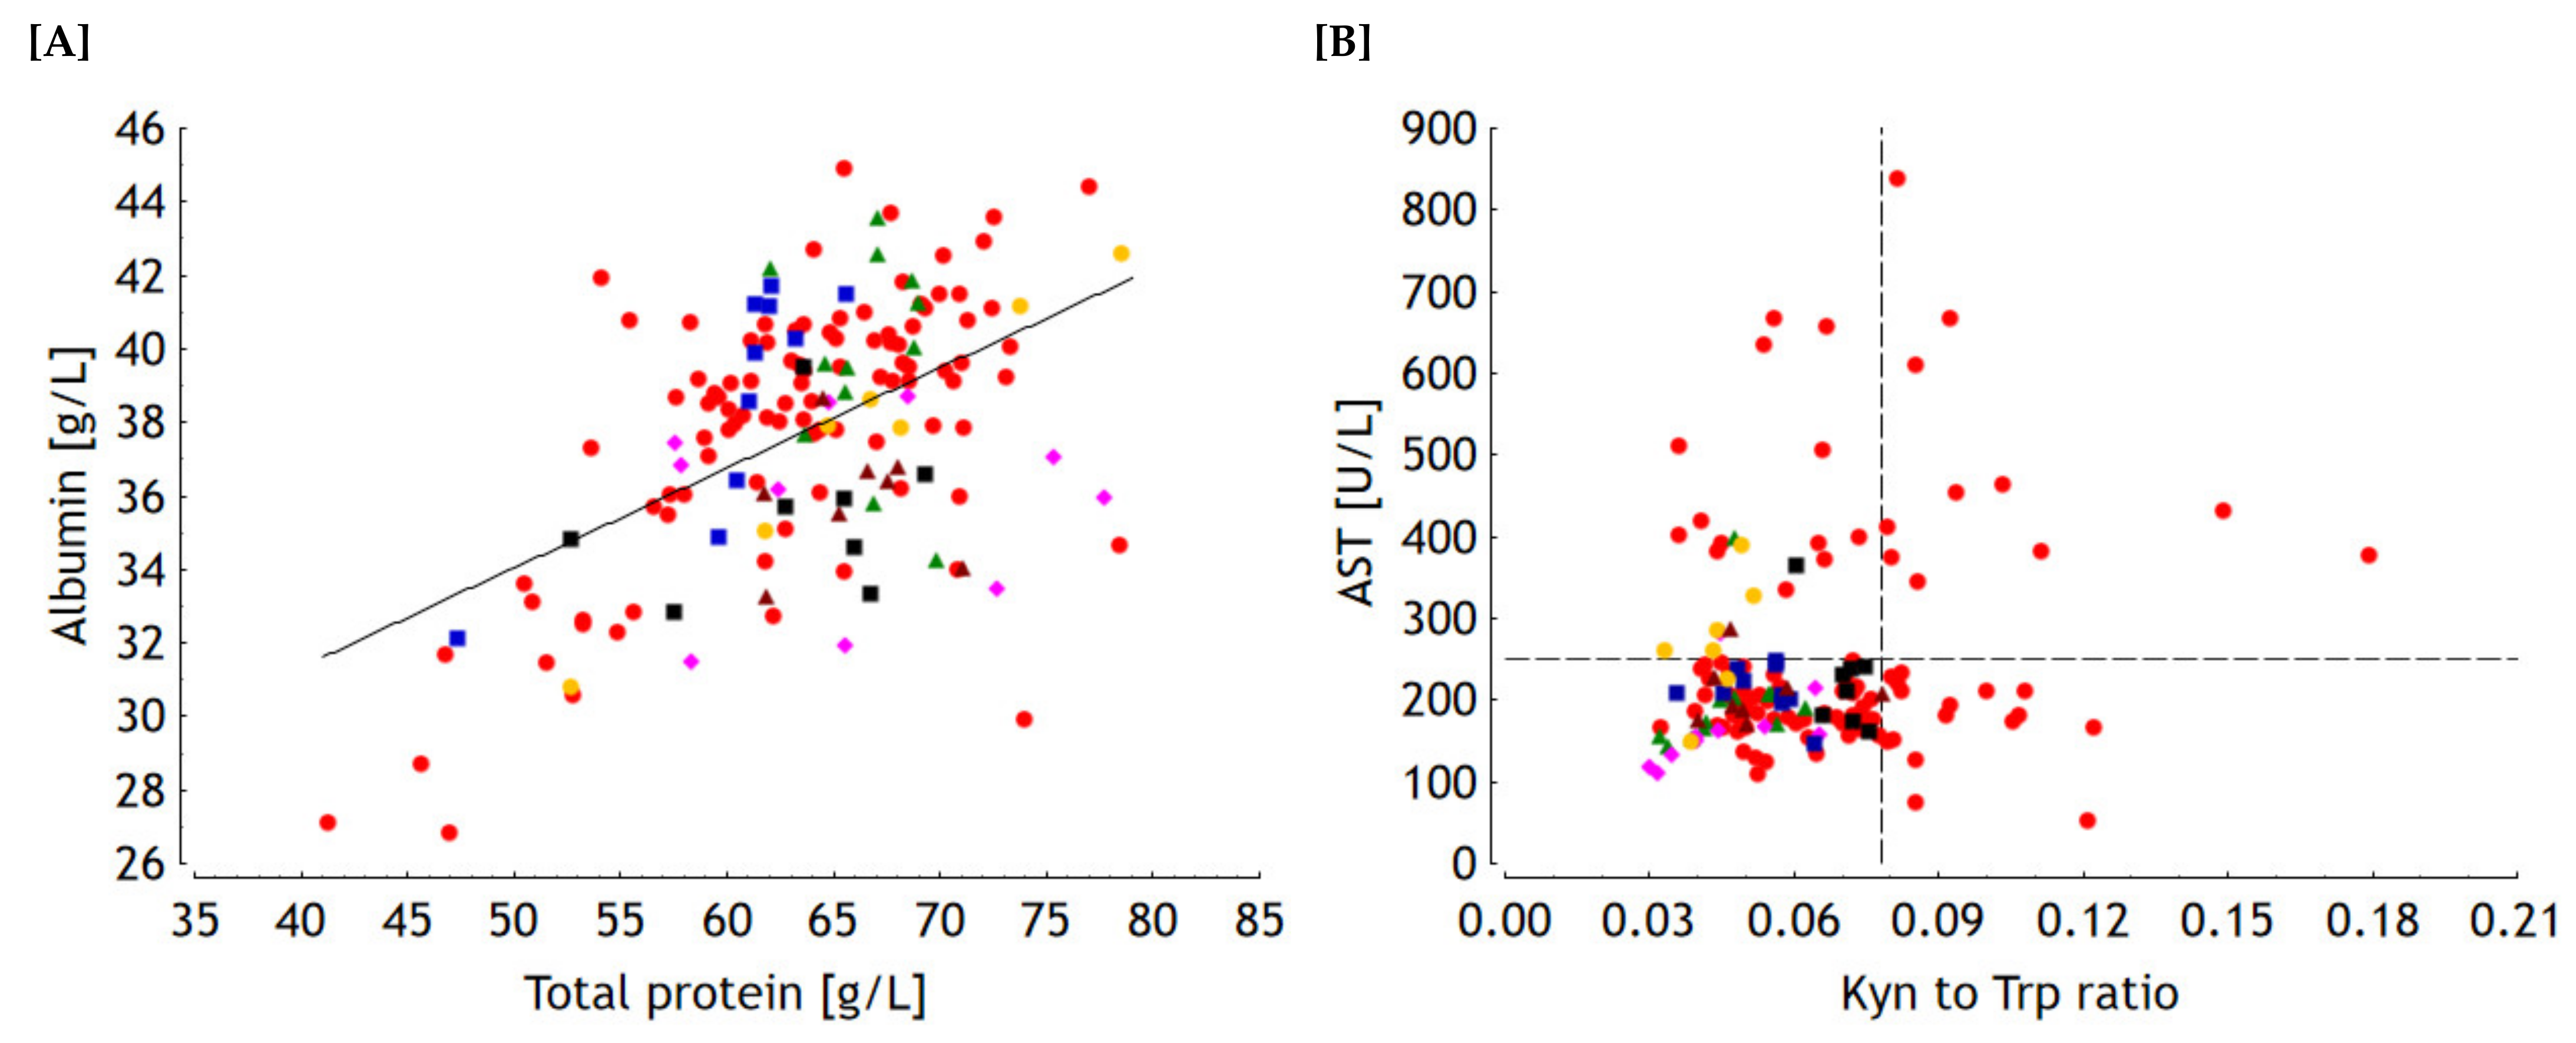
2.1.2. Clinical-Chemical Traits
2.1.3. Principal Component Analysis (PCA)
2.2. Kinetics
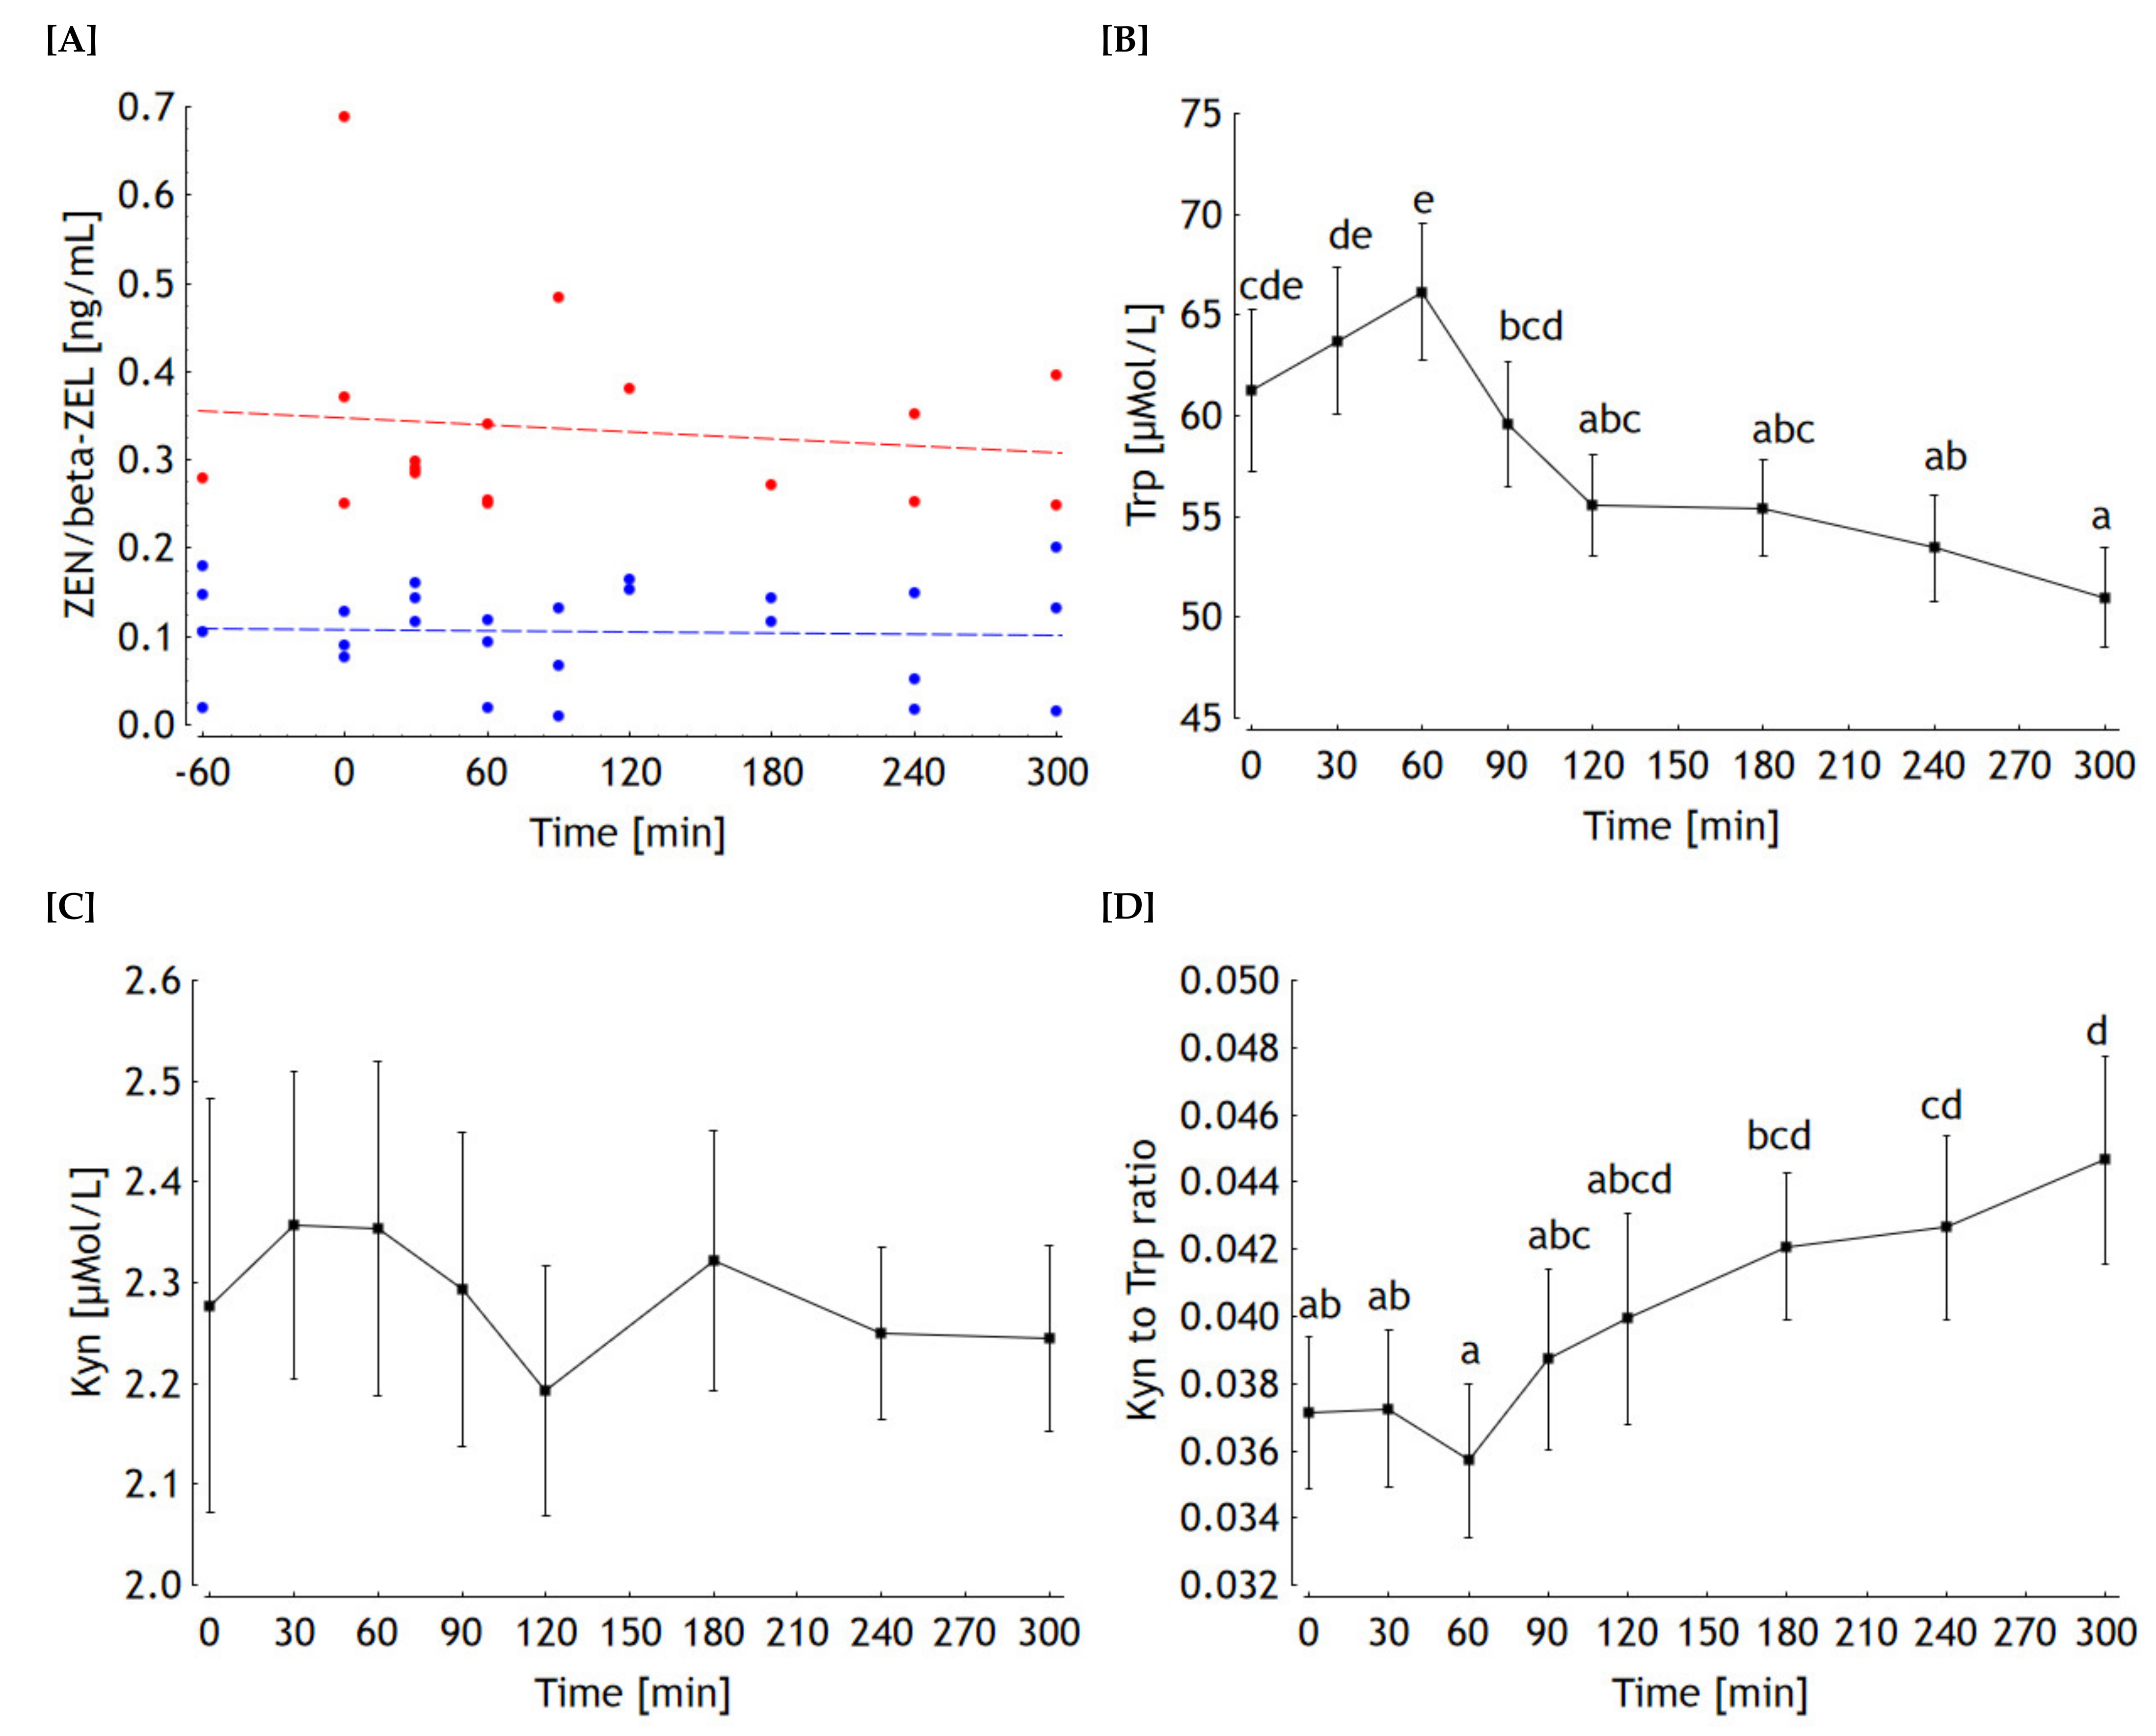
2.2.1. Mycotoxins
2.2.2. Trp, Kyn and Kyn to Trp Ratio
3. Discussion
4. Conclusions
5. Materials and Methods
5.1. Screening
5.1.1. Horse Patients with Colic
5.1.2. Clinically Healthy Horses
5.2. Kinetics
5.3. Analyses
5.3.1. Mycotoxin Residues
5.3.2. Trp and Kyn
5.3.3. Clinical-Chemical Traits
5.4. Calculations and Statistics
5.4.1. Screening
5.4.2. Kinetics
Author Contributions
Funding
Institutional Review Board Statement
Informed Consent Statement
Data Availability Statement
Acknowledgments
Conflicts of Interest
References
- European Food Safety Authority. Scientific Report of EFSA—Deoxynivalenol in food and feed: Occurrence and exposure. EFSA J. 2013, 11, 3379. [Google Scholar]
- Liesener, K.; Curtui, V.; Dietrich, R.; Märtlbauer, E.; Usleber, E. Mykotoxins in horse feed. Mycotoxin Res. 2009, 26, 23–30. [Google Scholar] [CrossRef]
- Ji, F.; Wu, J.; Zhao, H.; Xu, J.; Shi, J. Relationship of deoxynivalenol content in grain, chaff, and straw with Fusarium head blight severity in wheat varieties with various levels of resistance. Toxins 2015, 7, 728–742. [Google Scholar] [CrossRef] [PubMed] [Green Version]
- Matthäus, K.; Dänicke, S.; Vahjen, W.; Simon, O.; Wang, J.; Valenta, H.; Meyer, K.; Strumpf, A.; Zieseniß, H.; Flachowsky, G. Progression of mycotoxin and nutrient concentrations in wheat after inoculation with Fusarium culmorum. Arch. Anim. Nutr. 2004, 58, 19–35. [Google Scholar] [CrossRef] [PubMed]
- Brinkmeyer, U.; Dänicke, S.; Lehmann, M.; Valenta, H.; Lebzien, P.; Schollenberger, M.; Südekum, K.-H.; Weinert, J.; Flachowsky, G. Influence of a Fusarium culmorum inoculation of wheat on the progression of mycotoxin accumulation, ingredient concentrations and ruminal in sacco dry matter degradation of wheat residues. Arch. Anim. Nutr. 2006, 60, 141–157. [Google Scholar] [CrossRef] [PubMed]
- Jensen, T.; De Boevre, M.; De Saeger, S.; Preußke, N.; Sönnichsen, F.D.; Kramer, E.; Klink, H.; Verreet, J.-A.; Birr, T. Effect of ensiling duration on the fate of deoxynivalenol, zearalenone and their derivatives in maize silage. Mycotoxin Res. 2019, 36, 127–136. [Google Scholar] [CrossRef] [PubMed]
- Rohweder, D.; Valenta, H.; Sondermann, S.; Schollenberger, M.; Drochner, W.; Pahlow, G.; Döll, S.; Dänicke, S. Effect of different storage conditions on the mycotoxin contamination of Fusarium culmorum-infected and non-infected wheat straw. Mycotoxin Res. 2011, 27, 145–153. [Google Scholar] [CrossRef]
- Kamphues, J. 20—Feed hygiene and related disorders in horses. In Equine Applied and Clinical Nutrition; Geor, R.J., Harris, P.A., Coenen, M., Eds.; Elsevier Health Sciences: Amsterdam, The Netherlands, 2013; pp. 367–380. ISBN 978-0-7020-3422-0. [Google Scholar]
- Ulrich, S.; Gottschalk, C.; Biermaier, B.; Bahlinger, E.; Twarużek, M.; Asmussen, S.; Schollenberger, M.; Valenta, H.; Ebel, F.; Dänicke, S. Occurrence of type A, B and D trichothecenes, zearalenone and stachybotrylactam in straw. Arch. Anim. Nutr. 2021, 75, 105–120. [Google Scholar] [CrossRef]
- Döll, S.; Dänicke, S. The Fusarium toxins deoxynivalenol (DON) and zearalenone (ZON) in animal feeding. Prev. Vet. Med. 2011, 102, 132–145. [Google Scholar] [CrossRef]
- Schulz, A.-K.; Kersten, S.; Dänicke, S.; Coenen, M.; Vervuert, I. Effects of deoxynivalenol in naturally contaminated wheat on feed intake and health status of horses. Mycotoxin Res. 2015, 31, 209–216. [Google Scholar] [CrossRef] [PubMed]
- Johnson, P.J.; Casteel, S.W.; Messer, N.T. Effect of feeding deoxynivalenol (vomitoxin)-contaminated barley to horses. J. Vet. Diagn. Investig. 1997, 9, 219–221. [Google Scholar] [CrossRef] [Green Version]
- Khol-Parisini, A.; Hellweg, P.; Razzazi-Fazeli, E.; Saalmuller, A.; Strasser, A.; Tichy, A.; Zentek, J. Highly deoxynivalenol contaminated oats and immune function in horses. Arch. Anim. Nutr. 2012, 66, 149–161. [Google Scholar] [CrossRef]
- Raymond, S.L.; Smith, T.K.; Swamy, H.V.L.N. Effects of feeding a blend of grains naturally contaminated with Fusarium mycotoxins on feed intake, serum chemistry, and hematology of horses, and the efficacy of a polymeric glucomannan mycotoxin adsorbent. J. Anim. Sci. 2003, 81, 2123–2130. [Google Scholar] [CrossRef]
- Raymond, S.L.; Smith, T.K.; Swamy, H.V.L.N. Effects of feeding a blend of grains naturally contaminated with Fusarium mycotoxins on feed intake, metabolism, and indices of athletic performance of exercised horses. J. Anim. Sci. 2005, 83, 1267–1273. [Google Scholar] [CrossRef] [PubMed] [Green Version]
- Caloni, F.; Cortinovis, C. Effects of fusariotoxins in the equine species. Vet. J. 2010, 186, 157–161. [Google Scholar] [CrossRef]
- Barnett, D.T.; Mowery, R.A.; Hagler, W.M.; Bristol, D.G.; Mansmann, R.A. The correlation of selected mycotoxins to the incidence of colic in horses. In Proceedings of the 14th Equine Nutrition and Physiology Symposium, Ontario, CA, USA, 19–25 January 1995; pp. 242–247. [Google Scholar]
- Bland, S.D. Equine colic: A review of the equine hindgut and colic. Vet. Sci. Dev. 2016, 6. [Google Scholar] [CrossRef] [Green Version]
- Curtis, L.; Burford, J.H.; England, G.C.W.; Freeman, S.L. Risk factors for acute abdominal pain (colic) in the adult horse: A scoping review of risk factors, and a systematic review of the effect of management-related changes. PLoS ONE 2019, 14, e0219307. [Google Scholar] [CrossRef]
- Parry, B.W. Use of Clinical Pathology in Evaluation of Horses with Colic. Veter. Clin. N. Am. Equine Pr. 1987, 3, 529–542. [Google Scholar] [CrossRef]
- DeNotta, S.L.; Divers, T.J. Clinical Pathology in the Adult Sick Horse: The gastrointestinal system and liver. Vet. Clin. N. Am. Equine Pr. 2020, 36, 105–120. [Google Scholar] [CrossRef]
- Durham, A.E. Intestinal disease. In Equine Applied and Clinical Nutrition; Geor, R.J., Harris, P.A., Coenen, M., Eds.; Elsevier Health Sciences: Amsterdam, The Netherlands, 2013; pp. 568–581. ISBN 978-0-7020-3422-0. [Google Scholar]
- Maresca, M.; Fantini, J. Some food-associated mycotoxins as potential risk factors in humans predisposed to chronic intestinal inflammatory diseases. Toxicon Off. J. Int. Soc. Toxicol. 2010, 56, 282–294. [Google Scholar] [CrossRef]
- Maresca, M. From the Gut to the Brain: Journey and Pathophysiological Effects of the Food-Associated Trichothecene Mycotoxin Deoxynivalenol. Toxins 2013, 5, 784–820. [Google Scholar] [CrossRef] [PubMed]
- Dänicke, S.; Brezina, U. Invited Review: Kinetics and metabolism of the Fusarium toxin deoxynivalenol in farm animals: Consequences for diagnosis of exposure and intoxication and carry over. Food Chem. Toxicol. 2013, 60, 58–75. [Google Scholar] [CrossRef]
- Dänicke, S.; Winkler, J. Invited review: Diagnosis of zearalenone (ZEN) exposure of farm animals and transfer of its residues into edible tissues (carry over). Food Chem. Toxicol. 2015, 84, 225–249. [Google Scholar] [CrossRef]
- Schumann, B.; Winkler, J.; Mickenautsch, N.; Warnken, T.; Dänicke, S. Effects of deoxynivalenol (DON), zearalenone (ZEN), and related metabolites on equine peripheral blood mononuclear cells (PBMC) in vitro and background occurrence of these toxins in horses. Mycotoxin Res. 2016, 32, 153–161. [Google Scholar] [CrossRef]
- Songsermsakul, P.; Bohm, J.; Aurich, C.; Zentek, J.; Razzazi-Fazeli, E. The levels of zearalenone and its metabolites in plasma, urine and faeces of horses fed with naturally, Fusarium toxin-contaminated oats. J. Anim. Physiol. Anim. Nutr. 2011, 97, 155–161. [Google Scholar] [CrossRef] [PubMed]
- Wirthgen, E.; Kanitz, E.; Tuchscherer, M.; Domanska, G.; Schutt, C.; Seidlitz, A.; Weitschies, W.; Muller, C.; Ot-ten, W. IDO Activation by LPS Stimulation: Physiological consequences and their blocking by 1-Methyl-Tryptophan (1-MT) in a pig model. Neuroimmunomodulation 2011, 18, 409–410. [Google Scholar]
- Wirthgen, E.; Tuchscherer, M.; Otten, W.; Domanska, G.; Wollenhaupt, K.; Tuchscherer, A.; Kanitz, E. Activation of indoleamine 2,3-dioxygenase by LPS in a porcine model. Innate Immun. 2013, 20, 30–39. [Google Scholar] [CrossRef]
- Le Floc’H, N.; Otten, W.; Merlot, E. Tryptophan metabolism, from nutrition to potential therapeutic applications. Amino Acids 2010, 41, 1195–1205. [Google Scholar] [CrossRef] [PubMed]
- Tesch, T.; Bannert, E.; Kluess, J.; Frahm, J.; Hüther, L.; Kersten, S.; Breves, G.; Renner, L.; Kahlert, S.; Rothkötter, H.-J.; et al. Relationships between body temperatures and inflammation indicators under physiological and pathophysiological conditions in pigs exposed to systemic lipopolysaccharide and dietary deoxynivalenol. J. Anim. Physiol. Anim. Nutr. 2017, 102, 241–251. [Google Scholar] [CrossRef] [PubMed] [Green Version]
- Delarocque, J.; Frers, F.; Feige, K.; Huber, K.; Jung, K.; Warnken, T. Metabolic changes induced by oral glucose tests in horses and their diagnostic use. J. Vet. Intern. Med. 2020, 35, 597–605. [Google Scholar] [CrossRef]
- Kenéz, A.; Warnken, T.; Feige, K.; Huber, K. Lower plasma trans-4-hydroxyproline and methionine sulfoxide levels are associated with insulin dysregulation in horses. BMC Vet. Res. 2018, 14, 146. [Google Scholar] [CrossRef] [Green Version]
- Palego, L.; Betti, L.; Rossi, A.; Giannaccini, G. Tryptophan Biochemistry: Structural, nutritional, metabolic, and medical aspects in humans. J. Amino Acids 2016, 2016, 1–13. [Google Scholar] [CrossRef] [PubMed] [Green Version]
- Kraft, W.; Dürr, U.M. Klinische Labordiagnostik in der Tiermedizin; der neue Kraft/Dürr; Moritz, A., Ed.; 7., vollst. aktualisierte und erw. Aufl; Schattauer Verlag: Stuttgart, Germany, 2014; ISBN 9783794527373. [Google Scholar]
- Kraft, W.; Dürr, U.M. Klinische Labordiagnostik in der Tiermedizin; Schattauer Verlag: Stuttgart, Germany, 2005; ISBN 3-7945-2308-3. [Google Scholar]
- Kaya, G.; Sommerfeld-Stur, I.; Iben, C. Risk factors of colic in horses in Austria. J. Anim. Physiol. Anim. Nutr. 2009, 93, 339–349. [Google Scholar] [CrossRef] [PubMed]
- Kamphues, J. Risks of feedstuffs loaded by mites, moulds, bacteria and/or toxins in horses. Pferdeheilkunde 1996, 12, 326–332. [Google Scholar] [CrossRef]
- Souto, P.C.; da Fonseca, L.A.; Orozco, A.M.O.; Lopez, C.J.R.; Ermita, P.; Filho, W.P.D.C.; Girardi, F.M. Acute-Phase Proteins of Healthy Horses and Horses Naturally Affected by Colic Syndrome. J. Equine Vet. Sci. 2019, 80, 1–4. [Google Scholar] [CrossRef]
- Petersen, H.H.; Nielsen, J.P.; Heegaard, P. Application of acute phase protein measurements in veterinary clinical chemistry. Vet. Res. 2004, 35, 163–187. [Google Scholar] [CrossRef] [Green Version]
- Krueger, C.R.; Ruple, A.; Hackett, E.S. Evaluation of plasma muscle enzyme activity as an indicator of lesion characteristics and prognosis in horses undergoing celiotomy for acute gastrointestinal pain. BMC Veter Res. 2014, 10, S7. [Google Scholar] [CrossRef] [PubMed] [Green Version]
- Wirthgen, E.; Hoeflich, A.; Rebl, A.; Günther, J. Kynurenic Acid: The Janus-faced role of an immunomodulatory tryptophan metabolite and its link to pathological conditions. Front. Immunol. 2018, 8, 1957. [Google Scholar] [CrossRef] [Green Version]
- Hüther, L.; Hartwiger, J.; Drong, C.; Meyer, U.; Dänicke, S. Simultaneous determination of tryptophan, kynurenine and niacin in serum of periparturient dairy cows by high-performance liquid chromatography with diode array detection. J. Vet. Sci. Med. Diagn. 2016, 5. [Google Scholar] [CrossRef]
- Bachmann, M.; Czetö, A.; Romanowski, K.; Vernunft, A.; Wensch-Dorendorf, M.; Wolf, P.; Metges, C.C.; Zeyner, A. Effects of grain species, genotype and starch quantity on the postprandial plasma amino acid response in horses. Res. Vet. Sci. 2018, 118, 295–303. [Google Scholar] [CrossRef]
- Glatter, M.; Bochnia, M.; Goetz, F.; Gottschalk, J.; Koeller, G.; Mielenz, N.; Hillegeist, D.; Greef, J.M.; Einspanier, A.; Zeyner, A. Glycaemic and insulinaemic responses of adult healthy warm-blooded mares following feeding with Jerusalem artichoke meal. J. Anim. Physiol. Anim. Nutr. 2017, 101, 69–78. [Google Scholar] [CrossRef] [Green Version]
- Oldenburg, E.; Bramm, A.; Valenta, H. Influence of nitrogen fertilization on deoxynivalenol contamination of winter wheat—Experimental field trials and evaluation of analytical methods. Mycotoxin Res. 2007, 23, 7–12. [Google Scholar] [CrossRef] [PubMed]
- VDLUFA. Verband Deutscher Landwirtschaftlicher Untersuchungs- und Forschungsanstalten. Handbuch der land-wirtschaftlichen Versuchs- und Untersuchungsmethodik (VDLUFA-Methodenbuch); VDLUFA-Verlag: Darmstadt, Germany, 2006. [Google Scholar]
- Bannert, E.; Tesch, T.; Kluess, J.; Valenta, H.; Frahm, J.; Kersten, S.; Kahlert, S.; Renner, L.; Rothkötter, H.-J.; Dänicke, S. Plasma kinetics and matrix residues of deoxynivalenol (DON) and zearalenone (ZEN) are altered in endotoxaemic pigs independent of LPS entry site. Mycotoxin Res. 2017, 33, 183–195. [Google Scholar] [CrossRef] [PubMed]
- Brezina, U.; Valenta, H.; Rempe, I.; Kersten, S.; Humpf, H.-U.; Dänicke, S. Development of a liquid chromatography tandem mass spectrometry method for the simultaneous determination of zearalenone, deoxynivalenol and their metabolites in pig serum. Mycotoxin Res. 2014, 30, 171–186. [Google Scholar] [CrossRef] [PubMed]
- TIBCO Software Inc. Statistica (Data Analysis Software System), Version 13. 2018. Available online: http://tibco.com (accessed on 10 August 2021).
- Jolliffe, I.T.; Cadima, J. Principal component analysis: A review and recent developments. Philos. Trans. R. Soc. A Math. Phys. Eng. Sci. 2016, 374, 20150202. [Google Scholar] [CrossRef]


 , 2
, 2  , 3
, 3  , 4
, 4  , 5
, 5  , 6
, 6  , 7
, 7  .
, 2 , 3 , 4 , 5 , 6 , 7 .
.
, 2 , 3 , 4 , 5 , 6 , 7 . , 2 , 3 , 4 , 5 , 6 , 7 .
, 2 , 3 , 4 , 5 , 6 , 7 .
, 2 , 3 , 4 , 5 , 6 , 7 .


| Farm | Group | N | Feeding Conditions | ||
|---|---|---|---|---|---|
| Concentrate | Roughage | Pasture Access | |||
| 1 | Colic | 102 | No information | ||
| 2 | Healthy | 12 | Oats, pellets, soybean meal | Grass silage | Yes |
| 3 | Healthy | 10 | Oats, muesli | Hay | Temporary |
| 4 | Healthy | 10 | Mix: 50% oats, 23% barley, 21% corn, 2.5% wheat bran, 2.5% mineral feed, 1% soybean oil | Grass silage | Yes |
| 5 | Healthy | 7 | Barley, oats | Hay | Yes |
| 6 | Healthy | 8 | Oats | Hay | Yes/no |
| 7 | Healthy | 8 | - | - | Yes |
Publisher’s Note: MDPI stays neutral with regard to jurisdictional claims in published maps and institutional affiliations. |
© 2021 by the authors. Licensee MDPI, Basel, Switzerland. This article is an open access article distributed under the terms and conditions of the Creative Commons Attribution (CC BY) license (https://creativecommons.org/licenses/by/4.0/).
Share and Cite
Dänicke, S.; Saltzmann, J.; Liermann, W.; Glatter, M.; Hüther, L.; Kersten, S.; Zeyner, A.; Feige, K.; Warnken, T. Evaluation of Inner Exposure of Horses to Zearalenone (ZEN), Deoxynivalenol (DON) and Their Metabolites in Relation to Colic and Health-Related Clinical-Chemical Traits. Toxins 2021, 13, 588. https://0-doi-org.brum.beds.ac.uk/10.3390/toxins13080588
Dänicke S, Saltzmann J, Liermann W, Glatter M, Hüther L, Kersten S, Zeyner A, Feige K, Warnken T. Evaluation of Inner Exposure of Horses to Zearalenone (ZEN), Deoxynivalenol (DON) and Their Metabolites in Relation to Colic and Health-Related Clinical-Chemical Traits. Toxins. 2021; 13(8):588. https://0-doi-org.brum.beds.ac.uk/10.3390/toxins13080588
Chicago/Turabian StyleDänicke, Sven, Janine Saltzmann, Wendy Liermann, Maren Glatter, Liane Hüther, Susanne Kersten, Annette Zeyner, Karsten Feige, and Tobias Warnken. 2021. "Evaluation of Inner Exposure of Horses to Zearalenone (ZEN), Deoxynivalenol (DON) and Their Metabolites in Relation to Colic and Health-Related Clinical-Chemical Traits" Toxins 13, no. 8: 588. https://0-doi-org.brum.beds.ac.uk/10.3390/toxins13080588