Is Toxin-Producing Planktothrix sp. an Emerging Species in Lake Constance?


1
Microbial Ecology and Limnic Microbiology, University of Konstanz, 78457 Konstanz, Germany
2
Human and Environmental Toxicology, University of Konstanz, 78457 Konstanz, Germany
3
Limnological Institute, University of Konstanz, 78457 Konstanz, Germany
*
Authors to whom correspondence should be addressed.
†
Shared 1st authorship.
Toxins 2021, 13(9), 666; https://doi.org/10.3390/toxins13090666
Submission received: 22 July 2021
/
Revised: 13 September 2021
/
Accepted: 15 September 2021
/
Published: 17 September 2021
(This article belongs to the Special Issue Cyanotoxins in Bloom: Ever-Increasing Occurrence and Global Distribution of Freshwater Cyanotoxins from Planktic and Benthic Cyanobacteria)
Abstract
:Recurring blooms of filamentous, red-pigmented and toxin-producing cyanobacteria Planktothrix rubescens have been reported in numerous deep and stratified prealpine lakes, with the exception of Lake Constance. In a 2019 and 2020 Lake Constance field campaign, we collected samples from a distinct red-pigmented biomass maximum below the chlorophyll-a maximum, which was determined using fluorescence probe measurements at depths between 18 and 20 m. Here, we report the characterization of these deep water red pigment maxima (DRM) as cyanobacterial blooms. Using 16S rRNA gene-amplicon sequencing, we found evidence that the blooms were, indeed, contributed by Planktothrix spp., although phycoerythrin-rich Synechococcus taxa constituted most of the biomass (>96% relative read abundance) of the cyanobacterial DRM community. Through UPLC–MS/MS, we also detected toxic microcystins (MCs) in the DRM in the individual sampling days at concentrations of ≤1.5 ng/L. Subsequently, we reevaluated the fluorescence probe measurements collected over the past decade and found that, in the summer, DRM have been present in Lake Constance, at least since 2009. Our study highlights the need for a continuous monitoring program also targeting the cyanobacterial DRM in Lake Constance, and for future studies on the competition of the different cyanobacterial taxa. Future studies will address the potential community composition changes in response to the climate change driven physiochemical and biological parameters of the lake.
Key Contribution: Deep water, red-pigmented cyanobacterial blooms in Lake Constance were characterized by phylogenetic community sequencing during the summers of 2019 and 2020, demonstrating the low abundance of Planktothrix spp., and the predominance of picoplanktic phycoerythrin-rich Synechococcus spp., as well as very low concentrations of cyanobacterial toxins on individual sampling days. In response to climate change, changes in the physiochemical and biological parameters of the lake may, in future, support the establishment of toxic Planktothrix spp. blooms and/or the mass development of potentially toxic picocyanobacteria.
1. Introduction
The formation of cyanobacterial blooms involves the complex interplay of regional and biological variables, and blooms have been reported worldwide with an increasing frequency [1,2]. Although it has been shown that climate change and eutrophication are, in many cases, major contributors to bloom formation, the mechanisms through which nutrients and temperature interact to amplify blooms varies extensively between cyanobacterial groups. Moreover, the optimal growth temperature and nutrient availability of cyanobacteria is species specific, making inferences from studies with other species more complex [2,3]. Indeed, different cyanobacterial species predominate depending on the N/P ratio [3]. The filamentous cyanobacterial genus, Planktothrix, occurs preferentially in prealpine and alpine lakes in temperate regions, and has been responsible for many blooms in the past (for example, in Lake Zurich [4,5], Lake Bourget [6], Lake Garda [7] and Lake Mondsee [8]), where its mass occurrence can evolve to become a major influence on the food web [9,10]. The success of Planktothrix spp. is attributed to its adaptability, including its ability to regulate buoyancy, and the use of phycobilins, in addition to chlorophyll-a [11,12], as chromophores. By virtue of the phycobilins, phycocyanin and phycoerythrin, Planktothrix spp. can absorb light in large parts of the electromagnetic spectrum; specifically, blue and green light, thus conferring its red appearance. Consequently, the free-floating Planktothrix spp. usually develop blooms at depths of 9–15 m [11,13]. Bloom depths within a stratified lake can be influenced by the internal waves, and can impact the growth of Planktothrix spp. by changing the light availability [14]. Similarly to many other cyanobacterial species, mass occurrences of Planktothrix spp. are supported by warmer water temperatures, mediating a more stable lake stratification in the summer [9,15]. Strikingly, Planktothrix spp. can, additionally, form prominent winter blooms and can thrive even beneath an ice cover, allowing for full year dominance [16,17]. Although microcystin production in winter blooms, on and under ice covers, has been reported, toxins appear to be less abundant in colder environments than in warmer environments [16,18,19].
The genus Planktothrix is currently distinguished in nine species, including red and green phenotypes, with the most prominent representatives being P. rubescens and P. agardhii, respectively, which mostly occur in the freshwater ecosystems of temperate regions [20]. Similarly to many other cyanobacteria, Planktothrix spp. are capable of producing microcystins (MCs), which are known to be toxic to humans, as well as other mammalian and non-mammalian species [15,16,17,18]. Hence, cyanobacterial blooms are often associated with the detection of increased intra- and extra-cellular toxin(s) [21]. Despite a plethora of efforts, neither the trigger for toxin production, nor the factors resulting in the development of toxic cyanobacterial blooms, have been elucidated. While toxins are suggested to be part of a defense mechanism against zooplankton or parasites [22,23,24], and toxin producing strains seem to have an advantage over non-toxic strains [25,26], the molecular ‘switch’ that turns toxin production on has not yet been discovered. Irrespective of the latter, the potential adverse impact of toxic cyanobacterial blooms on human health, society, economy and ecology highlights the importance of an improved understanding of cyanobacterial bloom formation, with or without concomitant toxin production [27,28].
Microcystins (MCs) share one common monocyclic structure with a molecular weight of approximately 1 kDa, which is composed of seven amino acids, (three D-amino acids, one N-methyldehydroalanine, two L-amino acids at the hypervariable positions two and four, and the unique amino acid ADDA (Figure S1) [29]). Variations in amino acid composition, and modifications such as methylations, create extreme structural diversity—at least 279 different congeners have been reported [30]. MC synthesis is encoded by 9–10 genes that constitute one mcy gene cluster [31]. The toxicity of MCs is induced by covalent binding, the inhibition of ser/thr protein phosphatases and the concomitant hyperphosphorylation of cellular proteins [32,33,34], whereby the toxicodynamically relevant biological availability of MCs highly depends on the route of exposure and the respective MC congener [35,36]. MC concentrations of <35 µg/L were reported in Planktothrix spp. blooms [37,38]. When considering the current World Health Organization (WHO) guideline value of 1 µg MC/L in drinking water [39], which translates to approximately 10 µg/L of raw water, largely depending on the type of water treatment used [40,41], it becomes obvious that toxin-producing Planktothrix spp. blooms must be taken as a serious threat to freshwater systems serving as drinking water resources.
Unlike other prealpine lakes, Lake Constance, a drinking water reservoir for more than four million inhabitants, has not yet seen prominent and recurring, well-documented blooms of Planktothrix spp. Although P. rubescens has the capability to dominate entire lake ecosystems, even at low nutrient concentrations (e.g., Lake Bourget [6]), analyses of Lake Constance samples revealed only low abundances of Planktothrix spp. to date [9,42]. Indeed, the first prominent appearance of Planktothrix rubescens was documented in 2016, when P. rubescens filaments were observed in various German, Austrian, and Swiss sampling sites at Lake Constance [42,43].
No molecular phylogenetic studies have been conducted, to date, to evaluate the composition of the red-pigmented cyanobacterial community in Lake Constance, in water depths that are typical for the blooms of Planktothrix spp. (i.e., below the chlorophyll-a maximum). In a field campaign in the Überlingen embayment of Lake Constance (47.7571° N 9.1273° E), we observed reddish colored plankton filters in the samples taken at 18 m water depth, in the summer of 2019. Subsequently, water samples were taken at the depths of maximal red pigment (phycoerythrin) concentration, as determined by a fluorescence probe, on each of the fortnightly sampling days, between June and October 2019, and between July and September 2020. The composition of the cyanobacterial community at this deep water red pigment maximum (DRM) was assessed through Illumina PCR-amplicon sequencing, using cyanobacteria-specific primers, while UPLC–MS/MS analyses were applied to determine the toxin concentrations. Potentially toxin-producing species were identified and quantified via quantitative PCR, using Planktothrix- and microcystin-biosynthesis-specific (mcy) primers, and Sanger sequencing.
2. Results
2.1. Blooms of Red-Pigmented Phytoplankton at Water Depths below the Chlorophyll-a Maximum in Lake Constance
Multiwavelength fluorometer profiles were taken along the water column, using a Moldaenke FluoroProbe, and were evaluated directly on the ship to determine the depths of the maxima of green pigment (chlorophyll-a maximum; predominantly diatoms and green algae) and red pigment concentrations (deep water red pigment maximum, DRM). An example of a depth profile for all of the recorded fluorescence channels, as well as of the interpretation of the abundance of different algae classes (as calculated by the Moldaenke FluoroProbe) is depicted in Figure 1. An increased abundance of red-pigmented cyanobacteria, such as phycoerythrin-rich Planktothrix spp. or Synechococcus spp., was suggested by the elevated fluorescence intensity at 570 nm (and 525 nm) excitation wavelength (Figure 1). According to the distinction of algae classes used by the Moldaenke FluoroProbe, these phycoerythrin-rich algae were attributed to represent ‘cryptophyta’.
2.2. Phycoerythrin-Rich Synechococcus Phylotypes Dominated the DRM Cyanobacterial Community
In order to characterize the cyanobacterial community composition that is presumably present at the DRM, the plankton biomass at the DRM was collected on Whatman GF6 glass fiber filters. The filters appeared reddish, compared to the yellow-green filters obtained from the chlorophyll-a maximum sample (see Supplementary Material, Figure S2). The total DNA was extracted from the filters, and a fragment of the 16S rRNA gene was amplified using the cyanobacteria-specific primers, CYA359F and CYA784R [44]. Illumina sequencing, with 300 bp paired-end reads, was employed. These primers amplified cyanobacteria phylotypes, which allowed for the collection of phylogenetic information at a finer resolution, and also of the low abundant cyanobacteria at the DRM. Taxonomic affiliation was carried out using two different reference databases: SILVA_138 and Greengenes. The cyanobacteria taxonomy was consistent between both databases, with the exception of the Synechococcus genus in Greengenes (replaced by Cyanobium_PCC-6307 in SILVA; Cyanobium_PCC-6307 is a heterotypic synonym of Synechococcus sp PCC-6307).
Subsequently to bioinformatic processing and the removal (filtering) of the extremely low abundant phylotypes (i.e., phylotypes represented by less than three reads in at least 20% of all samples; see Material and Methods), 35 amplicon sequence variants (ASVs) were detected in 2019, and 37 were detected in 2020 (Figure 2). Each ASV was affiliated at the level of either genus or order, depending on the last common taxonomic rank between the SILVA and Greengenes databases (note that species rank could not be affiliated by the amplicon sequencing technique that we used).
For both the 2019 and 2020 sampling campaigns, the genus Synechococcus clearly dominated the cyanobacterial DRM community (as examined using amplicon sequencing), occupying 96% (SILVA) or 98% (Greengenes) of the total relative read abundance, and representing 65.7% (SILVA) and 67.6% (Greengenes) of the detected ASVs in the community (see Supplementary Material, Table S2). For 2019, five Synechococcus ASVs represented 78% of the total relative abundance, with ASV13 being the most abundant with 21% total relative abundance (Figure 2A). For 2020, only three of the ASVs affiliated to Synechococcus contributed to 77% of the total relative abundance, with ASV4 contributing to almost half (45%) throughout the year (Figure 2B).
Although Synechococcus dominated the cyanobacterial community at the DRM in 2019 and 2020, each of the two ASVs that are affiliated to Planktothrix could be detected in both years. Planktothrix (Oscillatoriophycideae in Figure 2A,B), with 0.4% (2019) and 0.9% (2020) of the total relative abundance (Figure 2A,B), represented only low abundant taxa, together with Nostocophycideae. In addition, two Microcystis spp. ASVs were detected in 2019, at 0.06% of the total relative read abundance. Only one Microcystis spp. ASV was detected in 2020, with a very low total relative abundance of 0.008%. Although the respective relative abundances of Planktothrix and Microcystis species are low, the strong bioinformatic filtration (for details, see Section 5.6) confirms the biological significance of these amplicon sequencing results. The ASVs of the most abundant Synechococcus spp., as well as the Planktothrix spp. and Microcystis spp. ASVs, were used for further analyses.
2.3. Synechococcus Rubescens and Cyanobium Gracile Clusters in 2019 and 2020
We examined the phylogenetic relationship of the main Synechococcus ASVs that were detected in 2019 and 2020, with the reference sequences of (i) all the cultivated phycoerythrin-rich Synechococcus spp. of Lake Constance, as established by Ernst and colleagues in 2003 [45], and (ii) Synechococcus rubescens and phycoerythrin-rich Cyanobium gracile reference sequences, as established by NCBI (Figure 3). The relationship was established using the appropriate sequence fragments, representing the PCR amplicon of 380 bp, with the IQ-TREE program [46], based on a phylogenetic inference using the maximum likelihood, coupled with ModelFinder to determine the best-fitting nucleotide substitution model [47]. Although the target sequence was shorter than the full 16S rRNA gene sequences established by Ernst et al., 2003, the phylogenetic relationship between the reference sequences remained the same, thereby confirming our analyses. The ASVs from this study were always grouped in pairs, with one ASV from 2019 (Figure 3, green font) and another from 2020 (Figure 3, blue font), as a reflection of the reoccurring Synechococcus phylotypes across the two years, further confirming our analysis.
Overall, the ASVs were grouped into two main clusters, either more closely related to the S. rubescens or to the C. gracile reference sequence (Figure 3). The top three most abundant ASVs for 2019 (ASV13, ASV14 and ASV15; see Figure 2 and below) and the top two most abundant for 2020 (ASV4 and ASV7; Figure 2), were more closely related to the Synechococcus rubescens NCBI reference sequence. For this group, two reference sequences of Lake Constance phycoerythrin-rich Synechococcus isolates [45] were available (Figure 3; BO8807 and BO9404), while for the C. gracile group, the reference sequences of seven Lake Constance isolates were available (Figure 3).
The megablast results were analogous to the phylogenetic tree shown, with the same ASVs in 2019 and 2020 being affiliated more closely to either Synechococcus rubescens or Cyanobium gracile (Supplementary Material, Table S3a,b), with the exception of ASV18 in 2019 and ASV10 in 2020. These ASVs showed identical percentage identities and E-values in the megablast for both S. rubescens and C. gracile (Table S3a,b) and were, therefore, grouped in between both clusters (Figure 3).
2.4. Dynamics of Synechococcus ASVs in 2019 and 2020
We examined the change in the relative abundance of the Synechococcus ASVs detected, over time. Figure 4 illustrates the dynamics of the Synechococcus ASVs as a heatmap, using relative abundance data after the log10 transformation (Figure 4A,C) and the data distribution (Figure 4B,D) as the mean and standard deviation of the relative abundances in a combined bar and jitter plot. Each dot represents the relative abundance of the taxa at a specific date (relative abundance values (%) per ASV across the sampling dates are shown in Supplementary Material, Table S4a,b).
Overall, the observed changes in the phylogenetic structure across the sampling dates suggested a high degree of successional change within the Synechococcus spp. community at the DRM. Some ASVs varied from being almost undetectable in the beginning to a relative abundance maximum later in the year, or showed the opposite trend (being abundant at the beginning or in the middle of the sampling campaigns), while other ASVs showed a comparatively stable (and low) relative abundance across the sampling campaigns. Indeed, while 10 ASVs were registered in 2019, only nine ASVs were registered in 2020 (Figure 4A,C). Thus, different ASVs appeared to dominate, and, therefore, provide a successional change, in the two field campaigns. For example, ASV13, as the most prominent ASV in 2019 (Figure 4B), reached its maximum in July (up to 36%; Figure 4A) and decreased thereafter in its relative abundance (to approximately 10%) at the end of September, while the two second most abundant ASVs in 2019 (ASV 14 and 15; Figure 4B) reached their maxima in mid-August and later in the year (see Figure 4A and Table S4a). Similarly, in 2020, ASV7 represented almost 50% of the total relative abundance in early July, but decreased to approximately 6% by mid-August, while the most abundant taxon in the 2020 sampling campaign (ASV4; Figure 4C,D) reached its peak at the end of August (68%) and decreased to approximately 23% by the end of the campaign (Figure 4C). Furthermore, the third most abundant ASV21 in 2020 represented only approximately 1% of the total relative abundance at the beginning of the sampling campaign, but almost 20% at its end (see Figure 4C, Table S4b).
The statistical relevance of the differences in Synechococcus ASV relative abundance was confirmed by a Kruskal–Wallis analysis of variance, with a p-value far below the threshold of 0.05 (p-value of 3.95 × 10⁻¹⁰ and 1.27 × 10⁻⁵ for 2019 and 2020, respectively). In an attempt to group the taxa according to their relative abundance differences, a post hoc Conover–Iman test was performed using a Benjamini Yekutieli p-value adjustment method for False Discovery Rate control (Table S5a,b). For 2019, the results indicated two groups. First, a group comprising ASVs that comparatively stably dominated the cyanobacterial community at the DRM throughout July and October (together 63% to 87% of the total relative abundance); these were ASV13, 14, 15, 28 and 29. A second group statistically differed from the first group (i.e., ASV17, 18, 22, 30 and 33), for which the abundance differences appeared to be larger and/or occurred within shorter time intervals: For example, ASV22 reached its high relative abundance of 15% on only two sampling dates (in September and October, see Figure 4A and Figure S4a), as also discussed above. For 2020, the Conover–Iman test did not significantly separate the ASVs into two groups as for 2019 (Table S5b), although visually (Figure 4D), ASV4 dominated the cyanobacterial community with an average relative abundance of 45% throughout 2020.
2.5. Dynamics of Planktothrix and Microcystis ASVs, the Abundance of Microcystin Biosynthesis Genes and the Concentration of Microcystins in Samples Taken during 2019 and 2020
In both the 2019 and the 2020 amplicon sequencing datasets, we detected two ASVs affiliated to the Planktothrix genus. The relative abundance of Planktothrix ASVs in 2019 increased from July to late September, with a peak on 31 July, where 0.75% of the total cyanobacterial community were Planktothrix ASVs (Figure 5A). Likewise, in 2020, Planktothrix ASVs were abundant from the end of July to the end of September, with a maximum of approximately 2% relative abundance on 21 July (Figure 5B). While one of the Planktothrix ASVs was affiliated to Planktothrix rubescens (a toxin-producing Planktothrix species), the amplicon sequencing of the cyanobacteria-specific 16S rRNA-gene fragments of the other ASVs did not allow for taxonomical distinction at the species level (i.e., between the mostly non-toxin-producing P. agardhii and the toxin-producing P. rubescens). For example, a megablast alignment of the Planktothrix ASVs suggested Planktothrix agardhii and Planktothrix rubescens were the top hits, with identical query coverage and E-values, and percentage identities varying between 99.70% and 100% for P. agardhii, and 99.38% to 99.74% for P. rubescens.
Beyond the Planktothrix ASVs, two ASVs that are affiliated to the Microcystis genus were detected in 2019; however, only one Microcystis ASV was detected in 2020. As both genera, Planktothrix and Microcystis, are renowned for their toxin producing species, more in depth analyses were carried out regarding the toxin producing potential of the species found in the Überlingen embayment.
To confirm the detection of the Planktothrix genus in Lake Constance at very low levels, particularly when compared to Synechococcus, quantitative PCR (qPCR) was performed to estimate the abundance of toxin-producing Planktothrix genotypes. Specifically, we used Planktothrix-specific primer pairs for the 16S rDNA gene and the mcyBA1 gene, as described by Ostermaier and Kurmayer, 2009 (Table 1, [48]). Planktothrix mcyBA1 encodes for the first adenylation domain in non-ribosomal peptide synthase (NRPS) gene clusters, and is present only in species that are capable of toxin production. Briefly, we created a standard curve using a dilution series of Planktothrix DNA (0.00001–100% Planktothrix DNA diluted in Microcystis DNA) and then calculated the relative abundance of Planktothrix DNA in our samples using a linear regression. The calculated relative abundance of Planktothrix ranged between 0.1 and 0.6% in 2019, and 0.1 and 0.01% in 2020 (Figure S3). Although the relative abundance calculated by qPCR differed from the relative abundances that were found with amplicon sequencing (Figure S3 and Figure 5), the trend aligned well between both methods. Statistical analyses of the differences between the 16S-rRNA gene and mcyBA1 amplifications (ANOVA, see Ostermaier and Kurmayer, 2009) showed no significant difference in abundance with respect to toxin-producing or non-toxin-producing Planktothrix genotypes, suggesting that there was only one genotype of Planktothrix present in 2019 and 2020. To confirm the presence of toxin-producing cyanobacterial species in Lake Constance, we used universal mcyE-specific PCR primers (HEPF/R, Table 1, [49]). Being a member of the MC production gene cluster, mcyE is partly responsible for the synthesis of the ADDA chain in microcystins, as well as the incorporation and synthesis of D-Glu [50]. For the 2019 sampling campaign, the PCR yielded amplicons for every sample tested, suggesting the presence of potential microcystin producers throughout the year. The subsequent Sanger sequencing of the PCR products, and analysis of the consensus sequences with megablast, attributed toxin-producing capabilities to Planktothrix species (Figure 5A), except for the sample taken on 24 September 2019, where the mcyE consensus sequence had the highest alignment scores with Microcystis, thus matching the date with the highest relative abundance of the Microcystis-affiliated ASV. For 2020, mcyE amplicons were observed less consistently than in 2019, although, as seen in 2019, Sanger sequencing of these amplicons attributed the toxin-producing capabilities to Planktothrix spp. (Figure 5B).
Collectively, we provide evidence that toxin-producing Planktothrix spp. (and/or Microcystis spp.) are present in the Überlingen embayment of Lake Constance. However, our data did not allow us to conclude whether or not toxin production took place during the sampling campaigns, as many species can carry the gene cluster without actively producing the toxins [51]. Consequently, we analyzed the biomass samples that were collected independently on filters from the DRM for microcystins, using UPLC–MS/MS (Figure 5A,B). Microcystin concentrations peaked at the end of September 2019, where, in total, approximately 1.5 ng/L of intracellular microcystins were found. The microcystin variants present were MC-LR (leucine and arginine in hypervariable region) and MC-YR (leucine and tyrosine in hypervariable region), with MC-LR being almost solely responsible for the peak in toxin concentration in September 2019 (Figure 5A). Strikingly, for the samples collected during 2020, no toxins were detected under the conditions we used.
2.6. Retrospective Evaluation of Depth Profiles for the Lake Überlingen Routine Sampling Site
During our sampling campaigns in 2019 and 2020 (and the ongoing 2021 campaign), prominent DRM were observed from June onwards, particularly after long and stable good weather periods. This is best illustrated on 1 July 2019, when we observed a first prominent DRM at 18.4 m depth at the routine sampling site ‘Wallhausen’, in the Überlingen embayment of Lake Constance. This DRM appeared after the weather presented a stable window of approximately two weeks with predominant sunshine and no precipitation, low wind and elevated temperatures, as depicted in Figures S5, S7 and S8.
Three-dimensional (3D) plots of the FluoroProbe depth profiles for ‘cryptophyta’ content, as proxy, in the water column at 0–40 m depth (Figure 1) across the sampling campaigns in 2019 and 2020 are depicted in Figure 6A. Furthermore, we retrospectively evaluated the ‘cryptophyta’ depth profiles that were collected in the previous years from the routine sampling site, and transformed these into 3D plots using MATLAB (for years 2009–2018, see Supplementary Material, Figure S6). During the last twelve years, DRM have occurred multiple times (Figure S6, plots from 2011 and 2015–2020). Specifically, in 2016, we observed a prominent DRM in the summer, with maximum ‘cryptophyta’ concentrations of 6 µg/L on 6 September and 20 September (Figure 6B). Corresponding to the DRM, the high abundance of Planktothrix rubescens has been reported in various sampling sites at Lake Constance in 2016 [42,43].
Overall, prominent DRM were observed from July to October, with a maximum ‘cryptophyta’ content of approximately 2–4 µg/L (as estimated based on the FluoroProbe calibration), and at water depths ranging between 10 and 20 m (Figure 6A and Figure S6). The observed variation of the DRM depths likely follows the lake’s internal waves, as previously found in Lake Ammer in Germany and Lake Bourget in France [14,52]. Although we could speculate that these peaks represent high abundances of P. rubescens in the Überlingen embayment, the absence of any appropriate samples allowing for DNA or toxin analyses available from that time preclude any corroboration.
3. Discussion
The characterization of the recurring blooms of red-pigmented cyanobacteria in the Überlingen embayment of Lake Constance at water depths of 15–20 m by amplicon sequencing demonstrated the presence of Synechococcus, Planktothrix and Microcystis. Briefly, the relative abundance data suggested that Synechococcus taxa predominated the community (96–98%) at these water depths, while Planktothrix and Microcystis taxa were detectable only in very low abundances. For example, in 2020, up to 45% of the total relative abundance was represented by a single Synechococcus ASV (ASV4; Figure 2B and Figure 4C,D). Moreover, the observed changes in the relative abundance of Synechococcus ASVs across the sampling dates suggest a high degree of successional change within the Synechococcus spp. community at the DRM (Figure 4).
Phycoerythrin-rich Synechococcus species from Lake Constance have been investigated previously [45,53,54], and, similarly to Planktothrix spp., they can express a large variety of phycobilins, thereby exploiting diverse light conditions [45,55]. Interestingly, the highest abundant Synechococcus taxa found in our studies in 2019 and 2020 are closely related to either S. rubescens or C. gracile, forming two main clusters (Figure 3, Table S3a,b). For the 2019 and 2020 sequences, a discrimination between S. rubescens and C. gracile is difficult (Figure 3), as the 380-bp PCR amplicon used in this study is cyanobacteria-specific, and allows us to affiliate taxa with high confidence only up to the genus rank. However, each Synechococcus taxon detected in 2019 is paired with a taxon detected in 2020, and their sequence alignment showed a 100% identity with no gap, suggesting recurring phylotypes/ecotypes, at least across the two years. The close association of our sequences with those from the early 2000s [45] suggests a stable deep water cyanobacterial community in Lake Constance. The latter interpretation is supported by the earlier finding that different lineages of Synechococcus spp. can adapt to, and thrive in, specific ecological niches [56].
The predominance of Synechococcus species over other cyanobacterial genera was reported for the experimental cocultures of Synechococcus and Microcystis strains, as well as varying phosphate and nitrogen concentrations [57,58]. Indeed, at low nutrient concentrations, which could also mirror the currently oligotrophic conditions of Lake Constance [59], Synechococcus outcompeted Microcystis in growth rate and final biomass [57,58]. The predominance of Synechococcus may be explained by its seemingly higher affinity for orthophosphates, more efficient nutrient uptake (due to a larger surface-to-volume ratio), as well as by the potential for competitive inhibition via the quorum sensing/quenching molecules between the two strains [57,58,60,61]. The latter laboratory findings were also corroborated in natural habitats, at least in regards to their trend [62].
Despite the seemingly stable predominance of Synechococcus in the deep water cyanobacterial community observed in Lake Constance over the last two decades [45], the de novo occurrence of Planktothrix spp. in 2016, and the reconfirmation of this earlier finding with our samples in 2019 and 2020, could suggest that Planktothrix spp. is in the process of establishing a stable presence in the Überlingen embayment of Lake Constance. The latter is of critical importance as mass occurrences of toxin-producing cyanobacteria at water depths of >20 m could become a threat to the water intake for the Sipplingen water treatment plant (https://www.bodensee-wasserversorgung.de, accessed on 7 May 2021 [63]) which serves >4 million people with drinking water. Indeed, we detected a low abundance of potentially MC-producing Planktothrix spp. using amplicon sequencing, as well as through Planktothrix-specific qPCR for 2019 and 2020 (Figure 5 and Figure S3). Furthermore, the presence of the microcystin biosynthesis gene cluster, mcy, was detected through the PCR amplification of mcyE (Figure 5). The subsequent Sanger sequencing of these amplicons identified Planktothrix spp. to be the main contributor to this gene sequence in our samples, with the exception of 24 September 2019, when the amplified mcyE consensus sequence identified the highest alignment scores in Microcystis spp. In Planktothrix spp., the mcy gene cluster can be inactivated by various mutations, including insertions or deletions, and, thus, non-toxic strains can develop [64]. Non-toxic strains are less successful in competition than their toxic relatives, and, thus, Planktothrix blooms are usually dominated by toxic strains [48]. Corresponding to the presence of mcyE in 2019, low amounts of the microcystins MC-LR and MC-YR were detected using UPLC–MS/MS. In 2020, although mcyE amplicons were detectable in some of our samples, concentrations of microcystins were below the detection levels of the UPLC–MS/MS that was used (LOD of UPLC–MS/MS method: 0.5 ng/mL [65]; therefore, the resulting LOD in our water samples: 62 pg/L lake water). Despite the low abundance of Planktothrix spp. and the low concentrations of detected toxins, the question does arise concerning whether the latter is a sign of a fundamental change in water body dynamics in the Überlingen embayment of Lake Constance (e.g., resulting from global warming). Indeed, the greater and prolonged stratification of water bodies, in conjunction with lowered nutrient levels, would promote a deep water euphotic ecosystem encompassing low-light specialized species, such as the picocyanobacterial Synechoccocus spp. and Planktothrix spp. [9,15], as was reported for other prealpine lakes (e.g., Lake Zurich [4], Lake Mondsee [8] and Lake Bourget [6]).
As Planktothrix spp. are stimulated by increased temperatures [15], the continuous shift toward higher overall temperatures could favor the perseverant establishment of toxin-producing Planktothrix spp., to the disadvantage of today’s Synechococcus-dominated DRM ecosystems. Considering that Synechococcus spp. are currently markedly outcompeting other cyanobacterial species occurring at these water depths, this may suggest that the allelopathic compounds from Synechococcus spp. can have an adverse effect on co-occurring species. Indeed, such effects have been observed for freshwater Synechococcus spp., which were able to impact the growth of other freshwater cyanobacteria or green algae [66,67]. Adverse effects caused by allelopathic compounds from marine Synechococcus spp. were also observed on various marine invertebrates [68], as well as other bacterial species [60]. In conclusion, the described effects indicate the widespread production of allelopathic compounds by Synechococcus species that can even influence other bacteria, plants and invertebrates.
In most cases, the co-occurrence of species occupying the same, or similar, ecological niche leads to the dominance of one species, largely depending on the individual species’ competitive advantages (e.g., nitrogen fixation, uptake of inorganic phosphorus, regulation of buoyancy, allelopathic compounds, etc.), as also shown by Weisbrod et al. [69]. This suggests that, if Synechococcus outcompetes Planktothrix in its ecological niche, allelopathic compounds (such as toxins), amongst other factors, may be used to compete against the respective other species. Indeed, allelopathic activity is one of the major competitive strategies of freshwater Synechococcus against coexisting phytoplankton species [66], further supporting the potential role of picocyanobacterial exudates in competition with other cyanobacteria, such as Planktothrix. Counterintuitively, some freshwater Synechococcus spp. possess a positive allelopathic activity towards Microcystis spp., and no effect on Phormidium spp., whereby Phormidium spp. (like Planktothrix spp.) is part of Oscillatoriaceae [66], suggesting that Synechococcus spp. could even promote the growth of toxin-producing species. The complex interplay of species in competition in Lake Constance emphasizes the need for further studies regarding the co-occurrence and dominance of Synechococcus spp., relative to Planktothrix and Microcystis spp. in this lake.
The geographical setting of the Überlingen embayment of Lake Constance, with its minor wind influence (Figures S7 and S8), is considered an additional factor that could favor the continuous development of deep water Planktothrix spp. populations. Indeed, light winds and convective mixing are highly important in the seasonal cycling of P. rubescens communities within a strongly stratified medium-sized lake [70]. In consequence, this means that toxin-producing Planktothrix spp. could possibly establish themselves as a dominant cyanobacteria species at deeper water levels, and may become a relevant concern for the quality of the Überlingen embayment of Lake Constance as a drinking water resource in the not too distant future.
4. Conclusions
Our study characterized the deep water red pigment maxima (DRM) in the Überlingen embayment of Lake Constance in 2019 and 2020 as being dominated by phycoerythrin-rich picocyanobacterial; namely, Synechococcus rubescens and Cyanobium gracile. Unlike other prealpine lakes, the DRM in Lake Constance is not dominated by the phycoerythrin-rich, filamentous and often toxin-producing Planktothrix rubescens. Indeed, the alignment of our results with the sequences from the Ernst et al. study (2003) demonstrates high sequence similarity, and suggests that the same species have been dominant at 15–20 m depth in Lake Constance for the past 20 years. However, we confirmed the reports from 2016 that Planktothrix spp. does occur in Lake Constance in the years 2019 and 2020, albeit at very low relative abundances. Nevertheless, microcystin concentrations of up to 1.5 ng/L were detected through UPLC–MS/MS in 2019, which appeared to be produced by Planktothrix and/or Microcystis spp. Hence, at present, Lake Constance seems to have a rather stable deep water cyanobacterial ecosystem, predominated by Synechococcus spp., although the geographical setting, as well as the continued climate warming, could favor the development and steady predominance of toxin-producing Planktothrix spp. This highlights the importance of a future monitoring program for Lake Constance, with emphasis on sequencing-based cyanobacterial community studies and microcystin monitoring, as well as the importance of competition studies regarding the different cyanobacterial taxa in relation to the physiochemical and biological parameters of the lake, particularly in respect to the ongoing climate change. Monitoring programs and hypothesis-driven competition studies may provide the required database to predict future deep water mass occurrences of toxin-producing cyanobacteria and, thus, help to secure Lake Constance as the drinking water resource for millions of people in the future.
5. Materials and Methods
5.1. Sample Collection
Samples were taken every two weeks from 1 July to 8 October in 2019, and 7 July to 15 September in 2020. The initial sampling in 2019 included only one replicate/day, while samples were collected in biological triplicates (n = 3) during 2020. A bbe Moldaenke FluoroProbe (FP) (SN: 01709; recalibrated at bbe in 2009, 2012, 2016 and 2019) was used to determine the deep red maximum (DRM). Samples were collected at that depth every other week in Upper Lake Constance (47.7571° N 9.1273° E), using a messenger-released Free Flow Water Sampler 5 L (HYDRO-BIOS, Altenholz, Germany). An overview of the samples taken during this study is illustrated in Table S1. Water was filtered through a 180 µm nylon net filter to exclude zooplankton and larger particles. Two liters of water were then filtered on one Whatman GF6 glass fiber filter while applying 2 bars pressure for the collection of plankton biomass. Filters were stored at −20 °C until analysis. This sampling method was applied to DNA extractions in 2019, and toxin extractions in 2019 and 2020. In 2020, DNA samples were collected independently (n = 3) on 0.2 µm polycarbonate filters.
5.2. DNA Extraction and PCR
DNA from the 2019 samples was extracted using the ZYMO Research Fecal/Soil/Microbe Microprep kit, following the manufacturer’s instructions. DNA of 2020 samples was extracted using a phenol/chloroform/isoamylalcohol protocol, adapted from Rusch et al., [71] and the JGI protocol [72]. Standard PCR was performed with Taq polymerase, using 2X Taq MasterMix (NEB) and 30 cycles. The microcystin synthesis gene, mcyE, was amplified with the HEPF/R primer set [49], and DNA from cultured Microcystis aeruginosa strain 78 was used as a positive control for the presence of mcyE. Planktothrix-specific primer pairs PcPI+/− (PC-IGS) and peamso+/− (mcyA) [8] were used for additional PCR reactions, with Microcystis aeruginosa strain 78 genomic DNA as a negative control, and Planktothrix rubescens strain 101 genomic DNA as a positive control.
5.3. RT-PCR/TNA
Quantitative Taq Nuclease Assays (TNA or TaqMan PCR) were performed with primers specific to Planktothrix spp. [48]. We quantified both Planktothrix-specific 16S rDNA and mcyBA1, which encodes the first adenylation domain of mcyB, and is indicative of all genotypes containing the mcy gene cluster. Both probes contained 5′ FAM as a fluorescent marker and 3′ TAMRA as a quencher dye. Each reaction contained 50 ng template DNA, 200 nM of primers and probes, and KAPA probe fast MasterMix. Amplification and quantification were carried out in triplicates in a Bio-Rad CFX96 cycler with the following protocol: 10 min at 95 °C to activate the hot start polymerase, followed by 50 cycles of 15 s at 95 °C, 60 s at 51.5 °C for 16S, 60 s at 57 °C for mcyBA1, 60 s at 68 °C and a final elongation for 5 min at 68 °C. The standard curve contained Planktothrix DNA mixed with Microcystis DNA in different ratios (0.00001–100% Planktothrix DNA diluted in Microcystis DNA). Data analysis using linear regression from the standard curve was performed using BioRad CFX manager, Microsoft Excel and GraphPad Prism 5.
5.4. Sanger Sequencing
Sanger sequencing was performed with the amplicons produced by the HEPF/R primer pair to identify the main microcystin producer in the samples. PCR amplicons were purified using a QIAquick PCR cleanup kit and sent to Eurofins Genomics for analysis. The identity of the obtained sequences was determined using Nucleotide BLAST megablast [73].
5.5. Amplification and Illumina Sequencing
Amplification of the V3–V5 hypervariable regions, and the cyanobacterial-specific V3–V4 hypervariable regions of the 16S rRNA gene, was performed with 0.02 U/µL of Phusion High Fidelity DNA polymerase, 1X Phusion HF Buffer, 200 µM of dNTPs (New England Biolabs, USA) and 0.5 µM of each primer. Primers targeting the V3–V5 hypervariable regions were 357F and 926R [74,75]. Cyanobacteria-specific primers were CYA359F and CYA784R [44]. Each PCR comprised an initial denaturation step of 3 min at 98 °C, followed by 30 cycles of denaturation for 45 s at 98 °C, annealing for 20 s at 62.4 °C (V3–V5) or 60 °C (cyanobacteria-specific) and extension for 8 s at 72 °C, and a final extension step for 5 min at 72 °C. Extracted DNA was added at a final concentration of 0.12 ng/µL. No purification step was performed; the PCR products were directly sent to Eurofins Genomics for sequencing using Illumina MiSeq 2 × 300 bp with the Microbiome Profiling Indexing only package. The data presented in this study are accessible on NCBI under the bioproject number PRJNA727470.
5.6. Bioinformatics Pipeline
The analysis was carried out using the already merged dataset provided by Eurofins Genomics, Konstanz, Germany. The expected fragment sizes were 569 bp for the V3–V5 amplicon and 425 bp for the V3–V4 cyanobacterial-specific amplicon. Reads were first trimmed using Trimmomatic [76], removing all reads with a Phred quality below 3 for the start and the end of the reads, below an average quality of 10 on a window of 3 base within the reads, and below a size of 500 bp for the V3–V5 amplicons and 380 bp for the V3–V4 amplicons. FastQC was used for quality control of the reads before and after trimming [77]. The following steps were performed using QIIME2 2019.10 [78]. Filtration of chimeras using the consensus method, denoising and dereplication of the quality reads were performed using the denoise and dereplicate single-end sequences (Dada2, denoise-single) and a reads learn of 2,000,000 reads for the training error model [79]. Quality trimming had already been performed using Trimmomatic, so no trimming step was performed here. Taxonomic affiliation was achieved using the classify-consensus-vsearch program and the databases SILVA_138 and Greengenes, with a percentage identity of 80%, 90%, 97% and 100%. Taxonomic results were merged and the highest percentage identity taxonomic affiliation was retained. Reference databases were previously trained using the feature-classifier extract-reads script with the sequences of the primers used for the amplification of the hypervariable regions. After training, the databases only contained the part of interest of the 16S rRNA gene for taxonomic assignation, V3–V5 hypervariable regions for the general 16S rRNA gene amplification and V3–V4 hypervariable regions for the cyanobacteria-specific primers. Taxonomy was mostly consistent between the SILVA_138 and Greengenes databases.
5.7. Phylogenetic Analysis
A megablast (highly similar sequence) was performed on the sequences affiliated to the genera Planktothrix, Microcystis and the most abundant Synechococcus using the 16S rRNA sequences reference database on NCBI. The top ten hit sequences and the description table were extracted. The Synechococcus sequences from Lake Constance analyzed and sequenced by Anneliese Ernst [45] were downloaded from the NCBI database. Two other 16S rRNA gene sequences, belonging to Synechococcus rubescens and Cyanobium gracile, were also collected from NCBI and used as reference for the phylogenetic analysis, as previously carried out by Anneliese Ernst. The collected dataset was then compared to the most abundant Synechococcus sequences in 2019–2020. Sequences were merged with our sequences into a fasta file and aligned using SeaView [80]. IQ-TREE 2.1.2 [46] was used to calculate the phylogenetic tree by maximum likelihood using 1000 bootstrap parameters. The model of nucleotide substitution used was TPM2+I+F [46], determined as the best fit model by ModelFinder [47], based on the Bayesian information criterion scores and weights. The tree was visualized on R using the package ggtree [81].
5.8. Statistical and Network Analysis
Statistical analysis was performed with R software [82], using the package Phyloseq [83], vegan [84] and visualized with the package ggplot2 [85]. Features represented by less than 3 reads in below 20% of the samples were discarded. Chloroplast-affiliated features were removed from both datasets, bacteria-affiliated taxa were also removed from the cyanobacterial-specific dataset only. No rarefaction has been applied to the dataset [86]. After filtration, the lowest number of reads in a sample was 19,175 for the cyanobacteria-specific dataset and 24,329 for the general 16S rDNA dataset in 2019. The 2020 dataset consisted of only the cyanobacteria-specific amplicon and the lowest number of reads was 24,341. This number of reads instilled confidence in catching all the richness present in our dataset, as the rarefaction curves showed that we were in the stationary phase of the curve. The read count matrix was transformed in relative abundance by dividing the reads affiliated to one taxa by the total number of reads in the sample (x/sum(x)), and a logarithmic transformation was also applied. To avoid the presence of 0 in the matrix, one artificial read was added to each cells of the data (Log10(x + 1)). Alpha diversity was analyzed using the Observed richness, Pielou’s evenness index, Shannon diversity index and the Inverted Simpson diversity index. Community composition was observed using barplot, jitter plot and krona plot, using the relative abundance data and heatmap with the Log10 transformed data. Statistical analyses were performed using a non-parametrical statistical test, as sequencing data did not fulfill the parametric test requirements (e.g., data normality and homoscedasticity, and independence of observation) using a p-value and False discovery rate threshold of 0.05. Kruskall–Wallis one-way analysis of variance was performed on the relative abundance sub-data of the main Synechococcus taxa to test if at least one taxa dominated the community. The hypothesis that the relative abundance distribution of the tested taxa are equal was the null hypothesis (H0) and the alternative hypothesis (H1) was that the relative abundance distribution of the tested taxa are not equal. If the Kruskall–Wallis test rejected H0, a post hoc test using the Conover–Iman squared rank test, with a Benjamini Yekutieli p-value adjustment procedure, was performed to determine which taxon or group of taxa dominate the community. The Benjamini Yekutieli procedure was chosen for p value adjustment because of the dependency between the taxa’s relative abundance observation. Barplots of the taxa of interest (Planktothrix spp., Microcystis spp., Synechococcales) and correlation observation of the main node from the network analysis were produced.
5.9. Toxin Extraction and Analysis
Toxins were extracted from filters using a methanolic extraction method and were, subsequently, analyzed via UPLC–MS/MS [24,65]. Briefly, 3 mL 50% (v/v) aqueous methanol was added to each filter and soaked for 30 min at room temperature. After vigorous mixing (vortex) for 10 min, samples were sonicated in an ultrasonic bath for 15 min, before centrifugation at 4000 × g for 10 min. The supernatant was collected in a separate tube and the above steps, excluding the initial 30 min soaking time, were repeated twice with the remaining pellet. The pooled supernatant was dried overnight using a speed vacuum system (Univapo 100H) and resuspended in 250 µL 50% aqueous methanol. Toxin samples were stored in glass vials at −20 °C until analysis.
Concentrations of different MCs were measured via UPLC–MS/MS, with an internal standard containing deuterated MC-LR and MC-LF (D5-MC-LF and D7-MC-LR) [24,65,87]. Three different MCs, MC-RR, MC-YR and MC-LR were used as external standards for analysis, with final concentrations of 2, 10 and 100 ng/mL. An Acquity H-class liquid chromatograph and a Waters XEVO TQ-S mass spectrometer were used. For UPLC, an Acquity BEH C18 1.7 µm column (2.1 × 50 mm) with a corresponding guard column, each kept at 40 °C, was used. Solvents A and B were composed of 10% and 90% acetonitrile, respectively, 100 mM formic acid and 6 mM NH3. Initial conditions were 25% B, held for 30 s, then 45% B within 30 s, 60% B within 180 s and 99% B within 12 s, which was held again for 30 s. The flow rate was 0.4 mL/min. Prior to application of the next sample, the column was re-equilibrated to 25% B over 78 s and held for 60 s. Injection volume was 5 µL. As described in Altaner et al., 2019, simultaneous analysis of MC congeners was carried out using five analysis windows, maximizing the scan time for each congener [65].
5.10. Evaluation of bbe Moldaenke FluoroProbe Data
For data acquisition, the Moldaenke FluoroProbe (FP) was slowly lowered (approximately 0.2 m/s) from the water surface to 100 m depth using a winch, then quickly pulled up again, while collecting data both ways. FP data was preprocessed and later plotted in 3D plots using MATLAB R2020a [88]. The datasets were chopped above 1 m depth and below 100 m depth and subsequently sorted. Data were interpolated to 0.1 m steps, and 570 nm fluorescence measurements and cryptophyta content (µg/L) data were extracted. Plotting was carried out using the MATLAB standard functions surf (3D) and plot (2D), and peaks were analyzed using max.
Supplementary Materials
The following are available online at https://0-www-mdpi-com.brum.beds.ac.uk/article/10.3390/toxins13090666/s1, Figure S1: Common microcystin structure; Figure S2: Illustration of red colored filters; Figure S3: Relative abundance as quantified with qPCR; Figure S4: Localization of study site; Figure S5: Depiction of stable weather window prior to 1 July 2019; Figure S6: Depiction of depth profiles for 2009–2020; Figures S7 and S8: Mean wind speed and directions around the study site; Table S1: Sampling dates with corresponding sampling depths; Table S2: Assignment of ASVs with SILVA and Greengenes databases; Table S3: NCBI megablast of C. gracile and S. rubescens in 2019 and 2020; Table S4: Relative abundance of Synechococcus ASVs per date in 2019 and 2020; Table S5: Conover–Iman test of Synechococcus ASVs in 2019 and 2020.
Author Contributions
Conceptualization, E.R., C.F., D.R.D. and D.S.; methodology, E.R. and C.F.; formal analysis, E.R. and C.F; data curation, E.R. and C.F.; writing—original draft preparation, E.R. and C.F; writing—review and editing, D.R.D. and D.S.; project administration, D.R.D. and D.S.; funding acquisition, D.R.D. and D.S. All authors have read and agreed to the published version of the manuscript.
Funding
This research was funded by DFG Research Training Group R3—Responses to biotic and abiotic Changes, Resilience and Reversibility of Lake Ecosystems (GRK 2272) and MTU Friedrichshafen GmbH (MTU Umweltstiftung).
Data Availability Statement
The Illumina sequence data presented in this study is accessible at NCBI under the bioproject number PRJNA727470.
Acknowledgments
We would like to highlight the excellent support received from Julia Schmidt, Microbial Ecology and Limnic Microbiology, with regard to DNA extraction from samples she helped to organize from the Überlinger embayment. The assistance with UPLC-MS/MS by Sarah Krassnig and Aswin Mangerich and the help in the laboratory by Leon Walther is thankfully acknowledged. We would also like to thank Beatrix Rosenberg for access to long-term data and Alfred Sulger, Angelika Seifried, Pia Mahler and Josef Halder at the Limnological Institute of University of Konstanz for managing the ship cruises, and Anneliese Ernst for helpful discussions. Further, we would like to thank the MTU Umweltstiftung and all members of the RTG-R3, especially Tina Romer and Frank Peeters, for their support.
Conflicts of Interest
The authors declare no conflict of interest.
References
- Huisman, J.; Codd, G.A.; Paerl, H.W.; Ibelings, B.W.; Verspagen, J.M.H.; Visser, P.M. Cyanobacterial blooms. Nat. Rev. Microbiol. 2018, 16, 471–483. [Google Scholar] [CrossRef] [PubMed]
- Mantzouki, E.; Campbell, J.; van Loon, E.; Visser, P.; Konstantinou, I.; Antoniou, M.; Giuliani, G.; Machado-Vieira, D.; de Oliveira, A.G.; Maronić, D.Š.; et al. A European multi lake survey dataset of environmental variables, phytoplankton pigments and cyanotoxins. Sci. Data 2018, 5, 1–13. [Google Scholar] [CrossRef] [Green Version]
- Rücker, J.; Wiedner, C.; Zippel, P. Factors controlling the dominance of Planktothrix agardhii and Limnothrix redekei in eutrophic shallow lakes. Hydrobiologia 1997, 342–343, 107–115. [Google Scholar] [CrossRef]
- Van den Wyngaert, S.; Salcher, M.M.; Pernthaler, J.; Zeder, M.; Posch, T. Quantitative dominance of seasonally persistent filamentous cyanobacteria (Planktothrix rubescens) in the microbial assemblages of a temperate lake. Limnol. Oceanogr. 2011, 56, 97–109. [Google Scholar] [CrossRef] [Green Version]
- Walsby, A.E.; Schanz, F. Light-dependent growth rate determines changes in the population of Planktothrix rubescens over the annual cycle in lake Zürich, Switzerland. New Phytol. 2002, 154, 671–687. [Google Scholar] [CrossRef]
- Jacquet, S.; Briand, J.F.; Leboulanger, C.; Avois-Jacquet, C.; Oberhaus, L.; Tassin, B.; Vinçon-Leite, B.; Paolini, G.; Druart, J.C.; Anneville, O.; et al. The proliferation of the toxic cyanobacterium Planktothrix rubescens following restoration of the largest natural French lake (Lac du Bourget). Harmful Algae 2005, 4, 651–672. [Google Scholar] [CrossRef] [Green Version]
- Salmaso, N. Long-term phytoplankton community changes in a deep subalpine lake: Responses to nutrient availability and climatic fluctuations. Freshw. Biol. 2010, 55, 825–846. [Google Scholar] [CrossRef]
- Kurmayer, R.; Christiansen, G.; Fastner, J.; Börner, T. Abundance of active and inactive microcystin genotypes in populations of the toxic cyanobacterium Planktothrix spp. Environ. Microbiol. 2004, 6, 831–841. [Google Scholar] [CrossRef]
- Posch, T.; Köster, O.; Salcher, M.M.; Pernthaler, J. Harmful filamentous cyanobacteria favoured by reduced water turnover with lake warming. Nat. Clim. Change 2012, 2, 809–813. [Google Scholar] [CrossRef] [Green Version]
- Kurmayer, R.; Jüttner, F. Strategies for the co-existence of zooplankton with the toxic cyanobacterium Planktothrix rubescens in Lake Zurich. J. Plankton Res. 1999, 21, 659–683. [Google Scholar] [CrossRef]
- Kurmayer, R.; Deng, L.; Entfellner, E. Role of toxic and bioactive secondary metabolites in colonization and bloom formation by filamentous cyanobacteria Planktothrix. Harmful Algae 2016, 54, 69–86. [Google Scholar] [CrossRef] [Green Version]
- Salcher, M.M.; Pernthaler, J.; Frater, N.; Posch, T. Vertical and longitudinal distribution patterns of different bacterioplankton populations in a canyon-shaped, deep prealpine lake. Limnol. Oceanogr. 2011, 56, 2027–2039. [Google Scholar] [CrossRef] [Green Version]
- Walsby, A.E.; Ng, G.; Dunn, C.; Davis, P.A. Comparison of the depth where Planktothrix rubescens stratifies and the depth where the daily insolation supports its neutral buoyancy. New Phytol. 2004, 162, 133–145. [Google Scholar] [CrossRef]
- Cuypers, Y.; Vinçon-Leite, B.; Groleau, A.; Tassin, B.; Humbert, J.F. Impact of internal waves on the spatial distribution of Planktothrix rubescens (cyanobacteria) in an alpine lake. ISME J. 2011, 5, 580–589. [Google Scholar] [CrossRef] [PubMed]
- Paerl, H.W.; Huisman, J. Climate: Blooms like it hot. Science 2008, 320, 57–58. [Google Scholar] [CrossRef] [Green Version]
- Wejnerowski, Ł.; Rzymski, P.; Kokociński, M.; Meriluoto, J. The structure and toxicity of winter cyanobacterial bloom in a eutrophic lake of the temperate zone. Ecotoxicology 2018, 27, 752–760. [Google Scholar] [CrossRef] [Green Version]
- Legnani, E.; Copetti, D.; Oggioni, A.; Tartari, G.; Palumbo, M.T.; Morabito, G. Planktothrix rubescens’ seasonal dynamics and vertical distribution in Lake Pusiano (North Italy). J. Limnol. 2005, 64, 61–73. [Google Scholar] [CrossRef]
- Walls, J.T.; Wyatt, K.H.; Doll, J.C.; Rubenstein, E.M.; Rober, A.R. Hot and toxic: Temperature regulates microcystin release from cyanobacteria. Sci. Total Environ. 2018, 610–611, 786–795. [Google Scholar] [CrossRef]
- Kleinteich, J.; Wood, S.A.; Küpper, F.C.; Camacho, A.; Quesada, A.; Frickey, T.; Dietrich, D.R. Temperature-related changes in polar cyanobacterial mat diversity and toxin production. Nat. Clim. Change 2012, 2, 356–360. [Google Scholar] [CrossRef]
- Komárek, J.; Anagnostidis, K. Bd. 2/Part 2: Oscillatoriales. In Süßwasserflora von Mitteleuropa, Bd. 19/2: Cyanoprokaryota; Springer: Berlin/Heidelberg, Germany, 2005; p. 759. ISBN 978-3-8274-1914-9. [Google Scholar]
- Buratti, F.M.; Manganelli, M.; Vichi, S.; Stefanelli, M.; Scardala, S.; Testai, E.; Funari, E. Cyanotoxins: Producing organisms, occurrence, toxicity, mechanism of action and human health toxicological risk evaluation. Arch. Toxicol. 2017, 91, 1049–1130. [Google Scholar] [CrossRef]
- Jang, M.H.; Ha, K.; Joo, G.J.; Takamura, N. Toxin production of cyanobacteria is increased by exposure to zooplankton. Freshw. Biol. 2003, 48, 1540–1550. [Google Scholar] [CrossRef]
- Jang, M.H.; Jung, J.M.; Takamura, N. Changes in microcystin production in cyanobacteria exposed to zooplankton at different population densities and infochemical concentrations. Limnol. Oceanogr. 2007, 52, 1454–1466. [Google Scholar] [CrossRef]
- Weisbrod, B.; Riehle, E.; Helmer, M.; Martin-Creuzburg, D.; Dietrich, D.R. Can toxin warfare against fungal parasitism influence short-term Dolichospermum bloom dynamics? A field observation. Harmful Algae 2020, 99, 101915. [Google Scholar] [CrossRef] [PubMed]
- Davis, T.W.; Berry, D.L.; Boyer, G.L.; Gobler, C.J. The effects of temperature and nutrients on the growth and dynamics of toxic and non-toxic strains of Microcystis during cyanobacteria blooms. Harmful Algae 2009, 8, 715–725. [Google Scholar] [CrossRef]
- Dziallas, C.; Grossart, H.P. Increasing oxygen radicals and water temperature select for toxic Microcystis sp. PLoS ONE 2011, 6. [Google Scholar] [CrossRef] [Green Version]
- Berry, M.A.; Davis, T.W.; Cory, R.M.; Duhaime, M.B.; Johengen, T.H.; Kling, G.W.; Marino, J.A.; Den Uyl, P.A.; Gossiaux, D.; Dick, G.J.; et al. Cyanobacterial harmful algal blooms are a biological disturbance to Western Lake Erie bacterial communities. Environ. Microbiol. 2017, 19, 1149–1162. [Google Scholar] [CrossRef]
- Bingham, M.; Sinha, S.K.; Lupi, F. Economic Benefits of Reducing Harmful Algal Blooms in Lake Erie; Environmental Consulting & Technology Inc.: Gainesville, FL, USA, 2015. [Google Scholar]
- Spoof, L.; Catherine, A. Appendix 3: Tables of microcystins and nodularins. In Handbook of Cyanobacterial Monitoring and Cyanotoxin Analysis; John Wiley & Sons, Ltd.: Chichester, UK, 2017; pp. 526–537. [Google Scholar]
- Bouaïcha, N.; Miles, C.O.; Beach, D.G.; Labidi, Z.; Djabri, A.; Benayache, N.Y.; Nguyen-Quang, T. Structural diversity, characterization and toxicology of microcystins. Toxins 2019, 11, 714. [Google Scholar] [CrossRef] [Green Version]
- Tillett, D.; Dittmann, E.; Erhard, M.; von Döhren, H.; Börner, T.; Neilan, B.A. Structural organization of microcystin biosynthesis in Microcystis aeruginosa PCC7806: An integrated peptide-polyketide synthetase system. Chem. Biol. 2000, 7, 753–764. [Google Scholar] [CrossRef] [Green Version]
- Eriksson, J.E.; Toivola, D.; Meriluoto, J.; Karaki, H.; Han, Y.G.; Hartshorne, D. Hepatocyte deformation induced by cyanobacterial toxins reflects inhibition of protein phosphatases. Biochem. Biophys. Res. Commun. 1990, 173, 1347–1353. [Google Scholar] [CrossRef]
- MacKintosh, C.; Beattie, K.A.; Klumpp, S.; Cohen, P.; Codd, G.A.; MacKintosh, C.; Codd, G.A.; Klumpp, S.; Beattie, K.A. Cyanobacterial microcystin-LR is a potent and specific inhibitor of protein phosphatases 1 and 2A from both mammals and higher plants. FEBS Lett. 2002, 264, 187–192. [Google Scholar] [CrossRef] [Green Version]
- MacKintosh, R.W.; Dalby, K.N.; Campbell, D.G.; Cohen, P.T.; Cohen, P.; MacKintosh, C. The cyanobacterial toxin microcystin binds covalently to cysteine-273 on protein phosphatase 1. FEBS Lett. 1995, 371, 236–240. [Google Scholar] [CrossRef] [Green Version]
- Feurstein, D.J.; Holst, K.; Fischer, A.; Dietrich, D.R. Oatp-associated uptake and toxicity of microcystins in primary murine whole brain cells. Toxicol. Appl. Pharmacol. 2009, 234, 247–255. [Google Scholar] [CrossRef] [Green Version]
- Fischer, A.; Hoeger, S.J.; Stemmer, K.; Feurstein, D.J.; Knobeloch, D.; Nussler, A.; Dietrich, D.R. The role of organic anion transporting polypeptides (OATPs/SLCOs) in the toxicity of different microcystin congeners in vitro: A comparison of primary human hepatocytes and OATP-transfected HEK293 cells. Toxicol. Appl. Pharmacol. 2010, 245, 9–20. [Google Scholar] [CrossRef] [PubMed] [Green Version]
- Catherine, A.; Quiblier, C.; Yéprémian, C.; Got, P.; Groleau, A.; Vinçon-Leite, B.; Bernard, C.; Troussellier, M. Collapse of a Planktothrix agardhii perennial bloom and microcystin dynamics in response to reduced phosphate concentrations in a temperate lake. FEMS Microbiol. Ecol. 2008, 65, 61–73. [Google Scholar] [CrossRef] [PubMed] [Green Version]
- Yéprémian, C.; Gugger, M.F.; Briand, E.; Catherine, A.; Berger, C.; Quiblier, C.; Bernard, C. Microcystin ecotypes in a perennial Planktothrix agardhii bloom. Water Res. 2007, 41, 4446–4456. [Google Scholar] [CrossRef] [PubMed]
- WHO. Cyanobacterial Toxins: Microcystins—Background Document for Development of WHO Guidelines for Drinking-Water Quality and Guidelines for Safe Recreational Water Environments; WHO: Geneva, Switzerland, 2020. [Google Scholar]
- Hoeger, S.J.; Dietrich, D.R.; Hitzfeld, B.C. Effect of ozonation on the removal of cyanobacterial toxins during drinking water treatment. Environ. Health Perspect. 2002, 110, 1127–1132. [Google Scholar] [CrossRef] [Green Version]
- Hoeger, S.J.; Shaw, G.; Hitzfeld, B.C.; Dietrich, D.R. Occurrence and elimination of cyanobacterial toxins in two Australian drinking water treatment plants. Toxicon 2004, 43, 639–649. [Google Scholar] [CrossRef] [Green Version]
- IGKB. Bericht Nr. 42: Limnologischer Zustand des Bodensees; Internationale Gewässerschutzkommission für den Bodensee (IGKB): Baden, Germany, 2018. [Google Scholar]
- Konstanz, S. Burgunderblut-Alge breitet sich im Bodensee aus. Südkurier, 28 March 2017; p. H1. [Google Scholar]
- Nübel, U.; Garcia-Pichel, F.; Muyzer, G. PCR primers to amplify 16S rRNA genes from cyanobacteria. Appl. Environ. Microbiol. 1997, 63, 3327–3332. [Google Scholar] [CrossRef] [PubMed] [Green Version]
- Ernst, A.; Becker, S.; Wollenzien, U.I.A.; Postius, C. Ecosystem-dependent adaptive radiations of picocyanobacteria inferred from 16S rRNA and ITS-1 sequence analysis. Microbiology 2003, 149, 217–228. [Google Scholar] [CrossRef] [PubMed] [Green Version]
- Minh, B.Q.; Schmidt, H.A.; Chernomor, O.; Schrempf, D.; Woodhams, M.D.; von Haeseler, A.; Lanfear, R.; Teeling, E. IQ-TREE 2: New Models and Efficient Methods for Phylogenetic Inference in the Genomic Era. Mol. Biol. Evol. 2020, 37, 1530–1534. [Google Scholar] [CrossRef] [PubMed] [Green Version]
- Kalyaanamoorthy, S.; Minh, B.Q.; Wong, T.K.F.; von Haeseler, A.; Jermiin, L.S. ModelFinder: Fast model selection for accurate phylogenetic estimates. Nat. Methods 2017, 14, 587–589. [Google Scholar] [CrossRef] [Green Version]
- Ostermaier, V.; Kurmayer, R. Distribution and abundance of nontoxic mutants of cyanobacteria in lakes of the Alps. Microb. Ecol. 2009, 58, 323–333. [Google Scholar] [CrossRef] [PubMed] [Green Version]
- Jungblut, A.D.; Neilan, B.A. Molecular identification and evolution of the cyclic peptide hepatotoxins, microcystin and nodularin, synthetase genes in three orders of cyanobacteria. Arch. Microbiol. 2006, 185, 107–114. [Google Scholar] [CrossRef] [PubMed]
- Christiansen, G.; Fastner, J.; Erhard, M.; Börner, T.; Dittmann, E. Microcystin biosynthesis in Planktothrix: Genes, evolution, and manipulation. J. Bacteriol. 2003, 185, 564–572. [Google Scholar] [CrossRef] [PubMed] [Green Version]
- Beversdorf, L.J.; Chaston, S.D.; Miller, T.R.; McMahon, K.D. Microcystin mcyA and mcyE gene abundances are not appropriate indicators of microcystin concentrations in lakes. PLoS ONE 2015, 10, e0125353. [Google Scholar] [CrossRef] [PubMed]
- Hingsamer, P.; Peeters, F.; Hofmann, H. The consequences of internal waves for phytoplankton focusing on the distribution and production of Planktothrix rubescens. PLoS ONE 2014, 9. [Google Scholar] [CrossRef]
- Weisse, T. Dynamics of autotrophic picoplankton in lake Constance. J. Plankton Res. 1988, 10, 1179–1188. [Google Scholar] [CrossRef]
- Weisse, T.; Kenter, U. Ecological Characteristics of Autotrophic Picoplankton in a Prealpine Lake. Int. Rev. Gesamten. Hydrobiol. Hydrogr. 1991, 76, 493–504. [Google Scholar] [CrossRef]
- Six, C.; Thomas, J.C.; Garczarek, L.; Ostrowski, M.; Dufresne, A.; Blot, N.; Scanlan, D.J.; Partensky, F. Diversity and evolution of phycobilisomes in marine Synechococcus spp.: A comparative genomics study. Genome Biol. 2007, 8, R259. [Google Scholar] [CrossRef]
- Salazar, V.W.; Tschoeke, D.A.; Swings, J.; Cosenza, C.A.; Mattoso, M.; Thompson, C.C.; Thompson, F.L. A new genomic taxonomy system for the Synechococcus collective. Environ. Microbiol. 2020, 22, 4557–4570. [Google Scholar] [CrossRef]
- Tan, X.; Gu, H.; Ruan, Y.; Zhong, J.; Parajuli, K.; Hu, J. Effects of nitrogen on interspecific competition between two cell-size cyanobacteria: Microcystis aeruginosa and Synechococcus sp. Harmful Algae 2019, 89, 101661. [Google Scholar] [CrossRef] [PubMed]
- Tan, X.; Gu, H.; Zhang, X.; Parajuli, K.; Duan, Z. Effects of phosphorus on interspecific competition between two cell-size cyanobacteria: Synechococcus sp. and Microcystis aeruginosa. Bull. Environ. Contam. Toxicol. 2019, 102, 231–238. [Google Scholar] [CrossRef]
- IGKB. Limnologischer Zustand des Bodensees—Jahresbericht 2018/2019. In Jahresbericht Int. Gewässerschutzkommission für den Bodensee—Grüner Bericht; Internationale Gewässerschutzkommission für den Bodensee (IGKB): Baden, Germany, 2020; Volume 43. [Google Scholar]
- Santhakumari, S.; Kannappan, A.; Pandian, S.K.; Thajuddin, N.; Rajendran, R.B.; Ravi, A.V. Inhibitory effect of marine cyanobacterial extract on biofilm formation and virulence factor production of bacterial pathogens causing vibriosis in aquaculture. J. Appl. Phycol. 2016, 28, 313–324. [Google Scholar] [CrossRef]
- Verity, P.G.; Robertson, C.Y.; Tronzo, C.R.; Andrews, M.G.; Nelson, J.R.; Sieracki, M.E. Relationships between cell volume and the carbon and nitrogen content of marine photosynthetic nanoplankton. Limnol. Oceanogr. 1992, 37, 1434–1446. [Google Scholar] [CrossRef]
- Ruber, J.; Geist, J.; Hartmann, M.; Millard, A.; Raeder, U.; Zubkov, M.; Zwirglmaier, K. Spatio-temporal distribution pattern of the picocyanobacterium Synechococcus in lakes of different trophic states: A comparison of flow cytometry and sequencing approaches. Hydrobiologia 2018, 811, 77–92. [Google Scholar] [CrossRef]
- Bodensee Wasserversorgung. Bodensee Wasserversorgung—Startseite. Available online: https://www.bodensee-wasserversorgung.de/startseite.html (accessed on 7 May 2021).
- Christiansen, G.; Kurmayer, R.; Liu, Q.; Börner, T. Transposons inactivate biosynthesis of the nonribosomal peptide microcystin in naturally occurring Planktothrix spp. Appl. Environ. Microbiol. 2006, 72, 117–123. [Google Scholar] [CrossRef] [Green Version]
- Altaner, S.; Puddick, J.; Fessard, V.; Feurstein, D.; Zemskov, I.; Wittmann, V.; Dietrich, D.R. Simultaneous Detection of 14 Microcystin Congeners from Tissue Samples Using UPLC-ESI-MS/MS and Two Different Deuterated Synthetic Microcystins as Internal Standards. Toxins 2019, 11, 388. [Google Scholar] [CrossRef] [PubMed] [Green Version]
- Bubak, I.; Śliwińska-Wilczewska, S.; Głowacka, P.; Szczerba, A.; Możdżeń, K. The importance of allelopathic picocyanobacterium Synechococcus sp. on the abundance, biomass formation, and structure of phytoplankton assemblages in three freshwater lakes. Toxins 2020, 12, 259. [Google Scholar] [CrossRef] [Green Version]
- Kovács, A.A.W.; Tóth, V.R.; Pálffy, K. The effects of interspecific interactions between bloom forming cyanobacteria and Scenedesmus quadricauda (Chlorophyta) on their photophysiology. Acta Biol. Hung. 2018, 69, 210–223. [Google Scholar] [CrossRef] [Green Version]
- Costa, M.S.; Costa, M.; Ramos, V.; Leão, P.N.; Barreiro, A.; Vasconcelos, V.; Martins, R. Picocyanobacteria from a Clade of Marine Cyanobium Revealed Bioactive Potential Against Microalgae, Bacteria, and Marine Invertebrates. J. Toxicol. Environ. Health 2015, 78, 432–442. [Google Scholar] [CrossRef] [Green Version]
- Weisbrod, B. Dynamics of Toxic Cyanobacteria in Lakes and Artificial Water Reservoirs. Ph.D. Thesis, University of Konstanz, Konstanz, Germany, 2021. [Google Scholar]
- Fernández Castro, B.; Sepúlveda Steiner, O.; Knapp, D.; Posch, T.; Bouffard, D.; Wüest, A. Inhibited vertical mixing and seasonal persistence of a thin cyanobacterial layer in a stratified lake. Aquat. Sci. 2021, 83, 38. [Google Scholar] [CrossRef]
- Rusch, D.B.; Halpern, A.L.; Sutton, G.; Heidelberg, K.B.; Williamson, S.; Yooseph, S.; Wu, D.; Eisen, J.A.; Hoffman, J.M.; Remington, K.; et al. The Sorcerer II Global Ocean Sampling expedition: Northwest Atlantic through eastern tropical Pacific. PLoS Biol. 2007, 5, e77. [Google Scholar] [CrossRef]
- William, S.; Helene, F.; Copeland, A. Bacterial DNA Isolation CTAB Protocol Bacterial Genomic DNA Isolation Using CTAB; JGI: Walnut Creek, CA, USA, 2012; p. 4.
- Altschul, S.F.; Gish, W.; Miller, W.; Myers, E.W.; Lipman, D.J. Basic local alignment search tool. J. Mol. Biol. 1990, 215, 403–410. [Google Scholar] [CrossRef]
- Schuurman, T.; de Boer, R.F.; Kooistra-Smid, A.M.D.; van Zwet, A.A. Prospective Study of Use of PCR Amplification and Sequencing of 16S Ribosomal DNA from Cerebrospinal Fluid for Diagnosis of Bacterial Meningitis in a Clinical Setting. J. Clin. Microbiol. 2004, 42, 734–740. [Google Scholar] [CrossRef] [Green Version]
- Walters, W.; Hyde, E.R.; Berg-Lyons, D.; Ackermann, G.; Humphrey, G.; Parada, A.; Gilbert, J.A.; Jansson, J.K.; Caporaso, J.G.; Fuhrman, J.A.; et al. Improved Bacterial 16S rRNA Gene (V4 and V4-5) and Fungal Internal Transcribed Spacer Marker Gene Primers for Microbial Community Surveys. mSystems 2016, 1. [Google Scholar] [CrossRef] [Green Version]
- Bolger, A.M.; Lohse, M.; Usadel, B. Trimmomatic: A flexible trimmer for Illumina sequence data. Bioinformatics 2014, 30, 2114–2120. [Google Scholar] [CrossRef] [Green Version]
- Simon, A. Babraham Bioinformatics—FastQC A Quality Control Tool for High Throughput Sequence Data. Available online: https://www.bioinformatics.babraham.ac.uk/projects/fastqc/ (accessed on 14 May 2020).
- Bolyen, E.; Rideout, J.R.; Dillon, M.R.; Bokulich, N.A.; Abnet, C.C.; Al-Ghalith, G.A.; Alexander, H.; Alm, E.J.; Arumugam, M.; Asnicar, F.; et al. Reproducible, interactive, scalable and extensible microbiome data science using QIIME 2. Nat. Biotechnol. 2019, 37, 852–857. [Google Scholar] [CrossRef]
- Callahan, B.; McMurdie, P.; Rosen, M.; Han, A.; Johnson, A.; Holmes, S. DADA2: High resolution sample inference from amplicon data. bioRxiv 2016, 24034. [Google Scholar] [CrossRef] [Green Version]
- Gouy, M.; Guindon, S.; Gascuel, O. SeaView version 4: A multiplatform graphical user interface for sequence alignment and phylogenetic tree building. Mol. Biol. Evol. 2010, 27, 221–224. [Google Scholar] [CrossRef] [PubMed] [Green Version]
- Yu, G. Using ggtree to Visualize Data on Tree-Like Structures. Curr. Protoc. Bioinform. 2020, 69, e96. [Google Scholar] [CrossRef] [PubMed]
- R Foundation for Statistical Computing. R Core Team R: A Language and Environment for Statistical Computing; R Foundation for Statistical Computing: Vienna, Austria, 2018. [Google Scholar]
- McMurdie, P.J.; Holmes, S. Phyloseq: An R Package for Reproducible Interactive Analysis and Graphics of Microbiome Census Data. PLoS ONE 2013, 8, e61217. [Google Scholar] [CrossRef] [PubMed] [Green Version]
- Oksanen, J.; Blanchet, F.G.; Friendly, M.; Kindt, R.; Legendre, P.; McGlinn, D.; Minchin, P.R.; O’Hara, R.B.; Simpson, G.L.; Solymos, P.; et al. Vegan: Community Ecology Package; R Package Version 2.5-6; R Foundation for Statistical Computing: Vienna, Austria, 2016. [Google Scholar]
- Wickham, H. ggplot2: Elegant Graphics for Data Analysis; Springer: New York, NY, USA, 2016; ISBN 978-3-319-24277-4. [Google Scholar]
- McMurdie, P.J.; Holmes, S. Waste Not, Want Not: Why Rarefying Microbiome Data Is Inadmissible. PLoS Comput. Biol. 2014, 10, e1003531. [Google Scholar] [CrossRef] [PubMed] [Green Version]
- Zemskov, I.; Altaner, S.; Dietrich, D.R.; Wittmann, V. Total Synthesis of Microcystin-LF and Derivatives Thereof. J. Org. Chem. 2017, 82, 3680–3691. [Google Scholar] [CrossRef] [PubMed]
- MathWorks. MATLAB; Version R2020a; MathWorks: Natick, MA, USA, 2020. [Google Scholar]
Figure 1.
Representative depth profile recorded with a Moldaenke FluoroProbe multichannel fluorimeter, indicating the high abundance of red-pigmented biomass at a water depth below the chlorophyll-a maximum in Lake Constance on 1 July 2019. (A) Absolute fluorescence intensities recorded at the different excitation wavelengths. (B) Abundance of the different algae classes as attributed by FluoroProbe. Red-pigmented cyanobacteria are attributed to ‘cryptophyta’. In this example, the chlorophyll-a maximum was determined at 8–10 m water depth (Figure 1A, 470 nm), and a second maximum, indicating a red-pigmented biomass, at approximately 18–20 m water depth (Figure 1A, 570 nm; 1B, cryptophyta).

Figure 2.
Krona plot of the DRM cyanobacterial community composition, as determined by 16S rRNA gene-amplicon sequencing across the sampling periods in 2019 (A) and 2020 (B). The community analysis was carried out by filtration of DRM water samples, total DNA extraction of the filters and PCR amplicon sequencing of the cyanobacteria-specific 16S rRNA gene region V3–V4 (380 bp length). For this Krona plot, and as an overview, the results shown are based on all samples combined per year. Taxonomic affiliation was carried out using the Greengenes reference database, and all taxonomic ranks are represented in the plot. Amplicon sequence variants (ASVs), as outputs of the Dada2 software package (see Section 5), distinguish sequence variations by a single nucleotide, giving ASVs a higher resolution than the operational taxonomic units (OTUs) typically used. Therefore, ASVs were used as the deepest taxonomic rank in our study. Total relative abundance was calculated by dividing the number of reads affiliated to an ASV in a sample by the total number of reads in the sample.

Figure 3.
Illustration of the phylogenetic relationship of the Synechococcus spp. taxa observed in 2019 and 2020. The phylogeny is based on the cyanobacteria-specific V3–V4 (380 bp) 16S rRNA gene region. Colors correspond to the origin of the sequences, with green referring to ASVs observed in 2019 and blue referring to ASVs observed in 2020 (sampling year also in brackets). Sequences from Synechococcus spp. taxa, previously isolated from Lake Constance [45], and sequences of Synechococcus rubescens strain SAG3.81 and Cyanobium gracile PCC 6307 from NCBI were used as references (indicated in black). IQ-TREE was used for phylogenetic inference using maximum likelihood. The model of nucleotide substitutions used was TPM2+F + I [46], determined as the best-fit model by ModelFinder [47], based on the Bayesian information criterion scores and weights. Numbers at the internal nodes represent the percentage support of this specific node in 1000 bootstrap testing. The tree was rooted using the sequences of the cyanobacterium Anacystis nidulans PCC 6301 as an outgroup (not shown). The reference sequences are identified by their accession numbers in brackets.

Figure 4.
Dynamics of relative abundance changes for the Synechococcus ASVs observed during the 2019 and 2020 sampling campaigns. Shown are heatmaps across all sampling dates (A,C) and the ASVs’ average relative abundances (B,D) for each year (bars) with each individual data point indicated (grey dots). For the y-axes of heatmaps (A,C), and average relative abundances (B,D), the different ASVs were ordered from the most abundant (top) to the least abundant (bottom). The heatmap data was log10 transformed from the read count matrix, and, to avoid introducing infinity for zero read counts, we added one artificial read to every cell prior to log10 transformation (log10[x + 1]). Color schemes vary between dark blue for low log10 values to bright orange for high log10 values; a higher log10 value means a higher relative abundance. Please note that the x-axes for B and D do not have the same scale. The average relative abundance across all samples of each year was calculated as it was for the Krona plot (see Figure 2). Standard deviation was also calculated and represented for each ASV; if the graphical representation of the standard deviation was below 0, the minimum error bar value was set to 0.
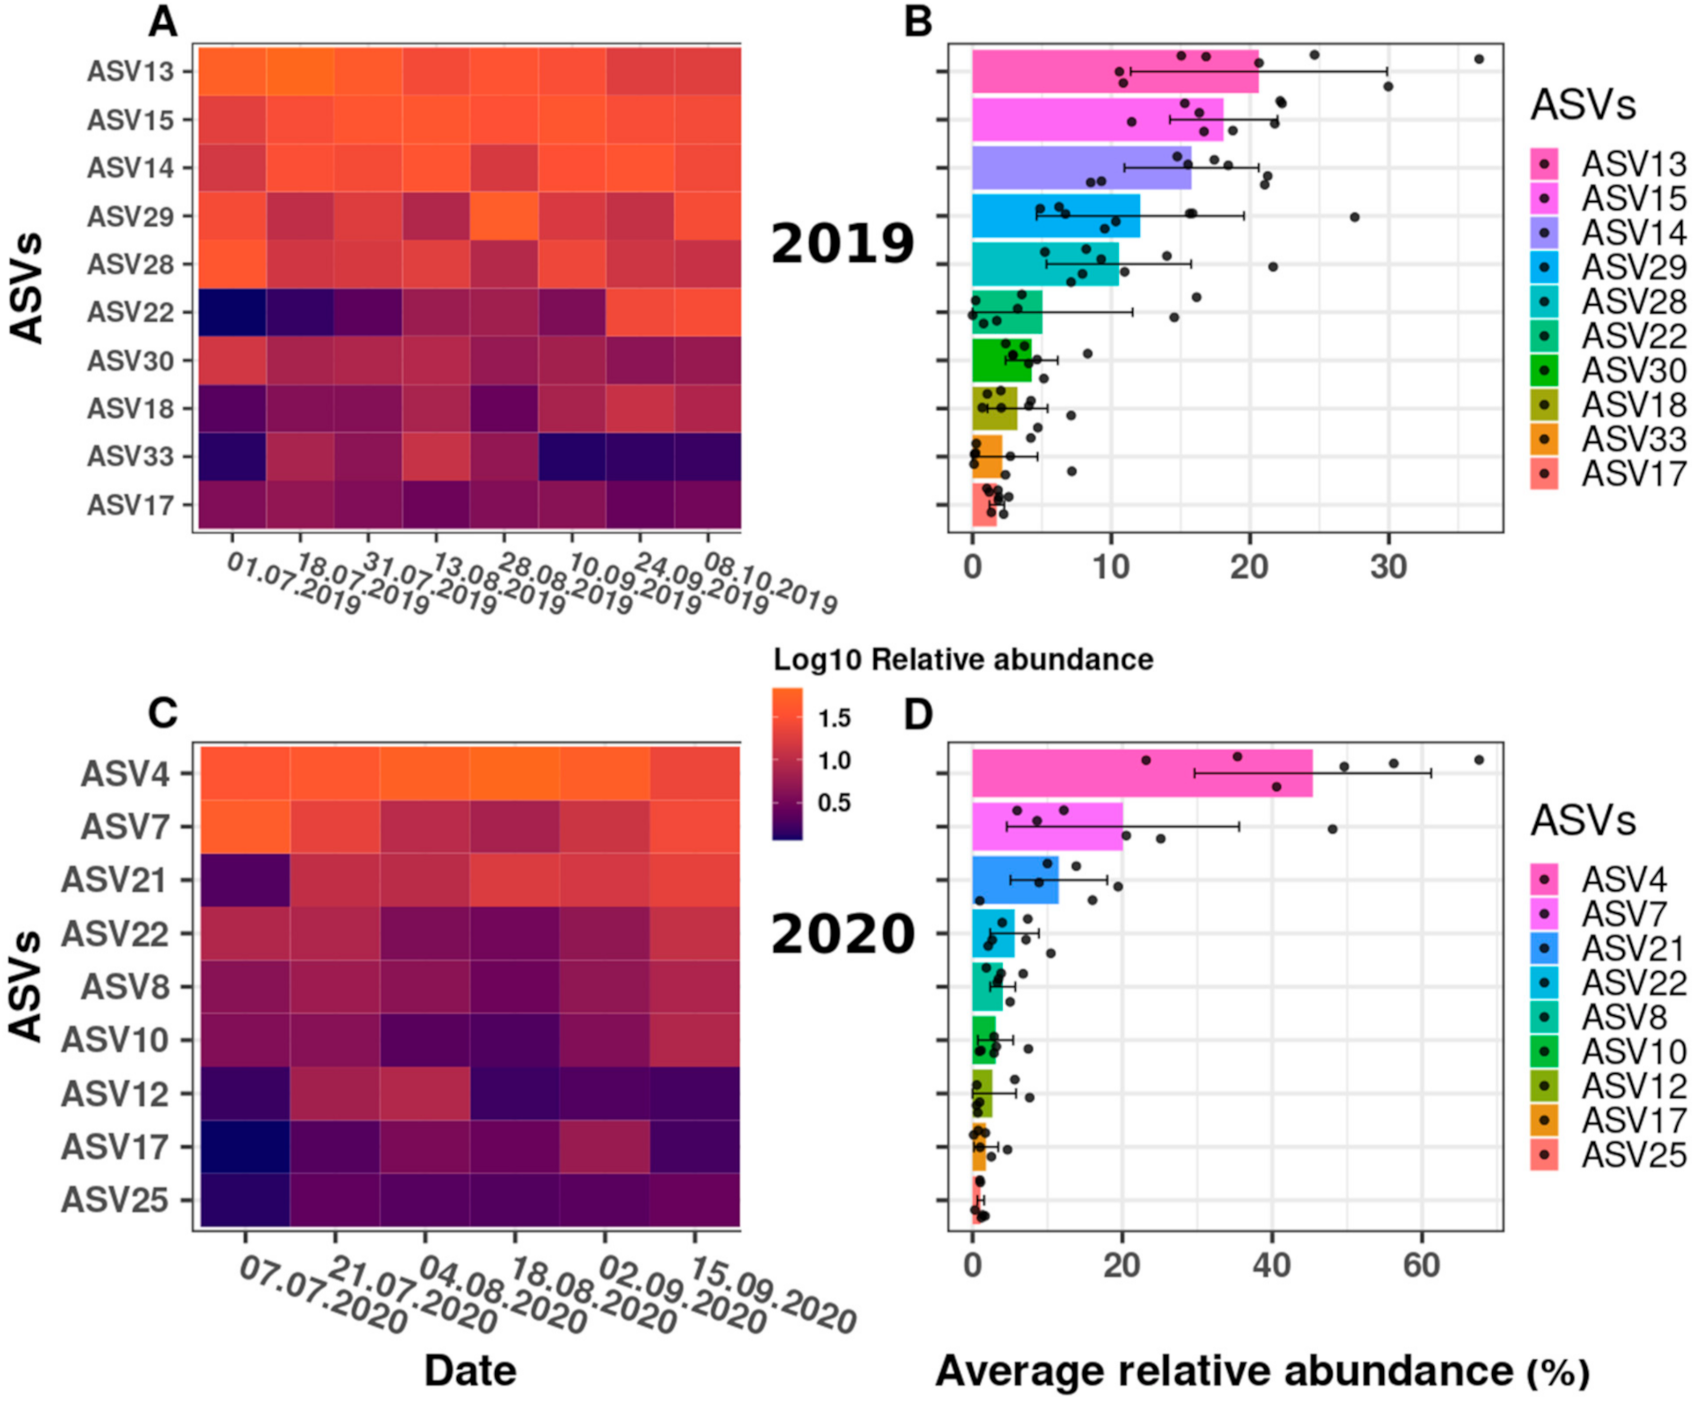
Figure 5.
Relative abundance of the Planktothrix and Microcystis ASVs observed in 2019 and 2020, and of microcystin concentrations for samples taken in 2019. The bar plots represent the total relative abundance observed for the two Planktothrix ASVs (red bars) detected in 2019 (A) and 2020 (B), for the two Microcystis ASVs (blue bars) detected in 2019, and the single Microcystis ASV detected in 2020. The x-axes represent the different sampling dates and the left y-axis the relative abundance (%). The error bars in B represent the standard deviation of the relative abundance, as calculated from biological triplicates (n = 3); no error bars are represented for 2019, as only one sample was collected per sampling date. The right y-axis represents the toxin concentration (ng/L) determined for independently collected DRM filters, for which the microcystin variant concentrations are indicated by dashed lines in black (MC-LR) and grey (MC-YR) (see main text). The text on top of each bar indicates the results of the PCR amplification of the microcystin synthesis gene mcyE (+, detected; −, not detected) and of the phylogenetic affiliation of the mcyE consensus sequence to either Planktothrix or Microcystis, as established by Sanger sequencing of the PCR amplicons (see main text).

Figure 6.
Depth profiles recorded with the FluoroProbe across the sampling campaigns in 2019 and 2020 (A), in comparison to the year 2016, in which P. rubescens blooms were reported in Lake Constance (B). Depicted are the FluoroProbe profiles for ‘cryptophyta’ abundance (cf. Figure 1) (expressed in µg chlorophyll-a per liter), recorded as proxy of red pigment abundance, in the water column from 0–40 m depth at the routine sampling site ‘Wallhausen’, in the Überlingen embayment of Lake Constance. Prominent DRM are highlighted with dates and water depths. Coordinates of the study site: 47.7571°N 9.1273°E; for an illustration, see Figure S4. In 2016, blooms of P. rubescens were reported for Lake Constance in September–October at various sampling sites (i.e., of the German, Austrian and Swiss sections of Lake Constance [42,43]). For 2016, FluoroProbe data is available for the Überlingen embayment of Lake Constance (B).


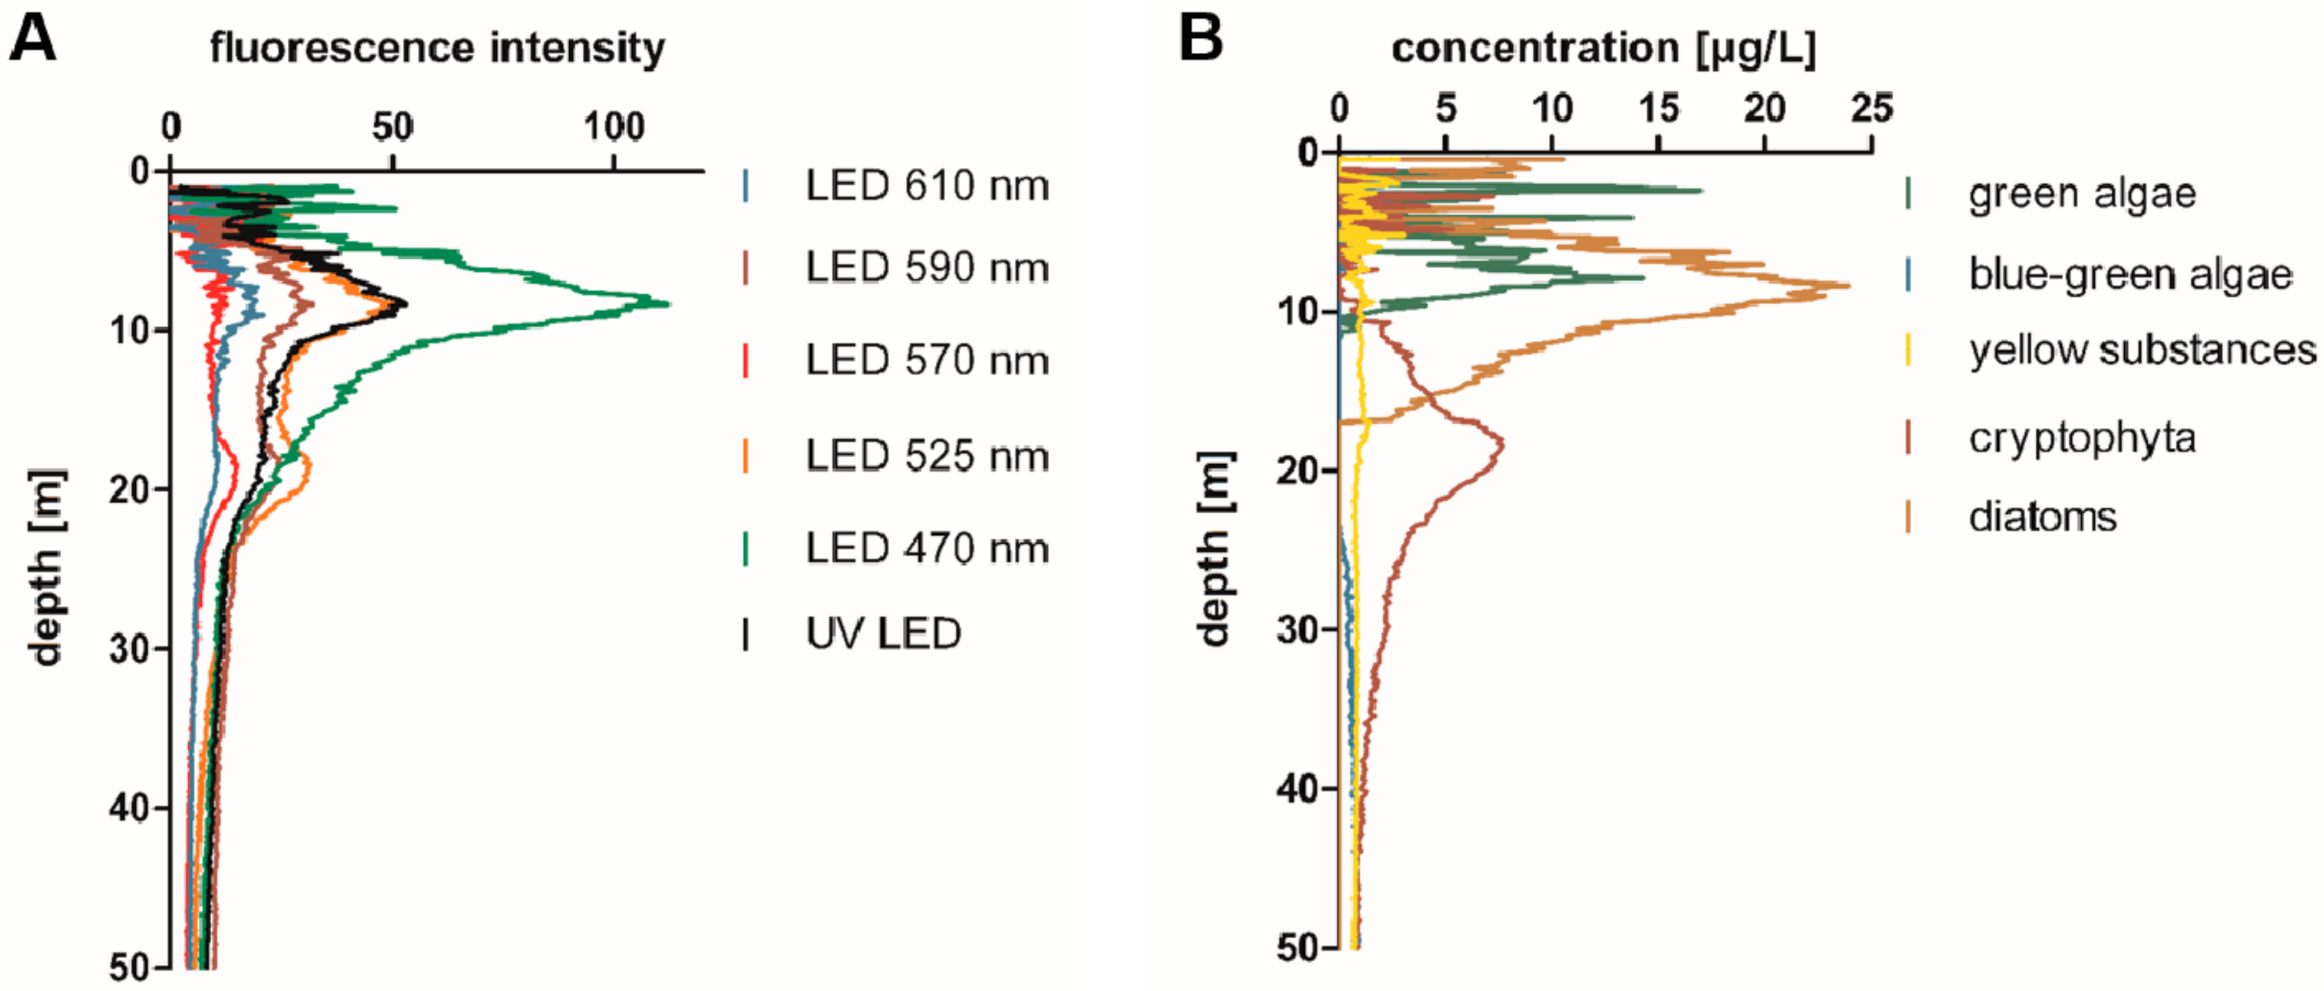
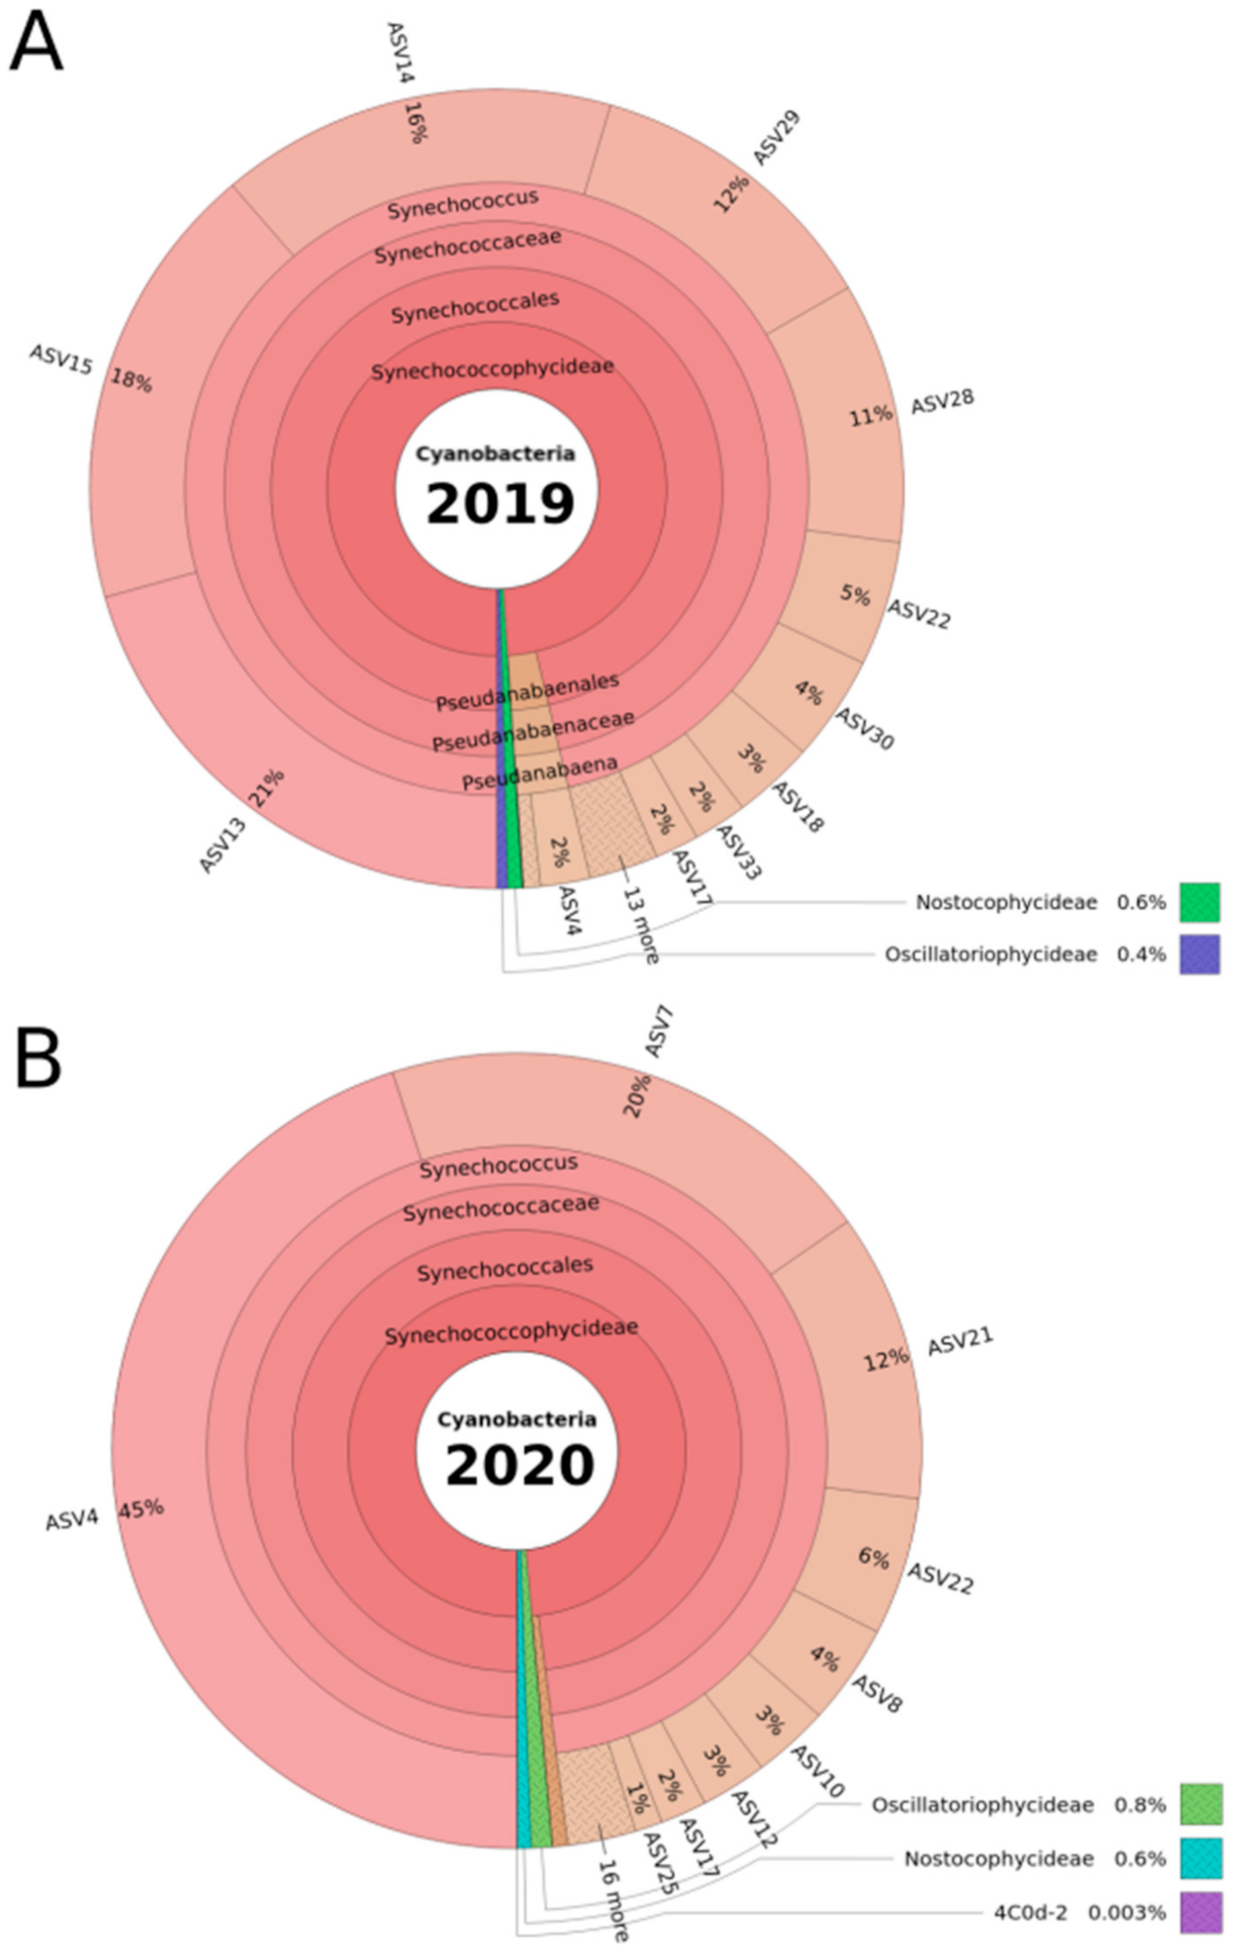
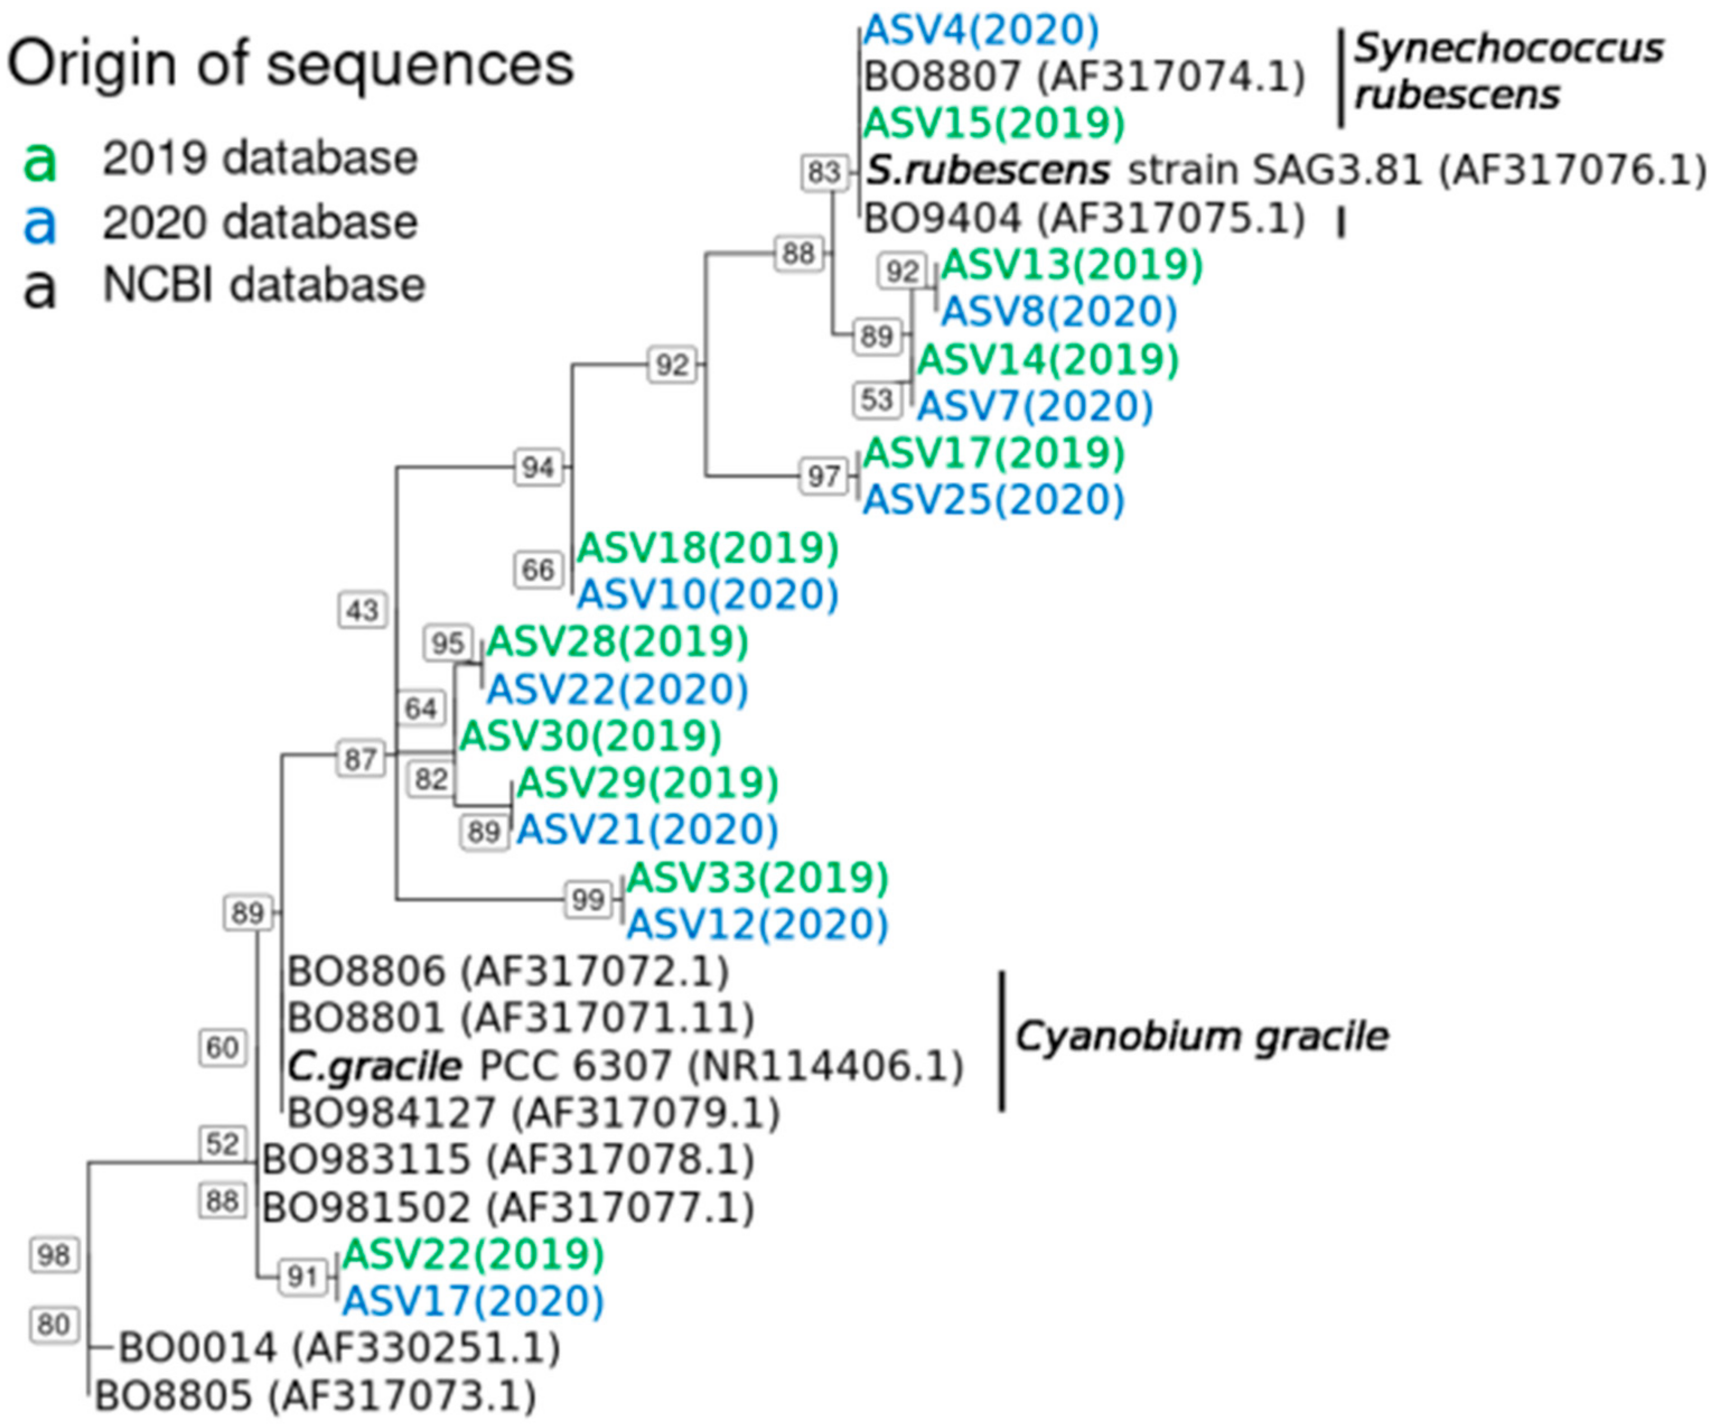
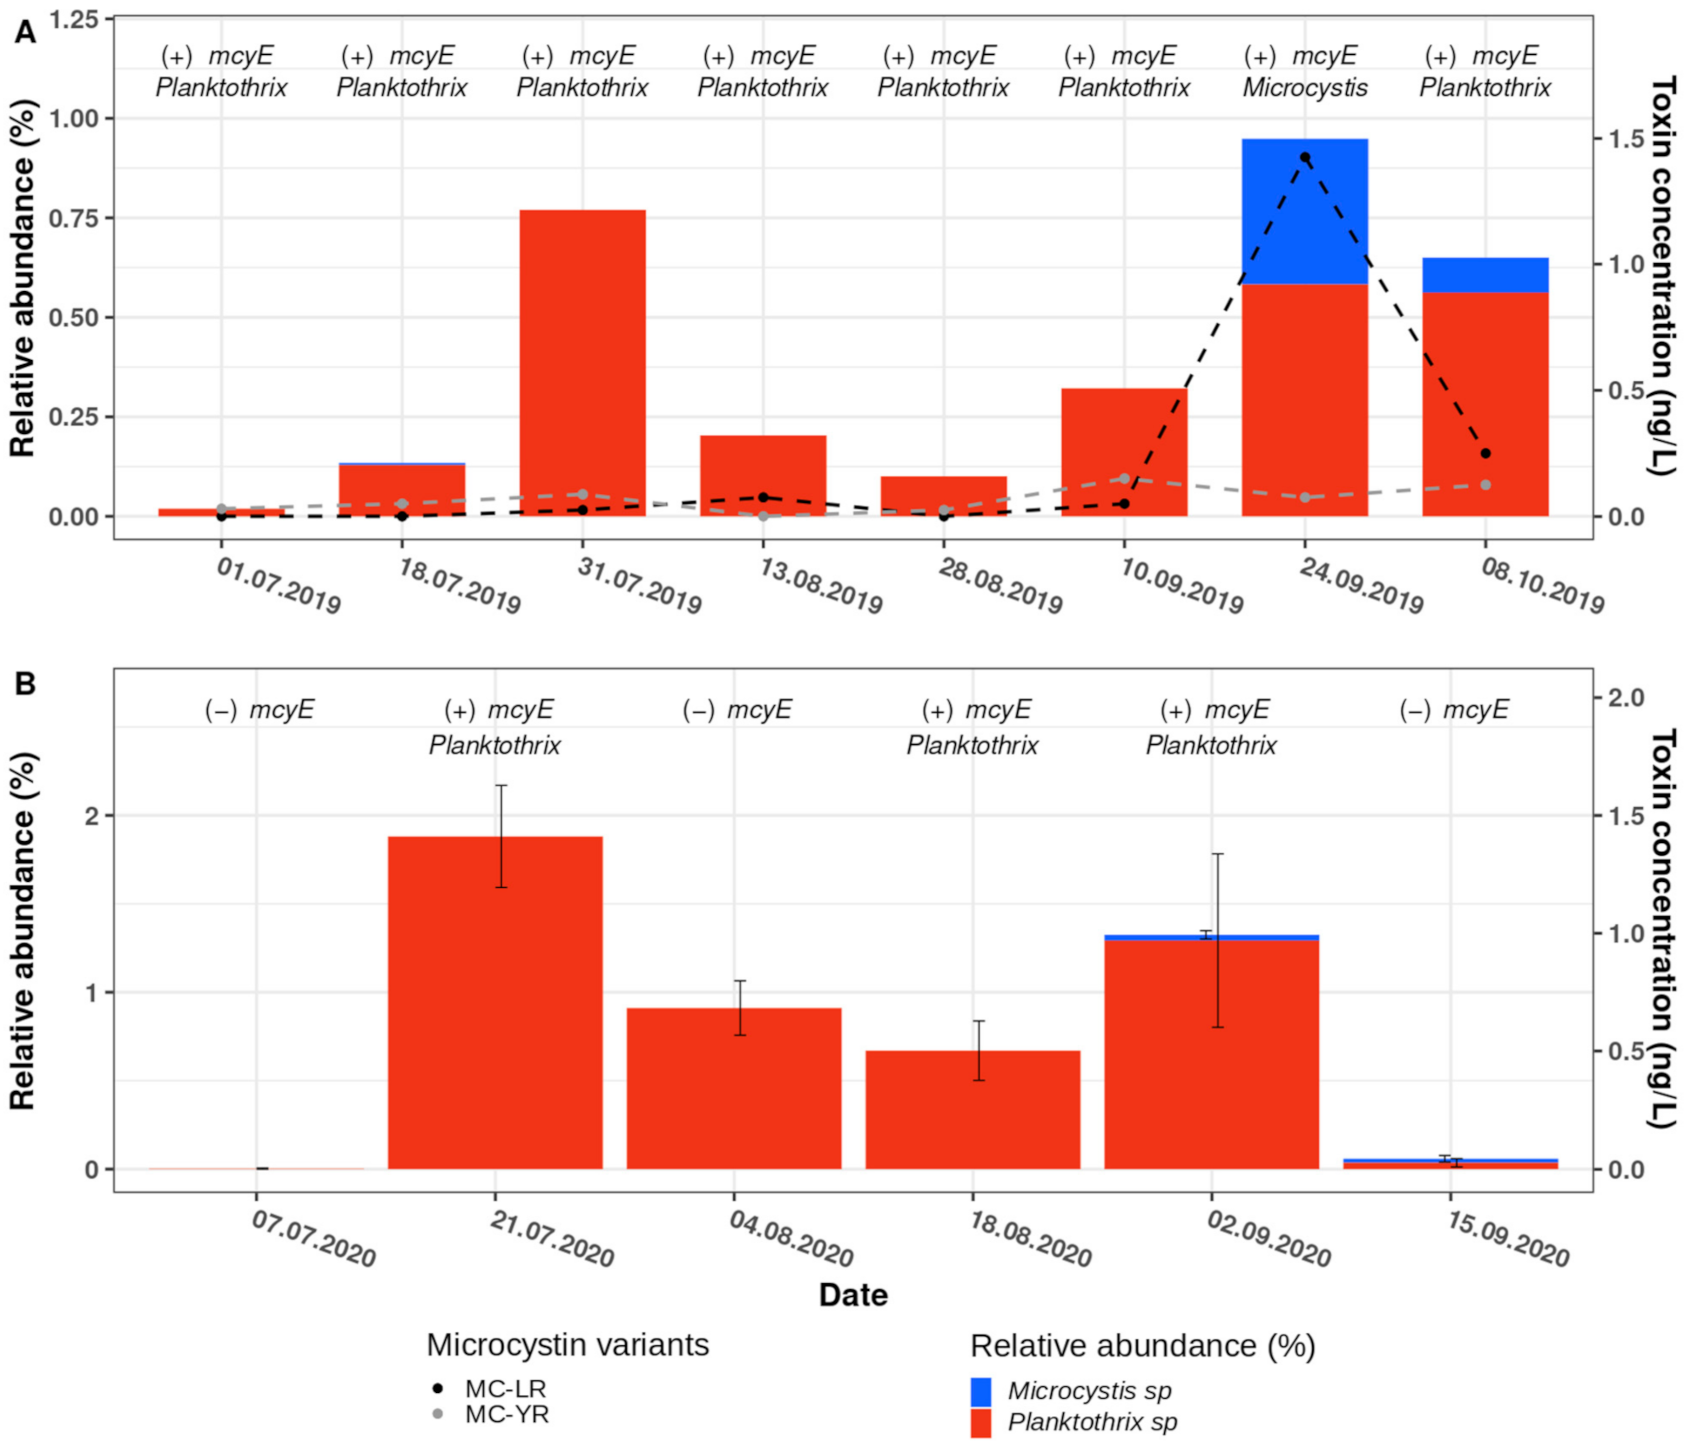
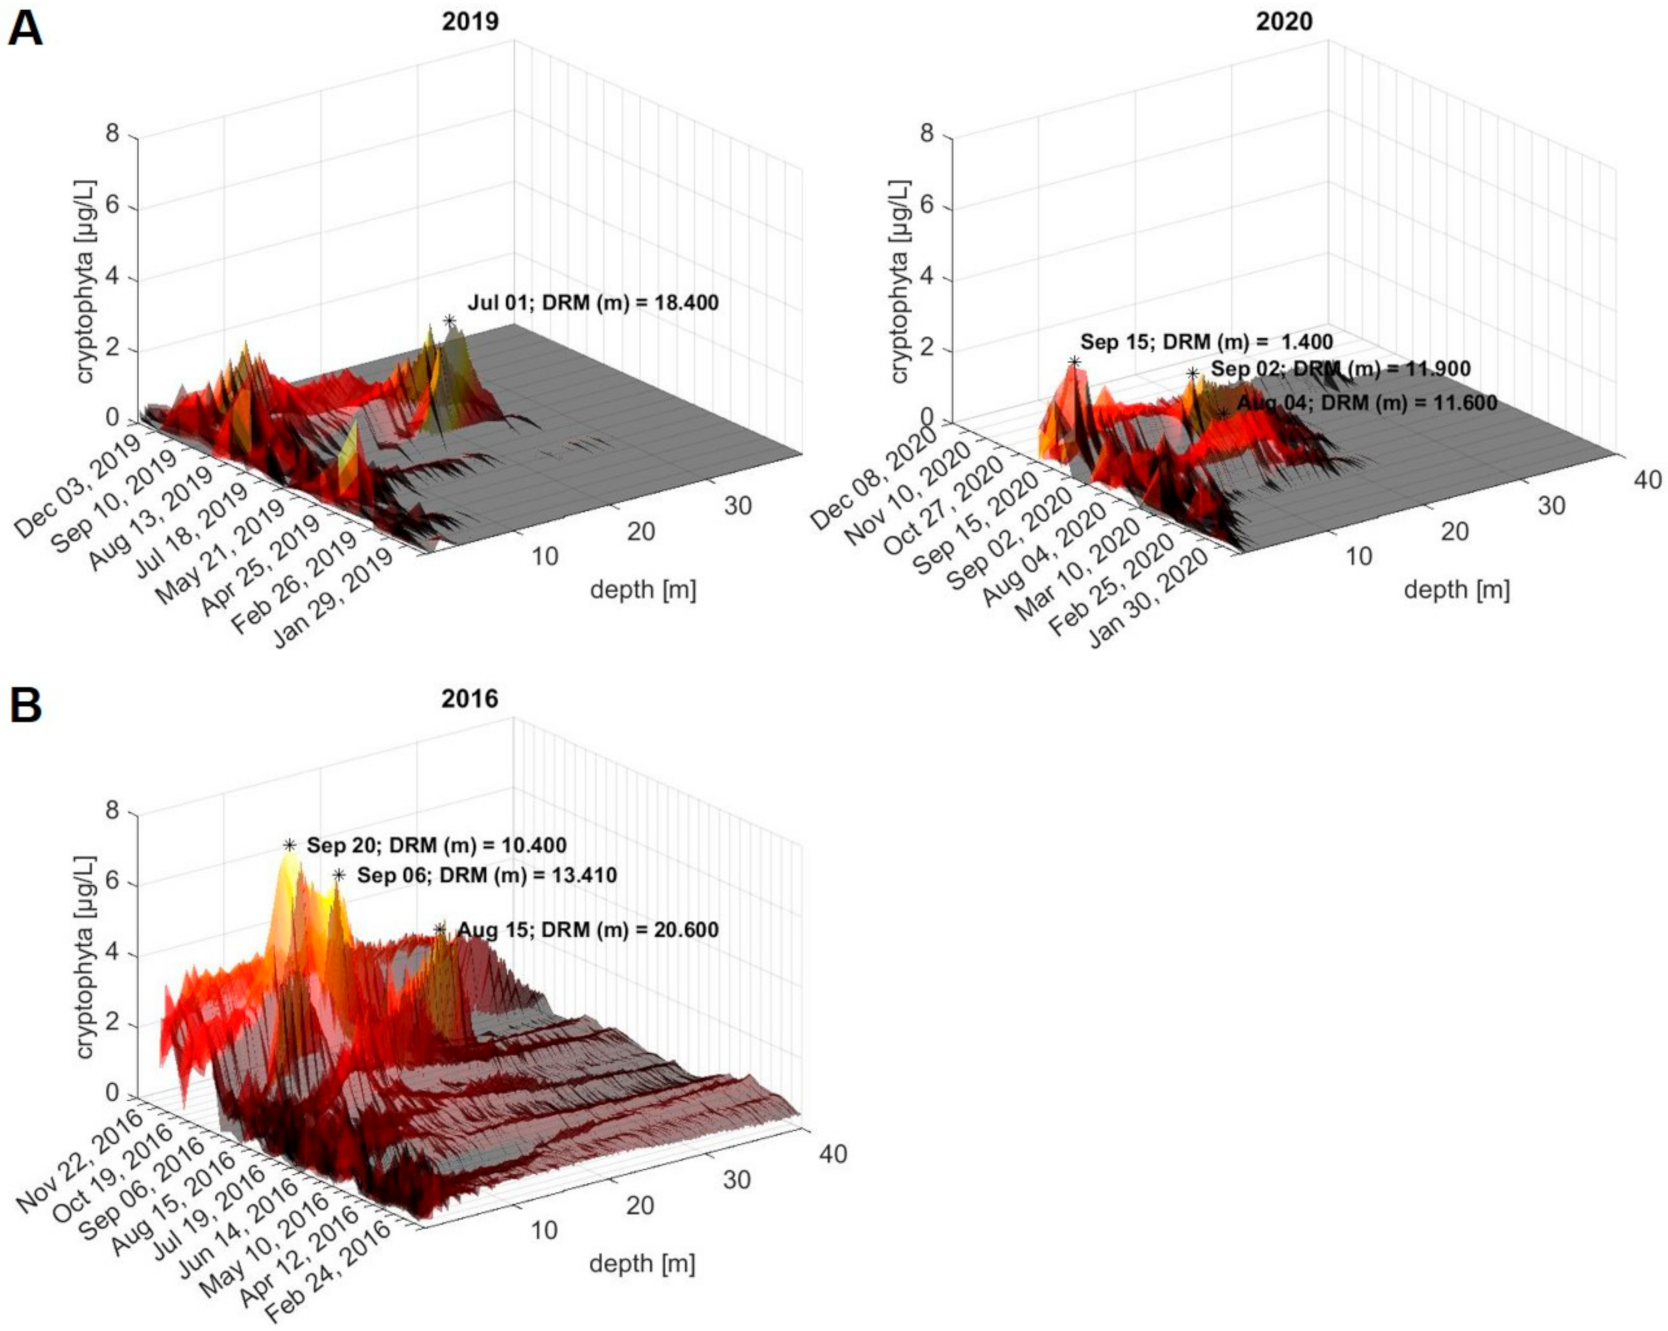
Table 1.
Primers used in this study.
| Name of Forward and Reverse Primers | Sequence (5′-3′) | Target | Reference |
|---|---|---|---|
| HEPF | TTTGGGGTTAACTTTTTTGGGCATAGTC | mcyE | Jungblut and Neilan, 2006 |
| HEPR | AATTCTTGAGGCTGTAAATCGGGTTT | ||
| 16S rDNA PTX fw | ATCCAAGTCTGCTGTTAAAGA | 16S rDNA (only Planktothrix spp.) | Ostermaier and Kurmayer, 2009 |
| 16S rDNA PTX rv | CTCTGCCCCTACTACACTCTAG | ||
| 16S rDNA PTX TaqMan 1 | AAAGGCAGTGGAAACTGGAAG | ||
| mcyBA1 PTX fw | ATTGCCGTTATCTCAAGCGAG | mcyBA1 (only Planktothrix spp.) | Ostermaier and Kurmayer, 2009 |
| mcyBA1 PTX rv | TGCTGAAAAAACTGCTGCATTAA | ||
| mcyBA1 PTX TaqMan 1 | TTTTTGTGGAGGTGAAGCTCTTTCCTCTGA | ||
| CYA359F | GGGGAATYTTCCGCAATGGG | 16S rRNA (Cyanobacteria) | Nübel et al., 1997 |
| CYA784R | ACTACWGGGGTATCTAATCCC |
1 TaqMan probes contain 5′ FAM (6-carboxyfluorescein, fluorescent reporter dye) and 3′ TAMRA (6-carboxy-tetramethylrhodamine, fluorescent quencher dye).
Publisher’s Note: MDPI stays neutral with regard to jurisdictional claims in published maps and institutional affiliations. |
© 2021 by the authors. Licensee MDPI, Basel, Switzerland. This article is an open access article distributed under the terms and conditions of the Creative Commons Attribution (CC BY) license (https://creativecommons.org/licenses/by/4.0/).
Share and Cite
MDPI and ACS Style
Fournier, C.; Riehle, E.; Dietrich, D.R.; Schleheck, D. Is Toxin-Producing Planktothrix sp. an Emerging Species in Lake Constance? Toxins 2021, 13, 666. https://0-doi-org.brum.beds.ac.uk/10.3390/toxins13090666
AMA Style
Fournier C, Riehle E, Dietrich DR, Schleheck D. Is Toxin-Producing Planktothrix sp. an Emerging Species in Lake Constance? Toxins. 2021; 13(9):666. https://0-doi-org.brum.beds.ac.uk/10.3390/toxins13090666
Chicago/Turabian StyleFournier, Corentin, Eva Riehle, Daniel R. Dietrich, and David Schleheck. 2021. "Is Toxin-Producing Planktothrix sp. an Emerging Species in Lake Constance?" Toxins 13, no. 9: 666. https://0-doi-org.brum.beds.ac.uk/10.3390/toxins13090666
Note that from the first issue of 2016, this journal uses article numbers instead of page numbers. See further details here.