Unexpected Modulation of Recall B and T Cell Responses after Immunization with Rotavirus-like Particles in the Presence of LT-R192G

Abstract
:1. Introduction
2. Materials and Methods
2.1. Mice
2.2. VLP Preparation and Adjuvant
2.3. Immunization and Sample Collection
2.4. Measurement of Rotavirus-Specific Antibodies in Serum and Fecal Samples
2.5. Preparation of Cells from RF, LLN, MLN, PP and Spleen
2.6. In Vitro Restimulation
2.7. FCM Assays
2.7.1. Rotavirus Specific B Cell Quantification
2.7.2. Analysis of CD4+CD25+Foxp3+ T Cells and CD4+CD25+Foxp3− T Cells
2.8. IL-2 Assay
2.9. Statistics
3. Results
3.1. Primary and Secondary Specific B Cell Responses Induced by IR Immunization with 2/6-VLP with or without LT-R192G
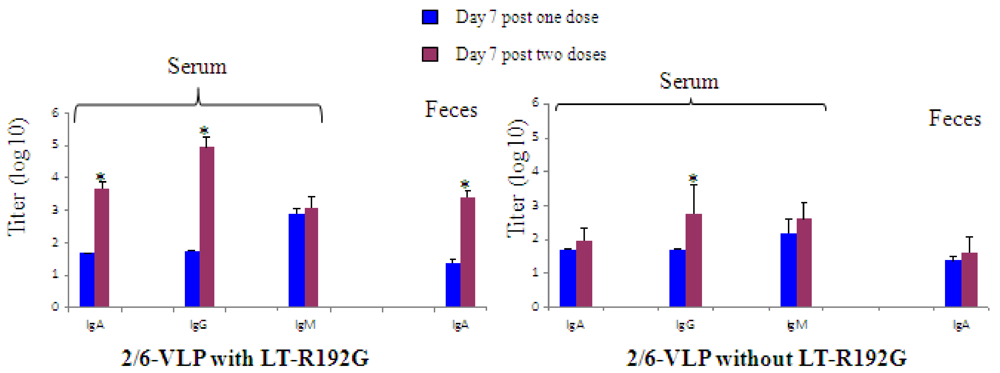
3.1.1. The Secondary Response Induced by IR Immunization with 2/6-VLP and LT-R192G Showed a Serum and Fecal Antibody Response but a Lower RV-Specific B Cell Expansion
 ) or two (
 ) immunizations. The results are plotted as the geometric mean titres (n = 5). * Data points statistically different between one and two doses (p < 0.05).
) or two () immunizations. The results are plotted as the geometric mean titres (n = 5). * Data points statistically different between one and two doses (p < 0.05).
) immunizations. The results are plotted as the geometric mean titres (n = 5). * Data points statistically different between one and two doses (p < 0.05).
) or two () immunizations. The results are plotted as the geometric mean titres (n = 5). * Data points statistically different between one and two doses (p < 0.05).
3.1.2. The Secondary Response Induced by IR Immunization with 2/6-VLP in the Absence of Adjuvant Showed a Similar RV-Specific B Cell Expansion to that in the Primary Response and a Secondary Serum IgG Antibody Response
 ) or two (
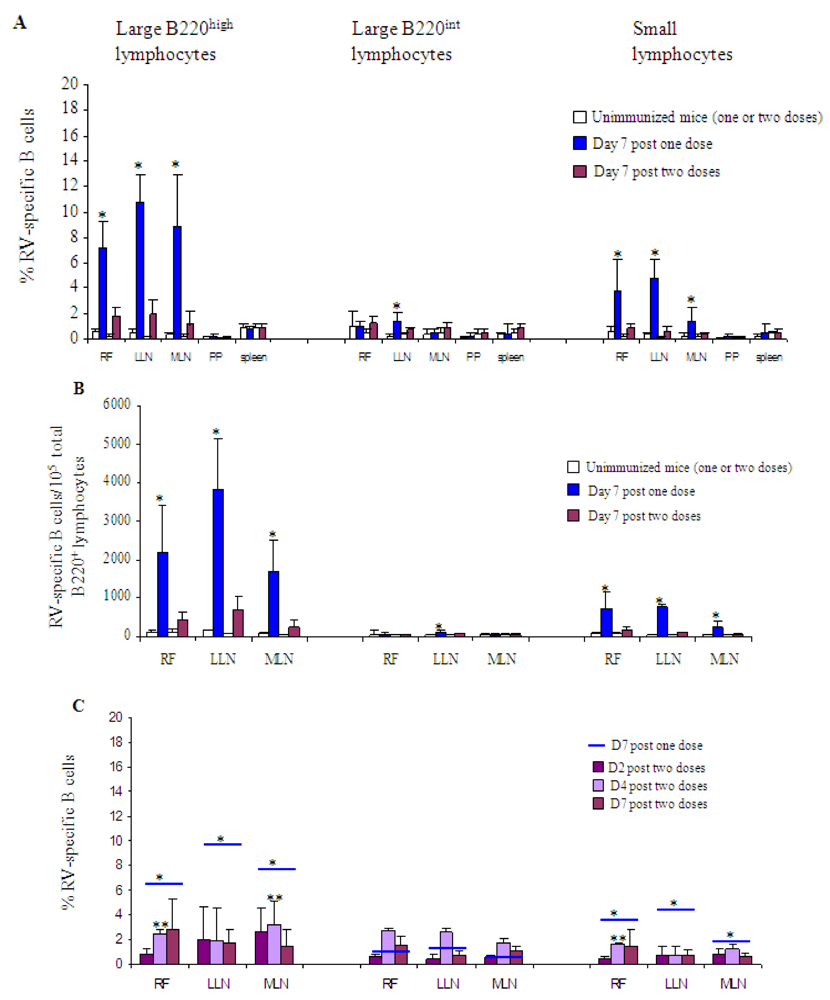
 ) immunizations with 2/6-VLP and LT-R192G. The results are plotted as the means, and error bars represent 1 SEM (n = 7). * Data points statistically different between one and two doses (p < 0.05). Analysis was done as previously described [10]. Briefly, small lymphocytes were distinguished from large lymphocytes by their light-scatter profile. Three types of B cell subsets were analysed: the large B220int IgD− B cell subset representing extrafollicular B cells, the large B220high IgD− B cell subset representing germinal center B cells, and the small B220high IgD− lymphocyte subset consisting of memory and germinal center B cells. (B) Frequency (RV-specific B cells/105 total B220+ cells) of RV-specific B cells in RF, LLN and MLN on day 7 post one (
 ) or two (
 ) immunizations with 2/6-VLP and LT-R192G. The results are plotted as the means, and error bars represent 1 SEM (n = 7). * Data points statistically different between one and two doses (p < 0.05). (C) Percentage of RV-specific B cells in RF, LLN and MLN after two immunizations with 2/6-VLP and LT-R192G on d2 (
 ), d4 (
 ) and d7 (
 ). On day 7 after one immunization, the results obtained are represented by
  . The results are plotted as the means, and error bars represent 1 SEM (n = 3–7). * Data points statistically different between one and two doses on day 2, 4 or 7 (p < 0.05). ** Data points statistically different between one (data not shown) and two doses on day 4 (p < 0.05).
) or two () immunizations with 2/6-VLP and LT-R192G. The results are plotted as the means, and error bars represent 1 SEM (n = 7). * Data points statistically different between one and two doses (p < 0.05). Analysis was done as previously described [10]. Briefly, small lymphocytes were distinguished from large lymphocytes by their light-scatter profile. Three types of B cell subsets were analysed: the large B220int IgD− B cell subset representing extrafollicular B cells, the large B220high IgD− B cell subset representing germinal center B cells, and the small B220high IgD− lymphocyte subset consisting of memory and germinal center B cells. (B) Frequency (RV-specific B cells/105 total B220+ cells) of RV-specific B cells in RF, LLN and MLN on day 7 post one () or two () immunizations with 2/6-VLP and LT-R192G. The results are plotted as the means, and error bars represent 1 SEM (n = 7). * Data points statistically different between one and two doses (p < 0.05). (C) Percentage of RV-specific B cells in RF, LLN and MLN after two immunizations with 2/6-VLP and LT-R192G on d2 (), d4 () and d7 (). On day 7 after one immunization, the results obtained are represented by . The results are plotted as the means, and error bars represent 1 SEM (n = 3–7). * Data points statistically different between one and two doses on day 2, 4 or 7 (p < 0.05). ** Data points statistically different between one (data not shown) and two doses on day 4 (p < 0.05).
. The results are plotted as the means, and error bars represent 1 SEM (n = 3–7). * Data points statistically different between one and two doses on day 2, 4 or 7 (p < 0.05). ** Data points statistically different between one (data not shown) and two doses on day 4 (p < 0.05).
) or two () immunizations with 2/6-VLP and LT-R192G. The results are plotted as the means, and error bars represent 1 SEM (n = 7). * Data points statistically different between one and two doses (p < 0.05). Analysis was done as previously described [10]. Briefly, small lymphocytes were distinguished from large lymphocytes by their light-scatter profile. Three types of B cell subsets were analysed: the large B220int IgD− B cell subset representing extrafollicular B cells, the large B220high IgD− B cell subset representing germinal center B cells, and the small B220high IgD− lymphocyte subset consisting of memory and germinal center B cells. (B) Frequency (RV-specific B cells/105 total B220+ cells) of RV-specific B cells in RF, LLN and MLN on day 7 post one () or two () immunizations with 2/6-VLP and LT-R192G. The results are plotted as the means, and error bars represent 1 SEM (n = 7). * Data points statistically different between one and two doses (p < 0.05). (C) Percentage of RV-specific B cells in RF, LLN and MLN after two immunizations with 2/6-VLP and LT-R192G on d2 (), d4 () and d7 (). On day 7 after one immunization, the results obtained are represented by . The results are plotted as the means, and error bars represent 1 SEM (n = 3–7). * Data points statistically different between one and two doses on day 2, 4 or 7 (p < 0.05). ** Data points statistically different between one (data not shown) and two doses on day 4 (p < 0.05).
3.2. Primary and Secondary in Vitro T Cell Responses to 2/6-VLP, LT-R192G or Both, from Non-Immunized Mice and Mice Immunized with 2/6-VLP with or without LT-R192G: Analysis of CD4+CD25+Foxp3− and CD4+CD25+Foxp3+ T Cells
3.2.1. Concanavalin A Activates CD4+CD25+Foxp3− and CD4+CD25+Foxp3+ T Cells from All Mice
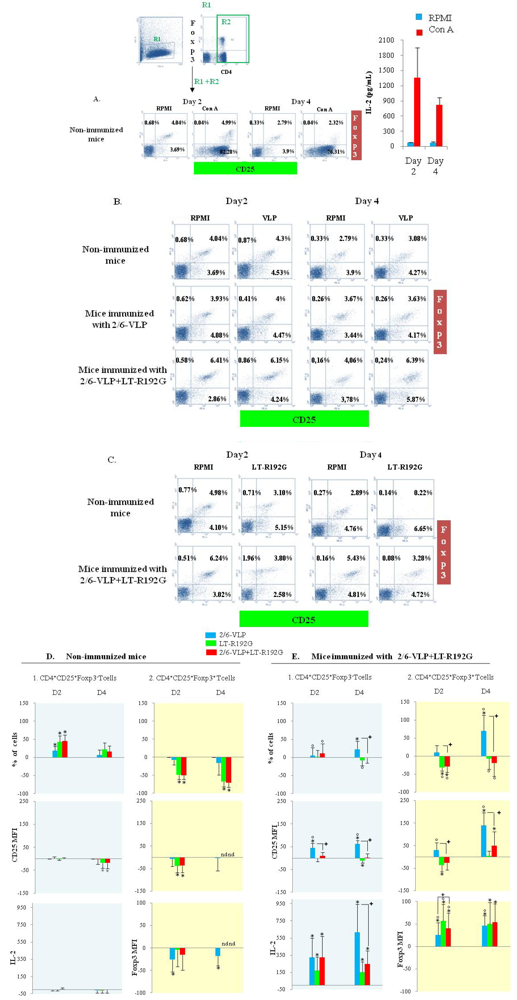
 ) or LT-R192G (
 ) or both (
 )) compared to the control well (RPMI). (D) Non-immunized mice. (E) Immunized mice. Data represent mean ± SEM of six or seven separate experiments. P-values were calculated using the Wilcoxon paired non-parametric signed-rank test or the Mann-Whitney unpaired non-parametric U-test. * Data points statistically different between stimulated and RPMI wells (p = 0.01, 0.015 or 0.025). + Data points statistically different between 2/6-VLP and 2/6-VLP and LT-R192G stimulated wells. Percentages of increase or decrease compared to the control RPMI statistically different between non-immunized mice and immunized mice (p < 0.01 or p ≤ 0.05). nd: not determined.
) or LT-R192G () or both ()) compared to the control well (RPMI). (D) Non-immunized mice. (E) Immunized mice. Data represent mean ± SEM of six or seven separate experiments. P-values were calculated using the Wilcoxon paired non-parametric signed-rank test or the Mann-Whitney unpaired non-parametric U-test. * Data points statistically different between stimulated and RPMI wells (p = 0.01, 0.015 or 0.025). + Data points statistically different between 2/6-VLP and 2/6-VLP and LT-R192G stimulated wells. Percentages of increase or decrease compared to the control RPMI statistically different between non-immunized mice and immunized mice (p < 0.01 or p ≤ 0.05). nd: not determined.
)) compared to the control well (RPMI). (D) Non-immunized mice. (E) Immunized mice. Data represent mean ± SEM of six or seven separate experiments. P-values were calculated using the Wilcoxon paired non-parametric signed-rank test or the Mann-Whitney unpaired non-parametric U-test. * Data points statistically different between stimulated and RPMI wells (p = 0.01, 0.015 or 0.025). + Data points statistically different between 2/6-VLP and 2/6-VLP and LT-R192G stimulated wells. Percentages of increase or decrease compared to the control RPMI statistically different between non-immunized mice and immunized mice (p < 0.01 or p ≤ 0.05). nd: not determined.
) or LT-R192G () or both ()) compared to the control well (RPMI). (D) Non-immunized mice. (E) Immunized mice. Data represent mean ± SEM of six or seven separate experiments. P-values were calculated using the Wilcoxon paired non-parametric signed-rank test or the Mann-Whitney unpaired non-parametric U-test. * Data points statistically different between stimulated and RPMI wells (p = 0.01, 0.015 or 0.025). + Data points statistically different between 2/6-VLP and 2/6-VLP and LT-R192G stimulated wells. Percentages of increase or decrease compared to the control RPMI statistically different between non-immunized mice and immunized mice (p < 0.01 or p ≤ 0.05). nd: not determined.
3.2.2. Analysis of CD4+CD25+Foxp3− and CD4+CD25+Foxp3+ T Cells from Non-Immunized Mice after in Vitro Culture with 2/6-VLP or LT-R192G or Both
3.2.3 Analysis of CD4+CD25+Foxp3− and CD4+CD25+Foxp3+ T Cells from Mice Immunized with 2/6-VLP Alone after in vitro Culture with 2/6-VLP or LT-R192G or Both
3.2.4 Analysis of CD4+CD25+Foxp3− and CD4+CD25+Foxp3+ T Cells from Mice Immunized with 2/6-VLP and LT-R192G and Restimulated in vitro with 2/6-VLP or LT-R192G or Both
4. Discussion
5. Conclusions
Acknowledgements
References
- Cox, E.; Verdonck, F.; Vanrompay, D.; Goddeeris, B. Adjuvants modulating mucosal immune responses or directing systemic responses towards the mucosa. Vet. Res. 2006, 37, 511–539. [Google Scholar]
- Freytag, L.C.; Clements, J.D. Mucosal adjuvants. Vaccine 2005, 23, 1804–1813. [Google Scholar]
- Sanchez, J.; Holmgren, J. Cholera toxin structure, gene regulation and pathophysiological and immunological aspects. Cell Mol. Life Sci. 2008, 65, 1347–1360. [Google Scholar]
- Rappuoli, R.; Pizza, M.; Douce, G.; Dougan, G. Structure and mucosal adjuvanticity of cholera and Escherichia coli heat-labile enterotoxins. Immunol. Today 1999, 20, 493–500. [Google Scholar]
- Kotloff, K.L.; Sztein, M.B.; Wasserman, S.S.; Losonsky, G.A.; DiLorenzo, S.C.; Walker, R.I. Safety and immunogenicity of oral inactivated whole-cell Helicobacter pylori vaccine with adjuvant among volunteers with or without subclinical infection. Infect. Immun. 2001, 69, 3581–3590. [Google Scholar]
- Lapa, J.A.; Sincock, S.A.; Ananthakrishnan, M.; Porter, C.K.; Cassels, F.J.; Brinkley, C.; Hall, E.R.; van Hamont, J.; Gramling, J.D.; Carpenter, C.M.; Baqar, S.; Tribble, D.R. Randomized clinical trial assessing the safety and immunogenicity of oral microencapsulated enterotoxigenic Escherichia coli surface antigen 6 with or without heat-labile enterotoxin with mutation R192G. Clin. Vaccine Immunol. 2008, 15, 1222–1228. [Google Scholar]
- Lemere, C.A. Developing novel immunogens for a safe and effective Alzheimer's disease vaccine. Prog. Brain Res. 2009, 175, 83–93. [Google Scholar]
- Mestecky, J.; Russell, M.W.; Elson, C.O. Perspectives on mucosal vaccines: Is mucosal tolerance a barrier? J. mmunol. 2007, 179, 5633–5638. [Google Scholar]
- Williams, N.A.; Hirst, T.R.; Nashar, T.O. Immune modulation by the cholera-like enterotoxins: From adjuvant to therapeutic. Immunol. Today 1999, 20, 95–101. [Google Scholar]
- Di Martino, C.; Basset, C.; Ogier, A.; Charpilienne, A.; Poncet, D.; Kohli, E. Distribution and phenotype of rotavirus-specific B cells induced during the antigen-driven primary response to 2/6 virus-like particles administered by the intrarectal and the intranasal routes. J. Leukoc. Biol. 2007, 82, 821–828. [Google Scholar]
- Ogier, A.; Franco, M.A.; Charpilienne, A.; Cohen, J.; Pothier, P.; Kohli, E. Distribution and phenotype of murine rotavirus-specific B cells induced by intranasal immunization with 2/6 virus-like particles. Eur. J. Immunol. 2005, 35, 2122–2130. [Google Scholar]
- O'Neal, C.M.; Clements, J.D.; Estes, M.K.; Conner, M.E. Rotavirus 2/6 viruslike particles administered intranasally with cholera toxin, Escherichia coli heat-labile toxin (LT), and LT-R192G induce protection from rotavirus challenge. J. Virol. 1998, 72, 3390–3393. [Google Scholar]
- Parez, N.; Fourgeux, C.; Mohamed, A.; Dubuquoy, C.; Pillot, M.; Dehee, A.; Charpilienne, A.; Poncet, D.; Schwartz-Cornil, I.; Garbarg-Chenon, A. Rectal immunization with rotavirus virus-like particles induces systemic and mucosal humoral immune responses and protects mice against rotavirus infection. J. Virol. 2006, 80, 1752–1761. [Google Scholar]
- Sakaguchi, S.; Yamaguchi, T.; Nomura, T.; Ono, M. Regulatory T cells and immune tolerance. Cell 2008, 133, 775–787. [Google Scholar]
- Lehner, T. Special regulatory T cell review: The resurgence of the concept of contrasuppression in immunoregulation. Immunology 2008, 123, 40–44. [Google Scholar]
- Hori, S.; Nomura, T.; Sakaguchi, S. Control of regulatory T cell development by the transcription factor Foxp3. Science 2003, 299, 1057–1061. [Google Scholar]
- Chen, W.; Jin, W.; Hardegen, N.; Lei, K.J.; Li, L.; Marinos, N.; McGrady, G.; Wahl, S.M. Conversion of peripheral CD4+CD25− naive T cells to CD4+CD25+ regulatory T cells by TGF-beta induction of transcription factor Foxp3. J. Exp. Med. 2003, 198, 1875–1886. [Google Scholar]
- Horwitz, D.A.; Zheng, S.G.; Gray, J.D. Natural and TGF-beta-induced Foxp3(+)CD4(+) CD25(+) regulatory T cells are not mirror images of each other. Trends Immunol. 2008, 29, 429–435. [Google Scholar]
- Jung, Y.J.; Seoh, J.Y. Feedback loop of immune regulation by CD4+CD25+ Treg. Immunobiology 2009, 214, 291–302. [Google Scholar]
- Charpilienne, A.; Nejmeddine, M.; Berois, M.; Parez, N.; Neumann, E.; Hewat, E.; Trugnan, G.; Cohen, J. Individual rotavirus-like particles containing 120 molecules of fluorescent protein are visible in living cells. J. Biol. Chem. 2001, 276, 29361–29367. [Google Scholar]
- Soler, E.; Parez, N.; Passet, B.; Dubuquoy, C.; Riffault, S.; Pillot, M.; Houdebine, L.M.; Schwartz-Cornil, I. Recombinant rotavirus inner core proteins produced in the milk of transgenic rabbits confer a high level of protection after intrarectal delivery. Vaccine 2007, 25, 6373–6380. [Google Scholar]
- Baumgarth, N.; Tung, J.W.; Herzenberg, L.A. Inherent specificities in natural antibodies: A key to immune defense against pathogen invasion. Springer Semin. Immunopathol. 2005, 26, 347–362. [Google Scholar]
- Fromantin, C.; Jamot, B.; Cohen, J.; Piroth, L.; Pothier, P.; Kohli, E. Rotavirus 2/6 virus-like particles administered intranasally in mice, with or without the mucosal adjuvants cholera toxin and Escherichia coli heat-labile toxin, induce a Th1/Th2-like immune response. J. Virol. 2001, 75, 11010–11016. [Google Scholar]
- Masopust, D.; Vezys, V.; Usherwood, E.J.; Cauley, L.S.; Olson, S.; Marzo, A.L.; Ward, R.L.; Woodland, D.L.; Lefrancois, L. Activated primary and memory CD8 T cells migrate to nonlymphoid tissues regardless of site of activation or tissue of origin. J. Immunol. 2004, 172, 4875–4882. [Google Scholar]
- Yu, A.; Zhu, L.; Altman, N.H.; Malek, T.R. A low interleukin-2 receptor signaling threshold supports the development and homeostasis of T regulatory cells. Immunity 2009, 30, 204–217. [Google Scholar]
- Rincon, M.; Tugores, A.; Lopez-Rivas, A.; Silva, A.; Alonso, M.; De Landazuri, M.O.; Lopez-Botet, M. Prostaglandin E2 and the increase of intracellular cAMP inhibit the expression of interleukin 2 receptors in human T cells. Eur. J. Immunol. 1988, 18, 1791–1796. [Google Scholar]
- Iwaz, J.; Lafont, S.; Cordier, G.; Revillard, J.P. Elevation of 3'5' cyclic adenosine monophosphate alters CD3 and CD25 antigens expression in activated T lymphocytes. J. Clin. Lab Immunol. 1989, 29, 85–89. [Google Scholar]
- Lavelle, E.C.; McNeela, E.; Armstrong, M.E.; Leavy, O.; Higgins, S.C.; Mills, K.H. Cholera toxin promotes the induction of regulatory T cells specific for bystander antigens by modulating dendritic cell activation. J. Immunol. 2003, 171, 2384–2392. [Google Scholar]
- Roncarolo, M.G.; Gregori, S.; Battaglia, M.; Bacchetta, R.; Fleischhauer, K.; Levings, M.K. Interleukin-10-secreting type 1 regulatory T cells in rodents and humans. Immunol. Rev. 2006, 212, 28–50. [Google Scholar]
- Sun, J.B.; Flach, C.F.; Czerkinsky, C.; Holmgren, J. B lymphocytes promote expansion of regulatory T cells in oral tolerance: powerful induction by antigen coupled to cholera toxin B subunit. J. Immunol. 2008, 181, 8278–8287. [Google Scholar]
- Yanaba, K.; Bouaziz, J.D.; Haas, K.M.; Poe, J.C.; Fujimoto, M.; Tedder, T.F. A regulatory B cell subset with a unique CD1dhiCD5+ phenotype controls T cell-dependent inflammatory responses. Immunity 2008, 28, 639–650. [Google Scholar]
- Bouaziz, J.D.; Yanaba, K.; Tedder, T.F. Regulatory B cells as inhibitors of immune responses and inflammation. Immunol. Rev. 2008, 224, 201–214. [Google Scholar]
© 2010 by the authors; licensee MDPI, Basel, Switzerland This article is an open-access article distributed under the terms and conditions of the Creative Commons Attribution license (http://creativecommons.org/licenses/by/3.0/).
Share and Cite
Thiam, F.; Martino, C.D.; Bon, F.; Charpilienne, A.; Cachia, C.; Poncet, D.; Clements, J.D.; Basset, C.; Kohli, E. Unexpected Modulation of Recall B and T Cell Responses after Immunization with Rotavirus-like Particles in the Presence of LT-R192G. Toxins 2010, 2, 2007-2027. https://0-doi-org.brum.beds.ac.uk/10.3390/toxins2082007
Thiam F, Martino CD, Bon F, Charpilienne A, Cachia C, Poncet D, Clements JD, Basset C, Kohli E. Unexpected Modulation of Recall B and T Cell Responses after Immunization with Rotavirus-like Particles in the Presence of LT-R192G. Toxins. 2010; 2(8):2007-2027. https://0-doi-org.brum.beds.ac.uk/10.3390/toxins2082007
Chicago/Turabian StyleThiam, Fatou, Cyrille Di Martino, Fabienne Bon, Annie Charpilienne, Claire Cachia, Didier Poncet, John D. Clements, Christelle Basset, and Evelyne Kohli. 2010. "Unexpected Modulation of Recall B and T Cell Responses after Immunization with Rotavirus-like Particles in the Presence of LT-R192G" Toxins 2, no. 8: 2007-2027. https://0-doi-org.brum.beds.ac.uk/10.3390/toxins2082007