Article

Toxigenic Potential of Aspergillus Species Occurring on Maize Kernels from Two Agro-Ecological Zones in Kenya

1
School of Biological Sciences, University of Nairobi P. O. Box 30197–00100 Nairobi, Kenya
2
Department of Public Health Pharmacology and Toxicology, University of Nairobi 30197-00100 Nairobi, Kenya
3
Biotechnology and Food Research, MTT Agrifood Research, 31600 Jokioinen, Finland
*
Author to whom correspondence should be addressed.
Submission received: 24 July 2012 / Revised: 17 October 2012 / Accepted: 17 October 2012 / Published: 25 October 2012
(This article belongs to the Special Issue Mycotoxins in Food and Feed)

Abstract

:
Two agro-ecological zones in Kenya were selected to compare the distribution in maize of Aspergillus spp. and their toxigenicity. These were Nandi County, which is the main maize growing region in the country but where no human aflatoxicoses have been reported, and Makueni County where most of the aflatoxicosis cases have occurred. Two hundred and fifty-five households were sampled in Nandi and 258 in Makueni, and Aspergillus was isolated from maize. Aspergillus flavus and A. parasiticus isolates were tested for the presence of aflD and aflQ genes. Positive strains were induced to produce aflatoxins on yeast extract sucrose and quantified using liquid chromatography-tandem mass spectrometry (LCMSMS). Aspergillus flavus was the most common contaminant, and the incidence of occurrence in Nandi and Makueni was not significantly different (82.33% and 73.26%, respectively). Toxigenic strains were more prevalent than non-toxigenic strains. All the toxigenic strains from Makueni were of the S-type while those from Nandi belonged to the L-type. Quantitative differences in aflatoxin production in vitro between isolates and between strains were detected with S strains producing relatively larger amounts of total aflatoxins, B toxins and lower values for G toxins. This was in accord with the frequent aflatoxicosis outbreaks in Makueni. However some L strains produced considerable amounts of B toxins. Given the widespread distribution of toxigenic strains in both regions, the risk of aflatoxin poisoning is high when favorable conditions for toxin production occur.

Graphical Abstract

1. Introduction

Maize is a staple food crop in Kenya for both urban and rural areas with an estimated 1.6 million hectares under cultivation. It is grown by both small- and large-scale farmers. Small-scale farmers contribute 75% of the total maize produced in the country. The quantity of maize consumed in Kenya per person per year is approximately 98 kg translating to about 30–34 million 90 kg bags per year [1], and in some families maize may be consumed twice daily. Each family in Kenya has a garden if not a farm where they grow maize that is mostly for their own consumption and sometimes for sale signifying the importance of this crop in the country. Several cases of aflatoxicosis have been reported in Kenya yearly since 1981 following consumption of maize contaminated with Aspergillus flavus and aflatoxins. In 1981 the outbreak was as a result of drought followed by heavy rains during harvest of home grown maize [2]. The worst outbreak was in 2004 where 317 cases and 125 deaths were reported [3], and ever since cases have been reported yearly. In 2010 Kenya had about 2.3 million bags (estimated at $69 million) of maize contaminated with aflatoxins making it unfit for both human and livestock consumption and also for trade, which was a loss to the small-scale farmers who depend on the crop for food and income [4].
Aspergillus flavus and A. parasiticus are ubiquitous and cosmopolitan fungi producing aflatoxins on a wide variety of substrates such as maize, peanut and cotton. Aspergillus flavus is a very important toxigenic fungus that produces aflatoxins that are toxic and of great concern because of their health effects on humans and animals [5]. Aspergillus can attack crops at different times, in the field, during harvest, transport and storage. High moisture and temperatures are favorable for the growth of this fungus and toxin production.
In this study two agro-ecological zones were selected to compare the distribution in maize of Aspergillus spp. and their toxigenicity. The Nandi district in the Rift Valley Province was chosen as it is the main maize growing zone in the country, but no aflatoxicosis has been reported in this region. The other zone is the Makueni district in the Eastern Province where most aflatoxicosis cases have been reported.

2. Materials and Methods

2.1. Description of Study Sites

Nandi County lies in the Rift Valley Province at elevations between 900–1800 m with an annual rainfall of between 950 and 1500 mm, a mean temperature of 20 °C and one maize planting season from March to April. Makueni County, on the other hand, is in a semi-arid zone in the Eastern Province at an elevation between 800–1700 m with an annual rainfall of between 300 and 600 mm and a mean temperature of 24 °C. Makueni County has two maize planting seasons, from March to May and from October to December. Across the regions from Nandi to Makueni, mean temperatures increase as rainfall decreases [6].
Three sublocations were selected for sampling from each of the two Counties. This study is part of a larger project whose aim is to survey aflatoxin exposure in the maize value chain. The selection of sublocations for the study in this project was based on rearing of dairy cattle and maize cultivation. Kilibwoni, Kaptumo and Laboret were selected in Nandi County while Ukia, Nguumo and Wote locations were selected in Makueni County. Within the sublocations, households that qualified for sampling were those that had children below five years of age. Such households were listed, and random samplings were carried out to select the required sample size, which was calculated using the formula described by Cochrane [7]. From August to December 2010, 255 households were sampled in Nandi County and 258 households in Makueni County.

2.2. Sample Collection

Five hundred grams of shelled maize kernels were collected randomly in sterile paper bags from the household storage facilities within the sublocations, sealed and stored at 4 °C. Maize stored in sacks was sampled from different parts using a closed spear driven through the top and sides of each sack to obtain a total of 500 g of incremental samples. In stores where there were less than 10 sacks, all were sampled, while for those storing over ten to one hundred, ten sacks were randomly sampled [8].

2.3. Isolation and Identification of Moulds

Five kernels were surface sterilized for 1 min in 2.5% NaOCl, washed in three changes of sterile distilled water and plated on ¼ strength Potato Dextrose Agar (PDA) prepared from Potato Dextrose Broth (Difco) amended with 2 mL/L lactic acid to suppress bacterial contamination. Six replicates from each household were plated. Plated kernels were incubated at 31 °C for three days. Fungal growth colonies on maize kernels were visualized using stereo-binocular microscope (Magnus M24), counted and identified to genus level according to the following authorities: Fusarium spp. according to Nelson et al. [9]; Aspergillus spp., Penicillium spp., and other fungi according to Pitt and Hocking [10]. Representative isolates of fungal species that could not be identified directly were transferred onto PDA and those suspected to be Fusarium were also grown on Spezieller Nahrstoffarmer agar (SNA) and carnation leaf agar medium to confirm the genus using the description by Leslie and Summerell [11]. Only Aspergillus species were single spored and transferred onto PDA medium to study macro and micro morphological characteristics for identification using the taxonomic keys of Klich [12]. These were then transferred onto Aspergillus flavus parasiticus agar (AFPA) as described by Pitt et al. [13], and incubated in the dark at 28 °C for 42 to 72 hrs to confirm group identification by colony reverse color. The isolates were also grown on 5/2 agar medium (5% V-8 juice and 2% agar, pH 5.2) at 30 °C for 7–10 days to induce sclerotia formation for strain classification [14].

2.4. Molecular Characterization

2.4.1. Detection of Aflatoxin Genes aflD (=nor1) and aflQ (=ordA = ord-1)

The conventional naming system of the aflatoxin genes outlined by Yu et al. [15] is used in this report. All Aspergillus flavus isolates (78 from Nandi; 87 from Makueni) and A. parasiticus isolates (22 from Nandi; 7 from Makueni) were tested for presence of aflD, and aflQ genes. The aflD gene encodes an enzyme that catalyzes the conversion of the first stable aflatoxin biosynthesis intermediate, norsolorinic acid to averantin in both A. flavus [16] and A. parasiticus [17] while the aflQ gene is involved in the conversion of O-methylsterigmatocystin (omst) to aflatoxin B1 (AFB1) and aflatoxin G1 (AFG1) and dihydro-O-methylsterigmatocystin (dmdhst) to aflatoxin B2 (AFB2) and aflatoxin G2 (AFG2) in A. parasiticus [18] and in A. flavus [15]

2.4.2. DNA Extraction

A spatula full of spores was transferred from a seven-day old culture into a 2 mL eppendorf tube containing 2 mm diameter glass beads, then 650 µL of lysis CTAB buffer was added and the mixture was ground in a tissue miller at a frequency of 30/sec for 3 minutes after which the samples were incubated at 65 °C for one hour. Proteins were precipitated by adding 600 µL phenol inverted gently and centrifuged at 14000 rpm for 20 minutes. The top aqueous layer was pipetted to a new tube, 600 µL phenol:chloroform (25:24 v/v) was added, inverted gently and centrifuged at 14000 rpm for 20 minutes. This procedure was repeated twice with 600 µL of chloroform. Clean supernatant was transferred to a new 1.5 mL eppendorf tube to which 60 µL 3M sodium acetate (pH8) and 800 µL isopropanol were added, inverted gently and incubated overnight at 4 °C for precipitation. The samples were centrifuged at 14000 rpm for 10 minutes at 4 °C, the supernatant discarded, after which the DNA pellet was washed twice with 1 mL 70% ethanol and centrifuged again at 14000 rpm for 5 minutes at 4 °C. The supernatant was discarded and the DNA pellet dried in an oven with the eppendorf tube lid open at 55 °C for 30 minutes. The pellet was re-suspended in 80 µL low salt TE buffer, 5 µL RNase (1mg/mL) was added to remove any RNA contamination and, depending on the yield after running 1 µL on 1% agarose gel, stored at −20 °C.

2.4.3. PCR Amplification

Polymerase chain reaction (PCR) amplifications were performed on 25 µL of a reaction mixture containing MgCl2-free reaction buffer, 50 mM MgCl2, 10 mM dNTP mix, 10 µM of each primer, 5 U/µL Taq DNA polymerase and 5 ng/µL of template DNA. PCR was carried out as follows: (1) one step at 94 °C for 3 minutes; (2) 30 cycles of the following three steps: 1 minute at 94 °C, 1 minute at 57 °C, 1 minute at 72 °C and (3) one final 10-minute step at 72 °C.
The alfD gene was tested using the primers Nor1-F (5′-ACC GCT ACG CCG GCA CTC TCG GCA C-3′) and Nor1-R (5′-GTT GGC CGC CAG CTT CGA CAC TCC G -3′) developed by Rodrigues, et al., [19]. The aflQ gene was tested using the primers Ord1-gF (5′-TTA AGG CAG CGG AAT ACA AG-3′) and Ord1-gR (5′-GAC GCC CAA AGC CGA ACA CAA A-3′) [20].

2.5. Aflatoxigenicity of the Isolates

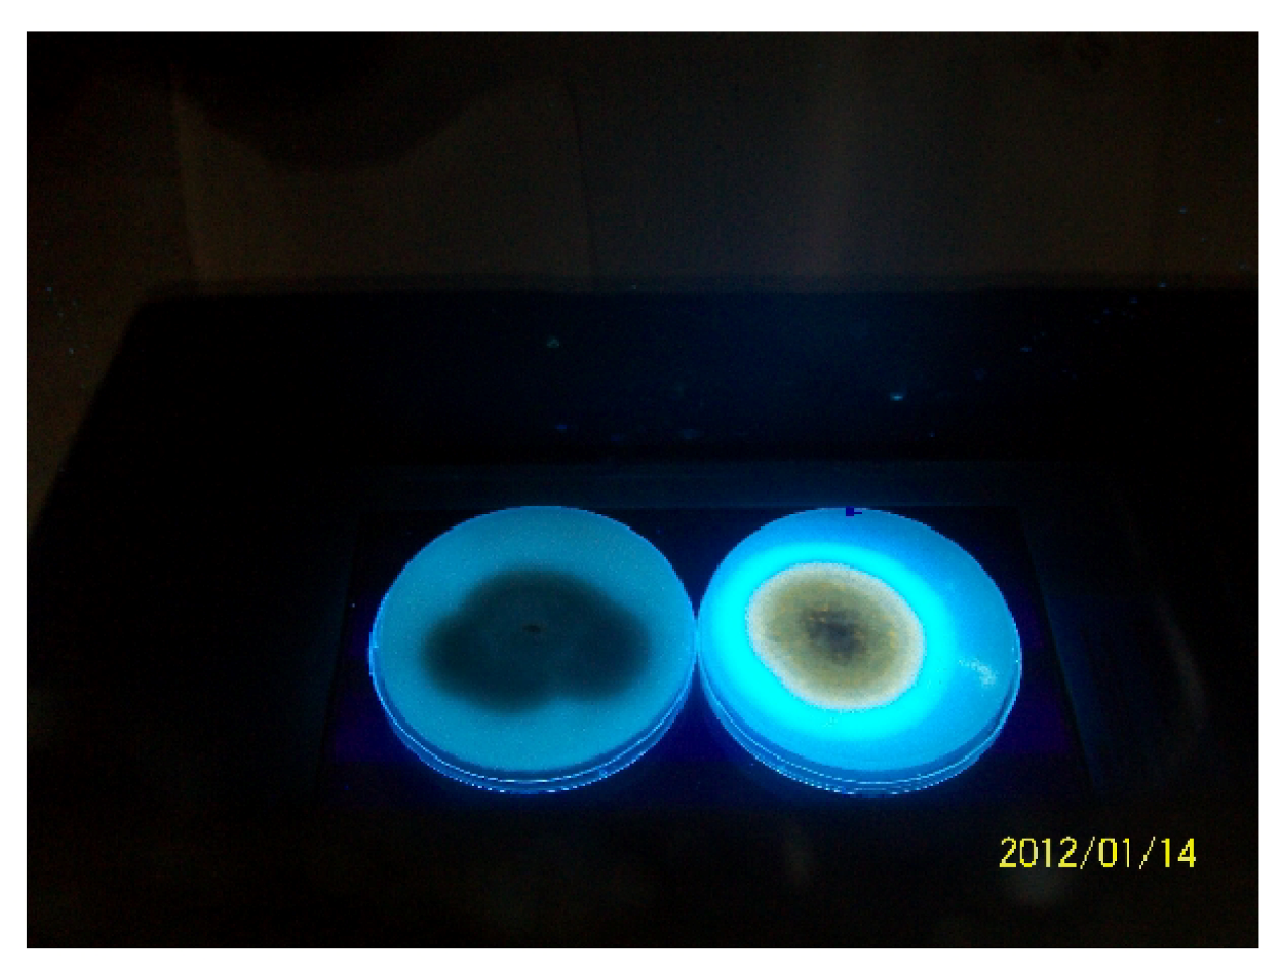
2.5.1. Fluorescence on Coconut Agar Medium (CAM)

Isolates that were positive for either aflD or aflQ or both, were inoculated on coconut agar medium (CAM) to detect aflatoxin production [21]. Four negative isolates from each region were also inoculated on CAM to act as controls. The plates were incubated at 30 °C for 7 days then examined under UV light (365 nm) after 3, 5 and 7 days.

2.5.2. Aflatoxin Analysis

Sixty-five percent of A. flavus isolates that were positive for either aflD or aflQ or both and fluoresced on CAM were randomly selected and grown on aflatoxin-inducing Yeast Extract Sucrose (YES) Agar [19] to test their aflatoxin production profile. All the positive A. parasiticus isolates were also included. The isolates were inoculated on 9 cm diameter Petri plates and incubated at 27 °C for 7 days in the dark. Aflatoxins were extracted using the methods described by Vega [22] and Smedsgaard [23] with some modifications. Using a 9 mm diameter sterile cork borer, 9 plugs were harvested uniformly from the plates into 50 mL propylene tubes. Three plugs were randomly picked and added to a 5 mL amber screw-cap vial of known weight and weighed again. The plugs were extracted in 2 mL methanol:formic acid (25:1) for 1 h at 25 °C ultrasonically. Using a sterile syringe, the extract was drawn from the vials and filtered through 0.2 µm nylon membrane filter discs into a clean autosampler vial (11.6 mm OD × 32 mm height) and analyzed by liquid chromatography-tandem mass spectrometry (LCMSMS) (XevoTM Waters). Aflatoxin standards were supplied by Sigma (South Africa Part number 46300-U). A mix of aflatoxins contained 1000 µg/kg of AFG1 and AFB1 and 3000 µg/kg of AFB2 and AFG2. This mixture was then diluted 10×, 100× and 1000× to create four calibration standards (including the undiluted mix) (1 µg/kg, 10 µg/kg, 100 µg/kg, 1000 µg/kg). These four standards were injected separately onto the LCMSMS, and a calibration curve was created for each of the four aflatoxins (peak area vs. concentration). The injection volume was 10 µL for the aflatoxin standard mix and 5 µL for all the other standards and the samples. The sample concentrations were determined from the area of each of the aflatoxins using the calibration curve of each aflatoxin. The aflatoxin concentration in the Petri dishes was obtained using the equation below:
Toxins 04 00991 i001

2.6. Statistical Analysis

Statistical analysis was done using the program R [24]. Qualitative and quantitative binary Chi square tests for equality of proportions (Pearson's Chi-squared test with Yates' continuity correction) were used to compare frequencies of occurrence of isolates.

3. Results

3.1. Fungal Profile of Maize Kernels from Nandi and Makueni Districts

The internal mycoflora associated with maize kernels after surface sterilization is shown in Table 1. Fungi grew from all Makueni samples, but only from 11% of the Nandi samples. None of samples from the Laboret location grew any fungus up until the 10th day of incubation. Nandi recorded a significantly higher (χ24,0.05 =16.15, p = 0.0028) incidence of fungal growth from the kernels compared to Makueni, Table 1. Aspergillus was the most common fungus isolated from maize in both regions with over 60% incidence in all locations followed by Fusarium species and Penicillium. Other genera were Drechslera, Curvularia, Rhizopus and Alternaria. Variations in contamination were also observed within the regions with Kaptumo in Nandi and Ukia in Makueni having the highest fungal incidence (χ24,0.05 = 65.4; p < 0.0001). Within the locations, Aspergillus was still the predominant genus and the incidence of occurrence of all the other genera varied with locations. In Nandi, Aspergillus was predominant in Kaptumo while Fusarium and Penicillium was more common in maize from Kilibwoni. In Makueni, Aspergillus was predominant in samples from Nguumo while Fusarium and Penicillium were frequently isolated from Ukia samples.
Table 1. Frequency of isolation of fungi from maize kernels in locations in two regions in Kenya.
RegionFungal genera
Aspergillus sp.Fusarium sp.Penicillium sp.Trichoderma sp.OthersTotal
Makueni189 (62)71 (23)25 (8)10 (3)12 (4)307(100)
Nguumo70 (73)16 (17)4 (4)1 (1)5 (5)96 (100)
Ukia82 (52)48 (31)17 (11)7 (4)3 (2)157(100)
Wote37 (69)7 (13)4 (7)2 (4)4 (7)54 (100)
Nandi203 (67)50 (16)18 (6)6 (2)29 (9)306 (100)
Kaptumo94 (73)16 (13)6 (5)0 (0)12 (9)128 (100)
Kilibwoni58 (54)27 (25)9 (8)6 (6)7 (7)107 (100)
Laboret51 (72)7 (10)3 (4)0 (0)10(14)71 (100)
Total (Nandi + Makueni)392 (64)121 (20)43 (7)16 (3)41 (6)613 (100)
(1). The values are frequencies while those in brackets are row percentages. (2). The frequencies of isolating different genera varied significantly with regions (Chi sq = 16.15, df = 4, p = 0.0028). (3). The frequencies of isolating different genera varied significantly with location (Chi sq = 65.4, df = 20, p < 0.0001).

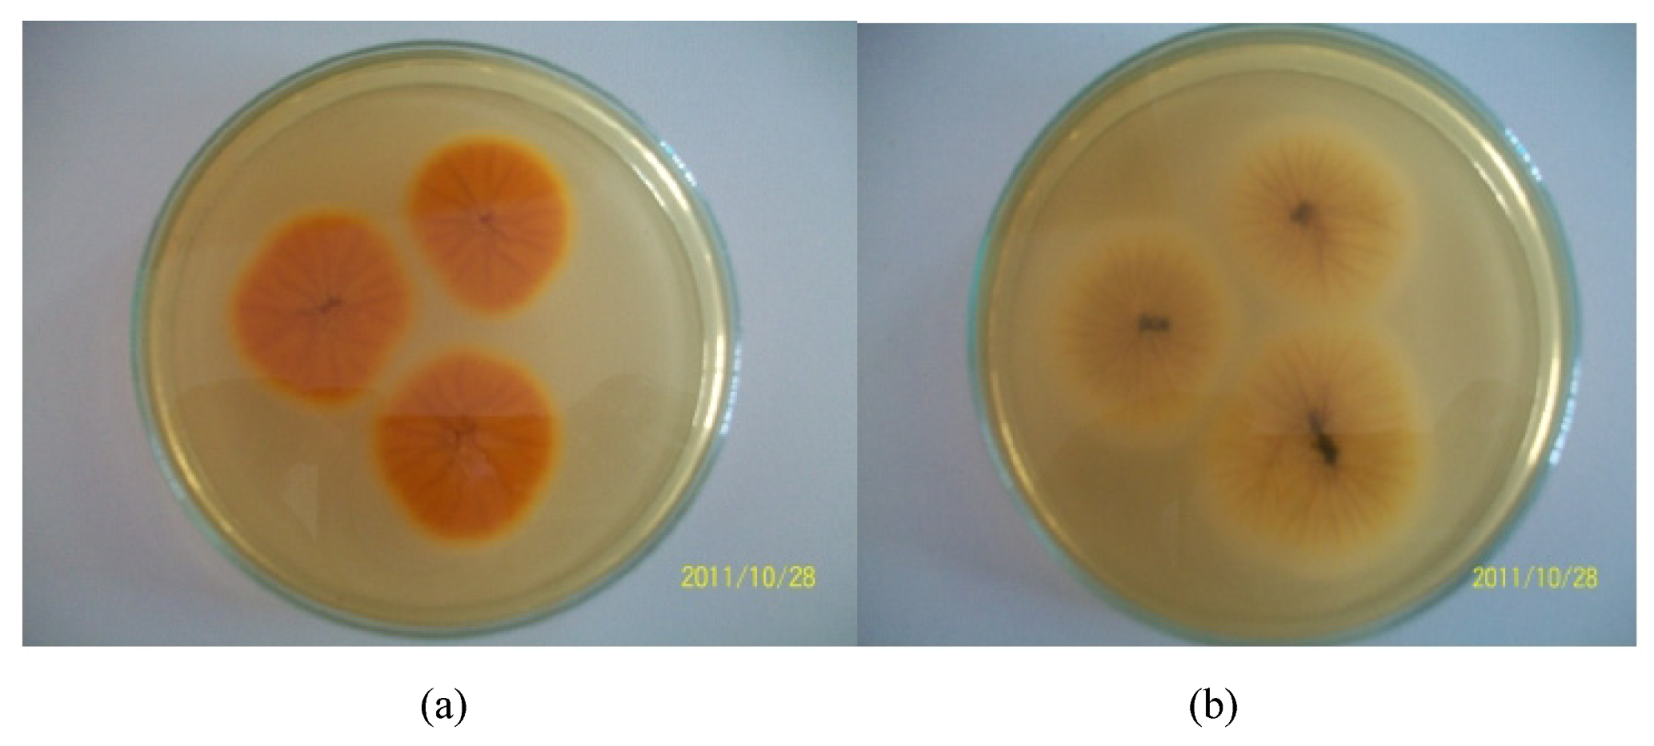
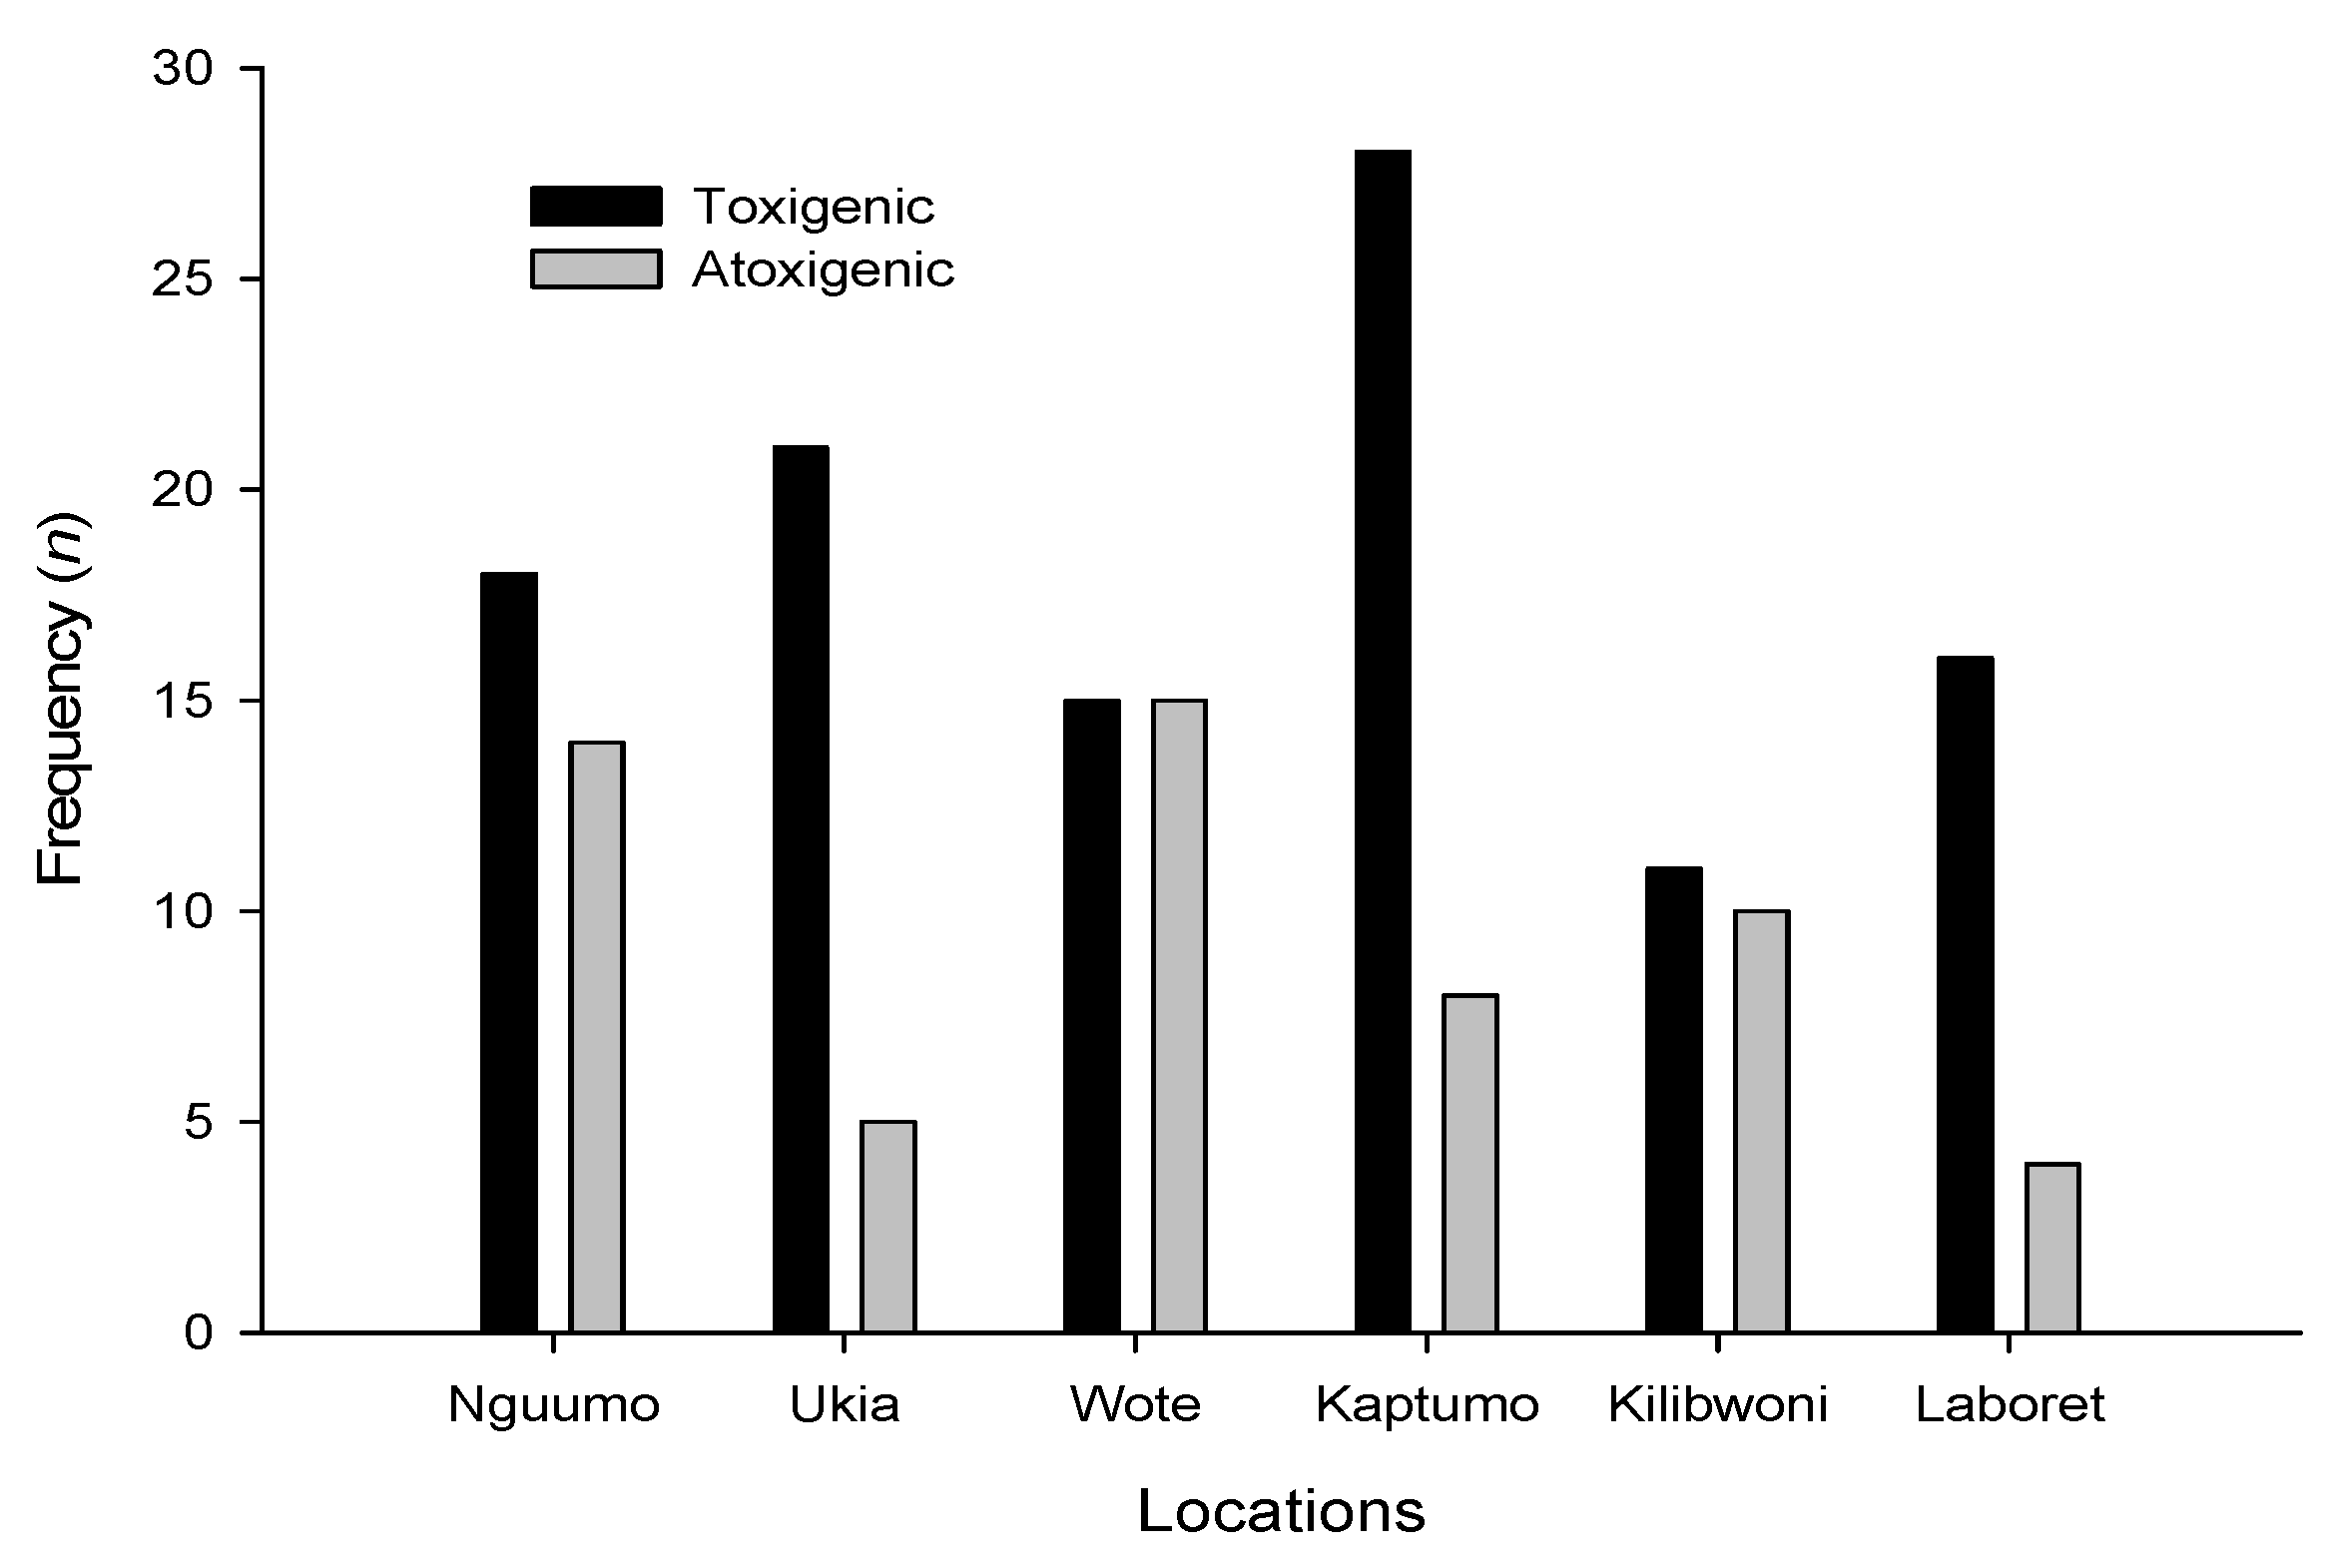
3.2. Population Composition of the Genus Aspergillus

Aspergillus was present in 80% (n = 203) and 73% (n = 189) of the samples from Nandi and Makueni, respectively. This variation was not significant (χ20.05(1) = 1.885; p-value = 0.1698). However, there was evidence of variation in Aspergillus presence in maize among the locations (χ20.05(5) = 50.5662; p-value = 1.061e-09).
Members of Section Flavi, identified with a bright orange reverse color on the AFPA medium (Figure 1a), were the most dominant species occurring in maize constituting 60% of the total isolates. This was followed by Section Nigri (27%) Section Fumigati (9.7%), Section Circumdati (3%) and Section Clavati (0.3%), Negative isolates had either cream or black reverse colors as shown in Figure 1b.
Within the locations the highest incidence of Section Flavi was recorded in Nandi and the lowest in Makueni (Table 2). Three species, A. tamarii, A. flavus and A. parasiticus were all recovered from maize kernels. Aspergillus flavus was the most prevalent in both Nandi and Makueni (58.3%; n = 78; 82.8%; n = 87, respectively), followed by A. tamarii (25.8%; n = 33; 10.8%; n = 10) and A. parasiticus (15.9%; n = 21; 6.6%; n = 6). All the three species frequently occurred singly. Co-occurrence was observed between A. tamarii and A. flavus in eight households and A. flavus and A. parasiticus in three households. A flavus was predominant in Makueni maize. Aspergillus parasiticus and A. tamarii were frequently isolated from Nandi than Makueni.
Figure 1. Aspergillus isolates grown on Aspergillus flavus parasiticus agar (AFPA) medium to identify members belonging to Section Flavi; (a) Positive isolate (b) Negative isolate.
Toxins 04 00991 g001
Morphological characteristics of A. flavus and A. parasiticus on AFPA and V8-juice was used to differentiate the two species. Aspergillus flavus had yellow green colonies, was predominantly biseriate or biseriate and uniseriate with smooth to finely rough conidia; while A. parasiticus had dark green colonies with a diameter of between 24–36 mm, was predominantly uniseriate or uniseriate with 20% biseriate and had rough conidia. Aspergillus tamarii had dark brown colonies with a diameter of 2–10 mm, was uniseriate with spiky globose conidia. The reverse of A. tamarii was bright orange in early stages and turned dark brown after four days.
All the isolates were grown on V8-juice agar for sclerotia formation. Sclerotia formed on the surface of the agar after 3–7 days of inoculation. Sclerotia formation was more frequent from Makueni A. flavus isolates (71%; n = 61) compared to Nandi (37%; n = 29). Further, Makueni isolates were all of the S-type producing sclerotia with a diameter range of 200–320 µm. Nandi isolates on the other hand were all L-type producing sclerotia of a diameter range of 1000–3100 µm. Sclerotia formed by A. parasiticus isolates from Nandi (935–1590 µm) were larger than those of Makueni isolates (240–280 µm). Aspergillus tamarrii did not form sclerotia on V8-juice agar (Table 2).
Table 2. Distribution and characteristics of Aspergillus Section Flavi in two agro-ecological zones, Kenya.
LocationNumber of isolatesA. flavus (%)StrainA. parasiticus (%)A. tamarii (%)
NandiKilibwoni3364L2115
Kaptumo6555L936
Laboret3462L2612
No. producing sclerotia (%) 37 (n = 29) 19 (n = 4)0
MakueniNguumo4195S50
Ukia4267S726
Wote2094S60
No. producing sclerotia (%) 71(n = 61) 67 (n = 4)0
Figure 2. Agarose gel electrophoretic pattern of polymerase chain reaction (PCR) products expressing aflD and aflQ genes. (a) Aspergillus flavus isolates from Makueni county : M—molecular weight 100 bp ladder (Promega); -C—Negative control 3VM482dg; -C—Negative control 1VM291br; +C—Positive control 1VM118g; +C— (2VM963Lg); 1—2M1090; 2—2VM983br; 3—1VM147g; 4—1VM97yg; 5—3VM566g; 6—2VM902br; 7—1VM83y; 8—3VM566Lg; 9—1VM403g; 10—2VM964yg; 11—1VM132g; 12—1VM408dg; 13—1VM239g; 14—1VM79g; 15—3VM482dg; 16—1VM328g; 17—1VM175g; 18—3VM671g; 19—1VM39wy; 20—2VM966yg; 21—2M1223yg; 22—2VM882g; 23—2VM890g; 24—2VM892g; 25—1VM80sg. (b) Aspergillus flavus isolates from Nandi county: M—molecular weight 100 bp ladder; 1—BM69YG; 2-BM38YG; 3—BM73YG; 4—BMG; 5—BM1YG; 6—BM10YG; 7—BMYG
Toxins 04 00991 g002

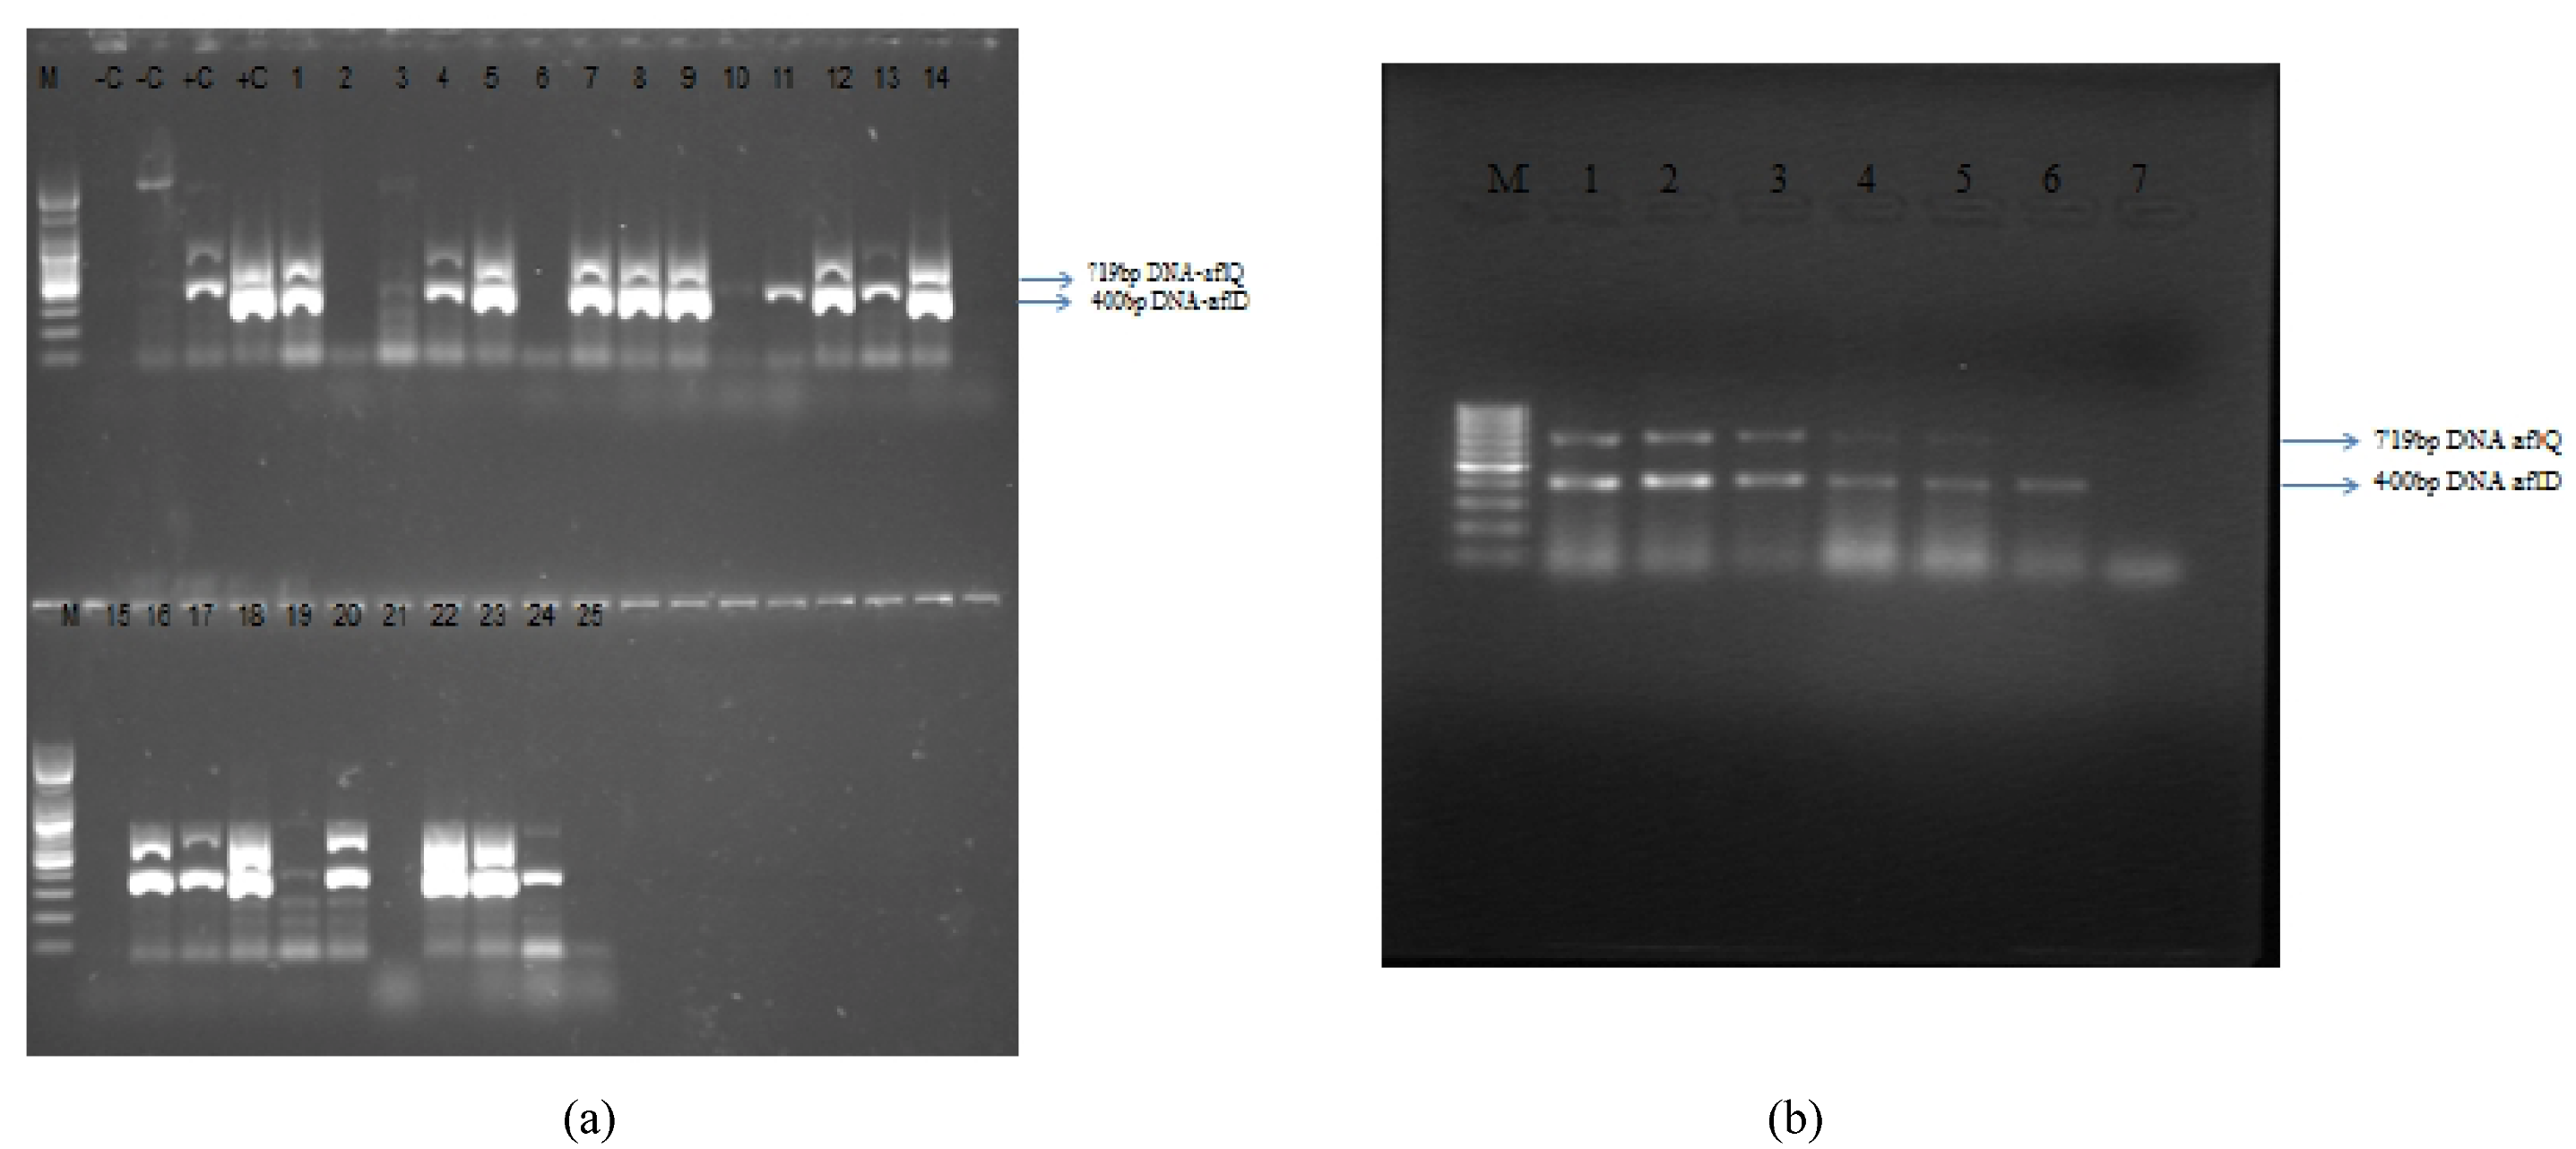
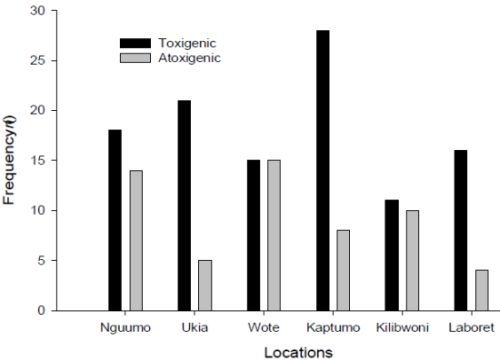
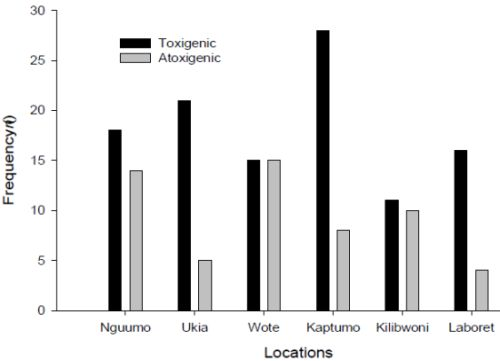
3.3. Molecular Analysis of Aspergillus Strains and Aflatoxin Production on CAM

Figure 2 is a representative of the electrophoretic band patterns obtained for both aflD (400 bps) and aflQ (719 bps). All isolates that were positive for any one or both gene amplicons fluoresced on CAM after 3 days of incubation at 28 °C, whereas those that were negative for both aflD and afl Qamplicons did not fluoresce. Figure 3 shows colonies of non-aflatoxigenic and aflatoxigenic isolates of A. flavus observed under UV light.
Of the 78 A. flavus isolates tested in Nandi 71% (n = 55) were positive for the aflatoxigenic genes while in Makueni 87 isolates were tested and 62% (n = 54) positive. This difference was not significant (χ20.05(1) = 1.2422; p = 0.265). Positive (toxigenic) strains were significantly predominant over negative (non-toxigenic) strains in all the locations (Table C; χ20.05(5) = 54.9; p < 0.0001). Figure 4 shows the distribution of toxigenic and non-toxigenic isolates within the locations. Ukia, Laboret and Kaptumo had over 70% occurrence of toxigenic isolates compared with non-toxigenic isolates.
Figure 3. Colonies of non-aflatoxigenic and aflatoxigenic strains of Aspergillus flavus observed under ultra violet light. Strains were cultivated in Yeast Extract Sucrose (YES) medium and photographed on the third day of incubation at 28 °C.
Toxins 04 00991 g003
Figure 4. Frequency of toxigenic strains of Aspergillus flavus in two zones in Kenya.
Toxins 04 00991 g004
Of the seven A. parasiticus isolates from Makueni, four expressed the toxigenic genes while in Nandi out of the 22 isolates, four were positive.

3.4. Production of Aflatoxins by the Isolates in Vitro

All the 78 isolates with toxigenic genes produced AFB1. Only six did not produce AFB2. AFB1 was produced in the largest quantities (highest of 83491 ppb from Makueni and 64030 ppb from Nandi) followed by AFB2 (highest 52600 ppb from Makueni and 59231 ppb from Nandi), AFG1 (highest 28728 from Makueni and 48914 ppb from Nandi) and lastly AFG2 (highest 8411 ppb from Makueni and 9629 ppb from Nandi). Makueni isolates produced more AFB1 and AFB2 than Nandi isolates while the reverse was true for the G aflatoxins. AFB2 was detected in all isolates except four from Nandi and two from Makueni. Out of the 83 isolates, AFG1 was not detected in 14 samples (11 from Nandi and three from Makueni). AFG2 was detected in only eight isolates (four from Nandi and another four from Makueni). Ten isolates from Nandi and five from Makueni did not produce G aflatoxins. The amount of toxins produced varied with isolates (Table 3).
Table 3. Production of aflatoxins in vitro by Aspergillus flavus and A. parasiticus isolates from Makueni and Nandi. Values reading nil (not detected) equal <20 ng
(a) Makueni isolates
CodeIsolateAFB1 (µg/kg)AFB2 (µg/kg)AFG1 (µg/kg)AFG2 (µg/kg)Total Aflatoxin (µg/kg)
1VM326gA. flavus815920372010199
2VM890gA.flavus1991695641229484
Kp-BA. flavus1502343601850
2VM983gA.flavus13143226520015427
2M1204gA. flavus1271300140
Km-AA. flavus5705062.133
1VM79gA. flavus2577500332.35
2M1002LA.flavus633903377717097184
1VM403gA.flavus10113343822013574
1VM147gA. flavus898267001165
2M1014gA. flavus7028210785
1VM402gA.flavus12032698917019038
2VM892gA.flavus331731445822047653
1VM83yA. flavus198872120302912
3VM482gA.flavus14092894730023069
1VM235gA. flavus45913570602
1VM130dA.flavus618783034922092249
1VM175gA.flavus522291510020067350
3VM559gA. flavus1686200701893.2
2M1090gA. flavus516505686411971
1VM223gA.flavus32145152453656547820
2M1016gA. flavus7982291201039
1VM328gA.flavus31797674354038594
Km-BA. flavus67381.356120766
2VM882gA.flavus309391162710042576
2M1365gA.flavus8349152600168750152966
3VM551gA.flavus306371362021044278
UmA. flavus1692420802120
2M1383gA. flavus2704770324
2M1122gA. flavus502810084206078
1VM250A. flavus2719969803695
1VM95ygA.flavus593742945625088878
1VM79LgA. flavus1073382301458
3VM643gA.flavus3394700387
2VM983gA. parasiticus2200022
1VM149gA.parasiticus15139314128728841155419
1VM118gA. parasiticus97690112
2VM983A. parasiticus4588061
(b) Nandi isolates
CodeISOLATEAFB1 (µg/kg)AFB2 (µg/kg)AFG1 (µg/kg)AFG2 (µg/kg)Total Aflatoxin (µg/kg)
BM I YGA.flavus4240046
BM130YGA.flavus640301658351080664
BM112YGA.flavus13775205448914962474367
BM 43 GA.flavus8985670962
BM 12 GA.flavus35022057
BM 1 GA.flavus1103830151
BM 59 GA.flavus2110022
BM 1GA.flavus10164262217012803
BM 3 YGA.flavus39849096
BM 1 GA.flavus57142592312920116666
BM 3 GA.flavus2373033
BM 9 GA.flavus2200022
BM 54 YGA.flavus12888927244022203
BM 80 GA.flavus62332857009089
BM 1 YGA.flavus9100091
BM 78 YGA.flavus3174042
BM 1 YGA.flavus1192510145
BM 14 GA.flavus377124889826779823883
BM 69 GA.flavus1660022
BM 1 GA.flavus4060046
BM 1 YGA.flavus2004340247
BM 1 GA.flavus10058121717011292
BM 49 GA.flavus64102077
BM 1 YA.flavus10892070325
BM 1 GA.flavus1296046617017628
BM 55 YGA.flavus13288807254021413
BM 1 YGA.flavus771848768018632
BM 1 YGA.flavus29232551403463
BM 2 YGA.flavus806488901304
BM 3 YGA.flavus42137063
BM 4 YGA.flavus2165300269
BM 2 GA.flavus3383044
BM 1 GA.flavus1800018
BM 1 YGA.flavus1922024
BM 1 GA.flavus4150046
BM 2 GA.flavus13918630221
BM 38 YGAparasiticus10763287624013662
BM 39 GA.parasiticus110778321288013197
BM 1 YGA.parasiticus6032081699779810308
BM 1 GA.parasiticus991292598227179982
Comparative toxin readings from A. parasiticus isolates from both regions were not as high as those from A. flavus. Isolates from Nandi produced more toxins compared to those from Makueni.

4. Discussion

The results obtained in this study have provided, for the first time, an important comparison of fungal contamination between maize sampled in Makueni County, the main region that has experienced repeated lethal human aflatoxicosis outbreaks and Nandi County, the main maize growing region in Kenya. The study shows that Aspergillus, specifically Section Flavi, are the main contaminants of maize in household storage in the two regions and A. flavus was the most common species. The incidence of occurrence of A. flavus in Nandi and Makueni was the same regardless of the differences in mean temperatures (20 °C and 24 °C, respectively) and rainfall (900–1800 and 950–1500 mm). High temperatures and drier conditions are known to favor infection by A. flavus but this was not the case in this study. Similar results were observed in Nigeria [25].
Toxigenic strains of A. flavus were more prevalent than non-toxigenic strains across five out of the six locations. This indicates the risk of aflatoxin poisoning in the event that favorable conditions occur in both regions. The widespread occurrence of the fungus indicates the extent of pre-harvest infection; thus field management strategies stand out as an indispensible intervention strategy towards the fight against aflatoxin contamination of maize in Kenya. In this regard, Abbas et al., [26] observed a higher incidence and greater numbers of A. flavus infection and toxin production when there was no crop rotation. Maize is planted in the same fields every season in the two regions. The importance of field management is further stressed by Zablotowicz et al., [27] who report that the history of maize cultivation in terms of soil fertility factors correlates with the occurrence of A. flavus and toxin production.
All the A. flavus toxigenic strains from Makueni maize were of the S-type while those from Nandi belonged to the L type. Quantitative and qualitative differences in aflatoxin production in vitro between isolates and between these strains were detected. The S strains were confirmed to produce relative larger amounts of total aflatoxins, AFB1 and AFB2 and lower values for AFG1 and AFG2 in vitro compared with the L strains. AFB1 is known to be more toxic than the other aflatoxins, and this explains why the S strain has been associated with acute aflatoxin poisoning in Makueni [28]. This is accentuated by high temperatures in Makueni (range 20–28 °C) compared to Nandi (range 18–24 °C), which promotes toxin production [6,29]. However, some L strain isolates from Nandi produced large amounts of AFB1 and AFB2 contrary to the findings of Cotty [13], and Egel [30]. It is important that in vivo tests for toxin production with the L strains from Nandi are done to confirm the capability of these isolates to produce large amounts of toxin. These L strains pose a threat of endemic chronic exposure to humans if the maize is exposed to conditions suitable for toxin production given that they are distributed widely in the region. Further, Nandi is the major maize production zone in the country implying that the maize is distributed to most parts of the country. Control of moisture and temperature during transportation and storage is important since the maize is already contaminated with the toxigenic A. flavus. The most toxic AFB1 were produced in larger quantities compared to the AFB2. AFG1 were produced in low quantities and only eight out of 78 samples tested produced AFG2.
This is the first report of A. flavus S and L strains isolated from Kenya producing both B and G aflatoxins on YES agar. Probst et al., [3,28] isolated in Kenya both S and L strains, which produced only B aflatoxins on maize. Ehrlich et al., [31] reported that all members of A. flavus lack the ability to synthesize G aflatoxins due to a 0.8- to 1.5-kb deletion in the 28-gene aflatoxin biosynthesis cluster agreeing with Cotty and Cardwell [32] and Egel [29]. However, S strains from Benin produced both AFB1 and AFG1 aflatoxins [33]. Davis et al., [34] also observed production of aflatoxin AFB1 and AFG1 by A. flavus in a synthetic medium. Cotty and Cardwell [32] reported that SBG strains from the United States and West Africa produced both B and the G aflatoxins. It is not clear if the difference in media is the reason for the variation in the production of B and G toxins or if the isolates that produced both toxins in this study are similar to the SBG strains referred to above. However Abbas et al. [35] demonstrated that cultural methods are suitable and effective in screening aflatoxin production by Aspergillus isolates. Aspergillus parasiticus was rare in both regions. The number of isolates was too small to allow a conclusion on their toxin production ability. The main source of aflatoxin contamination in maize in eastern and western Kenya is A. flavus.
Incidences of sclerotia formation were greater among the S-type than the L-type on V8-juice agar. Sclerotia are important survival structures in the life cycle of many fungi. When conditions are favorable, they germinate into hyphae, which then form conidia. The conidia are blown away by the wind and reinfect maize kernels through the silk. Studies on the conditions responsible for sclerotium initiation might be important to develop methods for suppressing the formation of sclerotia, resulting in reduced survival of the fungus and better disease management [36]. Sclerotia have been associated with aflatoxin production [37]. However Cotty [14] explains that failure of some isolates of A. flavus to produce sclerotia on culture media can be due to one of the following: an attenuation of sclerotial production in culture, an unfavorable medium, unfavorable temperature, the differential sensitivity of isolates to light, or other environmental constraints in culture and that strain L isolates require more precise conditions to produce sclerotia than strain S isolates. However, disagreements between studies correlating the sclerotial production of isolates with aflatoxin production exist [37].
Apart from the risk of aflatoxin contamination of maize, bio-deterioration is another problem associated with high fungal contamination of kernels [38]. The internal mycoflora of maize in Nandi and Makueni is similar and is dominated by the species of Aspergillus, Fusarium and Penicillium, which predisposes the kernels to bio-deterioration. The resulting physiological and biochemical changes in the maize kernels eventually render grains unsuitable for human consumption. In addition, species of the genera Fusarium, Penicillium and Alternaria were isolated and some species are capable of producing a wide spectrum of compounds shown to be toxic to man and animals [39] and so increase the risk of multi-mycotoxin contamination and exposure.
About 40% of maize kernel contamination was caused by Fusarium and less frequently Penicillium and Alternaria were also part of the internal mycoflora of maize. Fusarium species are the most important mycotoxin producers in northern temperate regions and their presence as part of the internal mycoflora of maize raises a concern. Occurrence of Fusarium spp. in maize in Kenya and fumonisin production has been reported previously [40]. Muthomi, et al., [41] reported Fusarium as the most predominant species in maize from eastern Kenya and not Aspergillus, but this observation may have been influenced by the fact that a Fusarium selective media was used for isolation. The frequency of isolation of Aspergillus, Fusarium, Penicillium and Alternaria was the same in the two regions. However, location variation was significant and this may be attributed to differences in pre- and post-harvest management practices, at location and household level. There was a high incidence of Aspergillus contamination in Nguumo and Kaptumo. Fusarium and Penicillium were dominant in Kilibwoni and Ukia. Laboret, a location constituted mostly of medium scale maize producers, recorded the highest incidence of clean maize. Medium-scale farmers are better placed to manage farming and storage of maize than small-scale farmers resulting in reduced aflatoxin contamination.

5. Conclusions

This research has shown that A. flavus is the main fungal species infecting maize grains in Kenya and that toxigenic strains are widespread. The situation is accentuated in the Eastern Province by the existence of the highly toxigenic S strain and high prevailing temperatures. However, the presence of the L strains should not be overlooked, as this indicates the possibility of chronic exposure from the lower levels of toxins produced by these strains. The influence of aflatoxins on human populations in Kenya over the past decade demonstrates a clear need for tools to manage contamination of locally produced maize. Given the widespread nature of toxigenic strains, any control strategy will have to include field interventions. Fungal infection of maize varies with households and this reflects different farm management practices, some of which adversely contribute to contamination of the maize value chain.

Conflict of Interest

The authors declare no conflict of interest.

Acknowledgements

This work is part of the Safe Food Safe Dairy Project funded by the Finnish Ministry of Foreign Affairs. We also extend our gratitude to African Women in Agricultural Research and Development (AWARD) for their financial support for toxin analysis at the Fusarium Laboratory, Department of Plant Pathology, Stellenbosch University in South Africa and the latter for their time and scientific guidance.

References

  1. Nyoro, J.K.; Kirimi, L.; Jayne, T.S. Competitiveness of Kenya and Ugandan maize production: challenges for the future; Tegemeo Working Paper Series, No. 10; Egerton University: Kenya, 2004; pp. 1–37. [Google Scholar]
  2. Ngindu, A.; Kenya, P.R.; Ochieng, D.M.; Omondi, T.M.; Ngare, W.; Gatei, D. Outbreak of acute hepatitis caused by aflatoxin poisoning in Kenya. Lancet 1982, 1, 1346–1348. [Google Scholar]
  3. Probst, C.; Njapau, H.; Cotty, P.J. Outbreak of an acute aflatoxicosis in Kenya in 2004: identification of the causal agent. Appl. Environ. Microbiol. 2007, 73, 2762–2764. [Google Scholar]
  4. Kesley, G. Aflatoxin Contamination of maize in Africa. Biosecurity Blog. 2010. Available online: http://www.fas.org/blog/nutshell/2010/06/aflatoxin-contamination-of-maize-in-africa/ (accessed on 12 April 2012).
  5. World Health Organization, Some naturally occurring substances: food items and constituents, heterocyclic aromatic amines and mycotoxins, Monograph 56; International Agency for Research on Cancer: Lyon, France, 1993.
  6. FAO (Food and Agricultural Organization), Agro-ecological Zoning guidelines, FAO Soils Bulletin 73; FAO: Rome, Italy, 1996.
  7. Cochran, W.G. Sampling Techniques, 2nd ed; John Wiley and Sons Inc.: New York, NY, USA, 1963. [Google Scholar]
  8. Traisat, H. Mycotoxin prevention and control in food grains. In Sampling, sample handling and preparation in grains and cereals; Semple, R.L., Frio, A.S., Hicks, P.A., Lozare, J.V., Eds.; UNDP/FAO Regional Network Inter-Country Cooperation on Preharvest Technology and Quality Control of Foodgrains (REGNET) and the ASEAN Grain Postharvest Programme: Bankok, Thailand, 1989. [Google Scholar]
  9. Nelson, P.E.; Tousson, T.A.; Marasas, W.F.O. Fusarium FusariumSpecies: An Illustrated Manual for Identification; Pennsylvania State University Press: University Park, Pennsylvania, USA, 1983. [Google Scholar]
  10. Pitt, J.I.; Hocking, A.D. Fungi and Food Spoilage; Blackie Academic and Professional: London, UK, 1997. [Google Scholar]
  11. Leslie, J.F.; Summerell, B.A. The Fusarium Laboratory Manual; Blackwell Publishing: Ames, IA, USA, 2006. [Google Scholar]
  12. Klich, M.A. Biogeography of Aspergillus species in soil and litter. Mycologia 2002, 94(1), 21–27. [Google Scholar] [CrossRef]
  13. Pitt, J.I.; Hockings, I.; Glend, I. An improved medium for the detection of Aspergillus flavus and A. parasiticus. J. Appl. Bact. 1983, 54, 109–114. [Google Scholar] [CrossRef]
  14. Cotty, P.J. Virulence and cultural characteristics of two Aspergillus flavus strains pathogenic on cotton. Phytopathology 1989, 79(7), 808–814. [Google Scholar] [CrossRef]
  15. Yu, J.; Chang, P.K.; Cary, J.W.; Ehrlich, K.C.; Montalbano, B.; Dyer, J.M.; Bhatnagar, D.; Cleveland, T.E. Characterization of the critical amino acids of an Aspergillus parasiticus cytochrome P450 monooxygenase encoded by ordA involved in aflatoxin B1, G1, B2, and G2 biosynthesis. Appl. Environ. Microbiol. 1998, 64, 4834–4841. [Google Scholar]
  16. Papa, K.E. Norsolorinic acid mutant of Aspergillus flavus. J. Gen. Microbiol. 1982, 128, 1345–1348. [Google Scholar]
  17. Bennett, J.W. Loss of norsolorinic acid and aflatoxin production by a mutant of Aspergillus parasiticus. J. Gen. Microbiol. 1981, 124, 429–432. [Google Scholar]
  18. Cleveland, T.E. Conversion of dihydro-O-methylsterigmatocystin to aflatoxin B2 by Aspergillus parasiticus. Arch. Environ. Contam. Toxicol. 1989, 18, 429–433. [Google Scholar] [CrossRef]
  19. Rodrigues, P.; Armando, V.; Zofia, K.; Nelson, L. A polyphasic approach to the identification of aflatoxigenic and non-aflatoxigenic strains of Aspergillus section Flavi isolated from Portuguese almonds. Int. J. Food Microbiol. 2009, 129, 187–193. [Google Scholar] [CrossRef] [Green Version]
  20. Sweeney, M.J.; Pamies, P.; Dobson, A.D.W. The use of reverse transcription-polymerase chain reaction (RT-PCR) for monitoring aflatoxin production in Aspergillus parasiticus 439. International. J. Food Microbiol. 2000, 56, 97–103. [Google Scholar] [CrossRef]
  21. Dyer, S.K.; McCammon, S. Detection of toxigenic isolates of Aspergillus flavus and related species on coconut cream agar. J. Appl. Bacteriol. 1994, 76(1), 75–78. [Google Scholar] [CrossRef]
  22. Vega, E.F.; Posada, F.; Peterson, W.S.; Gianfagna, J.T.; Chaves, F. Penicillium species endophytic in coffee plants and Ochratoxin A production. Mycologia 2006, 98(1), 31–42. [Google Scholar] [CrossRef]
  23. Smedsgaard, J. Micro-scale extraction procedure for standardized screening of fungal metabolite production in cultures. J. Chromatogr. 1997, 760, 264–270. [Google Scholar] [CrossRef]
  24. R Development Core Team. A language and environment for statistical computing. R Foundation for Statistical Computing, Vienna, Austria. Available online: http://www.R-project.org (accessed on 8 April 2012).
  25. Atehnkeng, J.; Ojiambo, P.S.; Donner, M.; Ikotun, T.; Sikoras, R.; Cotty, P.J.; Bandyopadhyay, R. Distribution and toxigenicity of Aspergillus species isolated from maize kernels from three agroecological zones in Nigeria. Int. J. Food Microbiol. 2008, 122, 74–84. [Google Scholar] [CrossRef]
  26. Abbas, H.K.; Zablotowicz, R.M.; Locke, M.A. Spatial variability of Aspergillus flavus soil populations under different crops and corn grain infestation and mycotoxins. Can. J. Botany 2004, 82, 1768–1775. [Google Scholar] [CrossRef]
  27. Zablotowicz, R.M.; Abbas, H.K.; Locke, M.A. Population ecology of Aspergillus flavus associated with Mississippi Delta Soils. Food Addit Contam. 2007, 24, 1102–1108. [Google Scholar] [CrossRef]
  28. Probst, C.; Bandyopadhyay, R.; Price, L.E.; Cotty, P.J. Identification of atoxigenic Aspergillus flavus isolates to reduce aflatoxin contamination of maize in Kenya. Plant Dis. 2011, 95, 212–218. [Google Scholar] [CrossRef]
  29. O’Brian, G.R.; Georgina, D.R.; Wilkinson, J.R.; Yu, J.; Abbas, H.K.; Bhatnagar, D; Cleveland, T.E.; Nierman, W.; Payne, G.A. The effect of elevated temperature on gene transcription and aflatoxin biosynthesis. Mycologia 2007, 99(2), 232–239. [Google Scholar] [CrossRef]
  30. Egel, D.S.; Cotty, P.J.; Elias, K.S. Relationships among isolates of Aspergillus section Flavi that vary in aflatoxin production. Phytopathology 1994, 84, 96–912. [Google Scholar]
  31. Ehrlich, K.C.; Chang, P.K.; Yu, J.; Cotty, P.J. Aflatoxin biosynthesis cluster gene cypA is required for G aflatoxin formation. Appl. Environ. Microbiol. 2004, 70, 6518–6524. [Google Scholar] [CrossRef]
  32. Cotty, P.J.; Cardwell, K.F. Divergence of West African and North American communities of Aspergillus section Flavi. Appl. Environ. Microbiol. 1989, 65(5), 2264–2266. [Google Scholar]
  33. Cardwell, K.F.; Cotty, P.J. Distribution of Aspergillus section Flavi among field soils from the four agroecological zones of the Republic of Benin, West Africa. Plant Dis. 2002, 86(4), 434–439. [Google Scholar] [CrossRef]
  34. Davis, N.D.; Diener, U.L.; Eldridge, D.W. Production of Aflatoxins B1 and G1 by Aspergillus flavus in a Semisynthetic Medium. Appl. Microbiol. 1996, 14(3), 378–380. [Google Scholar]
  35. Abbas, H.K.; Zablotowicz, R.M.; Weaver, M.A.; Horn, B.W.; Xie, W.; Shier, W.T. Comparison of cultural and analytical methods for determination of aflatoxin production by Mississippi Delta Aspergillus isolates. Can. J. Microbiol. 2004, 50, 193–199. [Google Scholar] [CrossRef]
  36. McAlpin, C.E. Synnema and sclerotium production in Aspergillus caelatus and the influence of substrate composition on their development in selected strains. Mycologia 2004, 96, 937–947. [Google Scholar] [CrossRef]
  37. Horn, B.W.; Dorner, J.W. Effect of competition and adverse culture conditions on aflatoxin production by Aspergillus flavus through successive generations. Mycologia 2002, 94(5), 741–751. [Google Scholar] [CrossRef]
  38. Bhattacharya, K.; Raha, S. Deteriorative changes of maize, groundnut and soybean seeds by fungi in storage. Mycopathologia 2002, 155, 135–141. [Google Scholar] [CrossRef]
  39. Orsi, R.B.; Corra, B.; Possi, C.R. Mycoflora and occurrence of fumonisins in freshly harvested and stored hybrid maize. J. Stored Prod. Res. 2000, 36, 75–87. [Google Scholar]
  40. Bii, F.; Wanyoike, W.; Nyende, A.B.; Gituru, R.W.; Bii, C. Fumonisin contamination of maize (Zea mays) in aflatoxin ‘hot’ zones in Eastern Province of Kenya. Afr. J. Health Sci. 2012, 20, 28–36. [Google Scholar]
  41. Muthomi, J.W.; Njenga, L.N.; Gathumbi, J.K.; Cheminingwa, G.N. The occurrence of aflatoxins in maize and distribution of mycotoxin-producing fungi in Eastern Kenya. Plant Path. 2009, 8, 113–119. [Google Scholar] [CrossRef]

