Article

Culture-Independent Study of the Late-Stage of a Bloom of the Toxic Dinoflagellate Ostreopsis cf. ovata: Preliminary Findings Suggest Genetic Differences at the Sub-Species Level and Allow ITS2 Structure Characterization

1
CIIMAR/CIMAR—Interdisciplinary Centre of Marine and Environmental Research, University of Porto, Rua dos Bragas 289, 4050-123 Porto, Portugal
2
CIBIO, Centro de Investigação em Biodiversidade e Recursos Genéticos, InBIO, Universidade do Porto, Campus Agrário de Vairão, 4485-661 Vairão, Portugal
3
Departamento de Biologia, Faculdade de Ciências, Universidade do Porto, Rua do Campo Alegre, 4169-007 Porto, Portugal
*
Author to whom correspondence should be addressed.
Submission received: 26 March 2015 / Revised: 6 June 2015 / Accepted: 24 June 2015 / Published: 30 June 2015
(This article belongs to the Section Marine and Freshwater Toxins)

Abstract

:
Available genomic data for the toxic, bloom-forming, benthic Ostreopsis spp. are traditionally obtained from isolates rather than from individuals originally present in environmental samples. Samples from the final phase of the first reported Ostreopsis bloom in European North Atlantic waters (Algarve, south coast of Portugal) were studied and characterized, using a culture-independent approach. In the first instance, a microscopy-based analysis revealed the intricate complexity of the samples. Then, we evaluated the adequacy of commonly used molecular tools (i.e., primers and nuclear ribosomal markers) for the study of Ostreopsis diversity in natural samples. A PCR-based methodology previously developed to identify/detect common Ostreopsis species was tested, including one new combination of existing PCR primers. Two sets of environmental rRNA sequences were obtained, one of them (1052 bp) with the newly tested primer set. These latter sequences encompass both the ITS1-5.8S-ITS2 region and the D1/D2 domain of the LSU rRNA gene, leading us to an accurate identification of ITS2. In turn, this allowed us to predict and show for the first time the ITS2 secondary structure of Ostreopsis. With 92 bp in length and a two-helix structure, the ITS2 of this genus revealed to be unique among the dinoflagellates. Both the PCR approach as the phylogenetic analyses allowed to place the Ostreopsis cells observed in the samples within the O. cf. ovata phylospecies’ complex, discarding the presence of O. cf. siamensis. The (phylo)genetic results point out a certain level of nucleotide sequence divergence, but were inconclusive in relation to a possible geographic origin of the O. cf. ovata population from the Algarve’s bloom.

Graphical Abstract

1. Introduction

The harmful algal bloom (HAB)-forming Ostreopsis ovata Fukuyo and Ostreopsis siamensis Schmidt are toxic, benthic (including epibenthic, epiphytic, or tychoplanktonic) dinoflagellates species now recognized as being distributed from tropical to temperate coastal waters [1], with increasingly frequent appearances in different regions of the Mediterranean basin [2]. These two species are known to co-occur [3,4] although their morphological differentiation is quite difficult. They are seen as cryptic species [5] and their morphological identification requires scanning electron microscopy (SEM) analysis of their thecal plate arrangement and morphology and location of sulcal plates [6,7,8]. They often form blooms under favorable environmental conditions [9], which can either be easily visible or remain undetected underwater [10]. The recently increasing frequency of this ecological phenomenon in the Mediterranean Basin [1,2], along with the toxic compounds produced by these dinoflagellates [11], makes them likely to pose direct or indirect health risks to bathers [12], seafood consumers [13] and may also endanger important marine biocenoses [11]. So far, the large majority of bloom events in Europe have occurred along the Mediterranean coastline and were largely dominated by O. ovata [1]. However, low densities of co-occurring O. ovata and O. siamensis have also been recorded in the Atlantic waters of the Iberian Peninsula [14,15,16,17]. In the north-eastern Atlantic Ocean region, the Bay of Biscay (Cantabrian Sea, Spain/France) is the northernmost location where Ostreopsis was already detected [15,17]. The occurrence of O. cf. siamensis and/or O. cf. ovata in Portugal (including Azores and Madeira Islands) is known from monitoring studies and anecdotal reports [14,16,17,18] or from the existence of isolates collected in Portuguese waters [19,20].
The Iberian Atlantic coast adjacent to the Mediterranean Sea is a warm-temperate region with a marked seasonality, where upwelling events are frequent. Within this region, the western coast of Algarve—the most important sun and beach destination of Portugal—has topographic and geomorphologic features and hydrodynamic and environmental conditions (e.g., wave action, temperature) suitable for the emergence and development of Ostreopsis spp. blooms [9,21,22]. Actually, the first (and so far the only) known bloom of an Ostreopsis species in the Atlantic coast of continental Europe was recorded in this region, in September 2011 [23].
The microscopy-based identification and discrimination of Ostreopsis species present in the field samples is difficult given the morphological resemblance between species, their morphological plasticity and consequent high cell-size variability [4,24,25,26], and the possible co-occurrence of Ostreopsis spp. in the natural environment [3,24]. Since thorough morphological identifications at the species level require SEM analyses [6,7], rapid and reliable molecular-based methodologies were developed to distinguish Ostreopsis species [5,27]. The most widely and successfully used molecular markers to identify dinoflagellates belong to the nuclear ribosomal RNA gene cluster [27,28,29,30]. The majority of the Ostreopsis spp. nucleotide sequences available in public databases include either the ITS1-5.8S-ITS2 rRNA region [19,24,31,32] or the variable domains of the 28S rRNA gene [19,32], and were mainly obtained from cultured isolates.
After being alerted by the news [33] that the presence of Ostreopsis led to a prohibition of bathing in Algarve (south of Portugal), we decided to adopt a culture-independent approach to study and characterize floating clumps derived from this 2011 bloom event (see also [23]). Samples were collected in three affected beaches, coinciding with the last two days of bathing prohibition. The algal composition of the samples proved to be more diverse and intricate than initially appreciated. Available molecular tools for the study of Ostreopsis in field samples were tested, and their feasibility evaluated. Albeit the complex composition of the samples, we were able to obtain two sets of rRNA sequences from naturally occurring Ostreopsis cf. ovata. One of these sets was achieved through a new combination of existing PCR primers, which has the advantage of covering four different rRNA loci in a single PCR amplification. Additionally, we were able to define the boundaries of ITS2 of Ostreopsis, allowing the prediction of its secondary structure.

2. Results

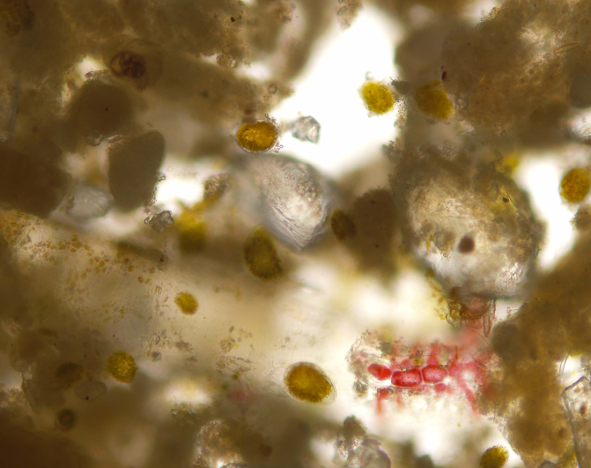
2.1. Morphometric Analysis and Microalgal Community

Cells assigned to Ostreopsis sp. were ovoid to teardrop-shaped in dorsoventral (DV) view, with many golden (brownish) chloroplasts radially disposed (Figure 1B,C). They were variable in size (Table 1 and Figure 1D) and presented an average DV diameter of 73 μm and 51 μm in width (W), ranging between 42–105 μm and 32–75 μm, respectively (n = 45). The DV/W ratio for average values was 1.43. Morphometric values presented by the Algarve’s Ostreopsis cells were comparable with those from environmental or cultured Ostreopsis cf. ovata and Ostreopsis cf. siamensis cells obtained from other studies (Table 1).
Small cells [4,25,26] and Type A thin-walled cysts [25] morphotypes were identified (Figure 1C,D and Figure S1, respectively) and assigned to Ostreopsis. However, other possible Ostreopsis cysts (e.g., Figure 1C) morphologically difficult to distinguish [4,25,26] were accounted as unidentified (Table 2). The same was applied to morphotypes [25] that couldn’t be undoubtedly assigned to Ostreopsis (see also notes in Table 1).
Figure 1. Photograph (A) and micrographs (BD) of the bloom. (A) Greenish-brown water discoloration at Camilo; (B) Red autofluorescence of chloroplasts radially-disposed in an Ostreopsis cf. ovata cell by epifluorescence microscopy; (C) The tear-shaped Ostreopsis cf. ovata cells were evident under light microscopy (e.g., C1, white arrow), however, epifluorescence microscopy (C2) allowed to detect other chlorophyll-containing organisms (pseudo-colored in red), including unidentified cysts (C1 and C2, asterisk), which otherwise could go unnoticed; (D) This later-staged, detached bloom was found to be a very complex sample with sediment, detritus, and different plankton and benthic (both phyto- and zoo-) organisms embedded in a mucilaginous network. The “small cell” morphotype [4,25,26] of Ostreopsis was also observed (C1 and D, black arrow). Scale bars: 50 μm.
Toxins 07 02514 g001
Table 1. Morphometric features of Ostreopsis cells from the Algarve’s bloom and comparison with O. ovata and O. cf. siamensis measurements from other studies. The values are range measurements (μm) of dorsoventral (DV) and anterioposterior (AP) diameters, and width (W).
Taxa (type of sample)DVWAPDV/W ratioDV/AP ratioReference
Ostreopsis42–10532–75-1.4-This study
O. cf. ovata (environmental)26–6213–4814–361.8~2[3]
O. cf. ovata (environmental)19–7513–6010–31-2.3[4]
O. cf. ovata (culture) a55–8430–62-1.2–2-[17]
O. cf. ovata (culture) b40–6031–49-1.3-[25]
O. cf. ovata (culture)27–6519–57--<2[24]
O. cf. ovata (culture)27–8517–65---[26]
O. cf. siamensis (environmental)36–6624–5014–26~1.4~3[3]
O. cf. siamensis (environmental)50–7538–62-~1.3>4[24]
O. cf. siamensis (culture) a52–7527–57-1.1–2.1-[17]
a Specimens collected from Atlantic Iberian Peninsula waters; b Values are for the entire culture population; in addition to vegetative cells, Accoroni et al. [25] distinguished seven other categories (i.e., morphotypes) of O. cf. ovata cells within the population, including three different types of cysts.
Table 2. Microalgal abundance in the water column samples, at the three studied sites.
TaxaNumber of taxa (cells∙L−1) per sampling site a
BurgauLuzCamilo
Ostreopsis sp.2520 (13.1%)5480 (19.8%)13,040 (18.3%)
Other dinoflagellates b5880 (30.6%)200 (0.7%)1520 (2.1%)
Diatoms5520 (28.7%)5840 (21.1%)53,040 (74.4%)
Cyanobacteria2600 (13.5%)10,880 (39.3%)-
Other microalgae2720 (14.1%)5280 (19.1%)3680 (5.2%)
Total19,24027,68071,280
a numbers within brackets represents relative frequencies × 100; b includes unidentified dinoflagellates/cysts.
Bloom was visually evident only in one of the three sampling locations (Figure 1A), at the time of water collection. In spite of this, Ostreopsis cells represented a major portion of the microalgal community of all three seawater samples (Table 2). In Burgau, the local where Ostreopsis was shown to be less abundant (2520 cells·L−1) in the water column, they corresponded to a third of the dinoflagellates present in the sample, representing 13.1% of the total microalgal community. The other dinoflagellates species observed belonged to several genera such as Alexandrium, Ceratium, Dinophysis, Prorocentrum, Protoperidinium, without dominance of any of them. In Luz and Camilo (with 5480 and 13,040 cells·L−1, respectively) Ostreopsis accounted to the large majority (>89% and >96%, respectively) of the dinoflagellates. However, its relative abundance within the overall microalgae community was 19.8% in Luz and 18.3% in Camilo.

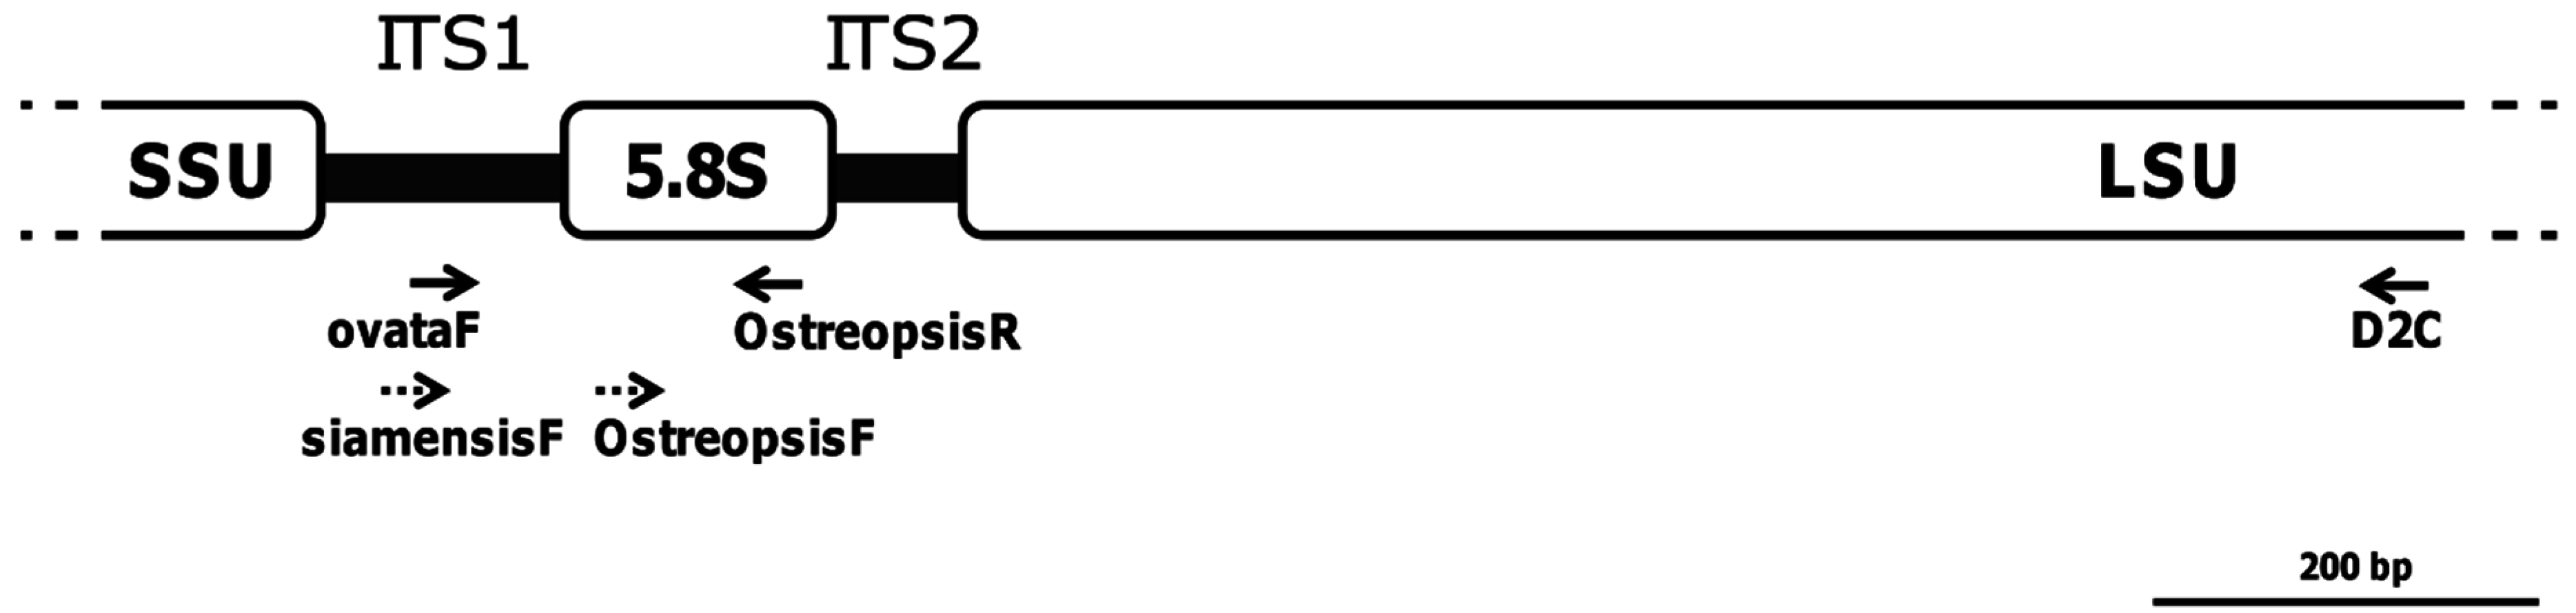
2.2. Testing of PCR Primer Sets

The only primer pair tested that gave no PCR amplicons was the species-specific set siamensisF/OstreopsisR (see Figure 2 and Table S1). Due to its shortness (<50 bp after removal of primer sequences) and redundant rRNA coverage (Figure 2), amplicons amplified by the genus-specific primer pair (OstreopsisF/OstreopsisR) were discarded from further analyses. However, the specificity of the PCR amplification was examined and confirmed by sequencing (data not shown). All remaining sequences retrieved from the clone libraries were amplified with the primer sets ovataF/OstreopsisR or ovataF/D2C. In accordance with the PCR results, BLASTn searches performed in GenBank showed that all the clone sequences belonged to the phylotype Ostreopsis cf. ovata (similarity ≥ 99%).
Figure 2. Schematic diagram of the rRNA gene cluster showing the binding sites of the PCR primers used in the study (roughly drawn to scale). Dashed arrows represent primers for which an amplification product was not obtained or the sequencing results of the amplicons were not considered afterward (see text for detail).
Toxins 07 02514 g002

2.3. Phylogenetic and Genetic Analyses

All the Algarve’s sequences were placed in a clade with sequences of Ostreopsis cf. ovata isolates collected from different regions of the world (Figure 3 and Figure S2). In the phylogenetic trees derived from ITS1-5.8S rRNA region (Figure 3) the clone sequences grouped in a single cluster with a good ML bootstrap value (93%) but lacking BI posterior probability support. Despite more than half of the sequences of this cluster revealing high genetic similarity (>99%), some of the clone sequences were phylogenetically slightly different from the others. In fact, three groups of them clustered together as tight sub-clusters (Figure 3). This contrasts with the large amount of isolates that belong to the same Ostreopsis cf. ovata clade, which have identical sequences (representing a ribotype, sensu Sato et al. [32]). A similar phylogenetic pattern was obtained for the dataset with the larger sequences (ITS1-5.8S-ITS2-LSU region) (Figure S2). In this case, the environmental clone sequences did not group in a single distinct clade, but, as seen in Figure 3, several sequences were grouped into sub-clusters with good bootstrap support, even if phylogenetically extremely close. With respect to this last dataset, the analysis of sequence divergence performed (Table S2) shows that Algarve’s sequences present slightly higher genetic variability values than those from other groups of phylogenetically close sequences. When compared to the other geographically established groups, the sequences from the Algarve’s bloom revealed the highest intra-group divergence (Table S2, in bold), in all the three rRNA regions analyzed (0.003 base substitutions per site for the ITS1-5.8S rRNA gene fragment, 0.009 for ITS2, and 0.009 for LSU). Comparisons across columns, in Table S2, show that these values are even higher than any inter-group divergence (plain characters), for each locus. Similar findings were obtained for base differences per sequence (values within brackets, in Table S2).
Figure 3. Maximum likelihood tree (−lnL = 2786.27) of partial ITS1-5.8S-ITS2 rRNA region sequences from Ostreopsis spp. isolates and from environmental clones obtained in this study (in bold). The dataset comprised 70 sequences, with 219 unambiguously-aligned nucleotide sites. The asterisk indicates the node of the Ostreopsis cf. ovata clade/species complex sensu Sato et al. [32] (after [19]). Nodal support values indicated near internal branches were determined by ML and BI methods, respectively; bootstrap values (for ML) below 65% and posterior probability values (for BI) below 0.80 were omitted. Thick lines indicate simultaneous ≥ 85% bootstrap values and ≥ 0.95 posterior probability support for tree branches. Scale bar represents 0.1 nucleotide substitutions per site. Legend: M—isolates collected in the Mediterranean Sea region, EA—East Atlantic, WA—West Atlantic, P—Pacific.
Toxins 07 02514 g003

2.4. ITS2 Secondary-Structure Model of Ostreopsis cf. ovata

The sequence length of ITS2 in Ostreopsis cf. ovata was 92 bp. The ITS2 secondary structure model of O. cf. ovata derived from free energy minimization algorithm was identical to that obtained with the maximum expected accuracy approach. This model shows a two-helix structure (Figure 4), with the first helix, including 19 base pairs, separated by five single-stranded nucleotides from a short second helix of five base pairs.
Figure 4. Predicted ITS2 rRNA secondary structure model of Ostreopsis cf. ovata derived from the free energy minimization and the maximum expected accuracy approaches.
Toxins 07 02514 g004
The highly divergent ITS2 sequence of Ostreopsis compared to Alexandrium and Coolia made the homology assessment among these taxa unfeasible, preventing both a reliable alignment (see also Sato et al. [32]) and the prediction of Ostreopsis ITS2 structure based on homology modelling (results not shown).

3. Discussion

Ostreopsis blooms are characterized by a rapid covering of the benthos, producing more or less extensive mats in shallow and sheltered coastal waters [11,34]. In late bloom phases, the mucilaginous network can either become detached [13,34] and float as clumps on the water column or remain undetectable underwater [10]. The Algarve’s bloom probably had its origin away from the shoreline, in the submerged flat bedrock bottom typical of this region. Afterwards, large portions of the mat may have loosened and unfastened from the substrate and reached several beaches. The bloom has determined a temporary bathing prohibition imposed by the competent authorities [33], which in turn caused negative impacts on the local economy of the affected area. After being made aware of the news about this Ostreopsis bloom event [33], we proceed with the sampling campaign. After just a day, the authorities considered that this HAB no longer posed a public health risk, and the prohibition was lifted.

3.1. Characterization of the Bloom and Microalgae Composition

Bloom samples (i.e., floating mucilaginous clumps) were surprisingly diverse and intricate in their composition (see Figure 1C,D as an example). The initial presumption was that they would be clearly dominated by Ostreopsis cells. However, the light microscopic examination of the samples revealed a complex tycoplanktonic community (Table 2). At most, Ostreopsis cells accounted for up to 20% of the total number of microalgae cells observed in one sample. However, the number of Ostreopsis cells recognized in each sample may be underestimated due to the presence of several cysts that could not be assigned to any dinoflagellate. Cysts are even more difficult to identify than vegetative cells, particularly in field samples [3,25,26]. For this reason, they were counted as unidentified dinoflagellates (Table 2).
The mucilage typically exuded in large amounts by Ostreopsis cf. ovata [34] have trapped or provided harbouring for other benthic taxa and/or phytoplankton, such as quick-growing, opportunistic species like diatoms and cyanobacteria (Table 2). These taxa were visibly embedded in the mucus, mixed along with Ostreopsis cells. Clumps also harboured detritus and small- to medium-sized zooplankton and macroalgae in earlier stages (as an illustration, see Figure 1D). This broad assortment of organisms and the amount of different cell morphotypes observed (including cysts) [26] are very likely linked to the phase of the bloom. Accoroni et al. [4,25] observed that the percentage of some Ostreopsis cf. ovata morphotypes other than vegetative cells increased at the final phase of blooms. These include, for instance, Type A thin-walled cysts (Figure S1) and dark cells. The same authors also found that the cell size (e.g., DV length) is higher in final/decline phases of blooms. Moreover, while studying Mediterranean’s blooms, they have observed that Ostreopsis cf. ovata begin to decline by the mid or end of September [4].

3.2. Morphological Characterization, Molecular Identification, and (Phylo)Genetic Analyses

The morphological analysis performed allowed us to assume that the Ostreopsis cells present in the field samples belonged to a single morphospecies. The characteristics observed are in agreement with the description of O. ovata, which is much smaller than other Ostreopsis species [6,7,34]. The range of morphometric values observed is also in concordance with those found in naturally occurring cells of this species (Table 1) [4,24,26]. Nevertheless, its size range is known to overlap with that of the morphologically similar cells of O. siamensis (see also Table 1). Moreover, this species is sometimes seen to co-occur with O. ovata in Mediterranean waters [3,24] and its occurrence was already described for mainland Portugal [14]. Likewise, the assumption of the occurrence of a single Ostreopsis morphospecies lacked firm support. David et al. [23], which have studied the same bloom event, had the same difficulties in appraising the presence of one or both species, even after analysing details of the thecal plates. One useful morphometric parameter that seems distinct between the two species is the DV/AP ratio [4] (see Table 1). However, the measurement of the anterioposterior diameter better requires SEM analysis. Therefore, the arrival of rapid and reliable molecular-based approaches to distinguish Ostreopsis species in natural samples [5,27] was so appreciated, particularly for monitoring purposes. In fact, the results from the molecular methodology here adopted have supported the presence of only one taxon. The presence of O. siamensis could be discarded by PCR analysis, while the molecular identification and the phylogenetic analysis (Figure 3) allowed to assign all the clone sequences to the phylospecies O. cf. ovata [19].
Several isolates obtained from different world’s marine regions are known to belong to the O. cf. ovata clade/species complex. Two independent phylogeographic researches [19,32] on the distribution of Ostreopsis species have extensively studied those isolates. Our phylogenetic analysis (Figure 3) did not allow us to discern about a possible biogeographic origin for the O. cf. ovata population from the Algarve’s bloom. The clone sequences obtained were similarly distant (Figure 3) and divergent (Table S2) from isolates collected in either the Western or Eastern Atlantic Ocean, the Mediterranean Sea, or those collected in the Pacific region. These findings are in consonance with the phylogeographic studies from Penna et al. [19] and Sato et al. [32]. Moreover, we have observed some genetic variations within the O. cf. ovata environmental sequences from Algarve, at a level unobserved within any of the aforementioned geographic groups of isolates (Table S2). The ITS2 and LSU groups of sequences from the Algarve’s bloom have shown the highest number of nucleotide substitutions per site, both with a value of 0.009 (Table S2). For instance, 0.009 was also the value observed for the overall divergence among all the ITS2 sequences tested, within the sub-cluster. And for the LSU gene sequences, the overall divergence was only 0.004. This is more relevant if we bear in mind that the genetic variability observed, even if minor, is reported in Ostreopsis cells belonging to a same bloom event. For instance, the “not so variable” closely related isolates from the Mediterranean group (Table S2) were collected in different populations, in different regions of the Basin. However, these values are well below those observed for the nucleotide divergence within the out-group (sequences from two phylogenetically more distant O. cf. ovata isolates) or between the out-group and any in-group.
Thus, the amount of variability observed within the Algarve’s sequences population, even if referring to the same phylospecies, is likely to encompass different strain genotypes (i.e., sub-species level). Future studies on this and additional bloom populations sampled through the (phylo)species range may help test this hypothesis.

3.3. Evaluation of Oligonucleotides

Our results confirm the suitability of the primers developed by Penna et al. [27] for the genus- and species-specific identification (Table S1) of this harmful alga in such complex samples, which harbored numerous other dinoflagellates (Table 2). Among the primer sets tested, the newly combination ovataF/D2C has the advantage of covering four different rRNA loci at one time (Figure 2), making it advisable for phylogenetic studies. The widely used D2C and its original antisense D1R were designed to amplify the 28S rRNA gene of dinoflagellates, in general [35]. Remarkably, even in a sample for which O. cf. ovata cells were less abundant than cells from all the other dinoflagellates (at Burgau; see Table 2), the new primer pair combination was able to discriminate them. Since the reverse primer D2C did not return any Ostreopsis sequence when in combination with D1R, the primer ovataF [27] is likely to be sufficient to ensure the specificity of the PCR reaction.

3.4. Considerations on the ITS2 Characterization

The two rRNA internal spacers (ITS1 and ITS2) were proposed as good markers candidates for DNA barcoding of dinoflagellates [30], capable of revealing hidden diversity among cultured isolates [29]. However, Ostreopsis was not included in such evaluation [30]. Moreover, available ITS1 and ITS2 sequences are often incomplete and/or incorrectly annotated [36]. For these reasons, we have planned an accurate identification of ITS2, which was fully covered in our ITS1-5.8S-ITS2-LSU sequences. With 92 bp in length, the ITS2 of Ostreopsis cf. ovata is the shortest among dinoflagellates. This length is in accordance with Pin et al. [31], who have estimated an ITS2 size between 87 and 92 bp for Ostreopsis ovata. Typically, other dinoflagellates show an ITS2 length of 200–250 bp [29], ranging from 114 bp in Coolia [37]—a close genus of Ostreopsis [24]—to almost 700 bp in Amyloodinium [29]. Ostreopsis and Coolia belong to Gonyaulacales, an order that shows the fastest evolutionary rate among rRNA genes in dinoflagellates. And, within this order, Ostreopsisis the fastest-evolving genus [28]. Moreover, it is well known that the noncoding internal transcribed spacers (i.e., ITS1 and ITS2) have a faster evolutionary rate. Thus, the unusually short ITS2 length of Ostreopsis may be a result of such rapid evolution.
The ITS2 secondary structure of Ostreopsis does not conform the canonical eukaryote “four domains” architecture [38,39,40], which has been observed in the closely related Gonyaulacales genera Coolia and Alexandrium [37,41]. ITS2 structure variants deviating from the Eukaryote core structure are known in several organisms including algae (e.g., [42]), plants (e.g., [43]) fungi (e.g., [39]), and animals (e.g., [44]), and are expected about 30,000 variants out of the 50,000 available full ITS2 sequences [40]. This suggests that several organisms, including Ostreopsis, have species or organism specific solutions for ITS2 processing [40].
Finally, several properties of the dinoflagellate ITS2 rRNA sequences make this marker a promising molecular tool for species identification but not for phylogeny estimations. Indeed, the extensive length variation shown by dinoflagellate ITS2s, as well as the high sequence divergence observed among genera Ostreopsis, Coolia, and Alexandrium (this study; [29,37]) make the assessment of homology across the Gonyaulacales genera difficult and thus phylogenetic comparison impractical. On the other hand, at a higher level of taxonomic resolution, the relatively low (intra- and inter-) population divergence displayed by dinoflagellate ITS2 sequences (Table S2; [31]) compared to inter-specific differentiation among congeneric species [31], corroborates the utility of the ITS2 as a DNA barcode for the identification/distinguishing of Ostreopsis species, as observed in other dinoflagellates [29,30]. In effect, we consider that it can be used as a tool for the (difficult) taxonomy of this genus, which is in need of revision [45]. Future studies will have to explore this appropriateness.

4. Experimental Section

4.1. Sampling Site Locations, and Samples Collection and Processing

One surface seawater sample (depth 0.2–0.3 m below water surface) was collected, using 5 L plastic bottles, in the surf zone on three out of eleven beaches (Figure 5) affected by an algal bloom in 2011, in Algarve [23,33]. This region is the Portugal’s most important “sun and beach” destination. The coast in the western part of Algarve is mostly characterized by flat, near shore rocky bottoms, with small sandy beaches surrounded by sandstone cliffs [22]. Samples were collected on September 26 at Luz and Burgau, and on September 27 at Camilo. Sampling dates coincided with the two last days of bathing prohibition in the affected area, as determined by the local and national authorities [33].
Figure 5. Beaches in the Algarve coast (Portugal’s most touristic destination) affected by the bloom and sampling sites studied (capital letters). Legend: 1, Ingrina; 2, Zavial; 3, Furnas; 4, Salema; 5, Boca do Rio; 6, Cabanas Velhas; 7, Porto de Mós; 8, Dona Ana; B, Burgau (37°04′17.7″ N, 8°46′24.7″ W); L, Luz (37°05′10.1″ N, 8°43′39.3″ W); C, Camilo (37°05′16.7″ N, 8°40′05.4″ W).
Toxins 07 02514 g005
Immediately after collection and during transportation, samples and/or sub-samples were kept cool and in the dark until processing. For each sample, three different sub-samples were made. One was kept fresh for microscopic examination, in 50 mL sterile Falcon tubes. As soon as they arrived at laboratory, microphotographs were taken and cells measured. After homogenizing each sample, 100 mL were transferred into sterile plastic flasks and preserved in Lugol’s solution (Sigma, St. Louis, MO, USA) for microscopic estimation. These sub-samples were kept in the dark until analysis. Finally, for each sample, three different pieces of clumps were aseptically harvested and placed into three sterile 2 mL microcentrifuge tubes. At the laboratory, these sub-samples were centrifuged and the pellets were stored at −20 °C until DNA isolation.

4.2. Morphological Analysis and Counting of Microalgae

The morphology of Ostreopsis cells present in each sample was examined using a light and fluorescence microscope (Model BX41, Olympus, Hamburg, Germany). Cell dimensions were determined by measuring the dorsoventral (DV) and transversal (width, W) diameters (n = 45, 15 in each sample) at 400× magnification, with an image analysis system (Model DP72 microscope digital camera and software Cell B; Olympus, Hamburg, Germany).
For counting purposes, Lugol-fixed subsamples were resuspended and homogenized, and 25 mL was settled in Utermöhl counting chambers. The quantification was done using an inverted microscope (Leitz Labovert, Wetzlar, Germany), according to Lund et al. [46]. Microalgae (including cyanobacteria) were identified using standard taxonomic references [47,48,49].

4.3. DNA Extraction, PCR Amplification, Cloning and Sequencing

Isolation of genomic DNA from crude material (i.e., floating clumps) collected in each site was performed using the silica bead-based kit ZR Soil Microbe DNA MiniPrep™ (Zymo Research, Orange, CA, USA), following the manufacturer’s instructions. For each sample, DNA was extracted separately from the three replicates (see Subsection 4.1.), and then pooled in equimolar quantities. We tested several primer sets commonly used for the identification of dinoflagellates (e.g., [19,32]), including those developed for the genus- or species- detection and identification of Ostreopsis specimens [27]. These primer sets amplify fragments containing different regions of the nuclear rRNA genes and their associated ITS regions (Figure 2). In Table S1 is indicated the polymerase chain reaction (PCR) conditions for each primer set. Main modifications to the PCR protocols were the use of the GoTaq® DNA Polymerase (Promega, Madison, WI, USA) enzyme (~1 × 10⁻⁵ errors per bp), and the addition of 0.5 μL of 1% (w/v) BSA (Bovine Serum Albumin; Sigma-Aldrich, St. Louis, MO, USA) in each 20 μL reaction, to circumvent PCR inhibitors.
PCR amplicons were purified from excised agarose gel slices using the Cut&Spin Gel Extraction spin columns (GRISP, Porto, Portugal). Purified amplicons were then cloned into pGEM®-T Easy vector (Promega, Madison, WI, USA), and transformed into OneShot® TOP10 chemically competent E. coli cells (Invitrogen, Carlsbad, CA, USA) following the manufacturer’s instructions. For each amplification product, white colonies were screened by colony PCR using plasmid-specific primers (pUC/M13), after which several colonies were selected and subsequently grown overnight in LB medium supplemented with 100 mg·mL−1 of ampicillin, at 37 °C with orbital shaking. For each amplicon, a small clone library (>30 clones) was established. Plasmid DNA from each selected colony was then isolated using GenElute™ Plasmid Miniprep Kit (Sigma-Aldrich, St. Louis, MO, USA). The inserts (from 100 clones, in total) were sequenced at Macrogen Corp. Europe (Amsterdam, The Netherlands) using pUC/M13 sequencing primers. The genus Ostreopsis was confirmed by BLASTn searches in GenBank using the obtained sequences as query, further assessed the existence of chimeras using the Bellerophon program [50], and deposited in GenBank (accession numbers KF612633 to KF612659).

4.4. Phylogenetic and Sequence Analysis

Each set of environmental clone sequences obtained in this study was aligned along with the sequences obtained from the BLASTn best hits searches in GenBank as well as with selected Ostreopsis spp. sequences retrieved from previous studies [13,19,24,26,31,32,51], covering different geographical regions and biomes. For the ITS1-5.8S-ITS2-28S rDNA multiple sequences alignment, we concatenated the available rRNA gene sequences of the ITS1-5.8S-ITS2 region of a particular isolate with its correspondent sequence of the LSU D1/D2 domain (for a listing, see [19]). Multiple sequence alignments were performed using the ClustalW algorithm implemented in MEGA version 5 software package [52].
jModelTest 2 [53] was used to assess the model of nucleotide substitution that best fitted each aligned dataset under the corrected Akaike’s Information Criterion. The HKY+G model of evolution was selected for the ITS1-5.8S rRNA gene alignment, while the TIM1+G model was selected for the ITS1-5.8S-ITS2-28S rRNA gene alignment. Phylogenetic analyses were performed under the assumptions of the Bayesian inference (BI) using the Bayesian Markov chain Monte Carlo (MCMC) method implemented in the software MrBayes version 3.1.2 [54]. Bayesian searches were performed using a random starting tree, with one cold and seven incrementally heated chains (temperature = 0.2), and were run for 107 generations, with a tree sampling frequency of 100. For each dataset, two independent runs were performed and the consensus phylogeny was built upon confirmation of convergence with the software Tracer 1.4 (burnin = 25%). The same alignments were also used to generate a Maximum-likelihood (ML) tree in MEGA 5 [52], using the previously selected model of nucleotide substitution and assessing node support over 1000 bootstrap replicates. Ambiguously aligned regions were omitted (“complete deletion” option) from the analyses. The topologies retrieved from the ML and BI analyses were evaluated using TreePuzzle 5.2 [55], and the best topology for each dataset was selected according to results from all the test comparisons (1sKH, SH, ELW, and 2sKH). Branch support values derived from the different analyses were compared using TreeGraph 2 [56].
Additionally, analyses of sequence divergence within the environmental clones obtained in this study and among them and their phylogenetically closest relatives were performed in MEGA 5 [52] using the ITS1-5.8S-ITS2-28S rRNA alignment. This dataset was partitioned in genes/spacers for which boundaries were successfully and reliably determined. All positions containing gaps and missing data were eliminated, resulting in a total of 233, 85, and 593 alignment positions for the combined ITS1-5.8S region, the ITS2, and the LSU region, respectively.

4.5. ITS2 Secondary Structure Modelling

The ITS2 region of O. cf. ovata was annotated against homologous sequences of dinoflagellate available from the ITS2-Database version 4 [41].
The secondary structure of the Ostreopsis cf. ovata ITS2 was predicted using free energy minimization [57], maximum expected accuracy [58], and homology modelling [59] approaches. In free energy minimization, the preferred equilibrium structure is the structure with lowest Gibbs free energy change of folding. The predicted minimum free energy (MFE) structure was calculated using the software RNA structure version 5.5 [60], which implements a nearest-neighbour model to predict the conformational stability of a given structure.
The same software was used to predict the maximum expected accuracy (MEA) structure, a structure that maximizes base-pair probabilities. In this approach, a partition function calculation based on the free energy change nearest-neighbor parameters is used to predict base-pair probabilities as well as probabilities of nucleotides being single-stranded. Finally, we predict the ITS2 secondary structure of O. cf. ovata by exploiting possible homology to ITS2 available secondary structure in Alexandrium pseudogoniaulax from ITS2-Database version 4 [41] and in Coolia malayensis from a previous study [37]. We used the ITS2 rRNA of isolate IEO-VGO655 of A. pseudogoniaulax (GenBank accession number: AM237416) and of strain CmPL01 of C. malayensis (AF244943) as templates. Homology modelling was performed using the algorithm implemented in the ITS2-Database [59] with threshold for helix transfer of 50% and 75%.

5. Conclusions

Studies of natural populations of Ostreopsis by mean of polyphasic (i.e., involving both phenotypic and genomic traits), culture-independent methods are still scarce. Instead, the majority are based on a culture-dependent approach. Those few existing culture-independent studies have developed [27,61] or used genus- and species-specific primers to detect/identify Ostreopsis by PCR [62] or enumerate Ostreopsis cells by qPCR [61,63] for monitoring purposes. However, the study of the population’s genetic diversity was not attempted in any case. The culture-independent approach and (phylo)genetic analyses here performed suggest the presence of slightly different genotypes (i.e., strains) of Ostreopsis cf. ovata within the bloom population, something that deserves to be investigated thoroughly, and in other bloom events. Thus, our findings reinforce the need to apply fingerprinting molecular methods—e.g., classical techniques such as DGGE or SSCP, or preferably NGS techniques-, to ensure that the genetic diversity (i.e., variability at the sub-species level) of Ostreopsis is embraced when studying natural populations. We consider that this may lead, in future studies, to a grasp of the genetic diversity and population structuring of Ostreopsis spp. in natural communities, and thereof, to a better comprehension of the development and dynamics of blooms of these toxic dinoflagellates.
The successful amplification of a larger fragment of the rRNA gene complex (1052 bp) than those usually used in Ostreopsis studies made the accurate determination of the boundaries of the ITS2 possible, a region very often wrongly annotated in sequences deposited in GenBank [36]. We believe that the annotated Algarve’s sequences can be used as a reference for future annotations of Ostreopsis ITS2 sequences. Moreover, this >1000 bp fragment shows that more reliable phylogenies and genetic analyses of this genus may be henceforward obtained, even from sequences directly achieved from environmental samples (i.e., eDNA). For instance, this fragment includes several regions with different levels of evolutionary conservation (5.8S, ITS2 and D1/D2 LSU regions), previously shown to be valuable markers to explore patterns of genetic divergence within and among Ostreopsis spp. populations [29,31,64]. This study also pointed out an uncommon ITS2 secondary structure in this dinoflagellate genus, which makes this marker unfeasible for estimating dinoflagellates phylogenies with sequence alignments guided by secondary structure predictions [41], whenever Ostreopsis sequences are used.

Supplementary Materials

Supplementary materials can be accessed at: https://0-www-mdpi-com.brum.beds.ac.uk/2072-6651/7/7/2514/s1.

Acknowledgments

We thank our colleague Anoop Alex for helping in the sampling. We acknowledge FCT (Fundação para a Ciência e a Tecnologia, Portugal) that partially financed this work through the project PEst-C/MAR/LA0015/2013. D.S. is also supported by the FCT post-doctoral grant SFRH/BPD/66592/2009. This work was partially funded by the project MARBIOTECH (reference NORTE-07-0124-FEDER-000047) within the SR&TD Integrated Program MARVALOR—Building research and innovation capacity for improved management and valorization of marine resources, supported by the Programa Operacional Regional do Norte (ON.2—O Novo Norte) and by the European Regional Development Fund; and by the project NOVOMAR (reference 0687-NOVOMAR-1-P), supported by the European Regional Development Fund.

Author Contributions

V.R., D.S., J.P.M. and V.V. conceived and designed the experiments; V.R., D.S., J.P.M., M.V. and J.A. performed the experiments; V.R., D.S., J.P.M., M.V. and J.A. analyzed the data; V.V. contributed reagents/materials/analysis tools; V.R., D.S. and V.V. wrote the paper. All co-authors revised the manuscript critically and approved the final version.

Conflicts of Interest

The authors declare no conflict of interest.

References

  1. Rhodes, L. World-wide occurrence of the toxic dinoflagellate genus Ostreopsis Schmidt. Toxicon 2011, 57, 400–407. [Google Scholar] [CrossRef] [PubMed]
  2. Mangialajo, L.; Ganzin, N.; Accoroni, S.; Asnaghi, V.; Blanfuné, A.; Cabrini, M.; Cattaneo-Vietti, R.; Chavanon, F.; Chiantore, M.; Cohu, S.; et al. Trends in Ostreopsis proliferation along the Northern Mediterranean coasts. Toxicon 2011, 57, 408–420. [Google Scholar] [CrossRef] [PubMed] [Green Version]
  3. Aligizaki, K.; Nikolaidis, G. The presence of the potentially toxic genera Ostreopsis and Coolia (Dinophyceae) in the north Aegean sea, Greece. Harmful Algae 2006, 5, 717–730. [Google Scholar] [CrossRef]
  4. Accoroni, S.; Romagnoli, T.; Pichierri, S.; Colombo, F.; Totti, C. Morphometric analysis of Ostreopsis cf. ovata cells in relation to environmental conditions and bloom phases. Harmful Algae 2012, 19, 15–22. [Google Scholar]
  5. Hariganeya, N.; Tanimoto, Y.; Yamaguchi, H.; Nishimura, T.; Tawong, W.; Sakanari, H.; Yoshimatsu, T.; Sato, S.; Preston, C.M.; Adachi, M. Quantitative PCR method for enumeration of cells of cryptic species of the toxic marine dinoflagellate Ostreopsis spp. in coastal waters of Japan. PLoS ONE 2013, 8, e57627. [Google Scholar] [CrossRef] [PubMed]
  6. Faust, M.; Morton, S.; Quod, J. Further SEM study of marine dinoflagellates: The genus Ostreopsis (Dinophyceae). J. Phycol. 1996, 32, 1053–1065. [Google Scholar] [CrossRef]
  7. Steidinger, K.A.; Tangen, K. Dinoflagellates. In Identifying Marine Phytoplankton; Tomas, C.R., Ed.; Academic Press: San Diego, CA, USA, 1997; pp. 387–584. [Google Scholar]
  8. Escalera, L.; Benvenuto, G.; Scalco, E.; Zingone, A.; Montresor, M. Ultrastructural features of the benthic dinoflagellate Ostreopsis cf. ovata (Dinophyceae). Protist 2014, 165, 260–274. [Google Scholar] [CrossRef] [PubMed]
  9. Shears, N.; Ross, P. Blooms of benthic dinoflagellates of the genus Ostreopsis: An increasing and ecologically important phenomenon on temperate reefs in New Zealand and worldwide. Harmful Algae 2009, 8, 916–925. [Google Scholar] [CrossRef]
  10. Pfannkuchen, M.; Godrijan, J.; Pfannkuchen, D.; Ivesa, L.; Kruzic, P.; Ciminiello, P.; Dell’Aversano, C.; Iacovo, E.; Fattorusso, E.; Forino, M.; et al. Toxin-producing Ostreopsis cf. ovata are likely to bloom undetected along coastal areas. Environ. Sci. Technol. 2012, 46, 5574–5582. [Google Scholar]
  11. Ramos, V.; Vasconcelos, V. Palytoxin and analogs: Biological and ecological effects. Mar. Drugs 2010, 8, 2021–2037. [Google Scholar] [CrossRef] [PubMed]
  12. Deeds, J.R.; Schwartz, M.D. Human risk associated with palytoxin exposure. Toxicon 2010, 56, 150–162. [Google Scholar] [CrossRef] [PubMed]
  13. Amzil, Z.; Sibat, M.; Chomerat, N.; Grossel, H.; Marco-Miralles, F.; Lemee, R.; Nezan, E.; Sechet, V. Ovatoxin-a and palytoxin accumulation in seafood in relation to Ostreopsis cf. ovata blooms on the French Mediterranean coast. Mar. Drugs 2012, 10, 477–496. [Google Scholar]
  14. Amorim, A.; Veloso, V.; Penna, A. First detection of Ostreopsis cf. siamensis in Portuguese coastal waters. Harmful Algae News 2010, 42, 6–7. [Google Scholar]
  15. Laza-Martinez, A.; Orive, E.; Miguel, I. Morphological and genetic characterization of benthic dinoflagellates of the genera Coolia, Ostreopsis and Prorocentrum from the south-eastern Bay of Biscay. Eur. J. Phycol. 2011, 46, 45–65. [Google Scholar] [CrossRef]
  16. David, H.; Ganzedo, U.; Laza-Martínez, A.; Orive, E. Relationships between the presence of Ostreopsis (Dinophyceae) in the Atlantic coast of the Iberian Peninsula and sea-surface temperature. Cryptogam. Algol. 2012, 33, 199–207. [Google Scholar] [CrossRef]
  17. David, H.; Laza-Martínez, A.; Miguel, I.; Orive, E. Ostreopsis cf. siamensis and Ostreopsis cf. ovata from the Atlantic Iberian eninsula: Morphological and phylogenetic characterization. Harmful Algae 2013, 30, 44–55. [Google Scholar]
  18. Silva, A.; Brotas, V.; Orive, E.; Neto, A.I. First records of Ostreopsis heptagona, O. cf. siamensis and O. cf. ovata—In the Azores archipelago, Portugal. Harmful Algae News 2010, 42, 1–2. [Google Scholar]
  19. Penna, A.; Fraga, S.; Battocchi, C.; Casabianca, S.; Giacobbe, M.; Riobó, P.; Vernesi, C. A phylogeographical study of the toxic benthic dinoflagellate genus Ostreopsis Schmidt. J. Biogeogr. 2010, 37, 830–841. [Google Scholar] [CrossRef] [Green Version]
  20. Ciminiello, P.; Dell’Aversano, C.; Iacovo, E.D.; Fattorusso, E.; Forino, M.; Tartaglione, L.; Yasumoto, T.; Battocchi, C.; Giacobbe, M.G.; Amorim, A.; et al. Investigation of toxin profile of Mediterranean and Atlantic strains of Ostreopsis cf. siamensis (Dinophyceae) by liquid chromatography–high resolution mass spectrometry. Harmful Algae 2013, 23, 19–27. [Google Scholar]
  21. Totti, C.; Accoroni, S.; Cerino, F.; Cucchiari, E.; Romagnoli, T. Ostreopsis ovata bloom along the Conero Riviera (northern Adriatic Sea): Relationships with environmental conditions and substrata. Harmful Algae 2010, 9, 233–239. [Google Scholar] [CrossRef]
  22. Cúrdia, J.; Monteiro, P.; Afonso, C.M.L.; Santos, M.N.; Cunha, M.R.; Gonçalves, J.M.S. Spatial and depth-associated distribution patterns of shallow gorgonians in the Algarve coast (Portugal, NE Atlantic). Helgol. Mar. Res. 2012, 67, 521–534. [Google Scholar] [CrossRef]
  23. David, H.; Moita, M.T.; Laza-Martínez, A.; Silva, A.; Mateus, M.; Pablo, H.; Orive, E. First bloom of Ostreopsis cf. ovata in the continental Portuguese coast. Harmful Algae News 2012, 45, 12–13. [Google Scholar]
  24. Penna, A.; Vila, M.; Fraga, S.; Giacobbe, M.; Andreoni, F.; Riobó, P.; Vernesi, C. Characterization of Ostreopsis and Coolia (Dinophyceae) isolates in the western Mediterranean Sea based on morphology, toxicity and internal transcribed spacer 5.8S rDNA sequences. J. Phycol. 2005, 41, 212–225. [Google Scholar] [CrossRef]
  25. Accoroni, S.; Romagnoli, T.; Pichierri, S.; Totti, C. New insights on the life cycle stages of the toxic benthic dinoflagellate Ostreopsis cf. ovata. Harmful Algae 2014, 34, 7–16. [Google Scholar] [CrossRef]
  26. Bravo, I.; Vila, M.; Casabianca, S.; Rodriguez, F.; Rial, P.; Riobó, P.; Penna, A. Life cycle stages of the benthic palytoxin-producing dinoflagellate Ostreopsis cf. ovata (Dinophyceae). Harmful Algae 2012, 18, 24–34. [Google Scholar] [CrossRef] [Green Version]
  27. Penna, A.; Bertozzini, E.; Battocchi, C.; Galluzzi, L.; Giacobbe, M.G.; Vila, M.; Garces, E.; Lugliè, A.; Magnani, M. Monitoring of HAB species in the Mediterranean Sea through molecular methods. J. Plankton Res. 2007, 29, 19–38. [Google Scholar] [CrossRef]
  28. Saldarriaga, J.F.; Taylor, M.F.J.R.; Cavalier-Smith, T.; Menden-Deuer, S.; Keeling, P.J. Molecular data and the evolutionary history of dinoflagellates. Eur. J. Protistol. 2004, 40, 85–111. [Google Scholar] [CrossRef]
  29. Litaker, R.W.; Vandersea, M.W.; Kibler, S.R.; Reece, K.S.; Stokes, N.A.; Lutzoni, F.M.; Yonish, B.A.; West, M.A.; Black, M.N.D.; Tester, P.A. Recognizing dinoflagellate species using ITS rDNA sequences. J. Phycol. 2007, 43, 344–355. [Google Scholar] [CrossRef]
  30. Stern, R.F.; Andersen, R.A.; Jameson, I.; Kupper, F.C.; Coffroth, M.A.; Vaulot, D.; Le Gall, F.; Véron, B.; Brand, J.J.; Skelton, H.; et al. Evaluating the ribosomal internal transcribed spacer (ITS) as a candidate dinoflagellate barcode marker. PLoS ONE 2012, 7, e42780. [Google Scholar] [CrossRef] [PubMed]
  31. Pin, L.; Teen, L.; Ahmad, A.; Usup, G. Genetic diversity of Ostreopsis ovata (Dinophyceae) from Malaysia. Mar. Biotechnol. 2001, 3, 246–255. [Google Scholar] [CrossRef] [PubMed]
  32. Sato, S.; Nishimura, T.; Uehara, K.; Sakanari, H.; Tawong, W.; Hariganeya, N.; Smith, K.; Rhodes, L.; Yasumoto, T.; Taira, Y.; et al. Phylogeography of Ostreopsis along West Pacific coast, with special reference to a novel clade from Japan. PLoS ONE 2011, 6, e27983. [Google Scholar] [CrossRef] [PubMed]
  33. News about the Algarve’s Bloom on the Portuguese Public TV Channel’s Website (RTP). Available online: http://www.webcitation.org/6YUtUTvot (accessed on 13 May 2015). (In Portuguese)
  34. Honsell, G.; Bonifacio, A.; De Bortoli, M.; Penna, A.; Battocchi, C.; Ciminiello, P.; Dell’Aversano, C.; Fattorusso, E.; Sosa, S.; Yasumoto, T.; et al. New insights on cytological and metabolic features of Ostreopsis cf. ovata Fukuyo (Dinophyceae): A multidisciplinary approach. PLoS ONE 2013, 8, e57291. [Google Scholar]
  35. Scholin, C.; Herzog, M.; Sogin, M.; Anderson, D. Identification of group- and strain-specific genetic markers for globally distributed Alexandrium (Dinophyceae). II. Sequence analysis of a fragment of the LSU rRNA gene. J. Phycol. 1994, 30, 999–1011. [Google Scholar] [CrossRef]
  36. Keller, A.; Schleicher, T.; Schultz, J.; Muller, T.; Dandekar, T.; Wolf, M. 5.8S-28S rRNA interaction and HMM-based ITS2 annotation. Gene 2009, 430, 50–57. [Google Scholar] [CrossRef] [PubMed]
  37. Leaw, C.-P.; Lim, P.-T.; Cheng, K.-W.; Ng, B.-K.; Usup, G. Morphology and molecular characterization of a new species of thecate benthic dinoflagellate, Cooliamalayensis sp. nov. (Dinophyceae). J. Phycol. 2010, 46, 162–171. [Google Scholar] [CrossRef]
  38. Mai, J.C.; Coleman, A.W. The internal transcribed spacer 2 exhibits a common secondary structure in green algae and flowering plants. J. Mol. Evol. 1997, 44, 258–271. [Google Scholar] [CrossRef] [PubMed]
  39. Joseph, N.; Krauskopf, E.; Vera, M.I.; Michot, B. Ribosomal internal transcribed spacer 2 (ITS2) exhibits a common core of secondary structure in vertebrates and yeast. Nucleic Acids Res. 1999, 27, 4533–4540. [Google Scholar] [CrossRef] [PubMed]
  40. Schultz, J.; Maisel, S.; Gerlach, D.; Muller, T.; Wolf, M. A common core of secondary structure of the internal transcribed spacer 2 (ITS2) throughout the Eukaryota. RNA 2005, 11, 361–364. [Google Scholar] [CrossRef] [PubMed]
  41. Koetschan, C.; Hackl, T.; Muller, T.; Wolf, M.; Förster, F.; Schultz, J. ITS2 database IV: Interactive taxon sampling for internal transcribed spacer 2 based phylogenies. Mol. Phylogenet. Evol. 2012, 63, 585–588. [Google Scholar] [CrossRef] [PubMed]
  42. Van Hannen, E.J.; Fink, P.; Lurling, M. A revised secondary structure model for the internal transcribed spacer 2 of the green algae Scenedesmus and Desmodesmus and its implication for the phylogeny of these algae. Eur. J. Phycol. 2002, 37, 203–208. [Google Scholar] [CrossRef]
  43. Hershkovitz, M.A.; Zimmer, E.A. Conservation patterns in angiosperm rDNA ITS2 sequences. Nucleic Acids Res. 1996, 24, 2857–2867. [Google Scholar] [CrossRef] [PubMed]
  44. Salvi, D.; Mariottini, P. Molecular phylogenetics in 2D: ITS2 rRNA evolution and sequence-structure barcode from Veneridae to Bivalvia. Mol. Phylogenet. Evol. 2012, 65, 792–798. [Google Scholar] [CrossRef] [PubMed]
  45. Parsons, M.L.; Aligizaki, K.; Bottein, M.Y.D.; Fraga, S.; Morton, S.L.; Penna, A.; Rhodes, L. Gambierdiscus and Ostreopsis: Reassessment of the state of knowledge of their taxonomy, geography, ecophysiology, and toxicology. Harmful Algae 2012, 14, 107–129. [Google Scholar] [CrossRef]
  46. Lund, J.W.G.; Kipling, C.; LeCren, E.D. The inverted microscope method of estimating algal numbers and the statistical basis of estimations by counting. Hydrobiologia 1958, 11, 143–170. [Google Scholar] [CrossRef]
  47. Komárek, J.; Anagnostidis, K. Cyanoprokaryota 1. Teil: Chroococcales. In Süsswasserflora von Mitteleuropa 19/1; Ettl, H., Gärtner, G., Heynig, H., Mollenhauer, D., Eds.; Gustav Fischer: Jena, Germany, 1988; Volume 1, pp. 1–548. [Google Scholar]
  48. Komárek, J.; Anagnostidis, K. Cyanoprokaryota 2. Teil: Oscillatoriales. In Süsswasserflora von Mitteleuropa 19/2; Büdel, B., Krienitz, L., Gärtner, G., Schagerl, M., Eds.; Elsevier/Spektrum: Heidelberg, Germany, 2005; Volume 2, pp. 1–759. [Google Scholar]
  49. Tomas, C.R. Identifying Marine Phytoplankton; Academic Press: San Diego, CA, USA, 1997; p. 858. [Google Scholar]
  50. Huber, T.; Faulkner, G.; Hugenholtz, P. Bellerophon: A program to detect chimeric sequences in multiple sequence alignments. Bioinformatics 2004, 20, 2317–2319. [Google Scholar] [CrossRef] [PubMed]
  51. Nascimento, S.; Correa, E.; Menezes, M.; Varela, D.; Paredes, J.; Morris, S. Growth and toxin profile of Ostreopsis cf. ovata (Dinophyta) from Rio de Janeiro, Brazil. Harmful Algae 2012, 13, 1–9. [Google Scholar]
  52. Tamura, K.; Peterson, D.; Peterson, N.; Stecher, G.; Nei, M.; Kumar, S. MEGA5: Molecular evolutionary genetics analysis using maximum likelihood, evolutionary distance, and maximum parsimony methods. Mol. Biol. Evol. 2011, 28, 2731–2739. [Google Scholar] [CrossRef] [PubMed]
  53. Darriba, D.; Taboada, G.L.; Doallo, R.; Posada, D. jModelTest 2: More models, new heuristics and parallel computing. Nat. Methods 2012, 9, 772. [Google Scholar] [CrossRef] [PubMed]
  54. Huelsenbeck, J.P.; Ronquist, F. MRBAYES: Bayesian inference of phylogenetic trees. Bioinformatics 2001, 17, 754–755. [Google Scholar] [CrossRef] [PubMed]
  55. Schmidt, H.A.; Strimmer, K.; Vingron, M.; von Haeseler, A. TREE-PUZZLE: Maximum likelihood phylogenetic analysis using quartets and parallel computing. Bioinformatics 2002, 18, 502–504. [Google Scholar] [CrossRef] [PubMed]
  56. Stover, B.C.; Muller, K.F. TreeGraph 2: Combining and visualizing evidence from different phylogenetic analyses. BMC Bioinformatics 2010, 11, 7. [Google Scholar] [CrossRef] [PubMed]
  57. Mathews, D.H. Using an RNA secondary structure partition function to determine confidence in base pairs predicted by free energy minimization. RNA 2004, 10, 1178–1190. [Google Scholar] [CrossRef] [PubMed]
  58. Lu, Z.J.; Gloor, J.W.; Mathews, D.H. Improved RNA secondary structure prediction by maximizing expected pair accuracy. RNA 2009, 15, 1805–1813. [Google Scholar] [CrossRef] [PubMed]
  59. Wolf, M.; Achtziger, M.; Schultz, J.; Dandekar, T.; Müller, T. Homology modeling revealed more than 20,000 rRNA internal transcribed spacer 2 (ITS2) secondary structures. RNA 2005, 11, 1616–1623. [Google Scholar] [CrossRef] [PubMed]
  60. Reuter, J.S.; Mathews, D.H. RNAstructure: Software for RNA secondary structure prediction and analysis. BMC Bioinformatics 2010, 11, 129. [Google Scholar] [CrossRef] [PubMed]
  61. Perini, F.; Casabianca, A.; Battocchi, C.; Accoroni, S.; Totti, C.; Penna, A. New approach using the real-time PCR method for estimation of the toxic marine dinoflagellate Ostreopsis cf. ovata in marine environment. PLoS ONE 2011, 6, e17699. [Google Scholar] [CrossRef] [PubMed]
  62. Battocchi, C.; Totti, C.; Vila, M.; Masó, M.; Capellacci, S.; Accoroni, S.; Reñé, A.; Scardi, M.; Penna, A. Monitoring toxic microalgae Ostreopsis (dinoflagellate) species in coastal waters of the Mediterranean Sea using molecular PCR-based assay combined with light microscopy. Mar. Pollut. Bull. 2010, 60, 1074–1084. [Google Scholar] [CrossRef] [PubMed]
  63. Casabianca, S.; Casabianca, A.; Riobó, P.; Franco, J.M.; Vila, M.; Penna, A. Quantification of the toxic dinoflagellate Ostreopsis spp. by qPCR assay in marine aerosol. Environ. Sci. Technol. 2013, 47, 3788–3795. [Google Scholar] [CrossRef] [PubMed]
  64. Penna, A.; Battocchi, C.; Capellacci, S.; Fraga, S.; Aligizaki, K.; Lemée, R.; Vernesi, C. Mitochondrial, but not rDNA, genes fail to discriminate dinoflagellate species in the genus Ostreopsis. Harmful Algae 2014, 40, 40–50. [Google Scholar] [CrossRef]

