2.1. Sequencing, Primer Design, and Primer Verification
Segments of the
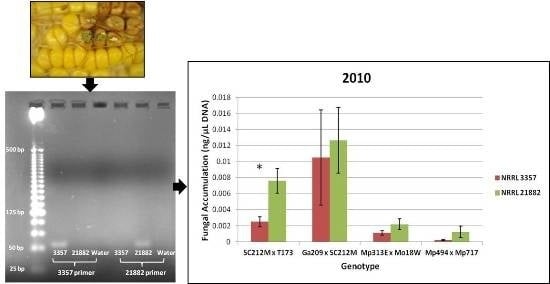
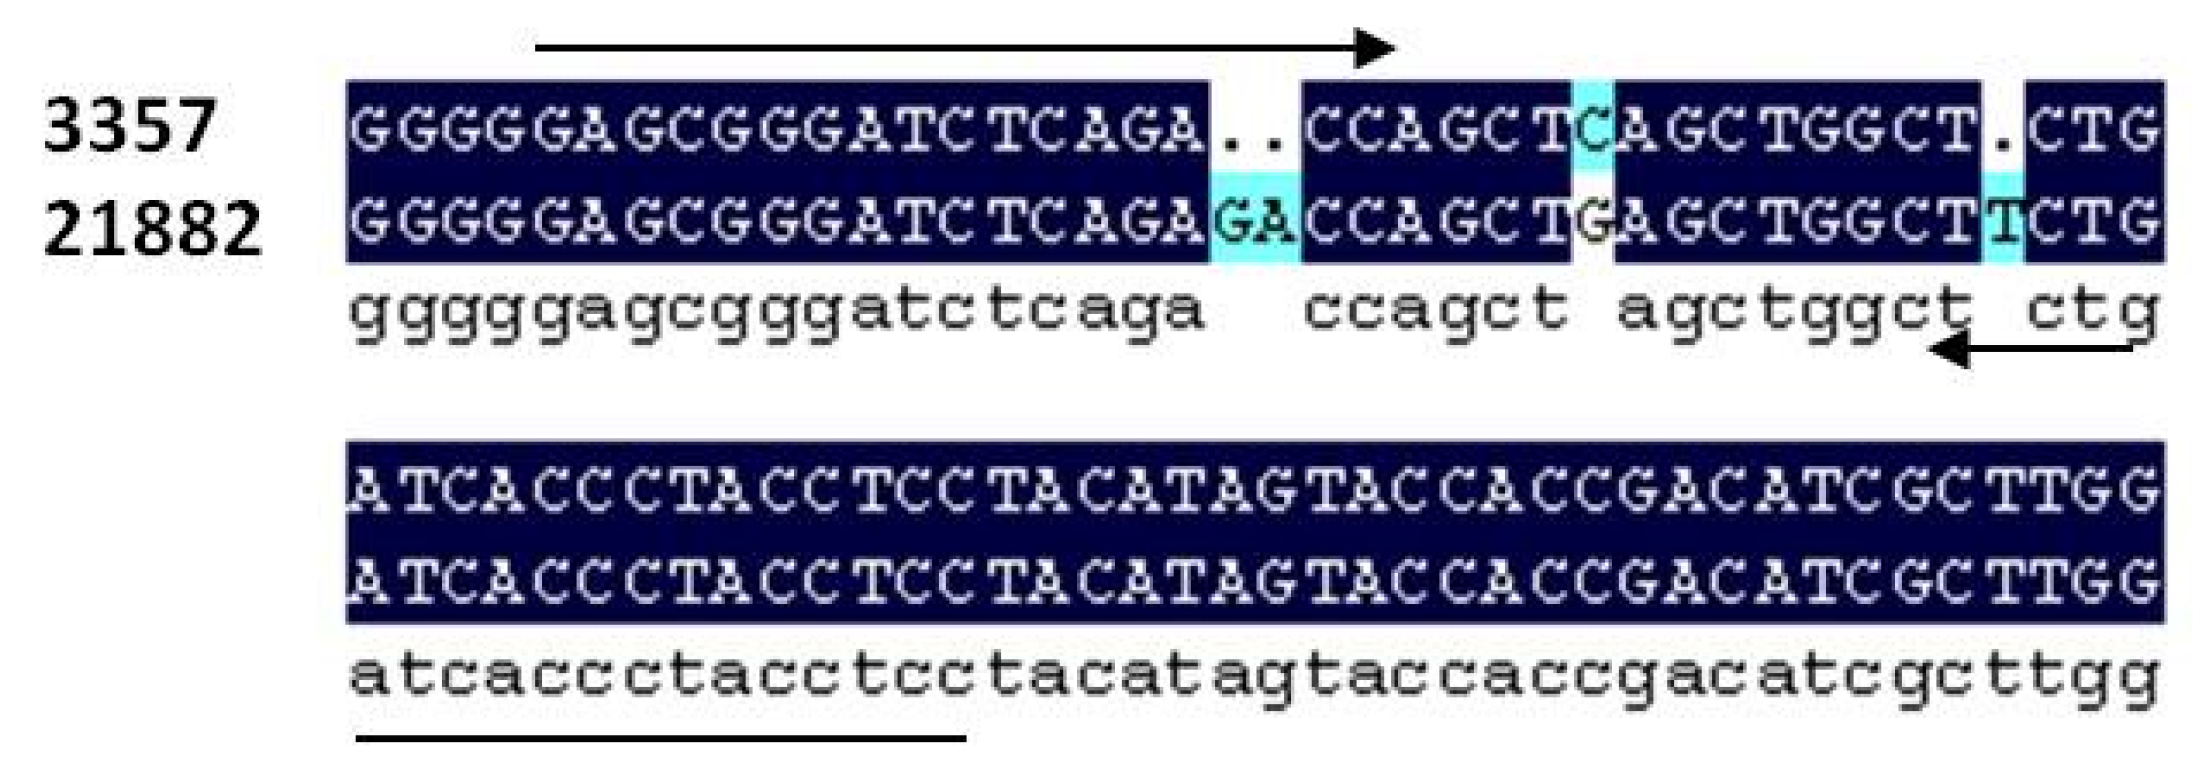
A. flavus rRNA gene complex were sequenced to find polymorphisms that could be used to design primers able to distinguish between NRRL 3557 and NRRL21882. Sequencing using the primers ITS1 and ITS4 revealed no usable polymorphisms in the internal transcribed spacer (ITS) region and therefore the Intergenic spacer (IGS) region was sequenced. Sequencing of the IGS region using the primers LR12R and INVSR1R revealed multiple polymorphisms (
Figure 1). A 2-base pair indel between NRRL 3357 and 21882 was used to design primer pairs which amplified an approximately 51 bp fragment (
Table 1,
Figure 2).
Figure 1.
Alignment of section of the IGS region of the rRNA gene complex in A. flavus between strain NRRL 3357 and 21882. Alignment shows 2 bp indel used for strain specific primer development as well as other polymorphisms.
Figure 1.
Alignment of section of the IGS region of the rRNA gene complex in A. flavus between strain NRRL 3357 and 21882. Alignment shows 2 bp indel used for strain specific primer development as well as other polymorphisms.
Table 1.
Primers used for total fungal quantification and strain specific fungal quantification.
Table 1.
Primers used for total fungal quantification and strain specific fungal quantification.
| Primer Name | Sequence (5′→3′) | Amplicon Size |
|---|
| Af2-F a | ATCATTACCGAGTGTAGGGTTCCT | 73 bp |
| Af2-R a | GCCGAAGCAACTAAGGTACAGTAAA |
| 3357-F2 | GGAGCGGGATCTCAGACC | 51 bp |
| 3357-R8 | GTAGGAGGTAGGGTGATCAGAGC |
| 21882-F2 b | GGAGCGGGATCTCAGAGAC |
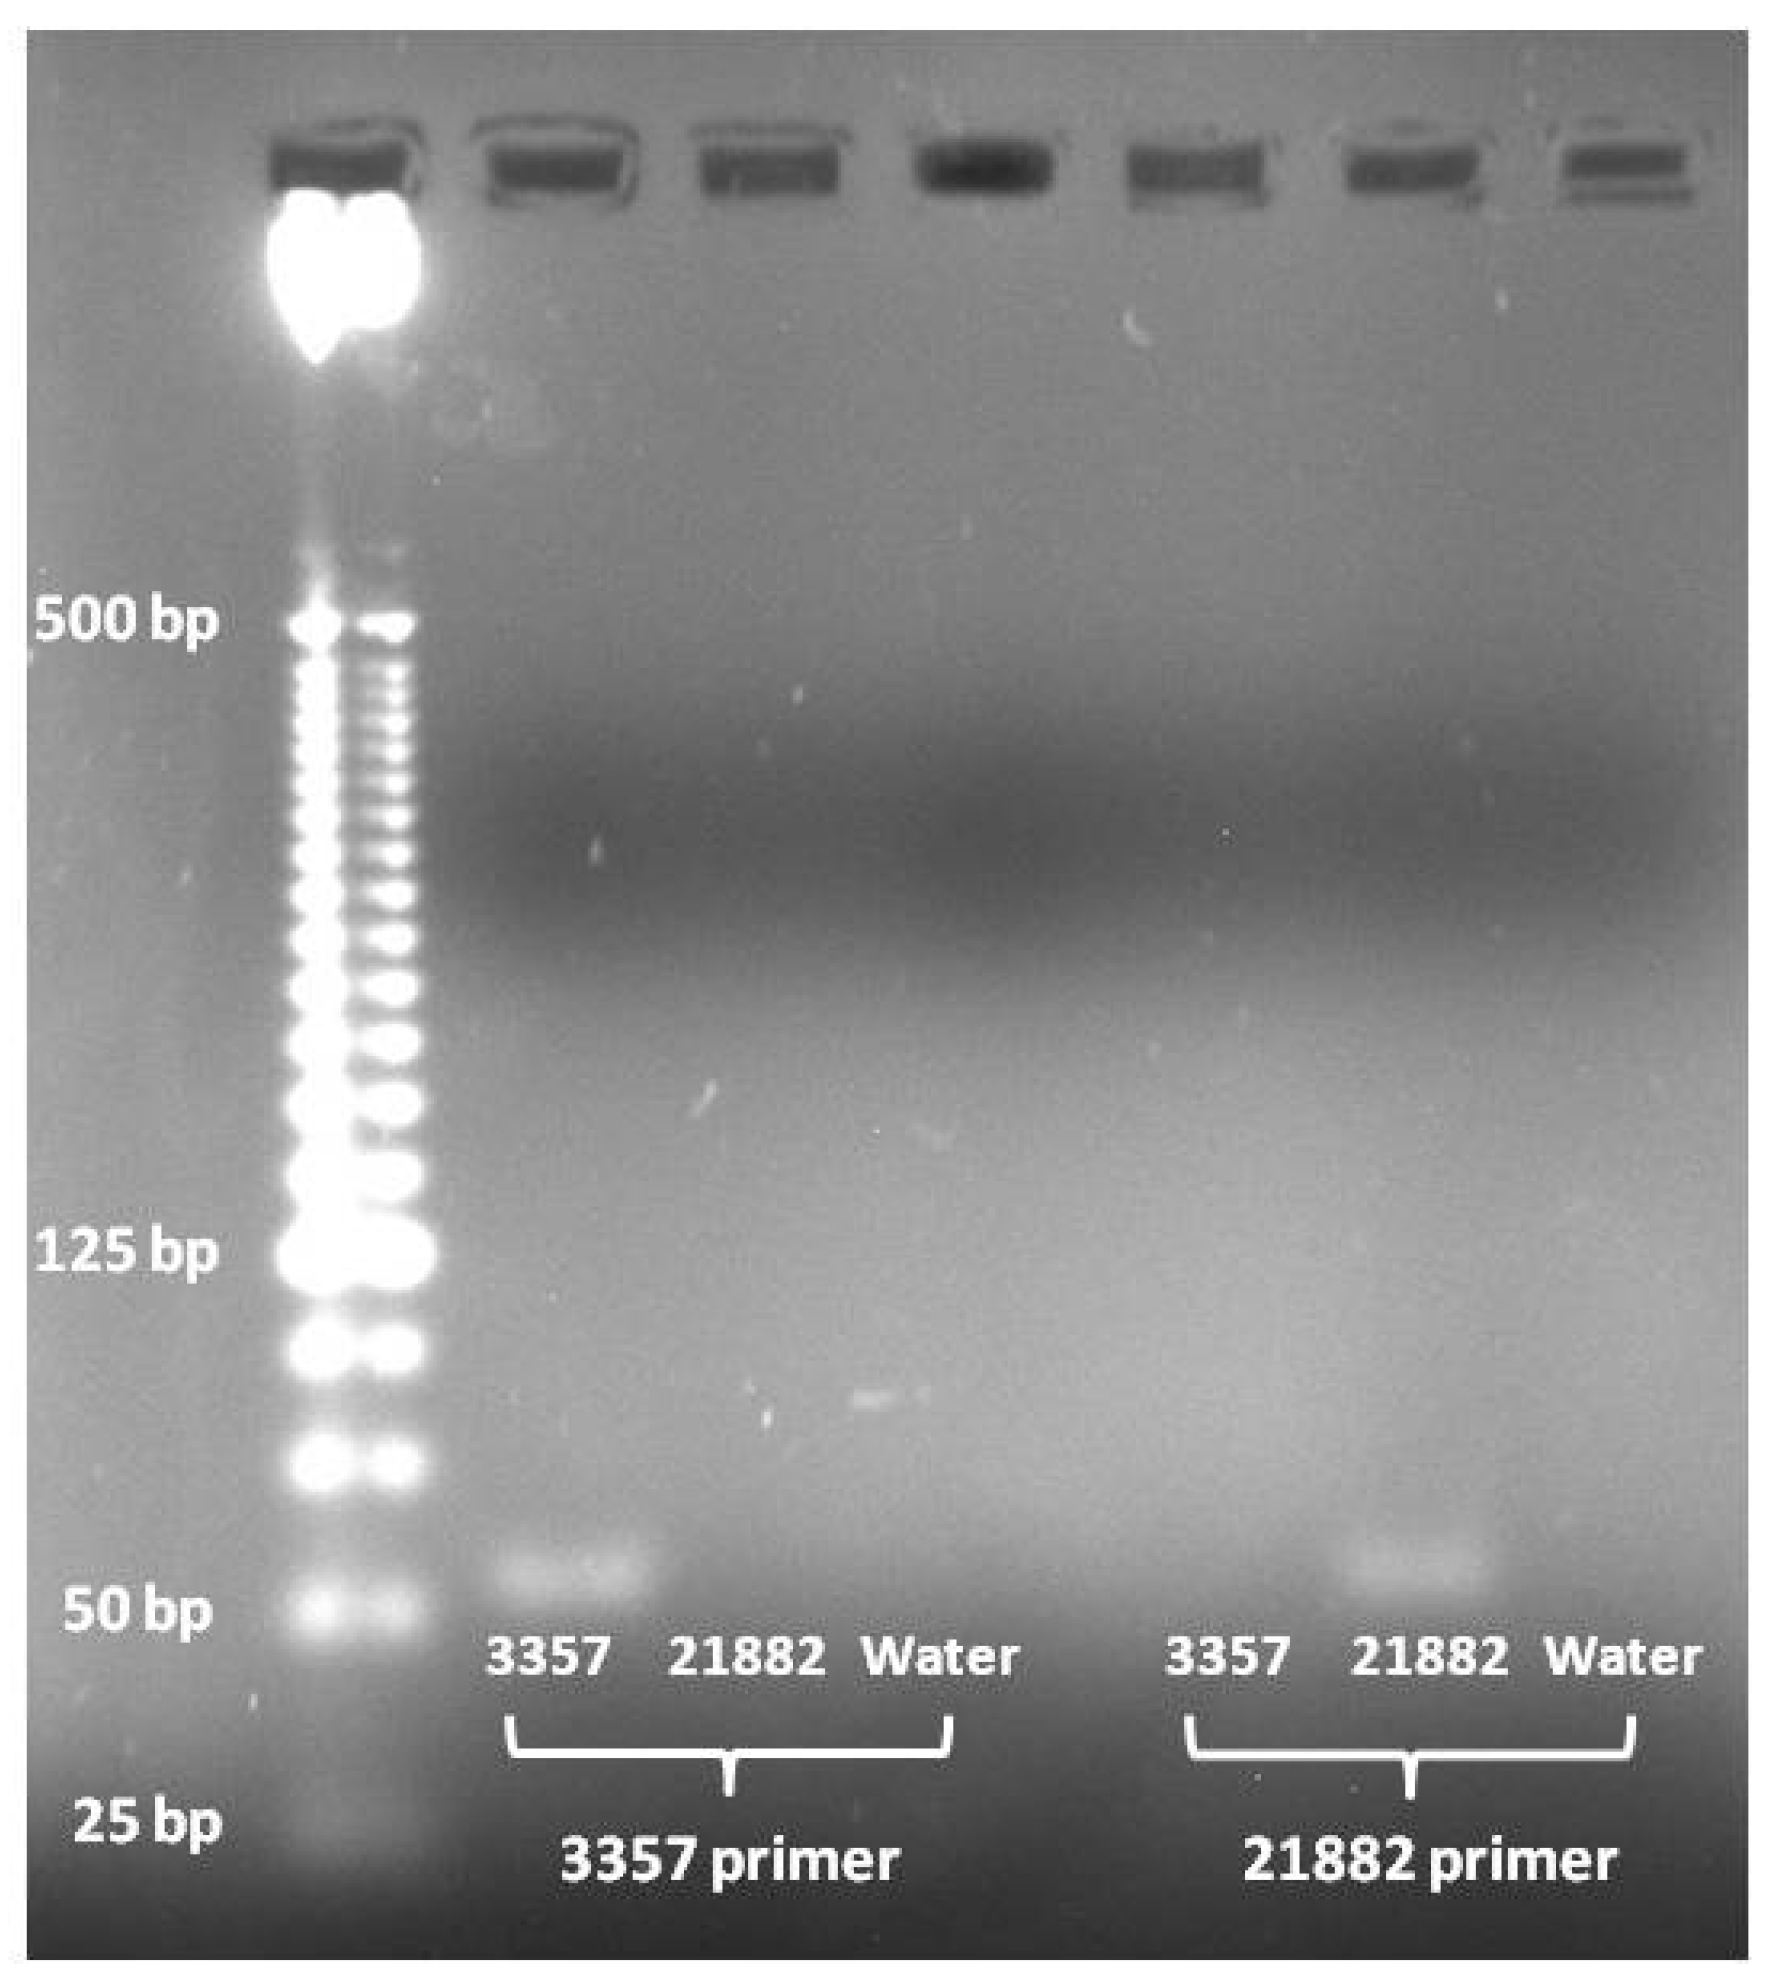
Figure 2.
PCR products from A. flavus strain specific primers. Lanes contain as follows from left to right: Invitrogen 25 bp ladder, 3357 amplified with 3357 primer pair, 21882 amplified with 3357 primer pair, (−) control amplified with 3357 primer pair, 3357 amplified with 21882 primer pair, 21882 amplified with 21882 primer pair, and (−) control amplified with 21882 primer pair.
PCR amplification using the 3357 primer pair showed that it only amplified the target fragment in 3357 DNA and not in 21882 or the (−) control (
Figure 2). Likewise, the 21882 primer pair only amplified the target fragment in 21882 DNA and not in 3357 or the (−) control (
Figure 2).
2.2. qPCR Verification
Since the primer pairs successfully demonstrated strain specificity in the PCR tests, the primer pairs were then tested for their efficacy in quantifying the two fungal strains in qPCR conditions and chemistry. An artificial mixed sample test was designed to determine how well the two primer pairs could quantify the two target fungal strains in a mixed sample. The first test was performed using 1 ng/μL of total fungal DNA using 2 test mixtures containing 60% and 40% of each fungal strain and screened using the primers for total fungus (Af2-F & R), 3357 (3357F-2 & 3357R-8), and 21882 (21882F-2 & 3357R-8). Quantification using the Af2 primer pair showed that both mixtures contained a concentration of 1.05 ng/μL of total fungal DNA. In the mixture that contained 60% 3357 and 40% 21882, quantification showed that the sample contained 0.58 ng/μL of 3357 DNA and 0.45 ng/μL of 21882 DNA. The quantification values for the inverse mixture were 0.43 ng/μL of 3357 DNA and 0.65 ng/μL of 21882 DNA (
Table 2).
The second test was exactly the same as the first test but was performed using 0.1 ng/μL of total fungal DNA in the 2 test mixtures. Quantification using the Af2 primer pair showed that both mixtures contained a concentration of 0.1 ng/μL of total fungal DNA over the 2 mixtures. In the mixture that contained 60% 3357 and 40% 21882, quantification showed that the sample contained 0.06 ng/μL of 3357 DNA and 0.039 ng/μL of 21882 DNA. The quantification values for the inverse mixture were 0.043 ng/μL of 3357 DNA and 0.063 ng/μL of 21882 DNA (
Table 2).
Table 2.
Quantification of artificially mixed samples of A. flavus strains NRRL 3357 and 21882 using qPCR. Strains were mixed in 60:40 ratios at total fungal concentrations of 1.0 ng/μL and 0.1 ng/μL. The Roche LightCylcer® 480 instrument (Roche Diagnostics GmbH, Mannheim, Germany) was used with the SYBR Master kit (Roche Diagnostics GmbH, Mannheim, Germany) and the strain specific primers for 3357 and 21882.
| Primer Pair | 60% 3357 | 60% 21882 | 60% 3357 | 60% 21882 |
|---|
| 0.6/0.4 (ng/μL) | 0.6/0.4 (ng/μL) | 0.06/0.04 (ng/μL) | 0.06/0.04 (ng/μL) |
|---|
| 3357 | 0.575 | 0.428 | 0.06 | 0.0425 |
| 21882 | 0.45 | 0.65 | 0.0399 | 0.0625 |
| Af2 (Total) | 1.05 | 1.05 | 0.0955 | 0.1045 |
2.3. Fungal and Aflatoxin Quantification
Analysis of variance showed significant differences between years, among genotypes and among treatments for both aflatoxin and
A. flavus accumulation (
Table 3). All interactions among main effects were significant for aflatoxin but none were significant for
A. flavus accumulation (
Table 3). For genotypes, fungal quantification revealed that in both the 2010 and 2011 field seasons, there were significant differences in total fungus accumulation among the genotypes tested (
Table 4).
Table 3.
Analysis of variance for aflatoxin and A. flavus accumulation in single cross hybrids from the Mississippi State, MS field location in 2010 and 2011.
Table 3.
Analysis of variance for aflatoxin and A. flavus accumulation in single cross hybrids from the Mississippi State, MS field location in 2010 and 2011.
| Source | df a | Mean Squares |
|---|
| Aflatoxin b | A. flavus Accumulation c |
|---|
| Years | 1 | 24.69 * | 5.30 × 10⁻⁴ * |
| Reps (Years) | 8 | 1.29 | 8.40 × 10⁻⁵ |
| Genotype | 3 | 129.44 * | 2.40 × 10⁻³ * |
| Genotype × Years | 3 | 15.49 * | 1.80 × 10⁻⁴ |
| Reps (Genotype × Years) | 24 | 0.78 | 2.00 × 10⁻⁴ |
| Treatment | 3 | 42.35 * | 1.20 × 10⁻³ * |
| Treat × Year | 3 | 17.66 * | 1.00 × 10⁻⁴ |
| Treat × Genotype | 9 | 8.89 * | 2.50 × 10⁻⁴ |
| Treatment × Year × Genotype | 9 | 4.22 * | 1.80 × 10⁻⁴ |
| Error | 90 | 124.60 | 1.80 × 10⁻² |
Table 4.
Least significant difference (LSD) analysis of fungal accumulation by single cross hybrid across all treatments from Mississippi State, MS field location in 2010 and 2011.
Table 4.
Least significant difference (LSD) analysis of fungal accumulation by single cross hybrid across all treatments from Mississippi State, MS field location in 2010 and 2011.
| Year | Hybrid | Mean Fungal Accumulation (ng/μL) |
|---|
| 2010 | SC212M × T173 | 0.0207 a |
| GA209 × SC212M | 0.0199 a |
| Mp313E × Mo18W | 0.0047 b |
| Mp494 × Mp717 | 0.0031 b |
| 2011 | SC212M × T173 | 0.0144 a |
| GA209 × SC212M | 0.0115 a,b |
| Mp494 × Mp717 | 0.0039 b,c |
| Mp313E × Mo18W | 0.0029 c |
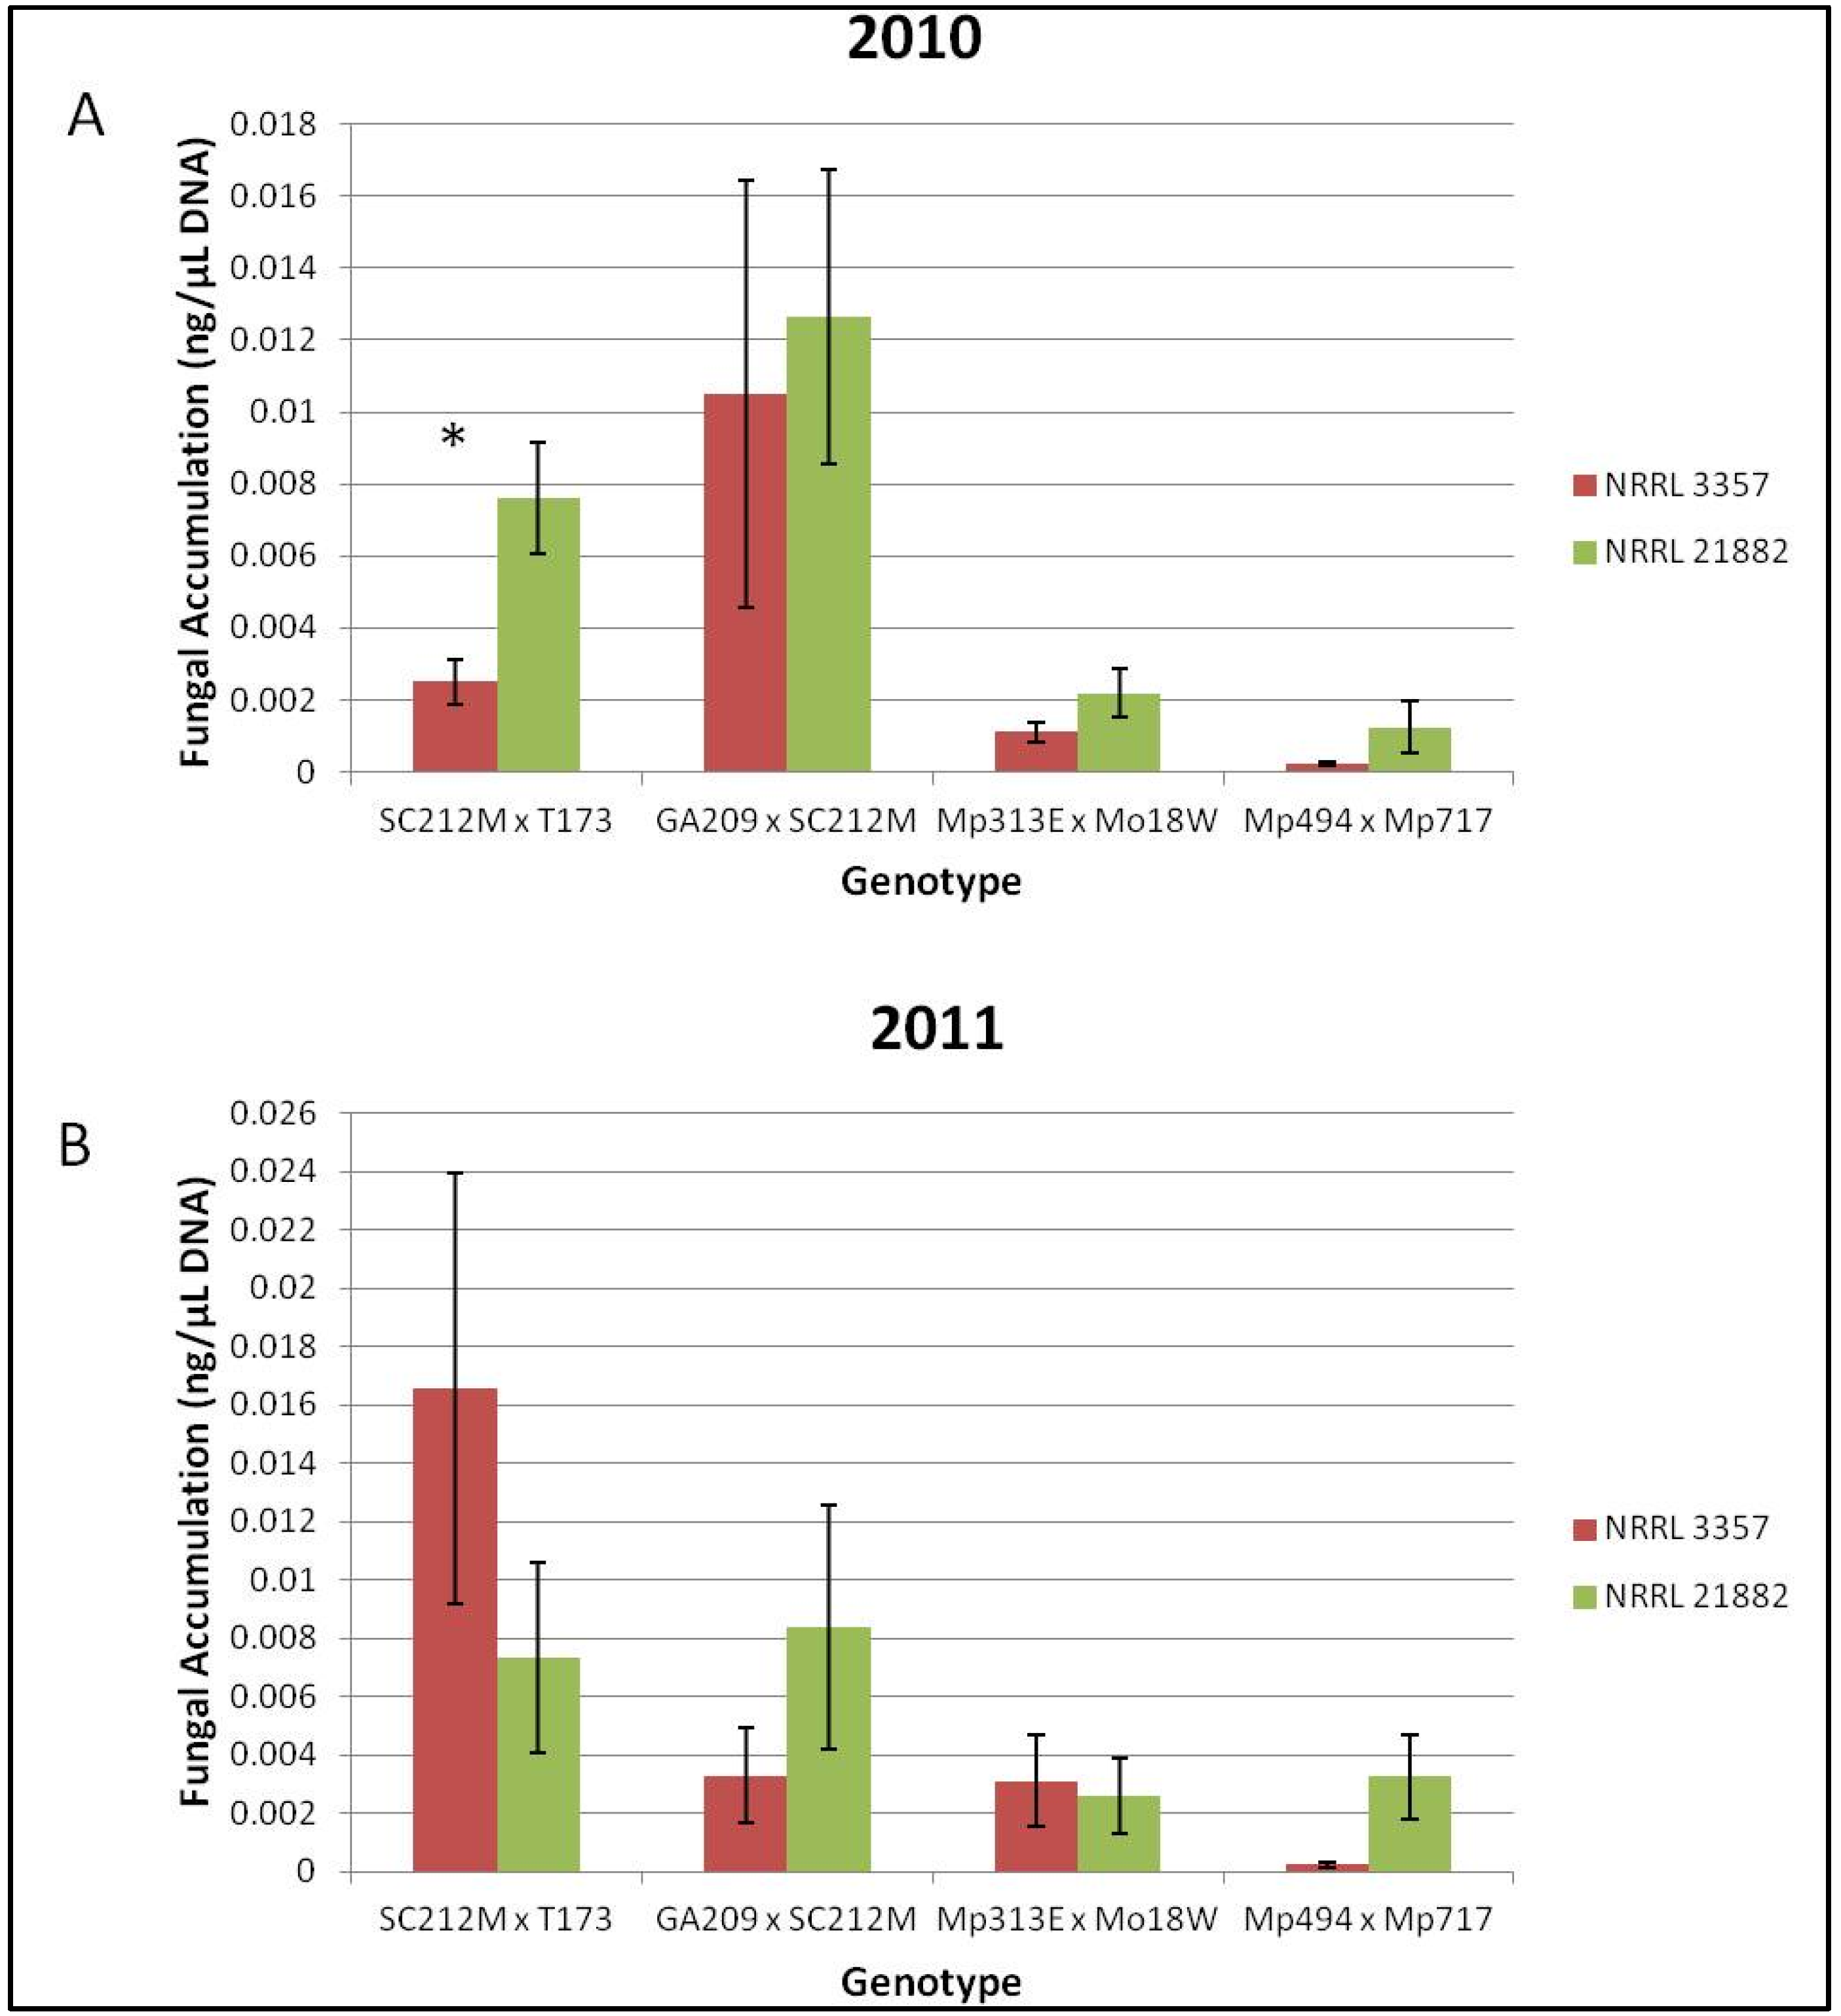
Figure 3.
Fungal accumulation (ng/μL) of NRRL 3357 and 21882 in Co-Inoculated ears. (A) Fungal strain accumulation for each genotype for the field year 2010; (B) Fungal strain accumulation for each genotype for the field year 2011. * Indicates a significant difference (α = 0.05) in A. flavus accumulation for strain NRRL 21882 or NRRL 3357 in the Co-Inoculated ears. Error bars represent one standard error.
Overall the resistant hybrids accumulated less total fungus than the susceptible hybrids. However, there were no significant differences among treatments in terms of total fungal accumulation when compared across all hybrids or when compared for each genotype/year combination. When the co-inoculated treatments were quantified using the strain specific primers it was found that neither strain of
A. flavus was significantly more represented in co-inoculated samples for the means of each genotype in 2010 or 2011. However, when each genotype/year combination was examined, the SC212M × T173 hybrid had significantly more
A. flavus NRRL 21882 accumulation than NRRL 3357 in the field year 2010 (
Figure 3A). No other genotype/year combination had significant differences in strain accumulation (
Figure 3A,B).
Aflatoxin quantification revealed that for both the 2010 and 2011 field seasons the resistant crosses accumulated significantly less aflatoxin than the susceptible crosses. The geometric means across all treatments for SC212M × T173, GA209 × SC212M, Mp494 × Mp717 and Mp313E × Mo18W were 35, 54, 13, and 2 ng/g respectively in 2010 and 51, 80, 13, and 3 ng/g respectively in the field year 2011 (
Table 5). Examination of the differences among the treatments showed that in almost all of the field years, co-inoculation reduced aflatoxin accumulation (
Table 6). In regard to treatment across all genotypes, co-inoculation of the two strains reduced aflatoxin accumulation in both years but only significantly in 2010 (
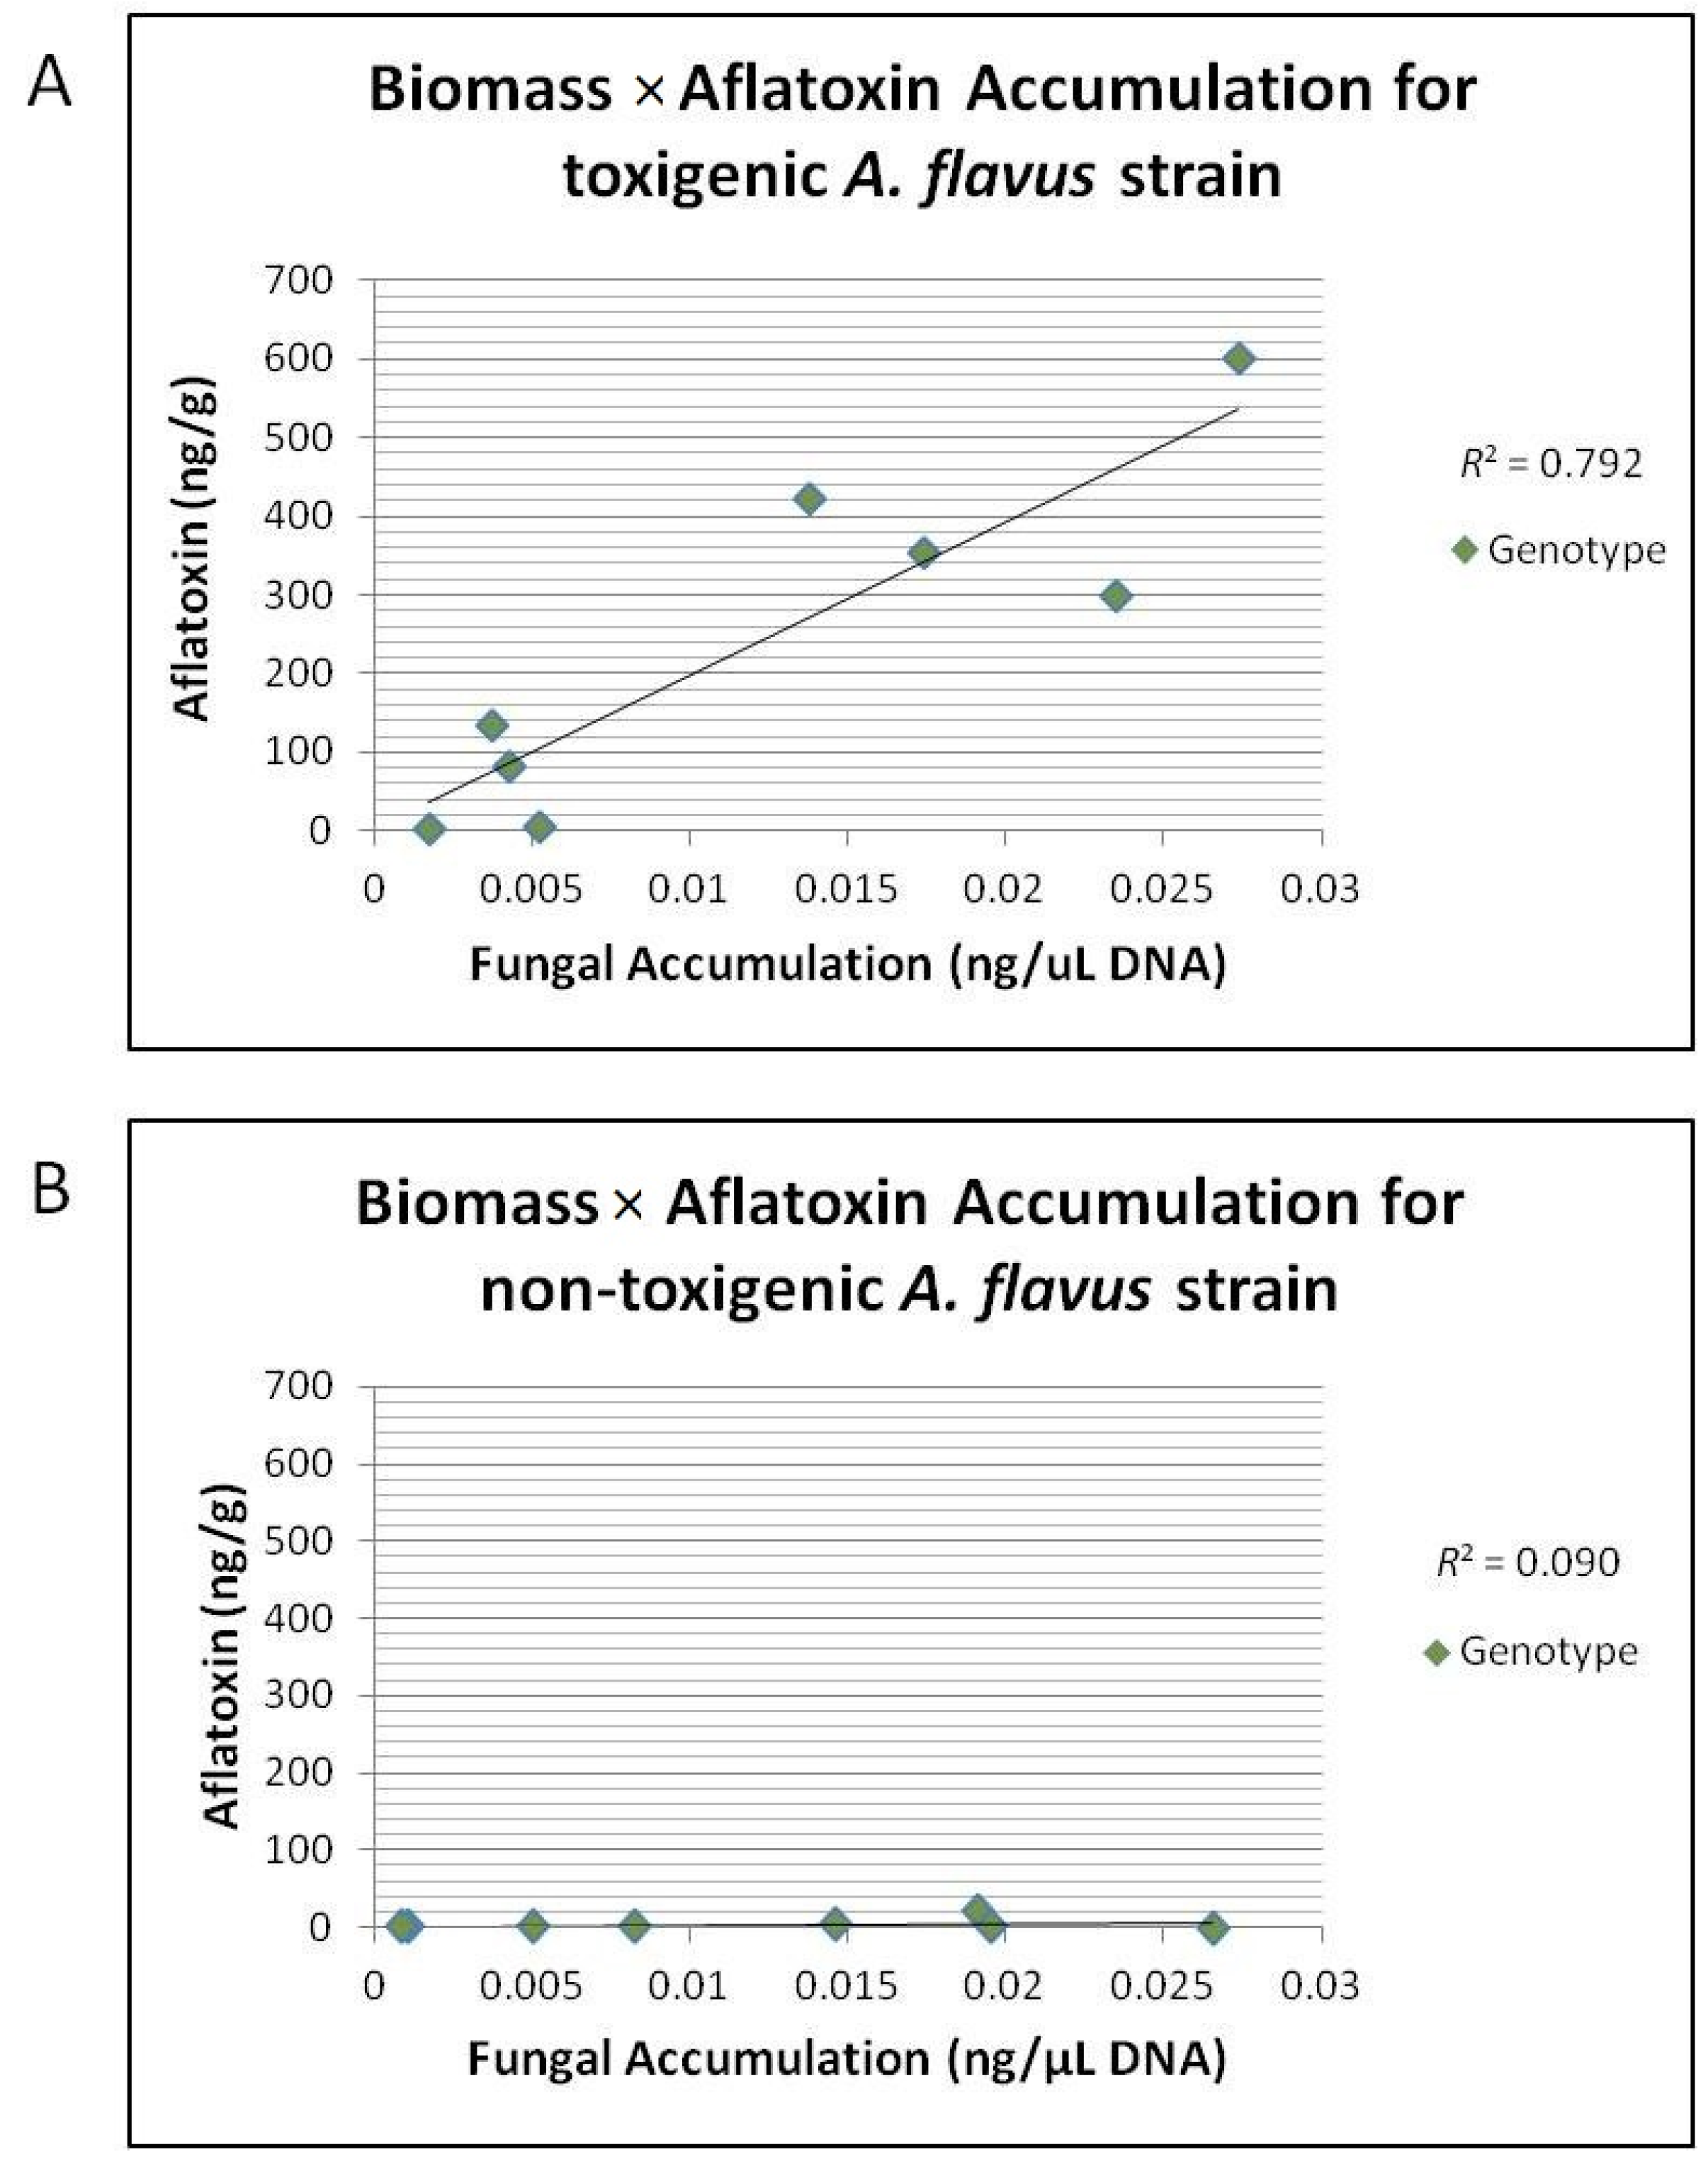
Table 7). Correlation for mean
A. flavus NRRL 3357 fungal accumulation with mean aflatoxin accumulation for each genotype/year combination was highly correlated with an
R2 = 0.79 (
Figure 4A); however, there was no correlation between mean NRRL 21882 fungal accumulation and aflatoxin accumulation
R2 = 0.09 (
Figure 4B).
Figure 4.
Correlation of mean A. flavus strain accumulation (ng/μL) to mean aflatoxin accumulation (ng/g). (A) Correlation of mean A. flavus strain 3357 fungal accumulation (ng/μL) to mean aflatoxin accumulation (ng/g) in ears for each genotype/year combination inoculated with 3357 or Co-Inoculated for field years 2010 and 2011. There was a strong correlation between 3357 accumulation and aflatoxin accumulation across all genotypes (R2 = 0.792); (B) Correlation of mean A. flavus strain 21882 fungal accumulation (ng/μL) to mean aflatoxin accumulation (ng/g) in ears of each genotype/year combination inoculated with 21882. There was a no correlation between 21882 accumulation and aflatoxin accumulation across all genotypes (R2 = 0.090).
Table 5.
Least significant difference (LSD) analysis of aflatoxin accumulation by single cross hybrid across all treatments from Mississippi State, MS field location in 2010 and 2011.
Table 5.
Least significant difference (LSD) analysis of aflatoxin accumulation by single cross hybrid across all treatments from Mississippi State, MS field location in 2010 and 2011.
| Single Cross Hybrid | Aflatoxin (ng/g) |
|---|
| 2010 | 2011 |
|---|
| GA209 × SC212M | 54 a | 80 a |
| SC212M × T173 | 35 a | 51 a |
| Mp313E × Mo18W | 13 b | 13 b |
| Mp494 × Mp717 | 2 c | 3 c |
Table 6.
Least significant difference (LSD) analysis of aflatoxin accumulation by single cross hybrid for each treatment and field year from Mississippi State, MS field location in 2010 and 2011.
Table 6.
Least significant difference (LSD) analysis of aflatoxin accumulation by single cross hybrid for each treatment and field year from Mississippi State, MS field location in 2010 and 2011.
| Treatment | Single Cross Hybrid |
|---|
| SC212M × T173 | GA209 × SC212M | Mp313E × Mo18W | Mp494 × Mp717 |
|---|
| Aflatoxin (ng/g) |
|---|
| 2010 | 2011 | 2010 | 2011 | 2010 | 2011 | 2010 | 2011 |
|---|
| 3357 | 441 a | 233 a | 931 a | 329 a | 115 a | 132 a | 1 a | 3 a |
| Co-inoculated | 102 b | 422 a | 153 b | 92 a,b | 16 b | 7 b | 1 a | 4 a |
| 21882 | 0 c | 2 b | 0 c | 17 b | 1 c | 0c | 0 a | 0 a |
Table 7.
Least significant difference (LSD) analysis of aflatoxin accumulation by treatments across all hybrids from Mississippi State, MS field location in 2010 and 2011.
Table 7.
Least significant difference (LSD) analysis of aflatoxin accumulation by treatments across all hybrids from Mississippi State, MS field location in 2010 and 2011.
| Treatment | Aflatoxin (ng/g) |
|---|
| 2010 | 2011 |
|---|
| 3357 | 103 a | 77 a |
| Co-inoculated | 38 b | 33 a |
| 21882 | 1 c | 2 b |


