Article

Reduction of Aflatoxins in Apricot Kernels by Electronic and Manual Color Sorting

Institute of Sciences of Food Production (ISPA), National Research Council of Italy (CNR), Via Amendola 122/O, Bari 70126, Italy
*
Author to whom correspondence should be addressed.
Submission received: 30 December 2015 / Revised: 12 January 2016 / Accepted: 14 January 2016 / Published: 19 January 2016
(This article belongs to the Collection Aflatoxins)

Abstract

:
The efficacy of color sorting on reducing aflatoxin levels in shelled apricot kernels was assessed. Naturally-contaminated kernels were submitted to an electronic optical sorter or blanched, peeled, and manually sorted to visually identify and sort discolored kernels (dark and spotted) from healthy ones. The samples obtained from the two sorting approaches were ground, homogenized, and analysed by HPLC-FLD for their aflatoxin content. A mass balance approach was used to measure the distribution of aflatoxins in the collected fractions. Aflatoxin B1 and B2 were identified and quantitated in all collected fractions at levels ranging from 1.7 to 22,451.5 µg/kg of AFB1 + AFB2, whereas AFG1 and AFG2 were not detected. Excellent results were obtained by manual sorting of peeled kernels since the removal of discolored kernels (2.6%–19.9% of total peeled kernels) removed 97.3%–99.5% of total aflatoxins. The combination of peeling and visual/manual separation of discolored kernels is a feasible strategy to remove 97%–99% of aflatoxins accumulated in naturally-contaminated samples. Electronic optical sorter gave highly variable results since the amount of AFB1 + AFB2 measured in rejected fractions (15%–18% of total kernels) ranged from 13% to 59% of total aflatoxins. An improved immunoaffinity-based HPLC-FLD method having low limits of detection for the four aflatoxins (0.01–0.05 µg/kg) was developed and used to monitor the occurrence of aflatoxins in 47 commercial products containing apricot kernels and/or almonds commercialized in Italy. Low aflatoxin levels were found in 38% of the tested samples and ranged from 0.06 to 1.50 μg/kg for AFB1 and from 0.06 to 1.79 μg/kg for total aflatoxins.

Graphical Abstract

1. Introduction

The main production areas of apricots (Prunus armeniaca) are the Mediterranean and Middle East. The top five producers of apricots (fresh fruit) in 2013 were Turkey (811,609 tonnes), Iran (457,308 tonnes), Uzbekistan (430,000 tonnes), Algeria (319,784 tonnes), and Italy (198,290 tonnes) [1] (FAOSTAT). A significant portion of apricots are used to produce apricot stone/pit and its kernel. Apricot kernels are byproducts of the apricot processing industry [2]. In Turkey, 10% of the apricots are used as fresh product, the rest of the product is traditionally stored in sacks with a 20% moisture level after harvesting, sulphuring, drying and stone/pit separation processes [3]. Apricot stones/pits are separated from apricot pulp and processed into shells, mainly used as fuel, and kernels that are exported worldwide, mainly to European countries [4]. Two main varieties of apricot kernels can be easily differentiated, sweet and bitter. Bitter kernels are a good source of amygdaline, which is about 4.5%–6.5% of dry kernels [5]. The oil of bitter kernels (53%) is used in cosmetics and aroma perfume [6] or as a cheaper substitute of bitter almond oil. Apricot kernels can also be of interest as a food or feed ingredient because of their high crude protein content (20%–25% w/w, dry weight basis) [2]. Sweet apricot kernels can be added to bakery products as whole or ground kernels, as well as consumed as appetizers [7]. Bitter apricot kernels can be used as a substitute of bitter almonds, a more expensive kernel, to produce “persipan” a material used in confectionery and bakery products [5]. The use of persipan as an ingredient of marzipan, made by almond and sugar, at a level >0.5% is considered an adulteration [8]. Moreover, apricot kernels are an important ingredient of the Italian biscuit “amaretti”, whereas the Italian liqueur amaretto is flavoured with extract of these kernels.
Apricot kernels and almonds are at high risk of aflatoxin contamination but they are poorly studied, especially apricot kernels. The first notification of aflatoxins in apricot kernels was published in 1999 in the European Rapid Alert System for Food and Feed (RASFF) network. Between 1999 and 2015 a total of 28 notifications (six alerts, 13 border rejections, nine information) were reported for imported apricot kernels, or derived products produced in Europe, that were found contaminated with high levels of aflatoxins [9]. From 2010 the European maximum levels of aflatoxin B1 (AFB1) and total aflatoxins (AFs) in apricot kernels intended for further processing (12 µg/kg for AFB1 and 15 µg/kg for total AFs) and ready-to-eat (8 µg/kg for AFB1 and 10 µg/kg for total AFs) have been aligned to those of Codex Alimentarius after a positive opinion of the European Food Safety Authority (EFSA) [10,11,12,13].
Aflatoxins contamination in maize, peanuts, almonds, pistachios, and Brazil nuts have an extremely uneven distribution [14,15,16,17]. Often the contaminated lots have few kernels contaminated with high levels of aflatoxins, whereas most of kernels have low or no detectable contamination. Sampling plans have been developed to establish the true levels of contamination in lots, but a real correspondence between true levels and results obtained by applying the sampling plans is often not obtained [18,19,20]. The uneven distribution of aflatoxins prompt to the development of strategies of segregation of contaminated kernels from healthy ones, because their removal can drastically reduce aflatoxin contamination of the entire lot. Moreover, it is known that changes of intrinsic characteristics of nuts, like discoloration and staining of skins or kernels, appearance of fluorescent material, changes of size or density, are caused by fungal growth [19]. Some technologies able to detect changes in nut characteristics, such as hand-picking, electronic color sorting (sometimes combined with blanching), size separation, and flotation have been applied to different kind of nuts. Several studies were carried out for peanuts, pistachios, walnuts, and Brazil nuts [21,22,23,24]. Few data are available on almonds [20], whereas apricot kernels have not been studied yet.
The objective of this study was to reduce aflatoxin content in naturally-contaminated apricot kernels by using electronic and manual color sorting as a tool to separate contaminated kernels from healthy ones. The mass balance approach was used to quantitatively determine the distribution of aflatoxins in final and rejected products during sorting processes. The occurrence of aflatoxins was also evaluated on commercial products containing apricot kernels and/or almonds and commercially available in Italy.

2. Results and Discussion

2.1. Method Performance

The values of limit of detection (LOD) and limit of quantitation (LOQ) obtained for the four aflatoxins in the different matrices considered in this study, and by using the different versions of the analytical method, are reported in Table 1.
Depending on the matrix considered and the amount of matrix equivalent injected into the HPLC system, the values of LOD ranged between 0.03 and 24 μg/kg for AFB1, 0.01 and 17.6 for AFB2, 0.05 and 3.1 μg/kg for AFG1, and 0.02 and 1.26 μg/kg for AFG2. The values of LOQ ranged between 0.06 and 48 μg/kg for AFB1, 0.02 and 35.2 μg/kg for AFB2, 0.1 and 5.40 μg/kg for AFG1, and 0.04 and 2.52 μg/kg for AFG2. These wide ranges depend of the amount of matrix equivalent, ranging between 1.7 and 150 mg, injected in the HPLC apparatus. In particular, high values of LOD and LOQ were observed for discolored apricot kernels because of the low amount of matrix equivalent injected into the HPLC system and the absence of immuonoaffinity cleanup. On the other hand, low values of LOD and LOQ were not necessary for these naturally contaminated samples which contained high levels of aflatoxins ranging from 1.7 to 22,451.5 µg/kg of AFB1 + AFB2 (Figure 3 and Figure 4). The values of LOD and LOQ reported in Table 1 were judged acceptable to measure aflatoxin levels occurring in naturally-contaminated apricot kernels and skins, as well as in commercial products containing almonds and/or apricot kernels.
Table 1. LOD and LOQ values for determination of AFB1, AFB2, AFG1, and AFG2 in apricot kernels, skins, discolored apricot kernels, and commercial products by injecting into HPLC 1.7–150 mg of matrix equivalent.
MatricesLOD μg/kgLOQ μg/kg
AFB1AFB2AFG1AFG2AFB1AFB2AFG1AFG2
Healthy apricot kernels a0.40.080.560.150.80.161.120.30
Discoloured apricot kernels b2417.6--4835.2--
Apricot kernel skins c1.400.483.101.262.800.965.402.52
Commercial products d0.030.010.050.020.060.020.10.04
a matrix equivalent injected into HPLC apparatus: 25 mg; b matrix equivalent injected into HPLC apparatus: 1.7 mg; c matrix equivalent injected into HPLC apparatus: 5 mg; d matrix equivalent injected into HPLC apparatus: 150 mg.
Results of recovery and repeatability experiments conducted with commercial products are reported in Table 2. Analysis of spiked blank samples demonstrated that the method provides accurate and precise results even at low spiking levels of aflatoxins. In particular, at spiking levels of 0.2 μg/kg of AFB1 and 0.5 μg/kg of total AFs, recoveries were 91%–115% and 85%–103%, respectively. At spiking level of 1 μg/kg of AFB1 and 2.5 μg/kg of total AFs, recoveries were 92%–98% and 89%–94%, respectively. Repeatability values for AFB1 ranged between 2.9% and 6.9% at 0.2 μg/kg and 1.3% and 4.6% at 1 μg/kg. Repeatability values for total AFs ranged between 4.0% and 10.6% at 0.5 μg/kg, and 1.8% and 6.6% at 2.5 μg/kg. Both recovery and repeatability results fulfil the criteria of acceptability of methods for aflatoxin determination in food commodities reported in the EU legislation no. 401/2006 [25].
Table 2. Recoveries and within-laboratory repeatability (RSDr) for aflatoxins in spiked matrices. Results are mean of three replicates.
MatricesAFB1Total AFS
Spiking level (µg/kg)Recovery (%)RSDr (%)Spiking level (µg/kg)Recovery (%)RSDr (%)
Almonds0.21076.90.51009.8
1.0963.42.5942.9
Peeled almonds0.21024.10.59410.6
1.0944.62.5916.6
Amaretti0.21154.10.51035.6
1.0981.32.5941.8
Cantucci0.2915.30.5864.0
1.0922.92.5893.5
Almond nougat0.2985.30.5857.1
1.0963.22.5912.5
No interfering peaks at retention times of aflatoxins were visible in the chromatograms of tested sample extracts including those obtained from discolored apricot kernels that were analyzed by HPLC without IMA clean-up. A typical chromatogram of a commercial sample of salt-roasted almonds with EVO oil, naturally-contaminated with the four aflatoxins, is shown in Figure 1.
Figure 1. Chromatogram of a commercial sample of salt-roasted almonds with EVO oil naturally contaminated with 0.11 µg/kg AFB1, 0.20 µg/kg AFG1, 0.01 µg/kg AFB2 and AFG2.
Toxins 08 00026 g001

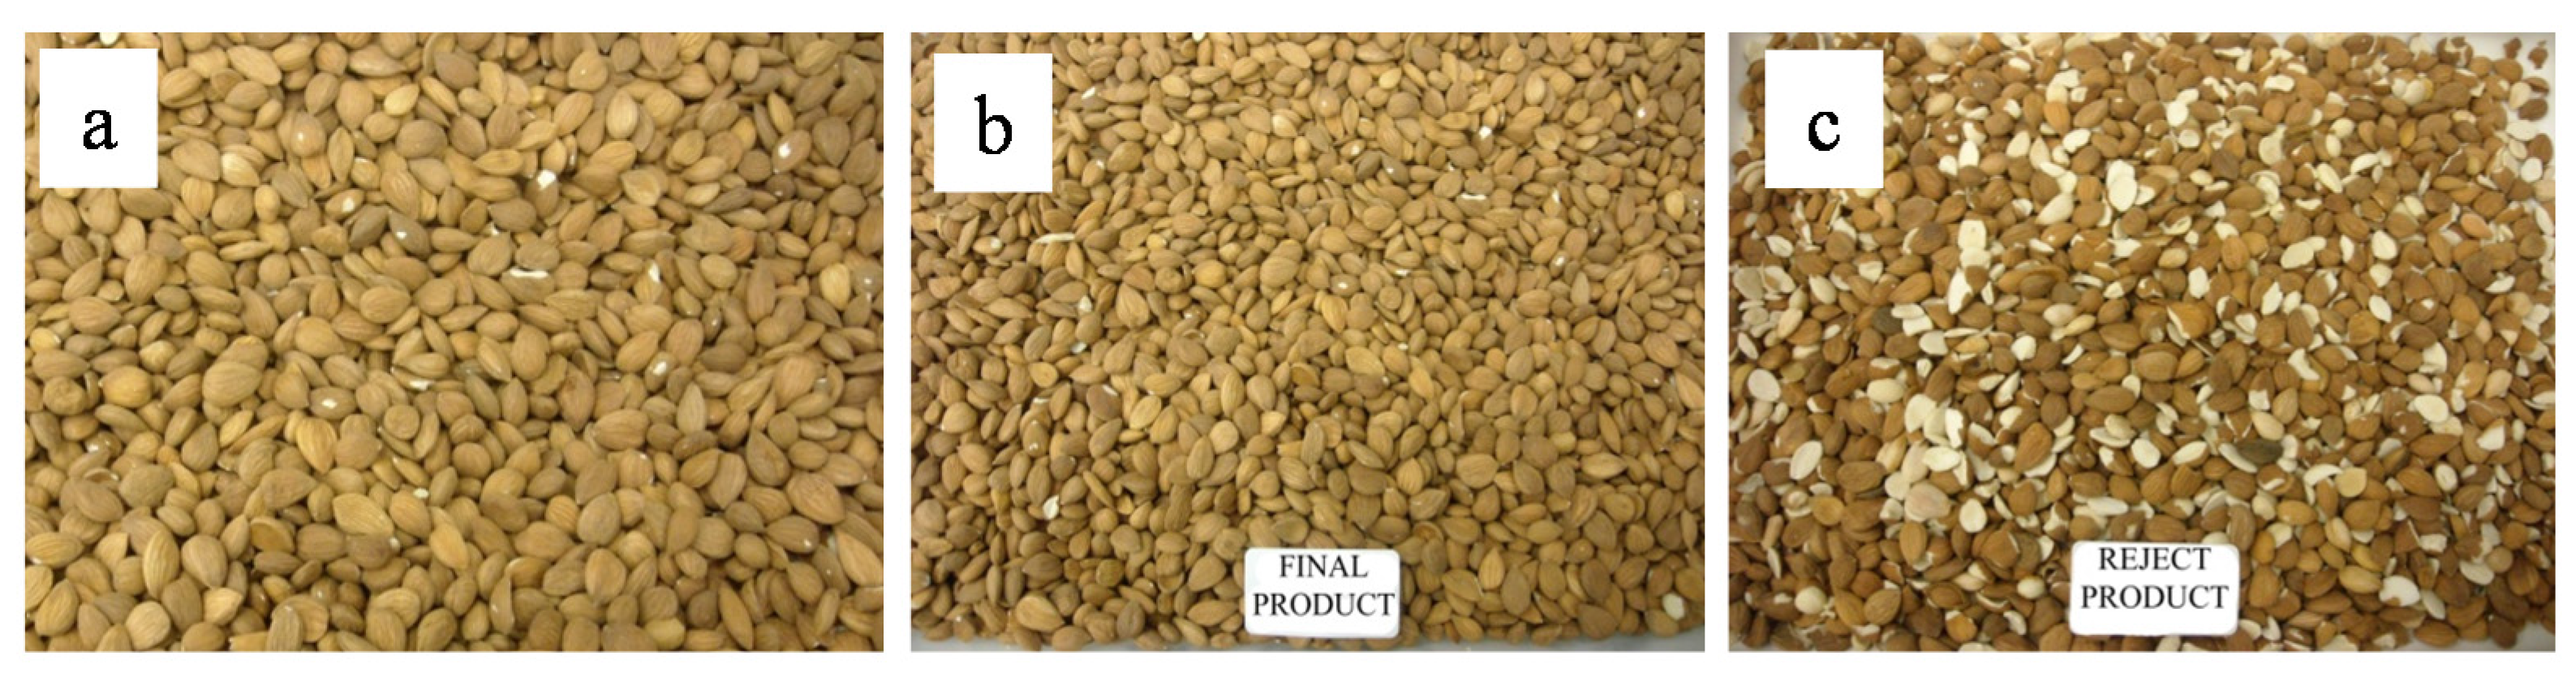
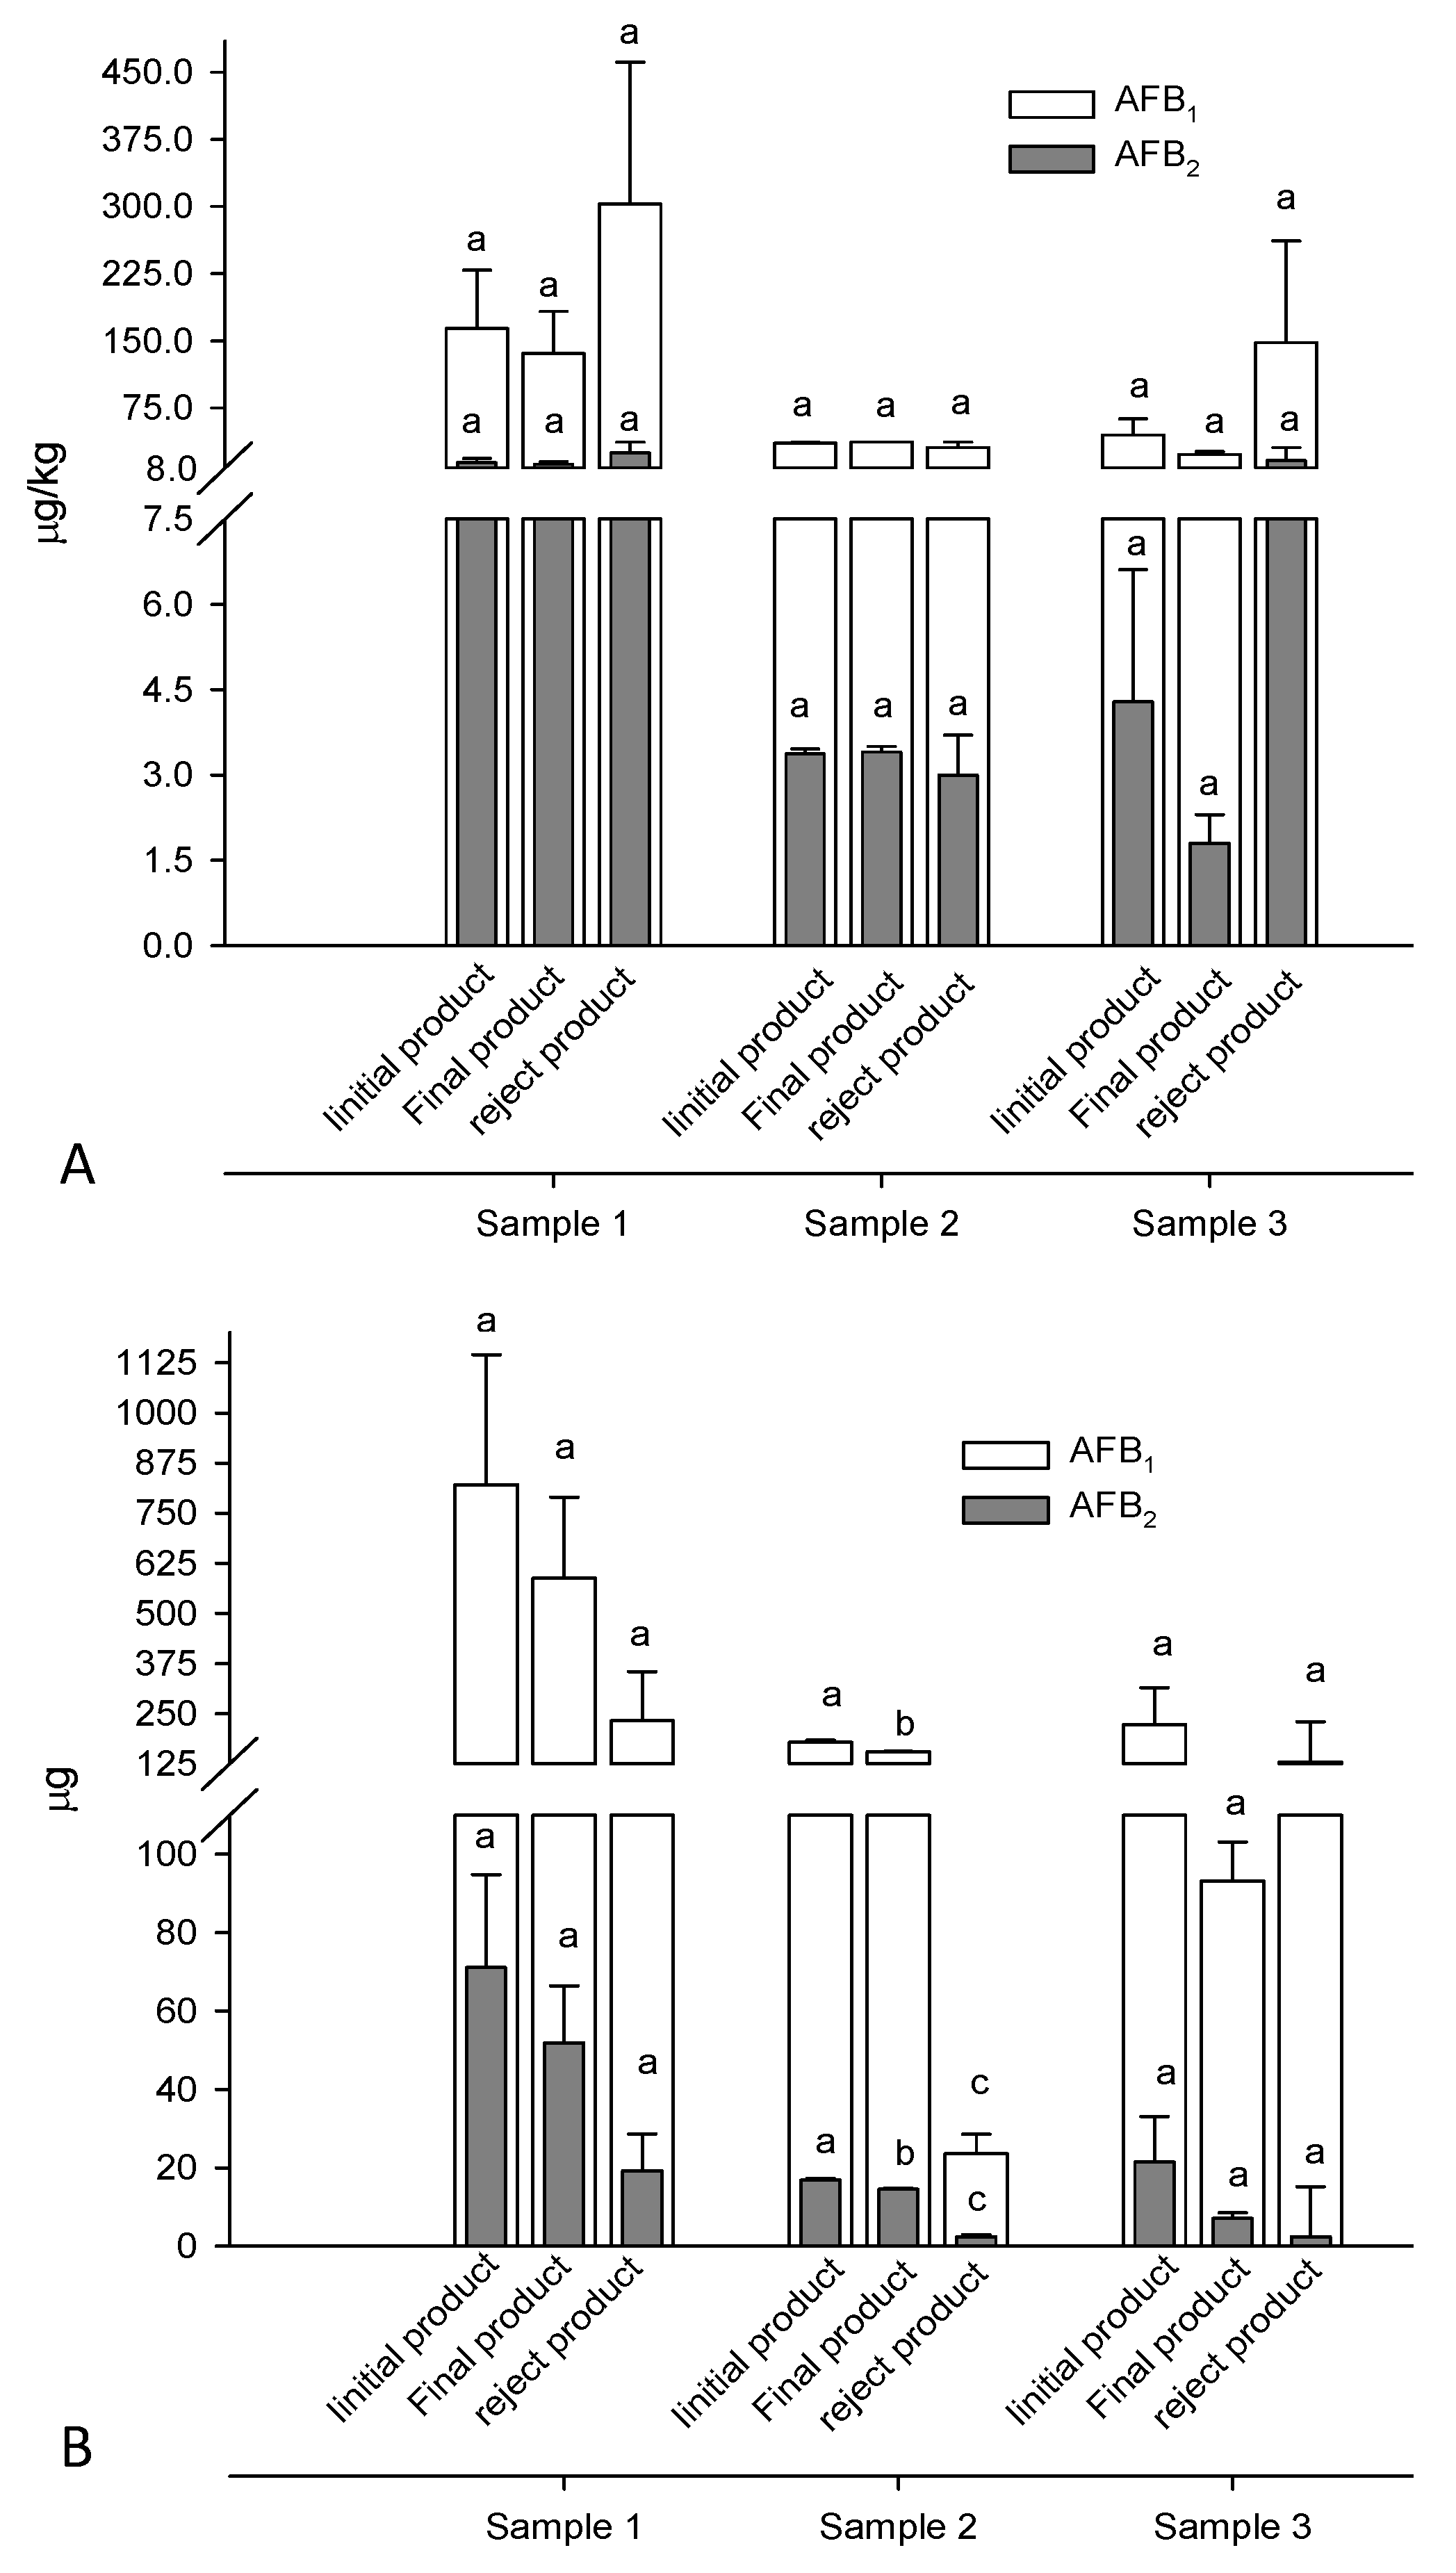
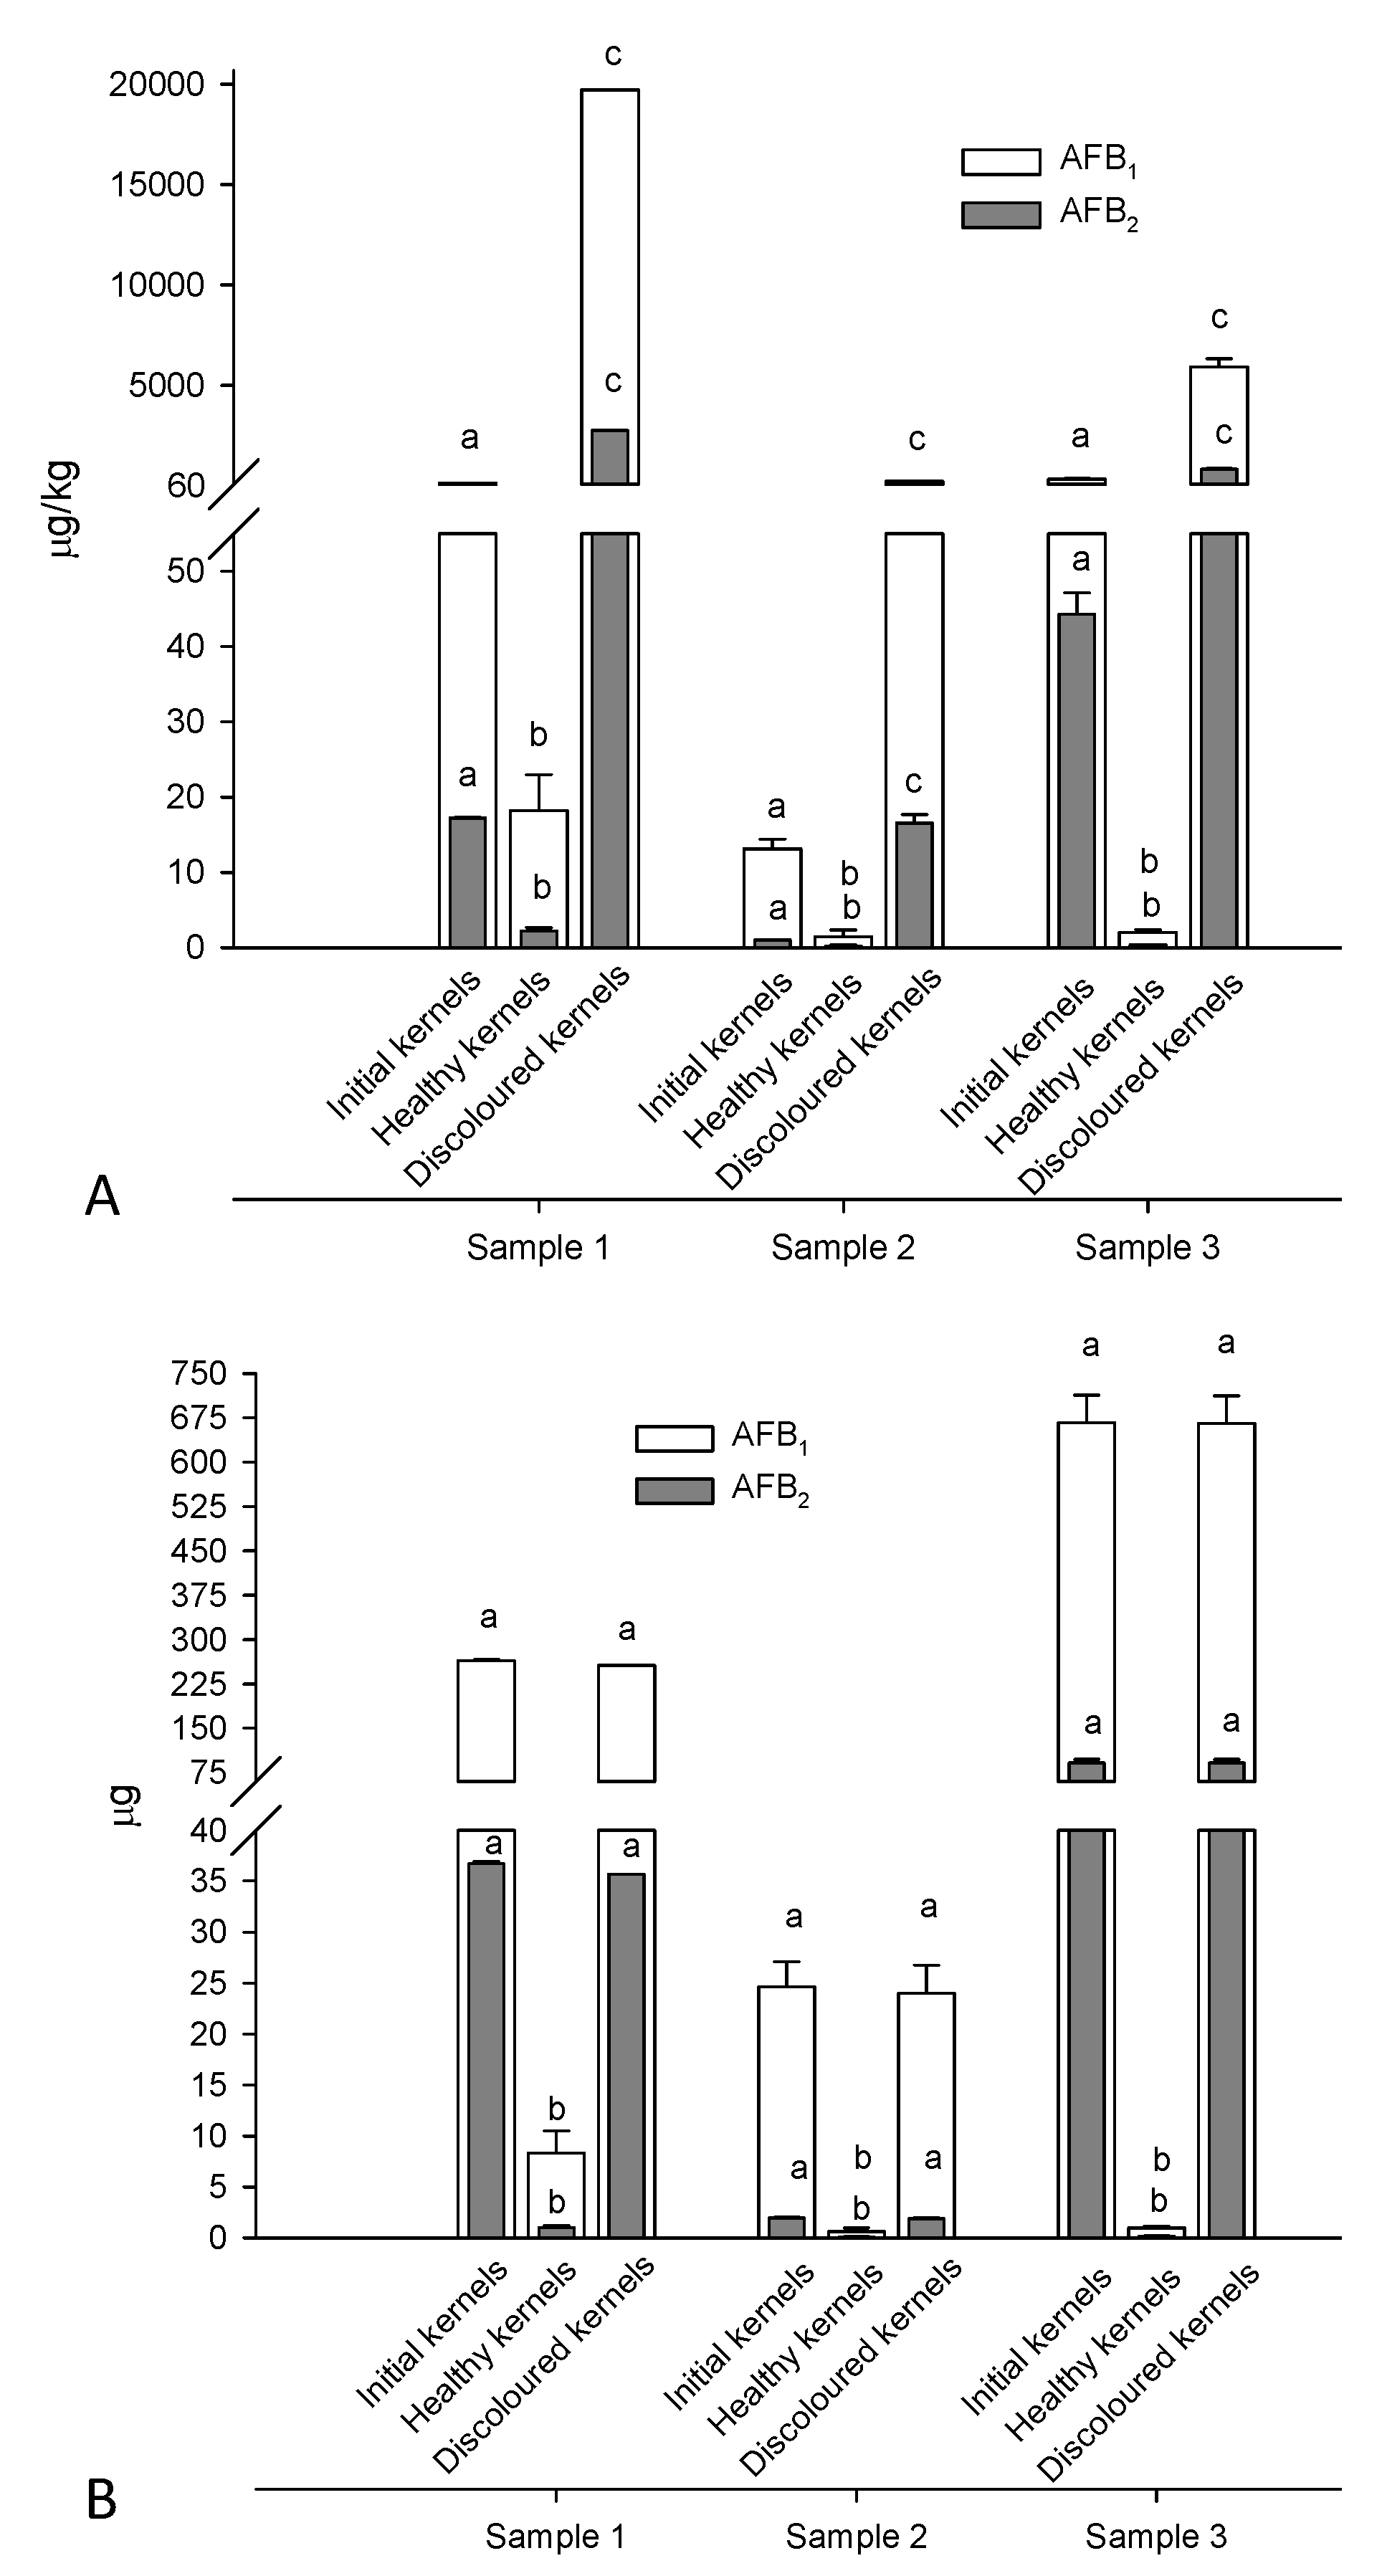
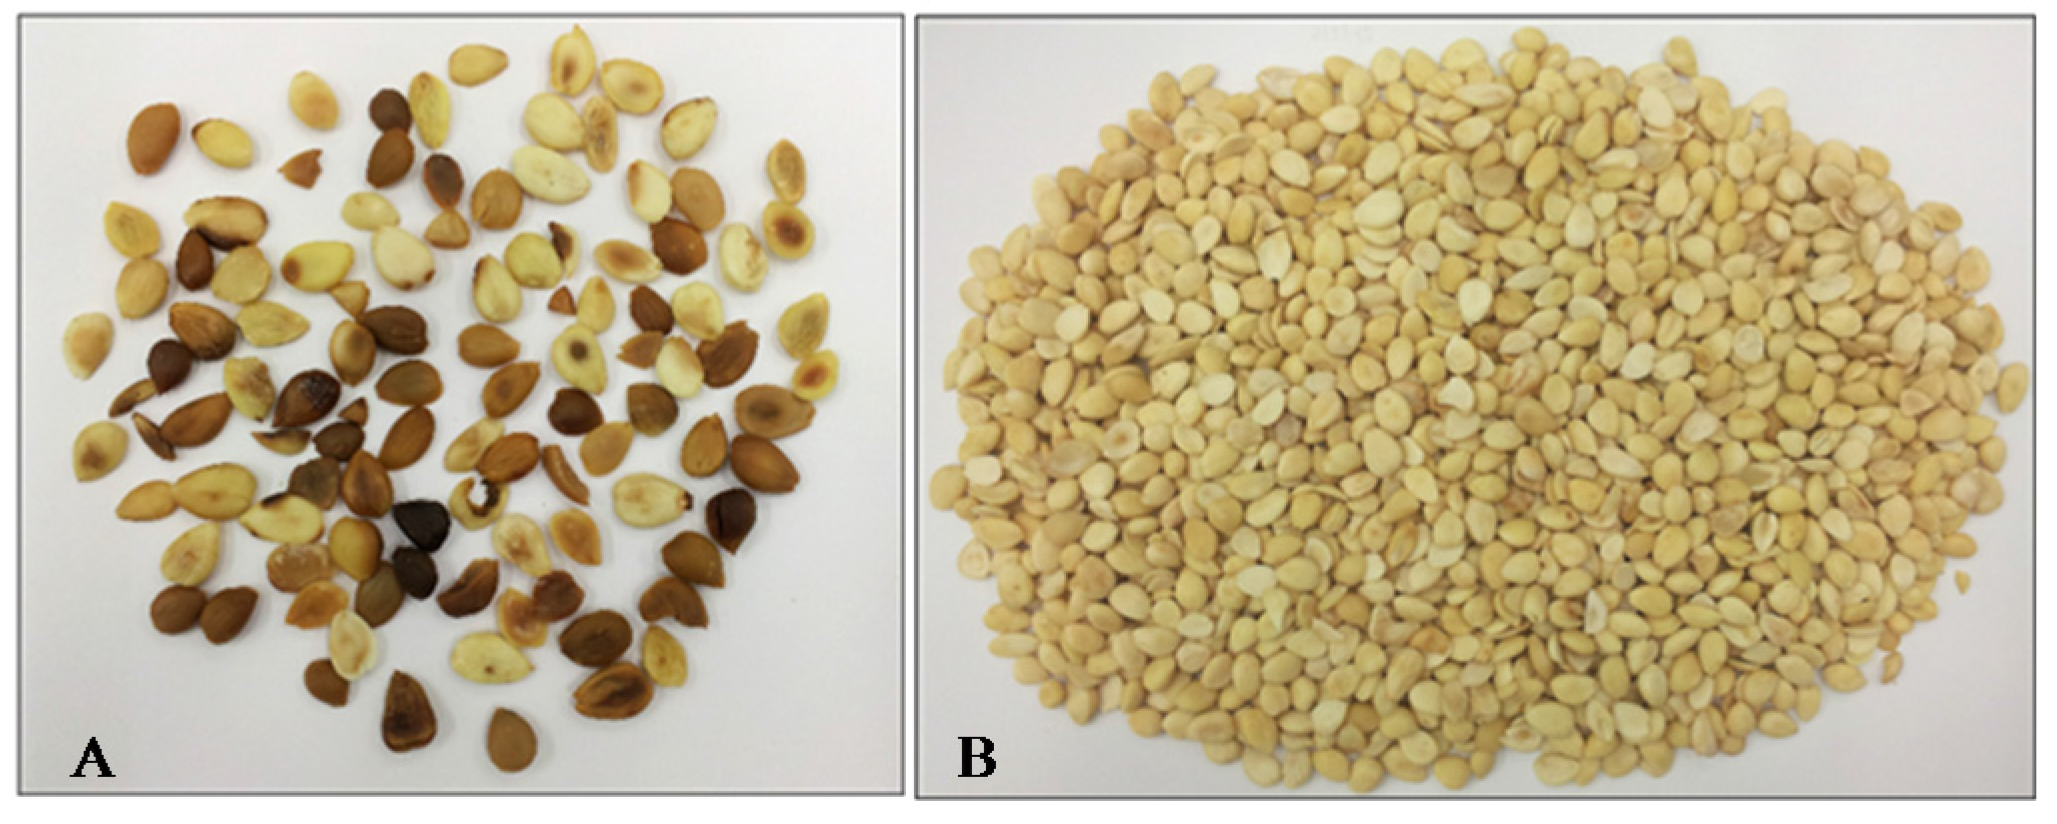
2.2. Electronic Color Sorting (e-Sorting) of Apricot Kernels

The 3 × 5 kg samples (1, 2, and 3) of apricot kernels naturally contaminated with aflatoxins were submitted to an e-sorting machine that produced two fractions from each sample, i.e., “final product” and “reject product”. These fractions were weighted, homogenized, and analyzed for aflatoxins. The three fractions of “final product” weighed 4.3 kg, 4.3 kg, and 4.0 kg, whereas the three fractions of “reject product” weighed 0.77 kg, 0.77 kg ,and 0.88 kg. Figure 2 shows the picture of apricot kernels before e-sorting and after e-sorting (“final product” and “reject product”) of sample 1, as an example to explain the e-sorting outcome. From Figure 2 it seems that e-sorting was effective in the segregation of broken kernels from unbroken ones. The amounts of “final product” and “rejected product” were constant for the three samples and ranged between 82% and 85% and 15% and 18% of the initial sample, respectively.
Figure 2. Initial apricot kernels (a); final product (b) and reject product (c) obtained by e-sorting of sample 1.
Toxins 08 00026 g002
All samples of apricot kernels collected from the e-sorter machine were contaminated with AFB1 and AFB2 whereas AFG1 and AFG2 were not detected. This means that A. flavus was the fungus responsible for aflatoxin accumulation in these samples. The results of AFB1 and AFB2 levels in the apricot kernels before e-sorting, and in the fractions collected from the e-sorter machine (“final” and “reject”) are shown in Figure 3A. As shown in this figure, comparable levels of AFB1 and AFB2 were found in the initial apricot kernels, and in the two fractions collected from the e-sorter from each of the three samples. Statistical analysis of these results showed the absence of significant differences within the fractions of samples 1, 2, and 3. This means that the segregation of “reject product” did not result in substantial removal of aflatoxins from the initial samples as the aflatoxin levels measured in the three “reject products” were similar to those measured in the three “final products”. Therefore, there is insufficient evidence to show that aflatoxins accumulate in broken kernels (Figure 2). The mass balance of AFB1 and AFB2 in these samples is shown in Figure 3B. From this figure it is clear that the amount of aflatoxins measured in the three “reject products” was quite variable with respect to the initial amounts. In particular, it ranged from 13% for sample 2 to 59% for sample 3. This means that after e-sorting the three “final products” still contained 41%–87% of the initial amount of aflatoxins. In other words, the separation of 15%–18% of kernels (“reject product”) removed 13%–59% of total aflatoxins contained in the three samples. Moreover, for samples 1 and 3 no statistical significant difference (p > 0.05) was observed for the amount of aflatoxin accumulated in the initial kernels, “final product”, and “reject product”. In conclusion, these results demonstrate that e-sorting was not effective to segregate kernels contaminated with aflatoxins from non-contaminated kernels. The e-sorting was only effective in the segregation of broken kernels from unbroken ones (Figure 2).
Figure 3. Electronic sorting: (A) levels of aflatoxins in initial, final, and reject products; and (B) relevant mass balance of aflatoxins. For each sample different letters indicate statistically significant differences among fractions (p < 0.05).
Toxins 08 00026 g003
E-sorting is the technology most widely used by the processing industries of tree nuts, alone or in combination with other sorting technologies. The e-sorting technology was tested, with variable results, for peanuts, Brazil nuts, pistachios, almonds, and walnuts, but they were not tested for apricot kernels [19,22]. For pistachios, it was reported that the highest AFB1 content was measured in discolored pistachios and their segregation from batches produced a total reduction of AFB1 that ranged from 94.6% to 98.8% [26]. The electronic and laser color sorters effectively reduced aflatoxins in contaminated lots of almonds [20]. The e-sorting of in-shell Brazil nuts was ineffective in reducing aflatoxins. Therefore the authors suggested, but did not test, to apply the e-sorting to shelled Brazil nuts for a better segregation of contaminated nuts [23].
Electronic color sorting was commonly applied to improve the overall quality of peanuts as well as for reduction of aflatoxins. In a study conducted in 1995 e-sorting produced a 70% of aflatoxin reduction [27]. More recently it was reported that color sorting reduced aflatoxin contamination in shelled peanuts by 29%–38% [21]. In the present study, the application of e-sorting to apricot kernels was ineffective as a stand-alone tool to segregate aflatoxin-contaminated kernels from non-contaminated kernels.

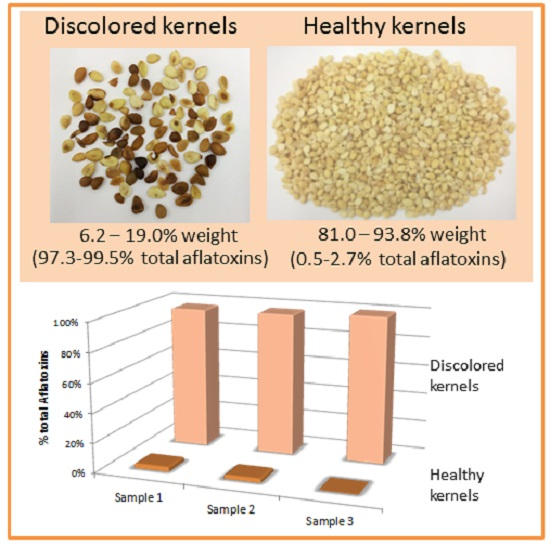
2.3. Blanching, Peeling, and Manual Sorting of Apricot kernels

Steaming blanching and peeling, followed by manual color sorting processes, were tested on naturally-contaminated apricot kernels to check the levels and distribution of aflatoxins in skins, healthy, and discolored peeled kernels. The fractions of skins, discolored kernels, and healthy kernels were separately freeze-dried, weighted, homogenized and analyzed for aflatoxin content. The presence of AFB1 and AFB2, at various levels, was confirmed also in these samples. The weight percentage of skins ranged between 5.5% and 6.1% for the 3 × 500 g kernel samples. Skins contained 4.8%–5.7% of total aflatoxins present in the initial kernels; therefore, skin removal did not reduce the aflatoxin content in peeled kernels. Our observation is consistent with the results obtained for almonds artificially contaminated with AFB1 and AFB2 and submitted to blanching and peeling [28].
Aflatoxin levels in peeled apricot kernels before and after manual separation into healthy and discolored ones are reported in Figure 4A. The highest levels of aflatoxins were found in discolored kernels, followed by initial and healthy ones. The manual separation of discolored kernels was, therefore, quite effective in removing almost all aflatoxins present in the initial samples as demonstrated by their mass balance (Figure 4B). In particular, 97.3%–99.5% of the total aflatoxins present in the initial peeled kernels accumulated in the discolored kernels and only 0.5%–2.7% remained in the healthy ones. The weight percentage of discolored kernels ranged between 2.6% and 19.9% for the 3 × 500 g kernel samples. Therefore, the segregation of 2.6%–19.9% (mean 9.5%) of kernels removed 97.3%–99.5% of total aflatoxins (Figure 4B).
The picture of discolored (A) and healthy (B) kernels obtained from blanching and manual sorting of 0.5 kg of apricot kernels (sample 3) is shown in Figure 5. It was easy to visually identify and segregate discolored kernels having different degrees of discoloration that ranged from a single spot to the entire kernel. Unpeeled discolored kernels could not be distinguished from unpeeled healthy kernels because skins of both types of kernels have the same brown color. This could be the reason why the e-sorting machine could not identify and segregate discolored kernels from healthy ones (see Figure 3 and Figure 4). The combination of peeling (blanching) and e-sorting could be, therefore, the optimal procedure to automatically separate contaminated kernels from uncontaminated kernels, providing that the machine is able to identify and separate both kernels uniformly discolored and kernels having a single spot. This approach was successfully used for peanuts with aflatoxin reduction between 83% and 91% [14,27]. In developed countries, hand picking is still used in certain cases for peanuts, in spite of its high cost, to achieve a better removal of contaminated material [18,29].
Figure 4. Manual sorting of naturally-contaminated apricot kernels: (A) levels of aflatoxins in initial, healthy and discolored kernels; and (B) relevant mass balance of aflatoxins. For each sample different letters indicate statistically significant differences among fractions (p < 0.05).
Toxins 08 00026 g004
Figure 5. (A) discolored apricot kernel (6.2% of total peeled kernels) contained 99.5% of total aflatoxins contained in peeled kernels (sample 3); and (B) healthy apricot kernels (93.8% of total peeled kernels) contained 0.5% of total aflatoxins contained in peeled kernels (sample 3).
Toxins 08 00026 g005

2.4. Occurrence of Aflatoxins in Commercial Products Containing Apricot Kernels and/or Almonds

The improved HPLC-FLD method having low values of LOD and LOQ was used herein to determine the occurrence of aflatoxins in commercial products containing apricot kernels and/or almonds, the two tree nuts considered in this study. In Table 3 are reported the results of 47 commercial products of which 39 were almonds and derived products and eight were apricot kernel flour-based products. Overall, 18 samples (38%) were found contaminated with aflatoxins at levels ranging from 0.06 to 1.50 μg/kg of AFB1 and 0.06 to 1.79 μg/kg of total AFs. Although a high percentage of samples were contaminated, the measured levels of AFB1 and total AFs were below the limits set by the European Legislation for these products i.e., 8 μg/kg AFB1 and 10 μg/kg total AFs [12] (EU 165/2010). Among the 39 almonds and derived products, 11 samples (28%) were contaminated with a mean level of AFB1 and total AFs of 0.07 and 0.11 µg/kg, respectively. The six samples of nougat were all found negative. The absence of aflatoxins in these samples may be related to the type of processing used for the preparation of this almond-derived product which involves caramelization of sugar. We have previously demonstrated that the caramelization of sugar spiked with aflatoxins reduce aflatoxin levels up to 82% and similar results were obtained when contaminated almonds were processed into nougat at laboratory scale [28].
Among the eight apricot kernel-derived products (amaretti), seven samples (88%) were contaminated with a mean level of AFB1 and total AFs of 0.63 and 0.81 µg/kg, respectively. The percentage in weight of almonds in commercial products considered in this survey ranged from 7% to 100% of the final product. The percentage in weight of apricot kernels ranged from 16% to 40% for amaretti. However, no correlation was found between the percentage of almonds or apricot kernels and the aflatoxin contamination, which confirms the uneven distribution of aflatoxin contamination. On the other hand, the percentage of positive samples and mean contamination levels of apricot kernel-derived products are consistently higher as compared to almonds and almond-derived products (Table 3). In addition to the higher percentage of positive samples, the mean levels of AFB1 and total AFs in apricot kernel derived products were 7–9 times higher the levels found in almonds and almond-derived products. From these data, it can be concluded that the risk of aflatoxin contamination seems to be higher for apricot kernel derived products as compared to almond-derived products. The occurrence of aflatoxins in apricot kernels and derived products was poorly investigated in the past, as demonstrated by the limited number of papers in the scientific literature [30,31].
Table 3. Occurrence of aflatoxins in commercial products containing almonds and/or apricot kernels and commercially available in Italy.
Commercial Product% of Almonds or Apricot KernelsOriginAFB1 (µg/kg)Total AFs (µg/kg)
Almonds100%Italy0.060.06
Almonds100%California, USn.d.n.d.
Almonds100%Italy bn.d.n.d.
Almonds100%Italyn.d.n.d.
Almonds100%Italy bn.d.n.d.
Almonds100%Italyn.d.n.d.
Peeled almonds100%Italy0.060.07
Peeled almonds100%California, US0.060.06
Peeled almonds100%Italy b0.060.06
Peeled almonds100%Italy0.060.06
Peeled almonds100%California, USn.d.n.d.
Almond flour100%Italy0.060.06
Chopped almonds100%Italy b0.060.06
Bakery product (4% almonds) a100%Italy b0.060.16
Bakery product (4% almonds) a100%Italy bn.d.n.d.
Bakery product (3% chopped peeled almonds) a100%Italy bn.d.n.d.
Bakery product (3% almonds) a100%Italy bn.d.n.d.
Bakery product (3% peeled almonds) a100%Italy bn.d.n.d.
Bakery product (4% peeled almonds) a100%Italy bn.d.n.d.
Bakery pastries7% AlmondsItaly bn.d.n.d.
Mixed nuts snack (almonds, peanuts, sultana grapes, cranberry)25% AlmondsCalifornia, USn.d.n.d.
Salt roasted almonds with EVO oil100%Italy0.110.33
Salt roasted almonds100%Italy bn.d.n.d.
Smoked almonds100%Italy bn.d.n.d.
Sugared almonds100%Italyn.d.n.d.
Almonds soft nougat50% AlmondsItaly bn.d.n.d.
Almonds nougat45% AlmondsItaly bn.d.n.d.
Almonds soft nougat40% AlmondsItaly bn.d.n.d.
Almonds nougat36% AlmondsItaly bn.d.n.d.
Almonds soft nougat30% AlmondsItaly bn.d.n.d.
Cantucci22% AlmondsItaly b0.060.07
Cantucci22% AlmondsItaly b0.060.06
Cantucci22% AlmondsItaly bn.d.n.d.
Cantucci20% AlmondsItaly bn.d.n.d.
Cantucci19% AlmondsItaly bn.d.n.d.
Mean of positive samples--0.070.11
Amaretti38% Apricot kernels, 4% Almonds, 4% PistachiosItaly b1.301.79
Amaretti40% Apricot kernels, 5% AlmondsItaly b1.501.56
Amaretti20% Apricot kernelsItaly b0.550.99
Amaretti20% Apricot kernelsItaly b0.530.56
Amaretti19% Apricot kernelsItaly b0.400.41
Amaretti16% Apricot kernels, Sweet and bitter almondsItaly b0.080.30
Amaretti20% Apricot kernelsItaly b0.060.06
Amaretti20% Apricot kernelsItaly bn.d.n.d.
Mean of positive samples--0.630.81
n.d. = not detected; a relative percentage of almonds in the whole product; b manufacturing country.

3. Experimental Section

3.1. Samples

Apricot kernels. Samples of apricot kernels (20 kg) originating from Turkey were provided by a local importer (Bari, Italy) and used for electronic and manual color sorting experiments.
Commercial products. Forty-seven commercial products containing apricot kernels and/or almonds were analysed for aflatoxins content (AFB1, AFB2, AFG1, and AFG2). In particular, seven samples of almonds, six samples of peeled almonds, two samples of roasted almonds, one sample of bakery pastries, five samples of Cantucci pastries, eight samples of amaretti mini biscuits, seven bakery products containing peeled almonds (four) or almonds (three); six samples of almond nougat, and five other products (almond flour, chopped almonds, smoked almonds, sugared almonds praline, and mixed nuts snack). The seven bakery products (“panettone” and “colomba”) containing embedded whole almonds were crumbled to pick up the almonds that were analyzed separately. Each sample was finely ground by blending and analysed for aflatoxins.

3.2. Electronic Color Sorting of Apricot Kernels

The e-sorting experiments were performed in triplicate by using an optical sorter machine (Bühler Z+) (Bühler, Brescia, Italy). In particular, 15 kg of apricot kernels naturally contaminated with aflatoxins were manually mixed and divided in 3 × 5 kg aliquots that were singularly submitted to e-sorting. For each of the three aliquots the machine separated the kernels in two fractions called “final” and “reject”. Final and reject fractions of the 3 × 5 kg aliquots were singularly collected, weighted, slurried, or homogenized and analyzed for their aflatoxin content. With this approach, the initial aflatoxin concentration of the 15 kg of kernels was deduced from the results of the analysis of the whole “final” and “reject” fractions. Fractions weighting ≥4 kg were slurried (1:1.5 with water) using the slurry mixer Silverson (Silverson Machines Ltd., Waterside, Chesham, UK), whereas the fractions that could not be slurried, because of low amount (<1 kg), were homogenized by blending (DitoSama, Model F23200, Aubusson, France).

3.3. Blanching, Peeling, and Manual Sorting of Apricot Kernels

Steam blanching was carried out in a steamer (model HD 9140, Philips Electronics, Eindhoven, The Netherlands) for 40 min on 3 × 500 g of apricot kernels naturally contaminated with aflatoxins. After steam blanching, apricot kernels were manually peeled to separate peeled kernels from skins. Peeled kernels were further manually sorted to separate discolored kernels (brown/dark and spotted ones) from healthy ones. Samples of skins and peeled kernels (discolored and healthy) were separately freeze-dried, weighed, homogenized, and analyzed for their aflatoxin content for a total of nine samples. Each sample was analyzed in triplicate for a total of 27 analyses. The analytical method for aflatoxin determination is describe below.

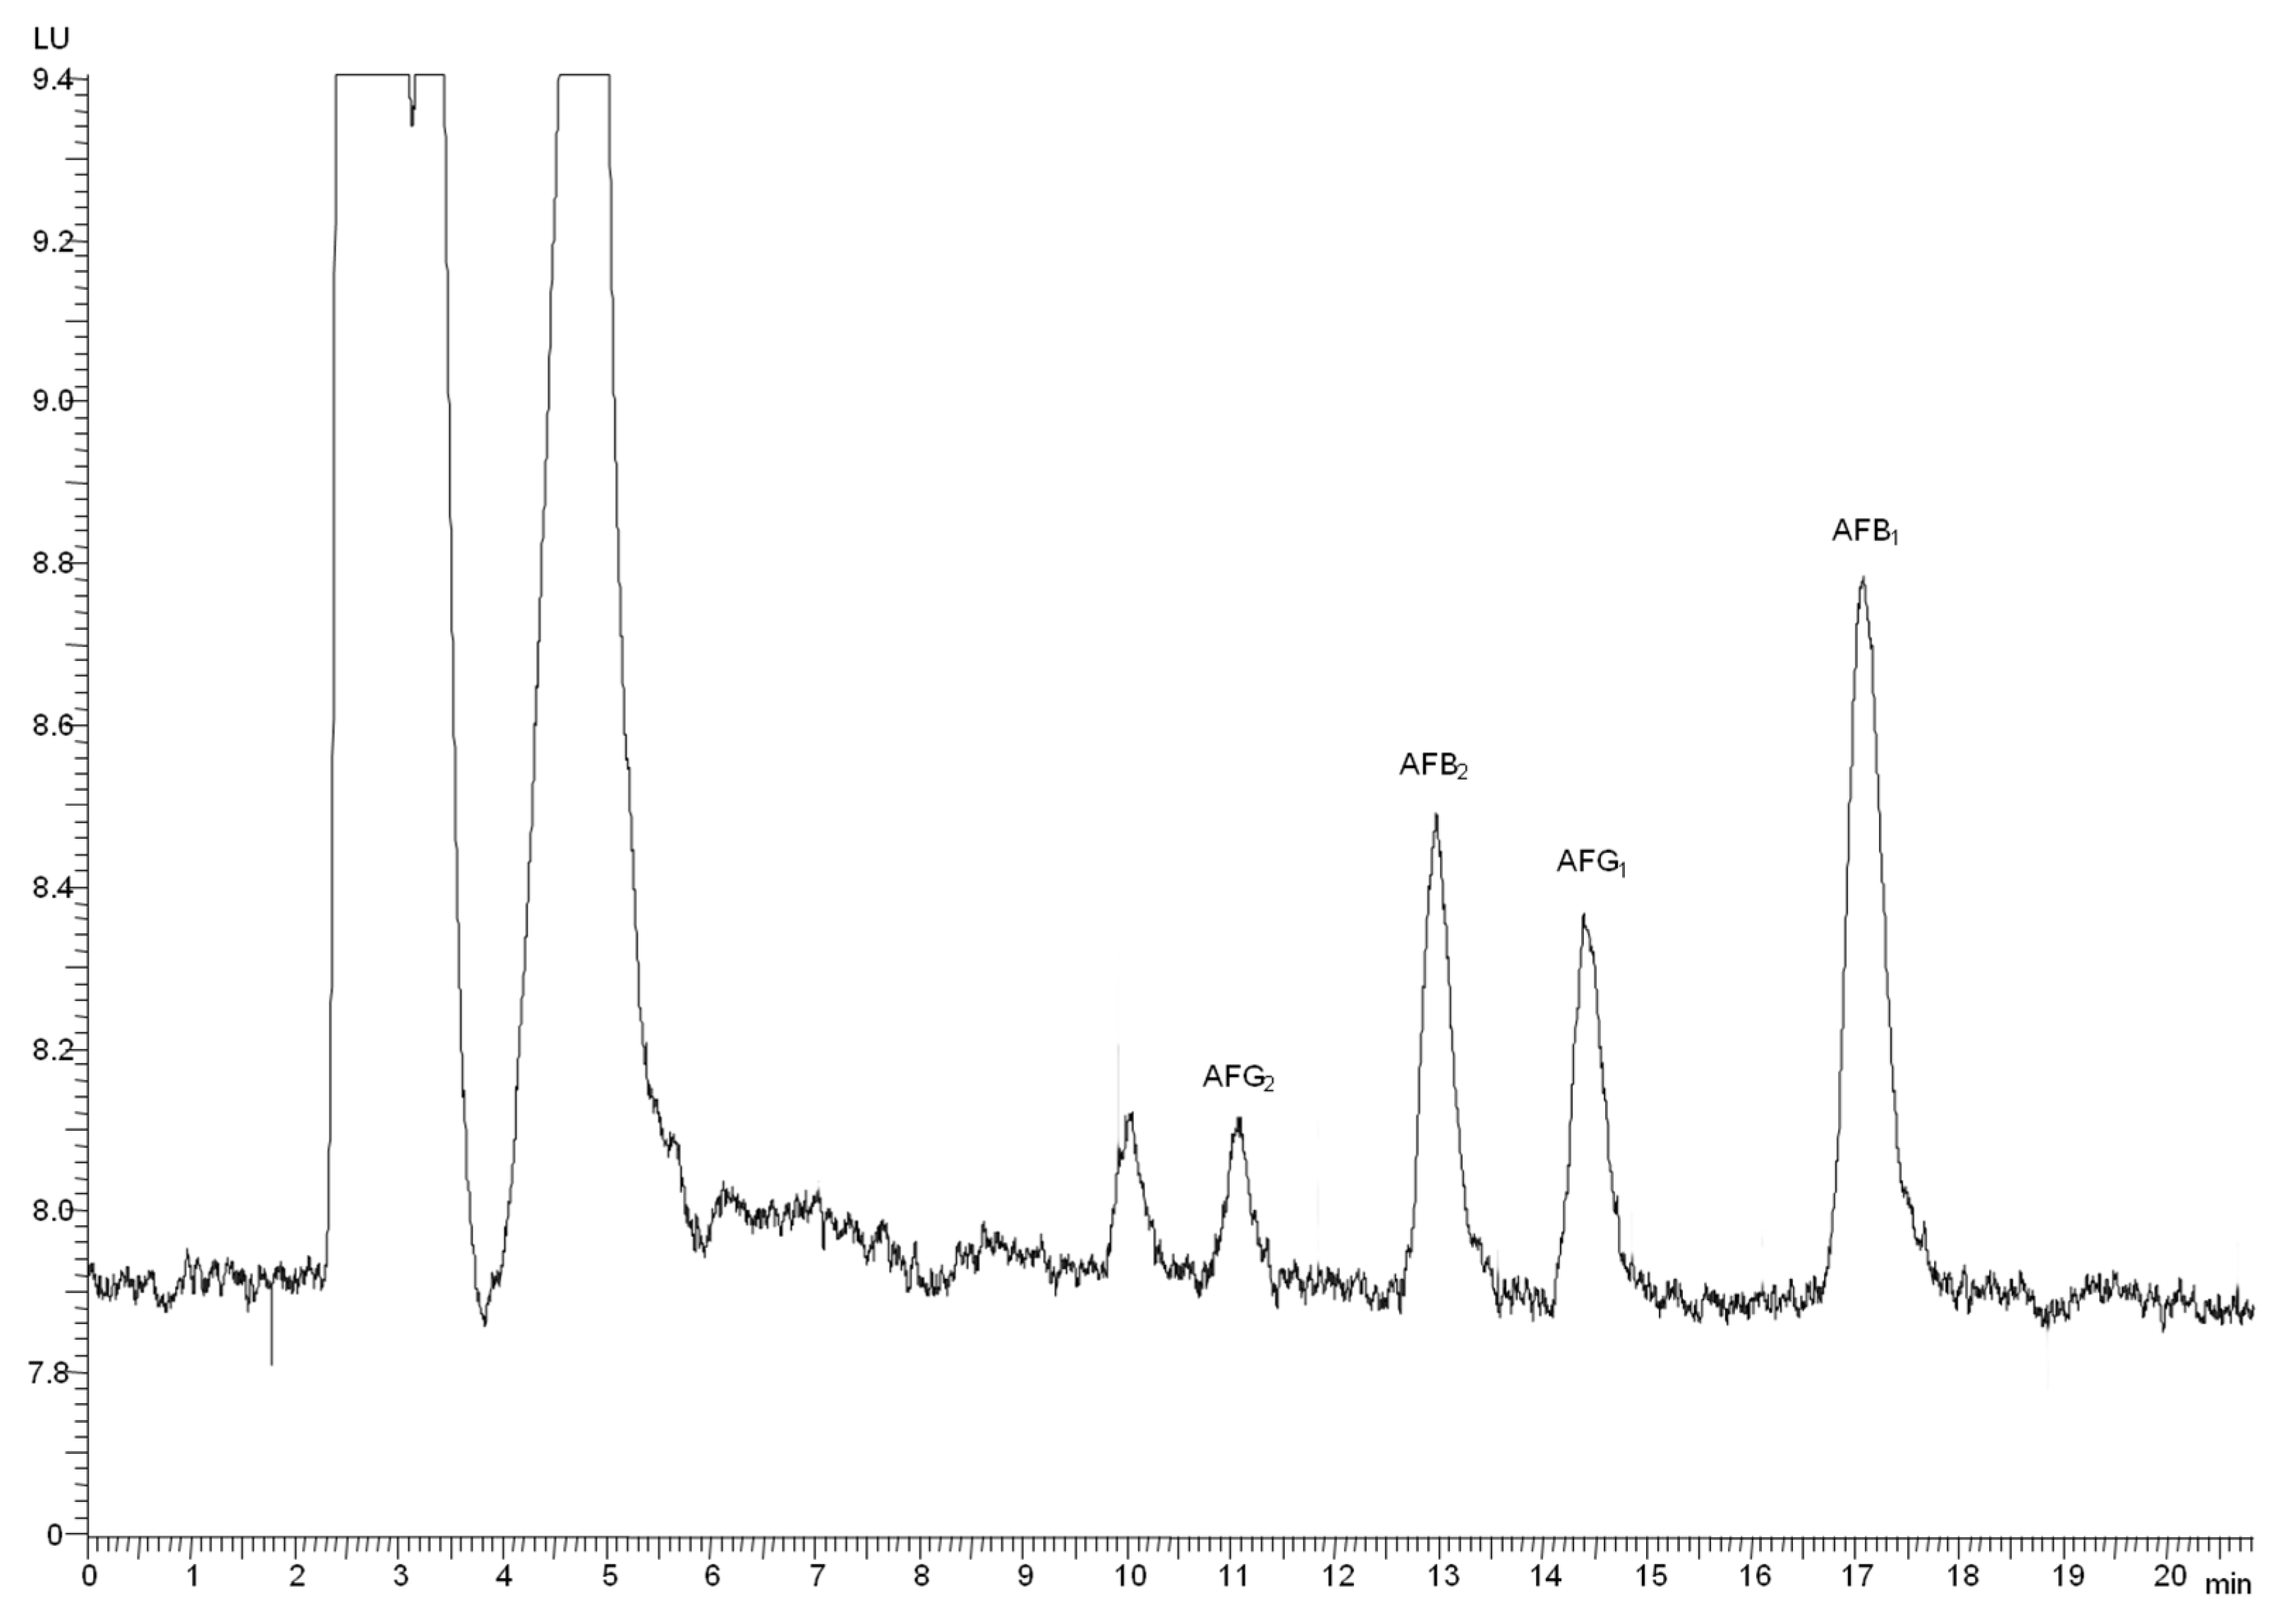
3.4. Determination of AFB1, AFB2, AFG1 and AFG2

The HPLC-FLD method previously described [28] was used herein with some changes depending of the nature of samples analysed.
Aflatoxin determination in samples of apricot kernels and skins derived from e-sorting and manual sorting. Aflatoxins were extracted from 10 g of dry sample by sonication for 30 min with 100 mL of acetone:water (85:15 v/v) in 250 mL Pyrex screw-capped glass flasks. Extracts were filtered on filter paper (No. 4, Whatman, Maidstone, UK) and 5 mL of filtered extract were diluted with 75 mL of ultrapure water and filtered through glass microfilter (GF/A, Whatman, Maidstone, UK). A 40 mL volume of filtered diluted extract (equivalent to 0.25 g of matrix) was passed through the immunoaffinity column (IAC) AflaTest (Vicam, Milford, MA, USA) at the flow rate of 1–2 drops/second. Then the column was washed with 2 × 10 mL of ultrapure water that was discarded. Aflatoxins were eluted from the column by passing 3 × 0.5 mL of methanol. The eluates were collected and diluted with ultrapure water up to 5 mL in a volumetric flask. Volume of 100–500 μL (equivalent to 5–25 mg of matrix) were injected in the HPLC-FLD apparatus.
Aflatoxin determination in discolored apricot kernels. These samples were supposed to contain high levels of aflatoxins therefore, the sample extracts were diluted and directly analysed by HPLC-FLD without using the immunoaffinity clean-up. In particular, 10 g were extracted with acetone:water (85:15 v/v), and 0.5 mL of the filtered extract was diluted with 30 mL of MeCN:H2O (30:70 v/v), vortexed, filtered through a 0.45 μm PTFE filter (Sartorius Stedim Italy SpA, Bagno a Ripoli, Firenze, Italy) and injected into the HPLC apparatus (the injection volume was 100 μL equivalent to 1.7 mg of matrix).
Analysis of commercial products. To obtain low limits of detection the method was modified to get a more concentrated final extracts for HPLC analysis. Briefly, 10 g of dry ground sample was weighted in a 250 mL Pyrex screw-capped glass flask and extracted by sonication for 30 min with 50 mL of extraction mixture of acetone:water (85:15 v/v). After filtration on filter paper (No. 4, Whatman, Maidstone, UK) 10 mL of filtered extract were diluted with 140 mL of ultrapure water and filtered with a GF/A glass microfiber (Whatman, Maidstone, UK). The immunoaffinity clean-up was performed by passing 113 mL of filtered diluted extract (equivalent to 1.5 g of matrix) through the IAC column at the flow rate of 1–2 drops/min. After washing the IAC column with 2 × 10 mL of ultrapure water, aflatoxins were eluted with 0.75 mL methanol, and after 1 min eluted again with 0.5 mL methanol. The collected eluates were diluted with ultrapure water up to 5 mL in a volumetric flask and analyzed by HPLC-FLD. Injection volumes were 100–500 μL equivalent to 30–150 mg of matrix.

3.5. Chemicals and Reagents

Methanol (MeOH), acetonitrile (MeCN) and acetone were purchased from Sigma Aldrich (Milan, Italy). Ultrapure water was produced with a Milli-Q system (Millipore, Bedford, MA, USA). AflaTest WB wide bore affinity columns were purchased from Vicam L.P. (Watertown, MA, USA). The mixed aflatoxins standard solution (purity 99% ± 1%), prepared in acetonitrile and containing 2.00 µg/mL AFB1, 2.02 µg/mL AFG1, 0.50 µg/mL AFB2 and 0.50 µg/mL AFG2, was purchased from Romer Labs Diagnostic (Tulln, Austria). This solution was used to prepare calibration solutions for HPLC-FLD determinations and recovery experiments.

3.6. HPLC-FLD Apparatus and Conditions

The HPLC analyses of aflatoxins were performed by using a mixture of acetonitrile: water (30:70) as mobile phase. A Perkin Elmer Series 200 binary pump was used at a flow rate of 0.8 mL/min (the run time was 20 min). Sample extracts were injected into the HPLC apparatus via a Rheodyne 7125 manual injection valve equipped with a 500 μL sample loop. The apparatus was equipped with a chromatographic data handling software for Microsoft Windows XP (PerkinElmer TotalChrom Workstation version 6.3.1) (Perkin Elmer, Waltham, MA, USA). The separation of aflatoxins was obtained with a Luna® analytical column PFP (2) (pentafluorophenyl propyl), 150 × 4.6 mm i.d., 3 μm, 100 Å (Phenomenex, Torrance, CA, USA), preceded by a security guard cartridge (4 × 3 mm, 5 μm) (Phenomenex). Aflatoxin detection was carried out using a Jasco FP-2020 plus fluorescence detector set at 365 nm (λex) and 435 nm (λem). A photochemical post-column derivatisation (UVE™ system, LCTech, Dorfen, Germany) was used to enhance the fluorescence of AFB1 and AFG1.

3.7. Calibration Curves

A mixed aflatoxins stock solution was prepared by diluting 500 μL of commercial standard solution (2 µg/mL AFB1 and AFG1, 0.5 µg/mL AFB2 and AFG2) to 10 mL with acetonitrile in a volumetric flask. The five HPLC calibration solutions of combined aflatoxins (AFB1 + AFB2 + AFG1 + AFG2) were prepared by diluting appropriate volumes of the stock solution with MeOH:H2O (40:60 v/v). The toxin concentration ranges of the five calibration solutions were 0.10–3.64 ng/mL for AFB1 and AFG1, 0.025–0.90 ng/mL for AFB2 and AFG2.

3.8. Recovery Experiments

The performances of the improved HPLC/FLD method were assessed by performing recovery and repeatability experiments. Blank samples of almonds, peeled almonds, amaretti, cantucci, and almond nougat were spiked with mixtures of the four aflatoxins and analyzed in triplicate. Two spiking levels of aflatoxins were tested (0.2 μg/kg and 1 μg/kg for AFB1; 0.5 μg/kg and 2.5 μg/kg for total AFs). In particular, for recovery experiments at spiking levels of 0.2 μg/kg of AFB1 and 0.5 μg/kg for total AFs, 3 × 10 g of samples were spiked with 3 × 20 µL of the spiking solution. For experiments at spiking levels of 1 μg/kg of AFB1 and 2.5 μg/kg of total AFs, 3 × 100 μL of the same spiking solution were added to 3 × 10 g of samples. Spiked samples were left overnight in the dark at room temperature to allow solvent evaporation. The values of LOD and LOQ were calculated as signal-to-noise ratio of three and six, respectively.

3.9. Statistical Analysis

Mean and standard deviation (SD) of data were calculated with a SigmaPlot for Windows version 12.0 statistical software package (Sistat, Software, Inc., Chicago, IL, USA). SigmaPlot was also used to perform one-way analysis of variance (ANOVA) followed by a Tukey pairwise multiple comparison test, and a least significant difference (LSD) test at 95% confidence levels (p = 0.05) to identify significant differences among groups.

4. Conclusions

This study, conducted with naturally contaminated apricot kernels, has demonstrated for the first time that the combination of peeling and visual/manual separation of discolored kernels is a feasible strategy to remove up to 99% of aflatoxins in this food commodity. Therefore, the existing sorting machines should be used to segregate peeled apricot kernels instead of unpeeled kernels.
The occurrence of aflatoxins in almond and apricot kernel derived products commercially available in Italy has been demonstrated for 38% of tested samples. However, the measured levels of aflatoxins in positive samples were all below the maximum limits established by EU regulation for these products. This is the first study that has analysed pastries containing apricot kernels (amaretti) and has demonstrated that almost all tested products were contaminated at levels 7–9 times higher than those found in almond based products.

Acknowledgments

This research was supported by EU-FP 7 project MYCORED (KBBE-2007-222690).

Author Contributions

R.Z. and M.S. conceived and designed the study; R.Z., L.G. and L.P. collected samples and performed the HPLC analyses; M.S. coordinated the study; R.Z. and M.S. wrote the text.

Conflicts of Interest

The authors declare no conflict of interest.

References

  1. Food and Agriculture Organization of the United Nations Statistics Division. Available online: http://faostat3.fao.org/browse/Q/QC/ (accessed on 28 December 2015).
  2. Tuncel, G.; Nout, M.J.R.; Brimec, L. Degradation of cyanogenic glycosides of bitter apricot seeds (Prunus armeniaca) by endogenous and added enzymes as affected by heat treatments and particle size. Food Chem. 1998, 63, 65–69. [Google Scholar] [CrossRef]
  3. Haciseferogullari, H.; Gezer, I.; Ozcan, M.M.; Murat Asma, B. Post harvest and physical-mechanical properties of some apricot varieties cultivated in Turkey. J. Food Eng. 2007, 79, 364–373. [Google Scholar] [CrossRef]
  4. Gezer, I.; Haciseferogullari, H.; Demir, F. Some physical properties of Hacıhaliloglu apricot pit and its kernel. J. Food Eng. 2002, 56, 49–57. [Google Scholar] [CrossRef]
  5. Femenia, A.; Rossellò, C.; Mulet, A.; Cañellas, J. Chemical composition of bitter and sweet apricot kernels. J. Agric. Food Chem. 1995, 43, 356–361. [Google Scholar] [CrossRef]
  6. Hallabo, S.A.S.; El-Wakeil, F.A.; Morsi, M.; Khairy, S. Chemical and physical properties of apricot kernel oil and almond kernel oil. Egypt. J. Food Sci. 1975, 3, 1–5. [Google Scholar]
  7. Durmaz, G.; Alpaslan, M. Antioxidant properties of roasted apricot (Prunus armeniaca L.) kernels. Food Chem. 2007, 63, 1177–1181. [Google Scholar] [CrossRef]
  8. Haase, I.; Brüning, P.; Matissek, R.; Fisher, M. Real-Time PCR Assays for the Quantification of rDNA from Apricot and other plant species in Marzipan. J. Agric. Food Chem. 2013, 61, 3414–3418. [Google Scholar] [CrossRef] [PubMed]
  9. RASFF (Rapid Alert System for Food and Feed). RASFF Portal. Available online: https://webgate.ec.europa.eu/rasff-window/portal/index.cfm?event=searchForm&cleanSearch=1 (accessed on 28 December 2015).
  10. EFSA (European Food Safety Authority). Opinion of The Scientific Panel on Contaminants in the Food Chain on a Request from the Commission Related to the Potential Increase of Consumer Health Risk by a Possible Increase of the Existing Maximum Levels for Aflatoxins in Almonds, Hazelnuts and Pistachios Derived Products; EFSA: Parma, Italy, 2007; pp. 1–127. [Google Scholar]
  11. European Commission. Commission Regulation (EC) No. 1881/2006 of 19 December 2006 setting maximum levels for certain contaminants in foodstuffs. Off. J. Eur. Union 2006, L364, 5–24. [Google Scholar]
  12. European Commission. Commission Regulation (EC) No. 165/2010 of 26 February 2010 amending Regulation (EC) No. 1881/2006 setting maximum levels for certain contaminants in foodstuffs. Off. J. Eur. Union 2010, L50, 8–11. [Google Scholar]
  13. Codex Standard 193–1995. Codex general Standard for Contaminants and Toxins in Food and Feed. Available online: http://www.codexalimentarius.net/download/standards/17/CXS_193e.pdf (accessed on 28 December 2015).
  14. Whitaker, T.B. Efficiency of the blanching and electronic colour sorting process for reducing aflatoxin in raw shelled peanuts. Peanut Sci. 1997, 24, 62–66. [Google Scholar] [CrossRef]
  15. Schatzki, T.; Pan, J. Distribution of aflatoxins in pistachios. 3. Distribution in pistachios process streams. J. Agric. Food Chem. 1996, 44, 1076–1084. [Google Scholar] [CrossRef]
  16. Stainer, W.E.; Brunschweiler, K.; Leimbacher, E.; Schneider, R. Aflatoxins and fluorescence in Brazil nuts and pistachio Nut. J. Agric. Food Chem. 1992, 40, 2453–2457. [Google Scholar] [CrossRef]
  17. Shade, J.E.; McGreevy, K.; King, A.D., Jr.; Mackey, B.; Fuller, G. Incidence of aflatoxin in California Almonds. Appl. Microbiol. 1975, 29, 48–53. [Google Scholar]
  18. Dorner, J.W. Management and prevention of mycotoxins in peanuts. Food Addit. Contam. 2008, 25, 203–208. [Google Scholar] [CrossRef] [PubMed]
  19. Gloria, E.M. Aflatoxin Contamination Distribution Among Grains and Nuts, Aflatoxins—Detection, Measurement and Control; Torres-Pacheco, I., Ed.; University of Sao Paulo: Sao Paulo, Brazil, 2011; pp. 75–90. [Google Scholar]
  20. Whitaker, T.B.; Slate, A.; Birmingham, T.; Adams, J.; Jacobs, M.; Grary, G. Correlation between aflatoxin contamination and various USDA grade categories of shelled almonds. Food Addit. Contam. 2010, 93, 943–947. [Google Scholar]
  21. Whitaker, T.B.; Dorner, J.V.; Lamb, M.; Slate, A.B. The effect of sorting farmers’ stock peanuts by size and colour on partitioning aflatoxin into various shelled peanut grade sizes. Peanut Sci. 2005, 32, 103–118. [Google Scholar] [CrossRef]
  22. Campbell, B.C.; Molyneux, R.J.; Schatzki, T.F. Current research on reducing pre- and post-harvest aflatoxin contamination of U.S. almond, pistachio, and walnut. J. Toxicol. Toxin Rev. 2003, 22, 225–266. [Google Scholar] [CrossRef]
  23. De Mello, F.R.; Scussel, V.M. Characteristic of in-shell Brazil nuts and their relationship to aflatoxin contamination: Criteria for sorting. J. Agric. Food Chem. 2007, 55, 9305–9310. [Google Scholar] [CrossRef] [PubMed]
  24. Calderari, T.O.; Iamanaka, B.T.; Frisvad, J.C.; Pitt, J.I.; Sartori, D.; Pereira, J.L.; Fungaro, M.H.P.; Taniwaki, M.H. The biodiversity of Aspergillus section Flavi in brazil nuts: From rainforest to consumers. Int. J. Food Microbiol. 2013, 160, 267–272. [Google Scholar] [CrossRef] [PubMed]
  25. European Commission. Commission Regulation (EC) No. 401/2006 of 23 February 2006 laying down the methods of sampling and analysis for the official control of the levels of mycotoxins in foodstuffs. Off. J. Eur. Union 2010, L70, 12–34. [Google Scholar]
  26. Shakerardekani, A.; Karim, R.; Mirdamadiha, F. The effect of sorting on aflatoxin reduction on pistachio nuts. J. Food Agric. Environ. 2012, 11, 459–461. [Google Scholar] [CrossRef]
  27. Cole, R.J.; Dorner, J.W.; Holbrook, C.C. Advances in mycotoxin elimination and resistance. In Advantage in Peanut Science; Pattee, H.E., Stalker, H.T., Eds.; American Peanut research Educational Society: Stillwater, OK, USA, 1995; pp. 456–474. [Google Scholar]
  28. Zivoli, R.; Gambacorta, L.; Perrone, G.; Solfrizzo, M. Effect of almond processing on levels and distribution of aflatoxins in finished products and by-products. J. Agric. Food Chem. 2014, 62, 5707–5715. [Google Scholar] [CrossRef] [PubMed]
  29. Kabak, B.; Dobson, A.D.V.; Var, I. Strategies to prevent Mycotoxin contamination of food and animal feed: A review. Crit. Rev. Food Sci. 2006, 46, 593–619. [Google Scholar] [CrossRef] [PubMed]
  30. Imperato, R.; Campone, L.; Piccinelli, A.L.; Veneziano, A.; Rastrelli, L. Survey of aflatoxins and ochatoxin A contamination food products imported in Italy. Food Control 2011, 22, 1905–1910. [Google Scholar] [CrossRef]
  31. Luttfullah, G.; Hussain, A. Studies on contamination level of aflatoxins in some dried fruits and nuts of Pakistan. Food Control 2011, 22, 426–429. [Google Scholar] [CrossRef]

