Article

The Possible Mechanisms Involved in Degradation of Patulin by Pichia caribbica

School of Food and Biological Engineering, Jiangsu University, 301 Xuefu Road, Zhenjiang 212013, Jiangsu, China
*
Author to whom correspondence should be addressed.
Submission received: 7 September 2016 / Revised: 29 September 2016 / Accepted: 30 September 2016 / Published: 9 October 2016

Abstract

:
In this work, we examined the mechanisms involved in the degradation of patulin by Pichia caribbica. Our results indicate that cell-free filtrate of P. caribbica reduced patutlin content. The heat-killed cells could not degrade patulin. However, the live cells significantly reduced the concentration of the patulin. In furtherance to this, it was observed that patulin was not detected in the broken yeast cells and cell wall. The addition of cycloheximide to the P. caribbica cells decreased the capacity of degradation of patulin. Proteomics analyses revealed that patulin treatment resulted in an upregulated protein which was involved in metabolism and stress response processes. Our results suggested that the mechanism of degradation of patulin by P. caribbica was not absorption; the presence of patulin can induce P. caribbica to produce associated intracellular and extracellular enzymes, both of which have the ability to degrade patulin. The result provides a new possible method that used the enzymes produced by yeast to detoxify patulin in food and feed.

Graphical Abstract

1. Introduction

Phytosanitation is critical in food safety in the globalized agribusiness, where fresh fruits have been considered as promising natural food. The Food and Agricultural Organization (FAO) estimated that 25% of the world’s crops are contaminated with mycotoxins, and Aspergillus, Penicillium, and Fusarium genera were incriminated [1,2,3]. Patulin (4-hydroxy-4H-furo [3,2c] pyran, 2[6H]-one) one of these mycotoxins is an unsaturated heterocyclic lactone produced by certain fungi species (Penicillium, Aspergillus, and Byssochlamys). Patulin is the most common mycotoxin found in apples and its derived products [4]. Penicillium expansum is the most common fungus that causes blue mold and patulin contamination in stored apples [5]. Patulin was first isolated from Aspergillus clavatus and studied in the early 1940s [6,7]. Patulin contamination is a world-wide problem including, Portugal [8,9], Belgium [10], India [11], Northeast China [12]. Patulin has been demonstrated to induce oxidative stress and causes DNA strands to break in HepG2 cells. Oxidative damage in human cells can lead to mutagenic [13], carcinogenic [14], immunotoxic [15], neurotoxic [16], genotoxic, and teratogenic [17,18] effects.
Traditionally, to control blue mold and patulin contamination in apples, synthetic fungicides are usually relied upon. However, the development of fungicide resistance by pathogens and the public’s concern over the presence of chemical residues in food have prompted an urgent need for alternative control with good efficacy, and little or no toxicity to the non-target organisms [19]. In recent years, biological control using antagonistic yeasts has emerged as a promising method to reduce synthetic fungicides [20]. In view of this, many researches have shown that some antagonist yeasts could directly inhibit the production of patulin. Through almost 30 years of research, dozens of yeasts, including Pichia caribbica [21], Rhodotorula glutinis [22], Pichia ohmeri [23], Rhodosporidium kratochvilovae [24], Gluconobacter oxydans [25], and several others have been shown to degrade patulin, and inhibited the growth of P. expansum. Coelho et al. [26] reported that patulin concentration of 223 µg was decreased over 83% by P. ohmeri 158 cells when incubated at 25 °C for two days at a humidity >99. Also, R. glutinis and Cryptococcus laurentii degraded patulin in vivo and significantly reduced the accumulation of patulin in apples [22]. Zhu et al. [27] reported that the yeast Rhodosporidium paludigenum reduced the patulin content in apples.
However, the mechanism(s) of action of yeasts is/are insufficient and remain poorly understood. A study by Coelho, Celli, Ono, Wosiacki, Hoffmann, Pagnocca, and Hirooka [26] showed that antagonistic yeast cells incubated with PAT decreased its contamination through two mechanisms: (1) PAT adsorption at the yeast cell wall, and (2) PAT absorption into yeast cells. Zhu et al. [28] pointed out that, when dead and live cells of Rhodosporidium paludigenum were incubated with patulin for three days, 51% of the patulin was absorbed by the dead cells while no patulin was detected in the viable yeast cells.
Genome-wide analysis of the model yeast Saccharomyces cerevisiae exposed to patulin indicated that there were upregulated genes which showed proteasome activity, metabolism of sulfur amino acids, and stress responses [29]. Ianiri et al. [30] reported that patulin was degraded by Sporobolomyces sp. strain IAM 13481 and two kinds of mesostate were produced. To determine the genes responsible for the degradation, 3000 mutants were instructed by T-DNA insertion, and some were proven to be sensitive to patulin. The genes which include YCK2, PAC2, DAL5, and VPS8 were annotated to Saccharomyces cerevisiae. Ianiri et al. [31] described a transcriptomic approach based on RNAseq to study the changes of gene expression in Sporobolomyces sp. exposed to patulin. In their study, the upregulated Sporobolomyces genes were those involved in metabolic processes, oxidation-reduction, and transport processes. The patulin decreased the expression of genes involved in the processes of protein synthesis, modification, cell division, and cell cycle. The results provide a comprehensive analysis to identify potential mechanisms and enzymes that are involved in patulin degradation. However, there were no genes and enzymes found to be responsible for the patulin degradation.
In vitro test indicated that P. caribbica can degrade patulin directly [21]. However, the mechanism of degradation of patulin by the P. caribbica is unknown. Therefore, in the present study, we investigated the possible mechanisms involved in degradation of patulin by Pichia caribbica and provided a comprehensive analysis of the genes and enzymes that are involved in patulin degradation.

2. Results

2.1. Effect of Cell-Free Filtrate of P. caribbica on Patulin Degradation

The findings revealed that the cell-free filtrate of P. caribbica reduced the patulin concentration compared to the control (CK) during all the tested time, Figure 1. This demonstrates that that the cell-free filtrate significantly affected the patulin content. The patulin content was reduced from 18.8 μg/mL at 0 h to 11.4 μg/mL at 12 h after incubation, however, after 12 h the degradation declined steadily throughout the entire duration.

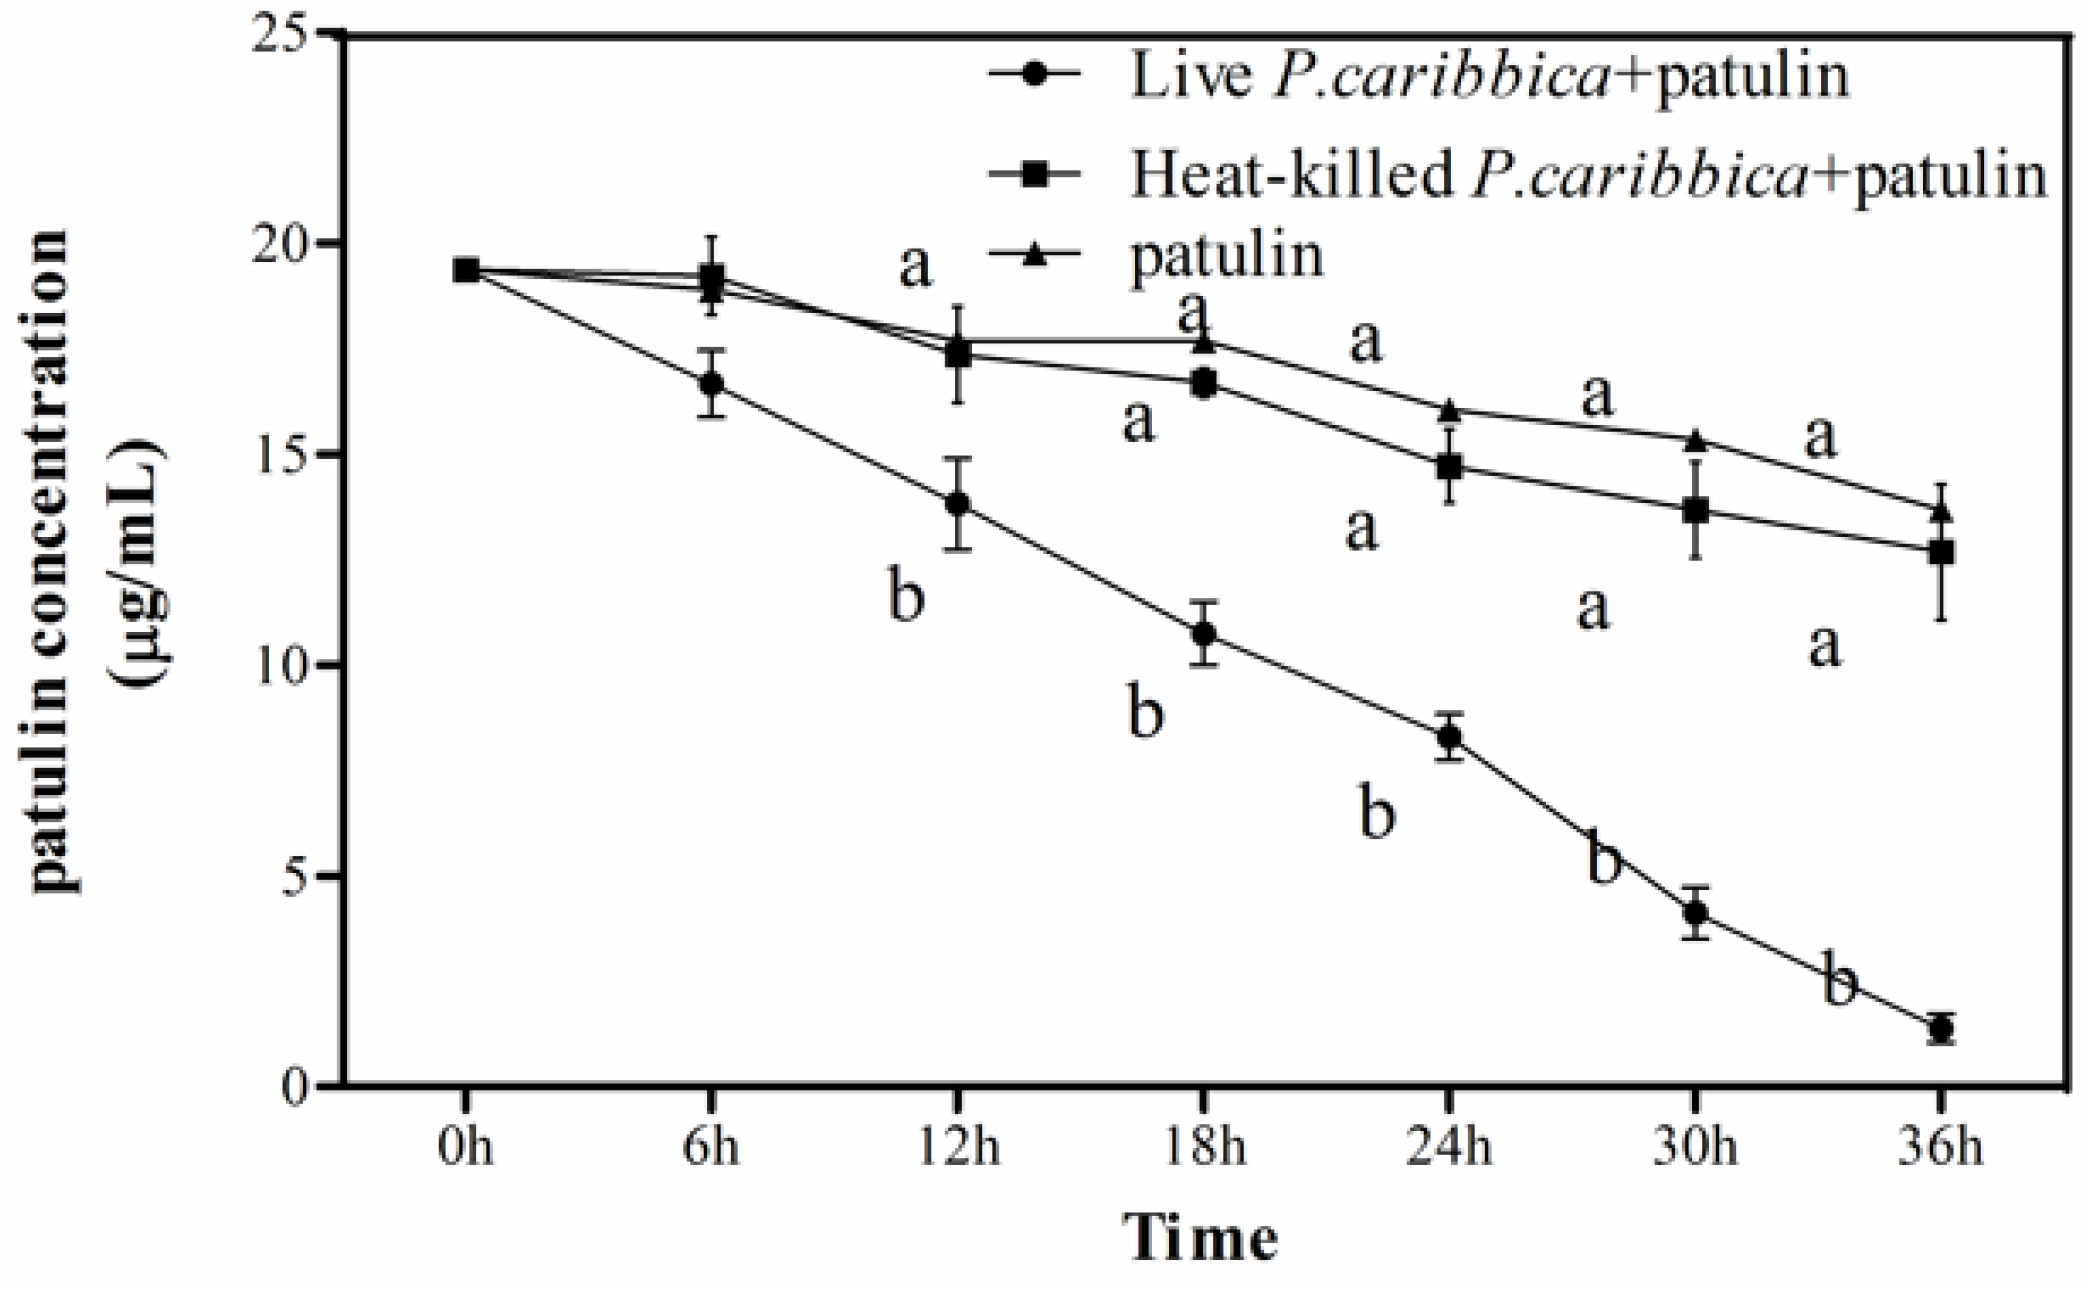
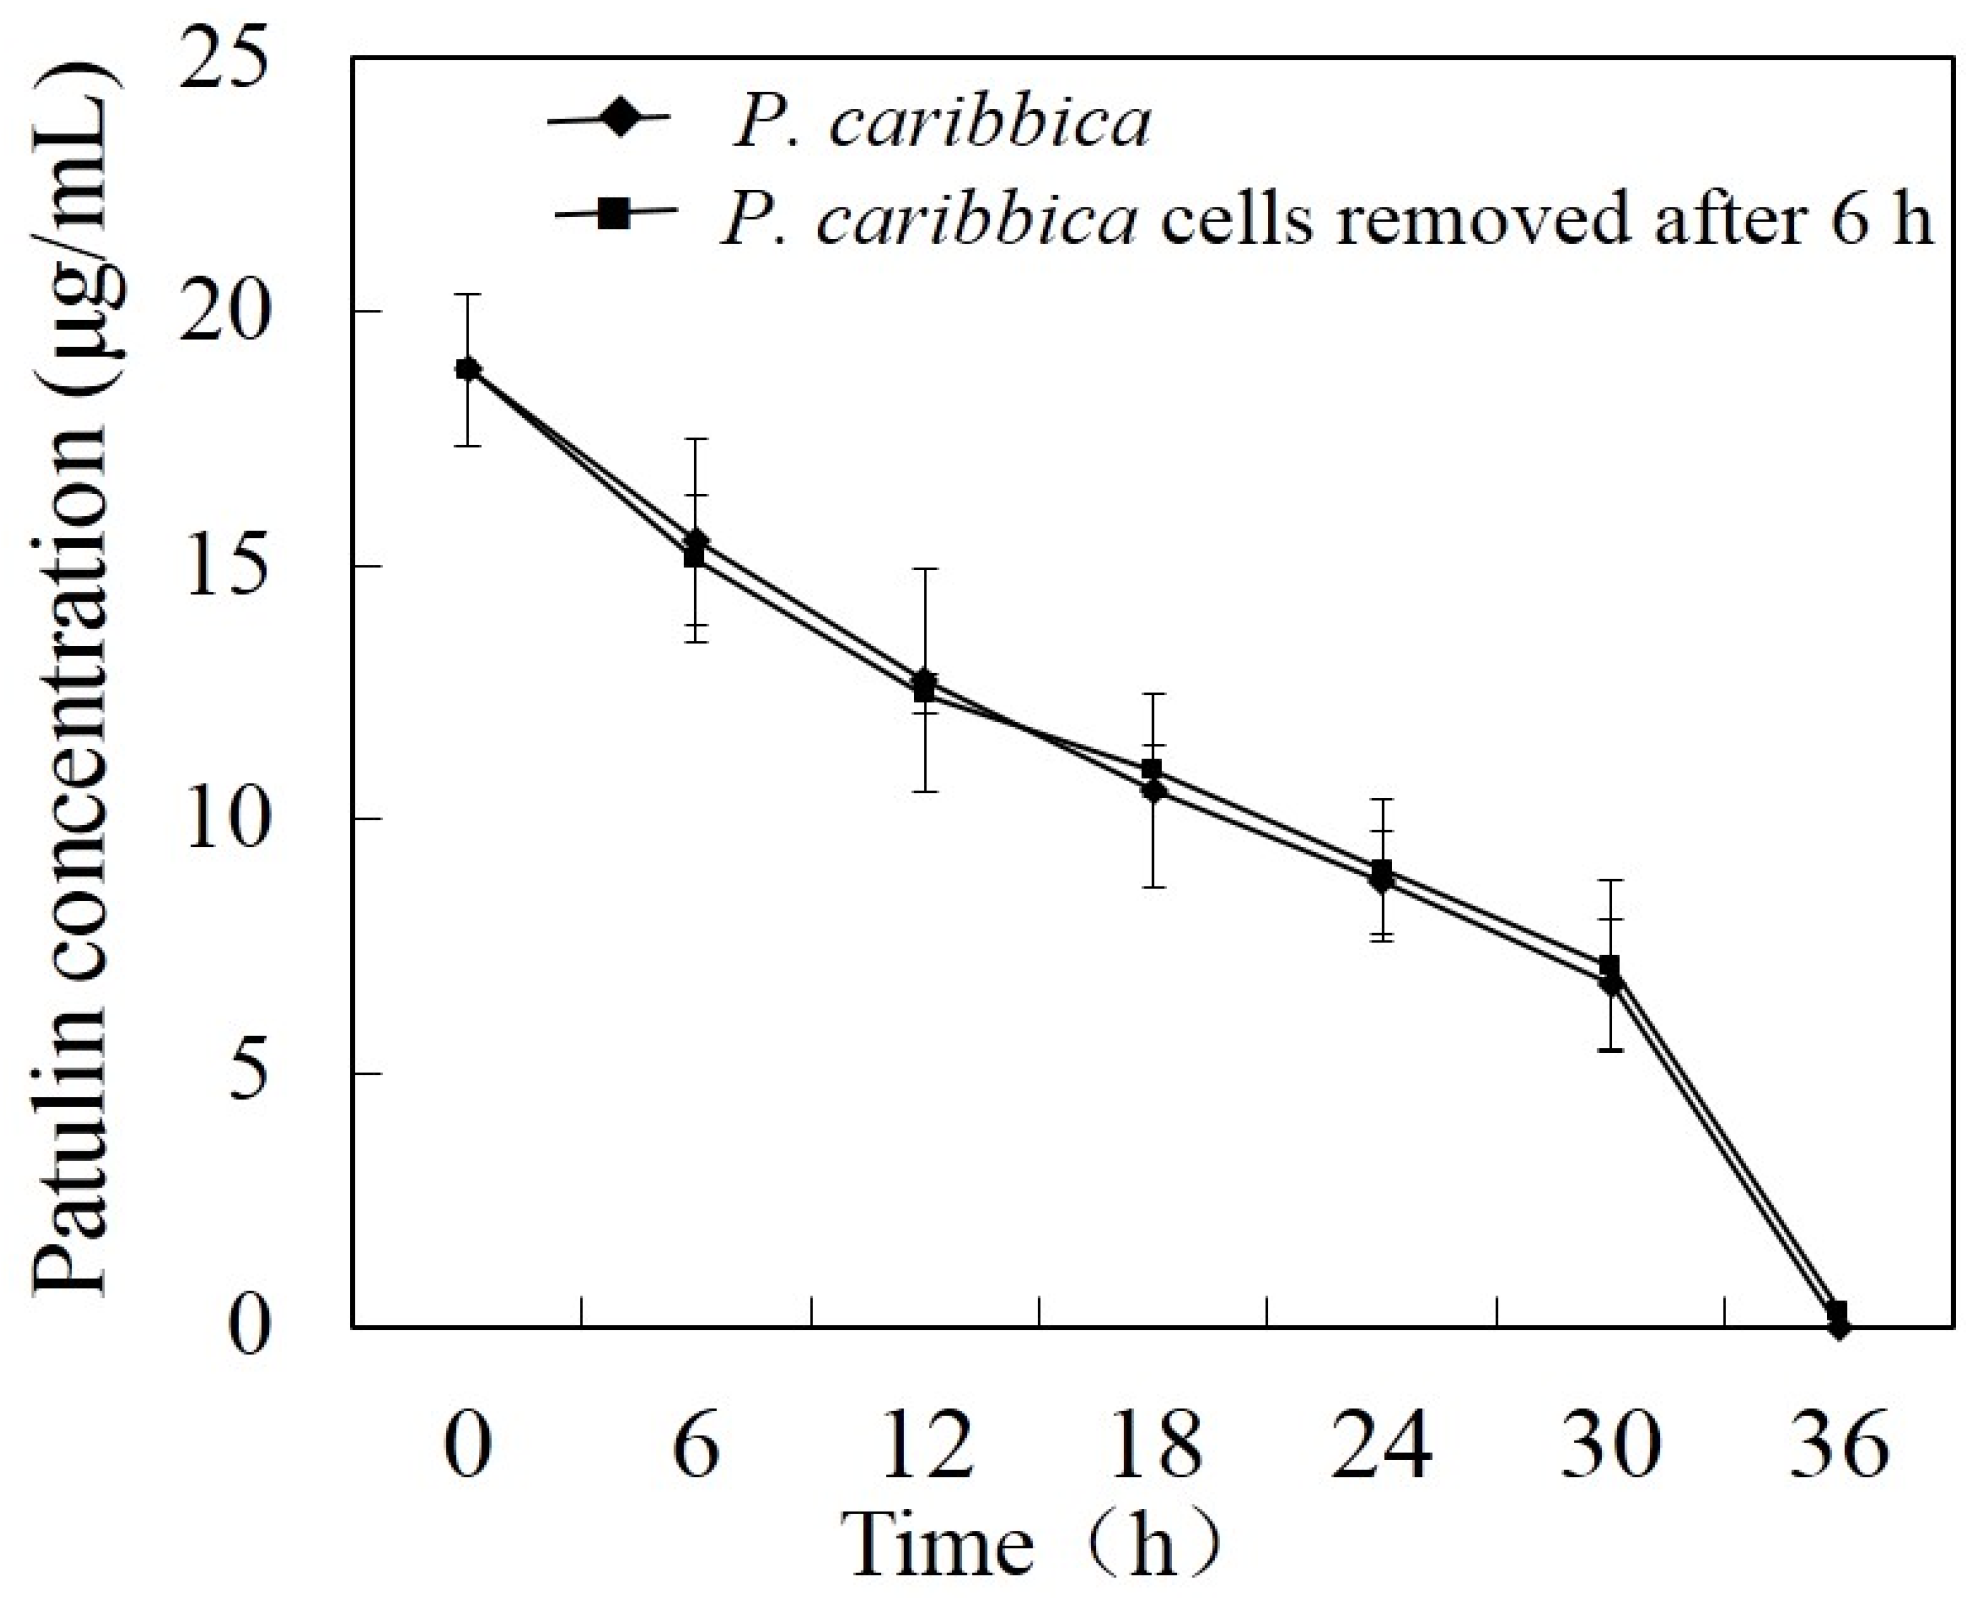
2.2. Effect of Viable and Heat-Killed P. caribbica Cells on Patulin Degradation

The assay demonstrated that compared to the control, the dead yeast cells could not degrade the patulin, while the live yeast cells significantly reduced the patulin level throughout the 36 h inoculation period, Figure 2. The live P. caribbica cells decreased the patulin concentration to 1.4 μg/mL at 36 h of incubation. However, the patulin concentration of the control and the heat-killed cells were 13.7 μg/mL and 12.7 μg/mL at 36 h after incubation, respectively.

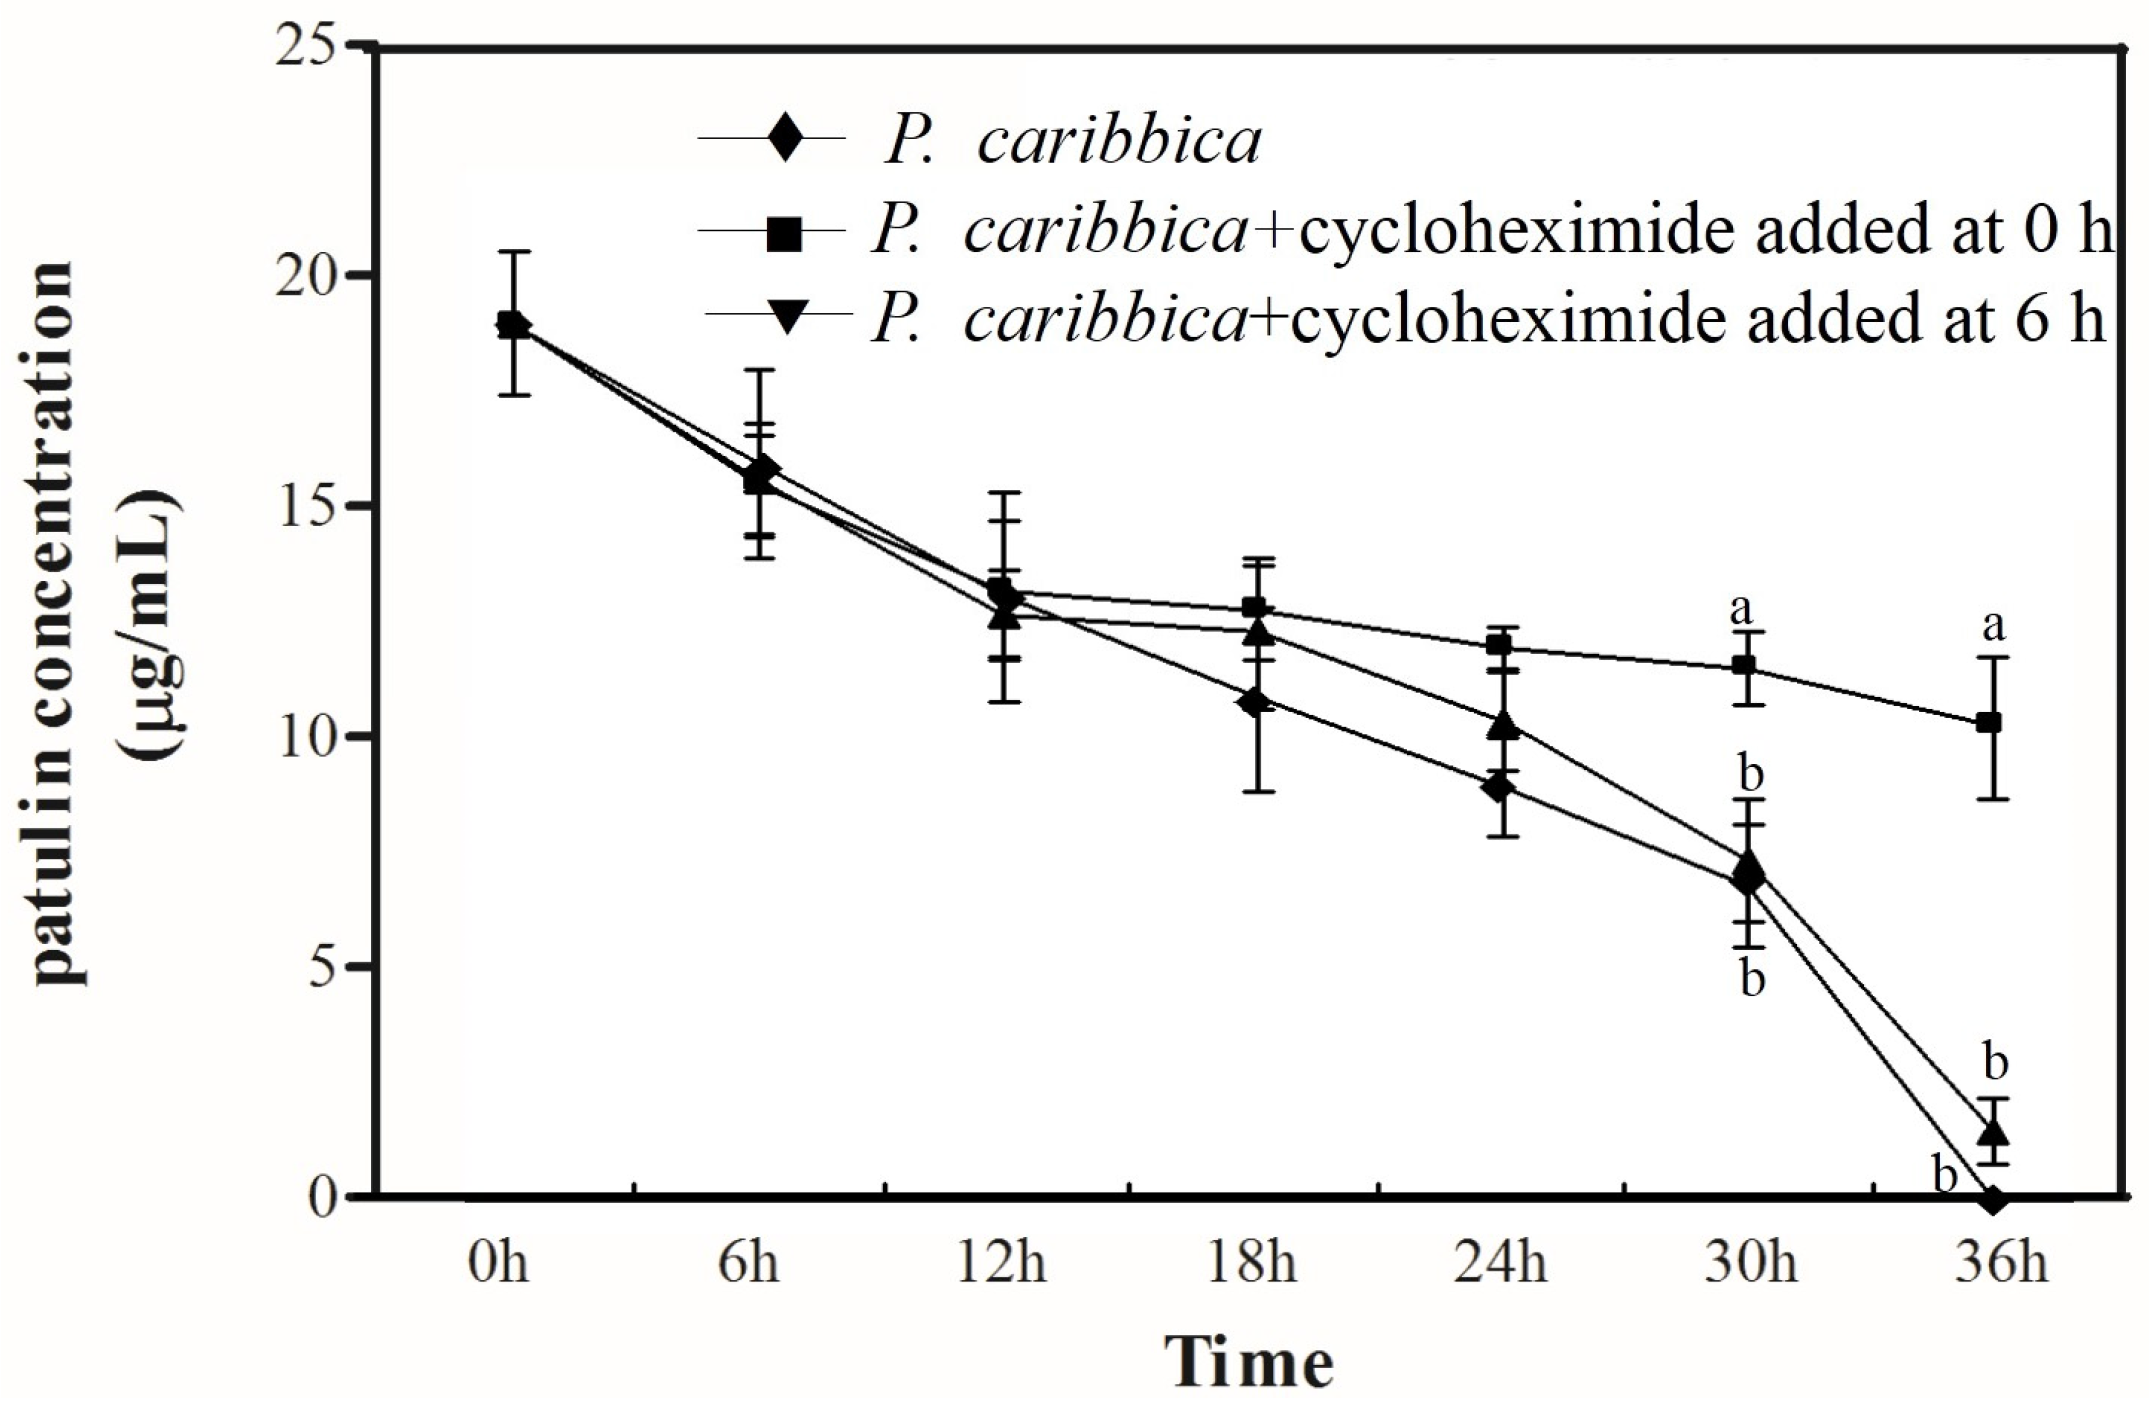
2.3. Degradation of Patulin by P. caribbica Was Inhibited by Cycloheximide

The results on the treatment without cycloheximide (P. caribbica alone) decreased the patulin level completely after 36 h of incubation, Figure 3. However, the cycloheximide that was added to the patulin at the beginning of the experiment decreased slightly and declined steadily. The patulin content in which the cycloheximide was added at after 6 h of incubation followed a similar trend with that of the control.

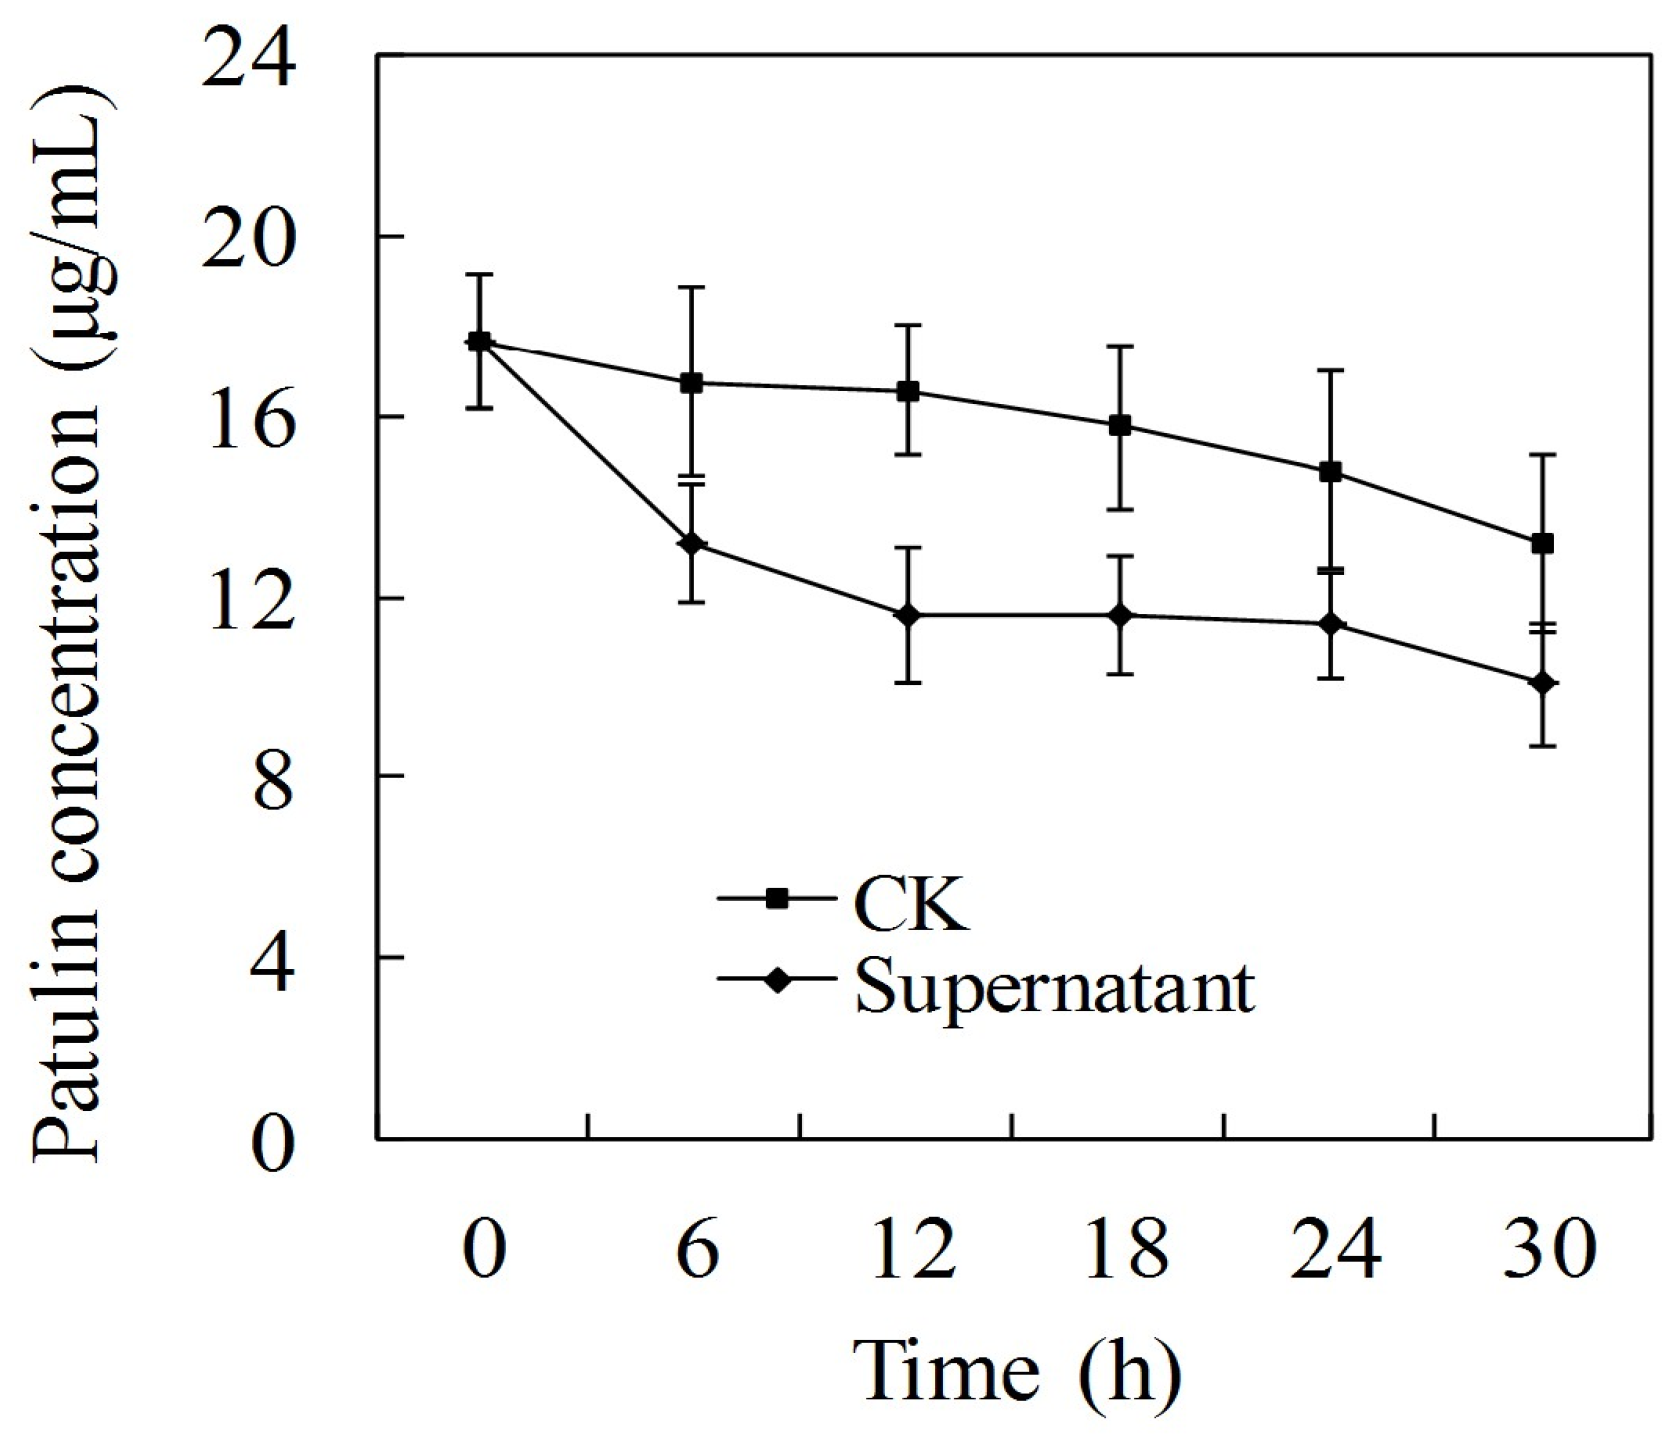
2.4. Effect of P. caribbica’s Supernatant on Patulin Degradation

The supernatant of P. caribbica significantly reduced the patulin content, regardless of whether the yeast cells were filtered after 6 h or not, Figure 4. The supernatant without yeast cells had no effect on patulin degradation. Henceforth, no significant difference was observed between the two treatments.

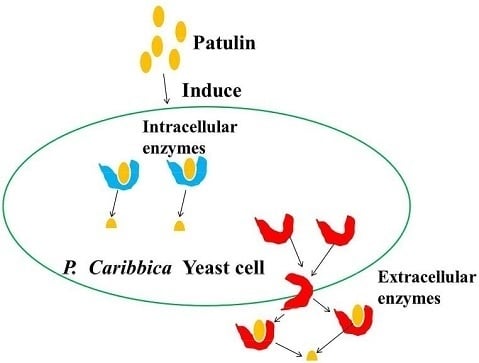
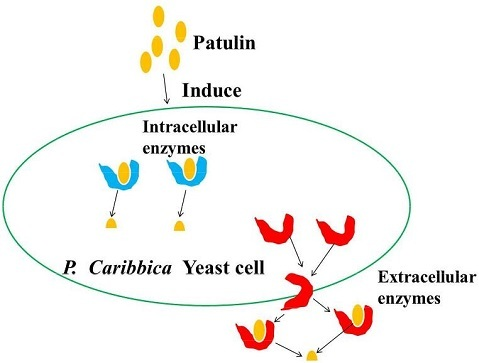
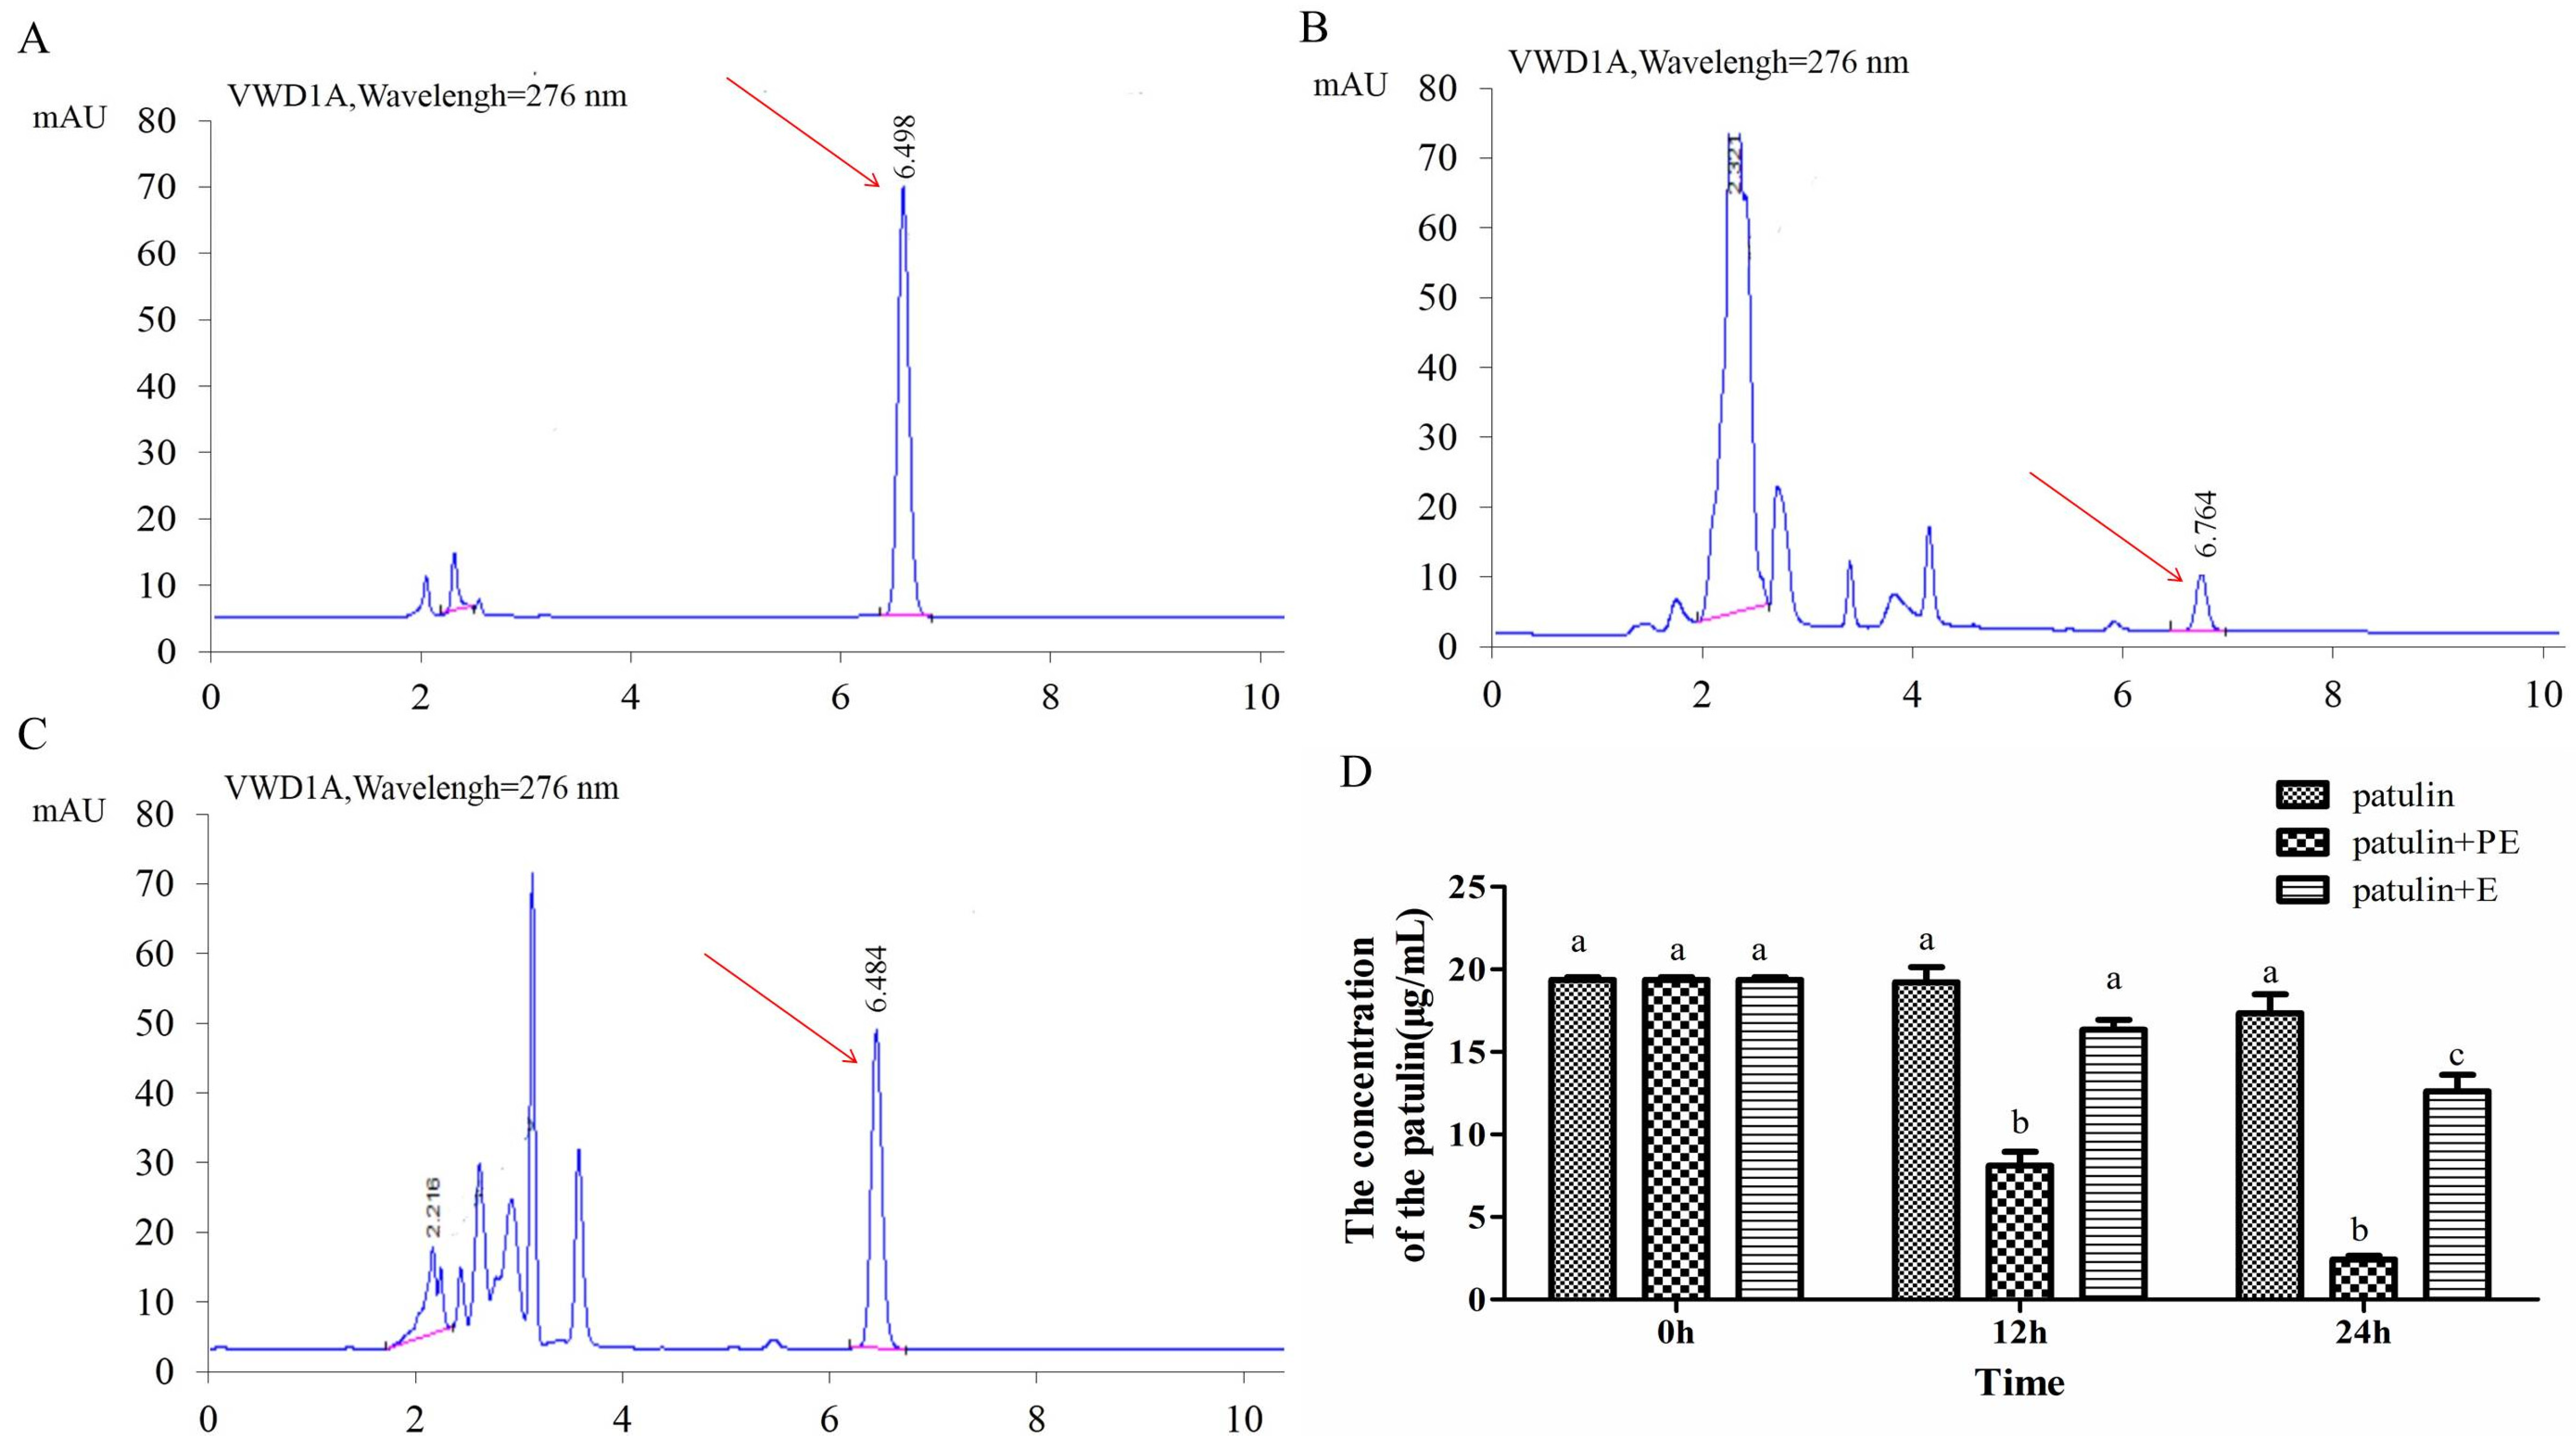
2.5. Effect of Intracellular Enzymes of P. caribbica on Patulin Degradation

The results on the intracellular enzymes demonstrates that the intracellular enzymes obtained from the P. caribbica that were incubated in the NYDB did not exhibit degradation effect. The patulin content remained at a high level of 8.3 μg/mL at 24 h after incubation, Figure 5C,D. However, the intracellular enzymes from P. caribbica incubated in the NYDB and amended with the patulin degraded the patulin to 0.25 μg/mL at 24 h after incubation, Figure 5B,D.

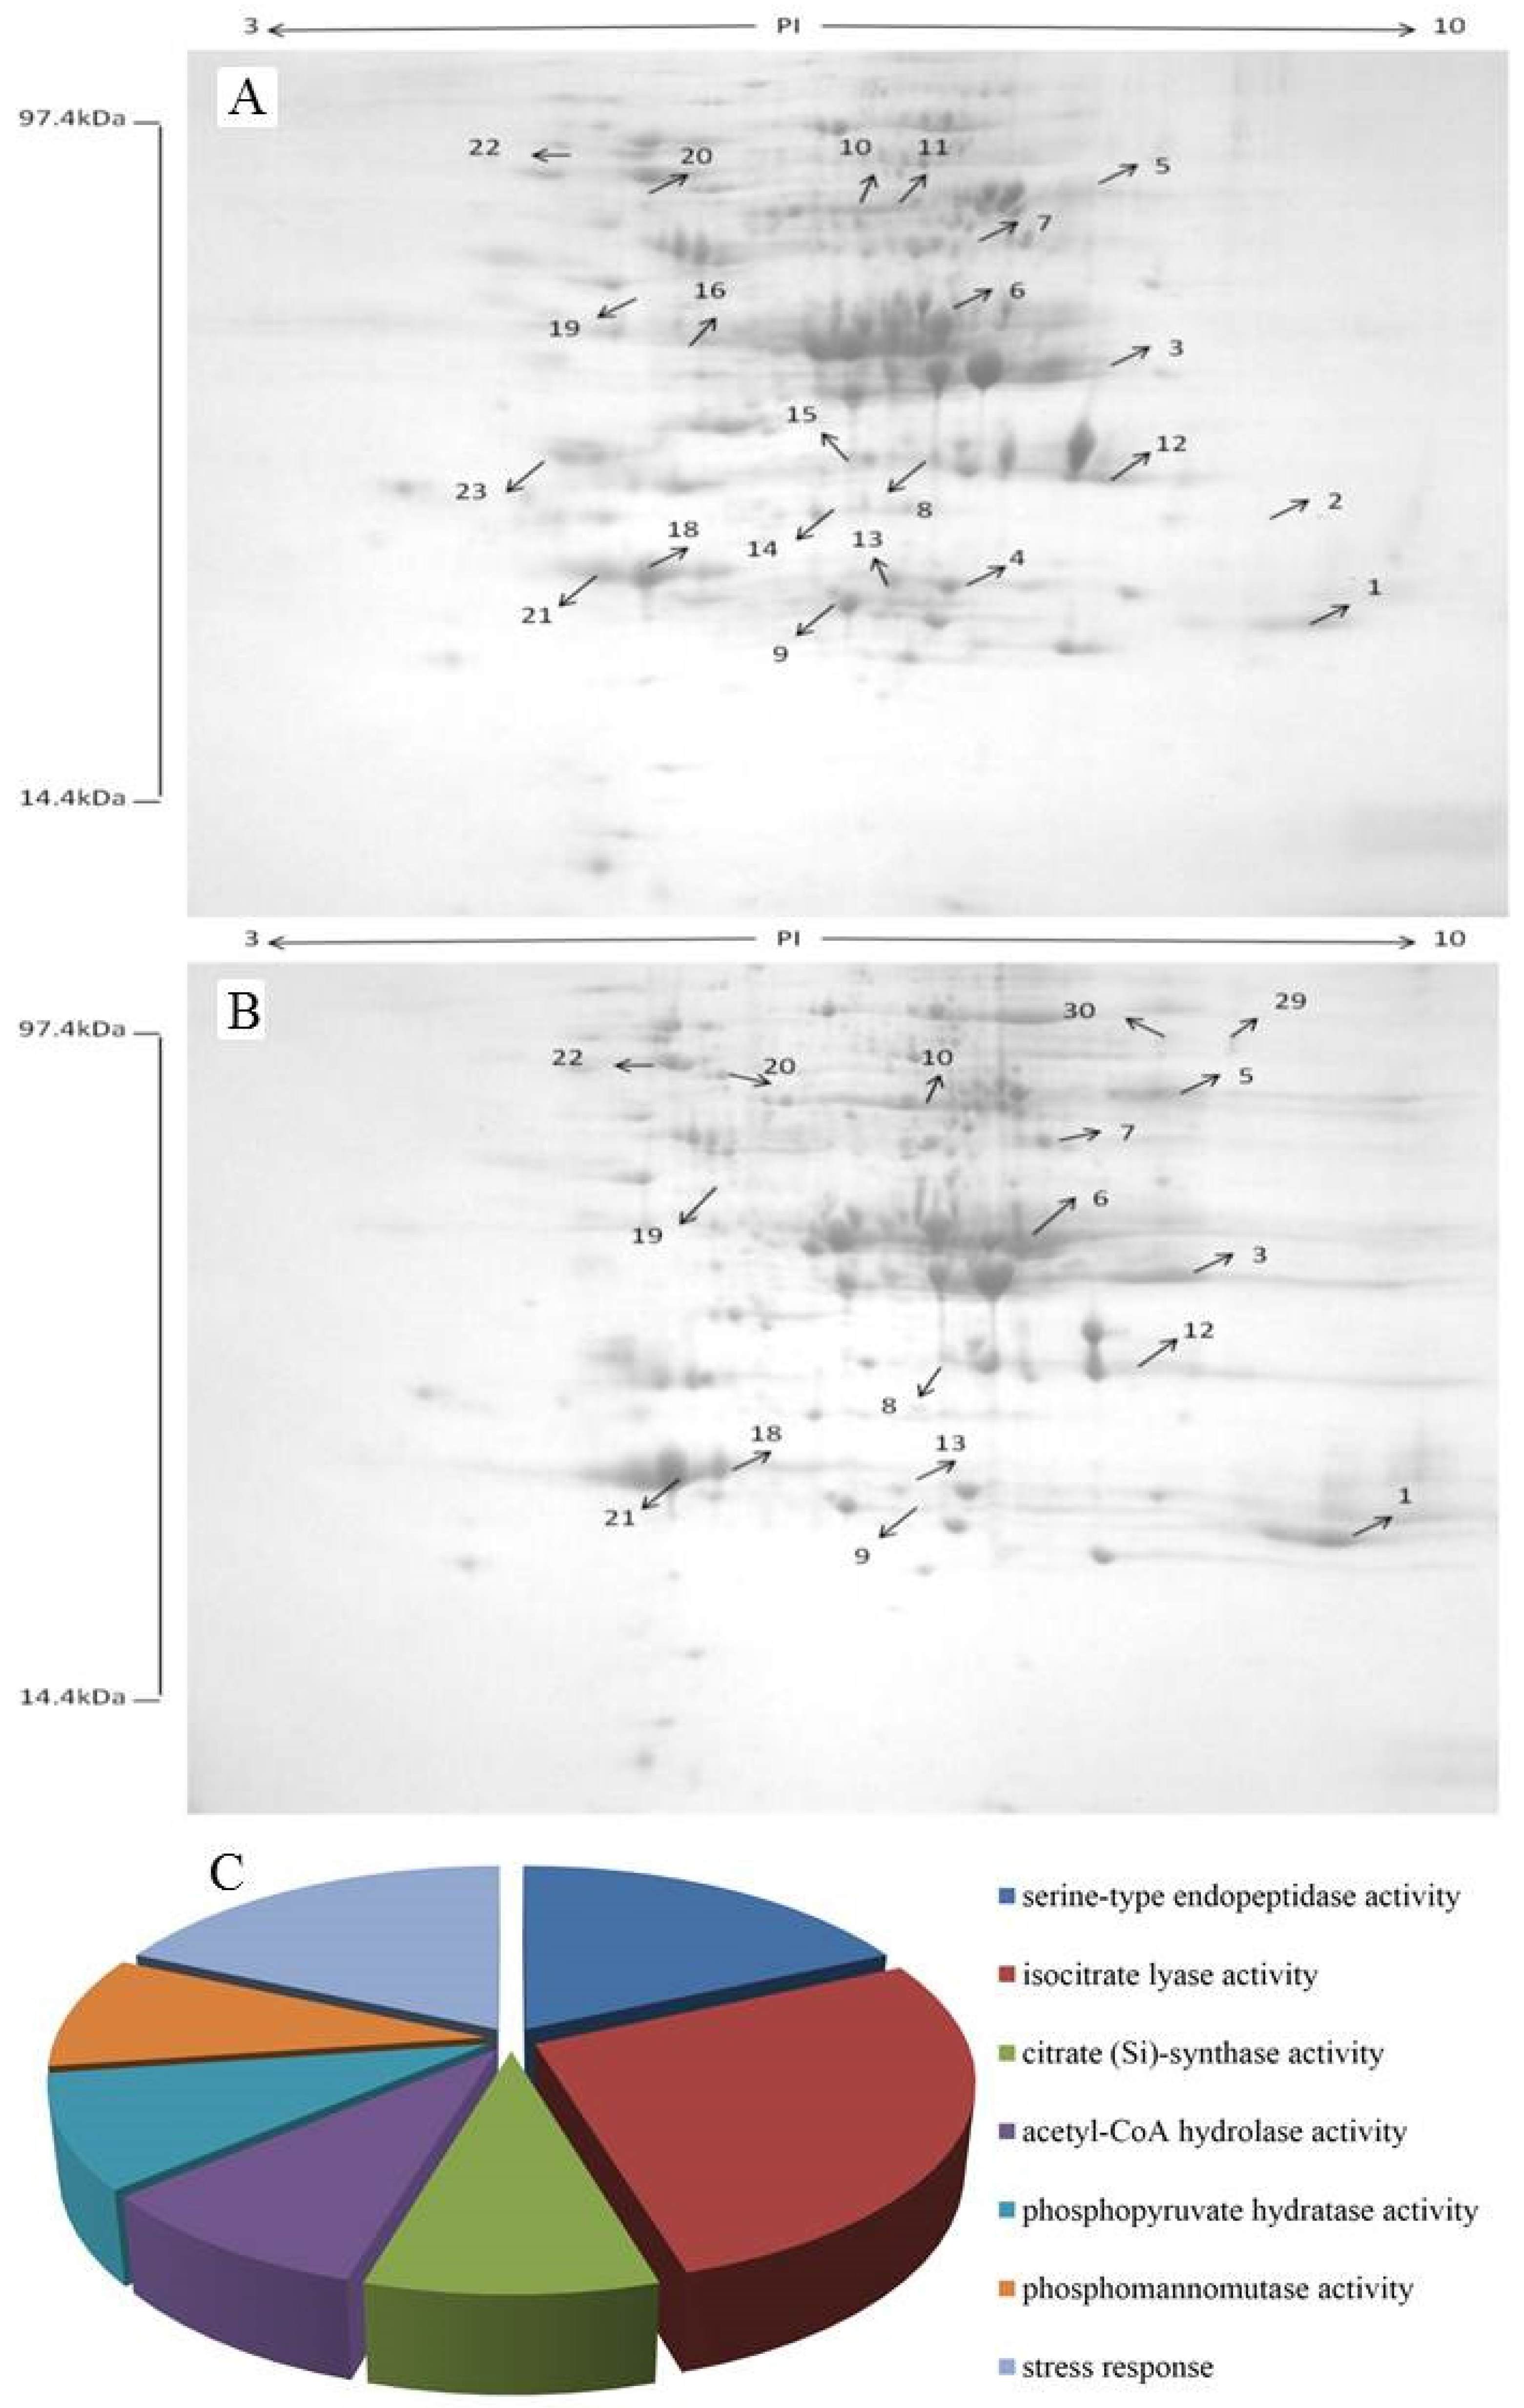
2.6. Identification of Differentially Expressed Proteins

Proteins were identified by means of peptide mass fingerprints (PMF). MASCOT was used to search protein database of Viridiplantae. More than 150 protein spots were detected in each gel after ignoring very faint spots and spots with undefined shapes and areas using Image Master 2D Elite software, Figure 6A. Protein was extracted from P. caribbica, harvested at 24 h after incubation in NYDB, Figure 6A, and NYDB amended with patulin, Figure 6B. A total of 53 differentially expressed proteins were identified from the P. caribbica harvested from the NYDB amended with patulin. Out of the 53 proteins, 18 proteins were upregulated and 35 proteins were downregulated. Our test focused on 27 of them, Table 1. The differentially expressed proteins were classified with GO analysis, Figure 6C. Most of the differentially expressed proteins were related to basic metabolism such as isocitrate lyase activity, citrate (Si)-synthase activity, acetyl-CoA hydrolase activity, phosphomannomutase activity, and phosphopyruvate hydratase activity, Figure 6C. This indicated that the basic metabolism of P. caribbica was activated by patulin. The responses of P. caribbica to patulin are complex, as the differentially expressed proteins were involved in multiple metabolic pathways. Heat-shock protein 70 and Heat-shock protein SSB1 under the category of stress response may be related to the yeast cell’s stress response to the patulin, Figure 6C.

3. Discussion

Patulin is a worldwide food mycotoxin which is present in a variety of fruit products. In recent years, attempts have been made to reduce the mycotoxin content in fruits and their derived products [32]. In view of this, biodegradation of mycotoxins has taken center stage for many researchers. Some antagonistic yeast strains used in biological control of fruits do not only control pathogens in the storage period, but also reduce patulin and other mycotoxins directly. Our research team found that the degradation of patulin treated with P. caribbica was higher than that of the control at all the tested time, which showed that P. caribbica can degrade patulin directly [21], but the degradation mechanisms are unknown. In this paper, we investigated the possible mechanisms involved in degradation of patulin by antagonistic yeast using P. caribbica as the model organism.
The cell-free filtrate of P. caribbica decreased the concentrations of the patulin at all tested times indicating that P. caribbica might have produced certain intracellular enzymes which degraded the patulin. These results are similar to the degradation of OTA by the cell-free supernatant of Bacillus subtilis CW 14 [33]. The functions of these enzymes were, however, short-lived as the degradation declined after 12 h. Moreover, the patulin may have reacted with sulfhydryl containing amino acids or proteins, thereby decreasing its concentration [17].
Co-incubation of heat-killed and live cells of P. caribbica with patulin respectively showed that the inactive yeasts could not reduce the concentration of the patulin, while the live cells significantly reduced the concentration of the patulin (Figure 2). This finding is in line with Dong et al. [34] who reported that the live yeast Kodameae ohmeri could degrade patulin. In addition, significant differences in the reduction of patulin content was observed between viable and heat-killed cells. The results showed that the degradation of patulin requires the presence of live yeast cells.
Fifty-one percent of patulin was absorbed by dead yeast cells of R. paludigenum [28]. However, the test on the role of P. caribbica in patulin absorption indicated that patulin was not detected in the broken yeast cells and the cell wall. These results showed that there are other mechanisms of patulin reduction other than absorption by the yeast cells.
The test on the effects of cycloheximide on P. caribbica degradation of patulin, demonstrated that the P. caribbica without the cycloheximide decreased the patulin concentration throughout the entire duration of the experiment and after 36 h the patulin could not be detected. On the contrary, P. caribbica containing the cycloheximide decreased the patulin concentration sharply during the first 12 h. These results are in agreement with the findings of Zhang et al. [35] who used cycloheximide combined with S. cerevisiae to degrade ZEN at time 0 h, while addition of cycloheximide at 12 h significantly slowed down degradation. Moreover, cycloheximide inhibits protein (enzymes) synthesis in eukaryotes. These results suggest that enzymes produced by antagonistic yeasts play an important role in degradation of patulin.
As reported, the process of patulin degradation is an enzymatic reaction [22,24,34]. This confirmed our findings in which the supernatant from the P. caribbica degraded the patulin regardless of whether the yeast cells were filtered out or not. This is an indication that the yeast may have synthesized some extracellular enzymes in the supernatant which was involved in the degradation.
Additionally, Folger [36] reported that patulin can be degraded by yeast protein extract. R. paludigenum was observed to have degraded patulin through the activities of its intracellular enzymes, and the enzymes were induced by the patulin [28]. In this way, the intracellular enzymes of P. caribbica alone and the P. caribbica induced with patulin were extracted and their ability to degrade patulin was confirmed. Our results showed that the intracellular enzymes of the P. caribbica induced with patulin contained the enzymes which were responsible for the degradation of patulin.
Ianiri, Idnurm, Wright, Durán-Patrón, Mannina, Ferracane, Ritieni, and Castoria [30] in their quest to determine the relevant genes responsible for patulin degradation used A. tumefaciens T-DNA delivery system. They isolated 13 mutants which were affected in patulin degradation, some exhibited hypersensitivity to patulin. However, the slow patulin degradation observed for the mutants was proven not to be the inactivation of genes encoding enzymes directly involved in the patulin degradation pathway, but to the loss of functions of genes involved in resistance to patulin-induced stresses. No degradation pathway was found. In this study, the differentially expressed proteins of P. caribbica induced by the patulin showed that the basic metabolic proteins of P. caribbica were affected. Response patterns of P. caribbica to patulin are complex, as the differentially abundant proteins were involved in multiple metabolic pathways. The cytoplasm of eukaryotic cells, whether chemical, thermal, or in the form of misfolded or aggregated protein, triggers a complex biological response referred to as the heat shock response [37,38,39,40]. Hsp70 is a molecular chaperone belonging to heat-shock protein family. It is a stress-inducible member, in contrast to Hsc70 expressed constitutively. Hsp70 plays an important role in the folding and assembling of newly synthesized proteins, refolding of misfolded proteins, aggregation of proteins, and membrane translocation of organelles. It also secretes proteins and controls the activities of regulatory proteins [41,42,43,44]. The more concentration indicated that Hsp 70 was produced during the degradation of patulin by P. caribbica. Phosphomannomutase (PMM, EC 5.4.2.8), catalyzing the interconversion between mannose-6-phosphate and mannose-1-phosphate, is an essential and conserved enzyme in eukaryotic organisms [45,46]. Mannose-1-phosphate is necessary for synthesizing the vital cellular metabolite GDP-mannose, which plays a crucial role in the formation of polysaccharide chains required for the glycosylation of protein and lipid molecules [47,48]. The mannan oligosaccharide is composed of mannose and glucose oligosaccharides, one of the main active ingredients of the cell wall of yeasts. It can absorb mycotoxins. So PMM may be an important enzyme in the degradation of patulin by P. caribbica. Most of the differentially expressed proteins are related to basic metabolism, such as acetyl-CoA hydrolase, isocitrate lyase, citrate synthase, and enolase 1.

4. Conclusions

In conclusion, the degradation of patulin by P. caribbica is an enzyme catalytic process, and these enzymes were induced by patulin. In the future, we will focus on the identification of these enzymes which are involved in patulin degradation and the degradation products of the patulin.

5. Materials and Methods

5.1. Antagonist and Growth Conditions

P. caribbica was isolated from soils of an unsprayed orchard (the central shoal of Yangtze River, Zhenjiang, Jiangsu Province, China) by our research team. Sequence analysis of the 5.8 S internal transcribed spacer (ITS) ribosomal DNA (rDNA) region of the yeast found that it was P. caribbica [49,50]. P. caribbica has been shown to be safe in animal testing, such as physiological, acute toxicity and Ames test [51]. P. caribbica isolates were maintained at 4 °C on nutrient yeast dextrose agar medium (NYDA-0.8% nutrient broth, 0.5% yeast extract, 1% glucose and 2% agar) (Sangon Biotech, Shanghai, China). Liquid cultures of the yeast were grown in 250-mL Erlenmeyer flasks containing 50 mL of nutrient yeast dextrose broth (NYDB) which had been inoculated with a loop of the culture. Flasks were incubated on a rotary shaker at 190 rpm for 48 h at 28 °C. Following incubation, cells were centrifuged at 6000× g for 10 min and washed twice with sterile distilled water. Cell pellets were re-suspended in sterile distilled water and adjusted to an initial concentration before being adjusted to the concentration required for different experiments.

5.2. Preparation of Stock Standard Solutions of Patulin

The patulin (Sigma-Aldrich, St. Louis, MO, USA) was prepared in accordance with the method described by MacDonald et al. [52], with some modifications. The patulin standard working solution (20 μg/mL) was diluted 10-fold with acetate buffer (pH 4.0). The samples were filtered through a 0.22 μm Wondadisc NY organic filter (SHIMADZU, Kyoto, Japan), and subjected to HPLC analysis. A standard curve of the patulin (μg/mL) was generated.

5.3. HPLC-UV Analysis of Patulin

Agilent 1100 series system (Agilent, Santa Clara, CA, USA) was used to analysis the patulin. The analytical column used was Zorbax, SB-C18 250 × 4.6 mm 5 μm (Agilent, Santa Clara, CA, USA). The mobile phase composed of water and CAN (9:1, v/v) that was set at 1 mL/min. The UV detection was performed at 276 nm. Data collection and subsequent processing were performed using Gilson Unipoint software 5.0 (Gilson, Inc, Middleton, WI, USA).

5.4. Efficacy of Cell-Free Culture Filtrate of P. caribbica on the Detoxification of Patulin

One milliliter culture medium of P. caribbica (1 × 10⁸ cells/mL) was added to 50 mL NYDB in 250-mL Erlenmeyer flasks. Flasks were incubated on a rotary shaker at 180 rpm at 28 °C for 20 h. Following incubation, cells were centrifuged at 6000× g for 10 min. Then cell suspensions were filtered through micro pore (0.22 μm) to obtain the cell-free filtrate. Twenty-five mL cell-free filtrate of P. caribbica and NYDB medium (control) were each added into 150-mL Erlenmeyer flasks containing patulin at the concentration of 20 μg/mL, respectively. Samples were taken every 6 h and centrifuged at 7000× g for 5 min. The supernatants were filtered through a 0.22 μm filter and HPLC analysis was performed to determine the patulin contents. Every group had three replicates and the experiment was replicated twice.

5.5. Efficacy of Viable and Heat-Killed P. caribbica Cells on the Reduction of Patulin

The yeasts cells were inactivated in water at 100 °C for 15 min. Two mL of the live P. caribbica (1 × 10⁸ cells/mL), the heat-killed cells, and sterile distilled water (control) were added to 25 mL NYDB containing 20 μg/mL of patulin in 150 mL Erlenmeyer flasks, respectively. Samples were taken at every 6 h, centrifuged at 7000× g for 5 min. The supernatants were filtered through a 0.22 μm filter, and subjected to HPLC analysis. Every group had three replicates and the experiment was replicated twice.

5.6. Absorption of Patulin by P. caribbica Cells

One milliliter suspension of P. caribbica (1 × 10⁸ cells/mL) was added to 25 mL NYDB and 20 μg/mL of patulin in 150 mL Erlenmeyer flasks. The samples were incubated in a rotary shaker at 180 rpm for 20 h at 28 °C. Following incubation, cells were centrifuged at 6000× g for 10 min and washed twice with sterile distilled water to remove the patulin in the supernatant. The yeasts were sonicated at 1000 hz for 20 min. Fifteen mL of ethyl acetate was added to broken yeast cells, vortexed for 60 s and the upper layer was transferred into a separate funnel (125 mL). This step was repeated thrice and then 5 mL of 1.4% (w/v) Na2CO3 was added to the ethyl acetate layer and vigorously mixed for 2 min. The upper ethyl acetate layer was dried in a vacuum at 40 °C in a rotary evaporator. Soon after, 1 mL acetate buffer (0.2 mol/L, pH 4) was added and vortexed until it dissolved completely. The sample was filtered through a 0.22 μm Wondadisc NY organic filter (SHIMADZU, Kyoto, Japan), and analyzed in HPLC machine. Every group had three replicates and the experiment was replicated twice.

5.7. Effects of Cycloheximide on Degradation of Patulin by P. caribbica

One milliliter suspension of P. caribbica (1 × 10⁸ cells/mL) was added to 25 mL NYDB and 20 μg/mL of patulin in 150 mL Erlenmeyer flasks. Treatments were as follows: (1) 5 μg/mL cycloheximide with patulin; (2) Addition of patulin into cycloheximide after 6 h; (3) only patulin (Control). Samples were taken at every 6 h, and centrifuged at 7000× g for 5 min. The supernatants were filtered through a 0.22 μm filter, and subjected to HPLC analysis to determine the patulin content. Every group had three replicates and the experiment was replicated twice.

5.8. Effects of P. caribbica Supernatant on Patulin Degradation

Two milliliter suspension of P. caribbica (1 × 10⁸ cells/mL) was added to 25 mL NYDB and 20 μg/mL of patulin. After incubating for 6 h, one group was filtered twice through 0.22 μm filter to remove all the cells and the group was not filtered. Samples were taken every 6 h and centrifuged at 7000× g for 5 min. The supernatants were filtered through a 0.22 μm filter and analyzed using HPLC. Every group had three replicates and the experiment was replicated twice.

5.9. Degradation of Patulin by Intracellular Enzymes

P. caribbica (108 cells/mL) was incubated in NYDB and NYDB containing 20 μg/mL patulin in a rotary shaker at 180 rpm at 28 °C. After 20 h of incubation, the supernatants and the cells were centrifuged. The cells were washed with phosphate buffer (50 mM, pH 7.0) thrice. The wet cells were quickly ground in mortar using pestle with liquid nitrogen added and then suspended in 10 mL phosphate buffer. After 30 min in ice, the samples were centrifuged at 13,000× g for 10 min at 4 °C and the supernatant was collected. Afterwards, 100 µg of patulin was added to 5 mL of the yeast cells was amended with the patulin and those that were not amended. Every group had three replicates and the experiment was replicated twice.

5.10. Protein Sample Preparation

Liquid cultures of the yeasts were grown in NYDB and NYDB + 20 μg/mL patulin as described above under the section Antagonist and Growth Conditions’. The protein samples were prepared as described by Li et al. [53] with some modifications. After 24 h, the yeast cells were harvested from the NYDB and the NYDB + patulin, and centrifuged at 10,000× g for 10 min (4 °C). The cells were washed with cold distilled water each time after centrifugation to remove residual medium. Subsequently, the samples (yeast cells) were ground into fine powder with a mortar and pestle. The powder was transferred into a 50-mL tube. Thereafter, 10 mL TE buffer (10 mM Tris-HCL, pH 8.0, 1 mM EDTA, and 1 mM PMSF), 50 μg of RNase A and 200 μg of DNase I was added and incubated at 4 °C for 30 min. The samples were centrifuged at 11,000× g for 20 min (4 °C), then the supernatant was added to two volumes of 20% TCA/acetone (−20 °C pre-cooled at least 30 min), vortexed, and incubated at −20 °C for 12–16 h. Following incubation, the sample was centrifuged at 11,000× g for 20 min (4 °C) and the supernatant was discarded. The pellets were centrifuged at 11,000× g for 5 min (4 °C), washed with acetone (−20 °C pre-cooled). The pellets were air-dried at room temperature to remove residual acetone. Then solubilized in lysis buffer containing 2 M thiourea, 7 M urea, 4% (w/v) CHAPS, 65 mM DTT, 0.2% (w/v) Bio-Lyte (Bio-Rad, Hercules, CA, USA). Protein samples were kept at −80 °C until use. The protein concentration was determined according to Bradford’s method using bovine serum albumin as standard [54].

5.11. 2-DE and Image Analysis

Two-dimensional electrophoresis (2-DE) and image analysis were performed as described by Wang et al. [55]. The first dimension electrophoresis was carried out on a 17-cm IPG strip (pH 3–10, Bio-Rad, Hercules, CA, USA). The strip was rehydrated for 1 h in the rehydration solution containing 2 M thiourea, 7 M urea, 4% (w/v) CHAPS, 65 mM DTT, 0. 2% (w/v) Bio-Lyte, and about 400 μg sample protein in a re-swelling trough. The rehydrated strip was then subjected to electrophoresis in the first dimension. After isoelectric focusing, the strip was equilibrated in two steps in the SDS equilibration stock solution consisting 50 mM Tris-HCl buffer, 6 M urea, 20% (v/v) glycerol and 2% (w/v) SDS supplemented with 2% (w/v) DTT, and 2.5% (w/v) iodoacetamide, respectively. The second dimension was run on a 12.5% polyacrylamide gel using the Multiphor system (Amersham Biosciences, Amersham, UK). The conditions were 1 W per strip for 1 h followed by 15 W per strip until bromophenol blue reached 0.5 cm above the bottom. To estimate the molecular weights of the protein spots, marker proteins were also separated together with the P. caribbica proteins. After electrophoresis, gels were visualized by Coomassie Blue stain. The stained gels were scanned and analyzed using PDQuest software (version 7.4, Bio-Rad, Hercules, CA, USA). Proteins that increased two-fold at one point after treatment, as well as exhibited the same expression pattern among the replicates, were considered as significant and reproducible change proteins. The proteins were subsequently identified. At least three biological replicates were performed for each treatment.

5.12. Protein In-Gel Digestion and Identification

Differentially expressed protein spots were excised from the gel and were washed twice by distilled H2O, then destained with 50 mM NH4CO3/CAN solution. Afterwards, they were washed with 25 mM NH4CO3, 50% CAN until the gels became white, then vacuum drained for 5 min. Two μL trypsin (10 μg/μL) (Sigma–Aldrich, St. Louis, MO, USA) was incubated at 4 °C for 30 min, then 10 μL 25 mM NH4CO3 was added. The gels were incubated overnight at 37 °C. The supernatant was collected for MS analysis [56]. Proteins were identified by MALDI-TOF/TOF and database query. The peptide solution was analyzed using MALDI TOF/TOF mass spectrometer (Ultraflex III, Bruker-Daltonics, Bremen, Germany). MS/MS spectra were analyzed using the FlexAnalysis 3.0 (Bruker Daltonics GmbH, Bremen, Germany). The resulting monoisotopic peptide masses were queried against the protein database in NCBInr using MASCOT version 2.3 software (Matrix Science, Franklin, UK) with the following search parameters: all entries, trypsin, up to one missed cleavage, carbamidomethyl (C), oxidation (M), and Gln-Pyro-glu, peptide tolerance 0.3 Dal, mass value MH+, and monoisotopic [37].

5.13. Statistical Analysis

The data were analyzed by the analysis of variance (ANOVA) in the statistical program SPSS/PC version 17.0, (SPSS Inc. Chicago, IL, USA) and the Duncan’s multiple range test was used for means separation. In addition, when the group of the data was two, the independent samples t test was applied for means separation. The statistical significance was assessed at the level p < 0.05.

Acknowledgments

This work was supported by the National Natural Science Foundation of China (31571899, 31271967), the Technology Support Plan of Jiangsu Province (BE2014372), the Technology Support Plan of Zhenjiang (NY2013004), and the Graduate Innovative Projects of Jiangsu Province (KYLX_1069).

Author Contributions

X.Z. conducted most of the experiments, analyzed the results, and wrote the initial paper. Q.Y. conducted experiments on the patulin content analysis and wrote part of the paper. H.Z. conceived the idea for the project and provided the funding. J.C. and M.T.A. revised the article. X.Z. provided experiment direction and revised the article.

Conflicts of Interest

The authors declare no conflict of interest.

References

  1. Joint FAO/WHO Expert Committee on Food Additives; World Health Organization; Food and Agriculture Organization of the United Nations; International Programme on Chemical Safety. Toxicological Evaluation of Certain Food Additives and Contaminants in Food; Cambridge University Press: Cambridge, UK, 1996; pp. 189–197. [Google Scholar]
  2. Ono, E.Y.S.; Biazon, L.; Silva, M.D.; Vizoni, É.; Sugiura, Y.; Ueno, Y.; Hirooka, E.Y. Fumonisins in corn: Correlation with fusarium sp. Count, damaged kernels, protein and lipid content. Braz. Arch. Biol. Technol. 2006, 49, 1967–1976. [Google Scholar] [CrossRef]
  3. Pitt, J.I.; Basílico, J.C.; Abarca, M.L.; López, C. Mycotoxins and toxigenic fungi. Med. Mycol. 2010, 38 (Suppl. S1), 41–46. [Google Scholar] [CrossRef]
  4. Ritieni, A. Patulin in italian commercial apple products. J. Agric. Food Chem. 2003, 51, 6086–6090. [Google Scholar] [CrossRef] [PubMed]
  5. Andersen, B.; Smedsgaard, J.; Frisvad, J.C. Penicillium expansum: Consistent production of patulin, chaetoglobosins, and other secondary metabolites in culture and their natural occurrence in fruit products. J. Agric. Food Chem. 2004, 52, 2421–2428. [Google Scholar] [CrossRef] [PubMed]
  6. Waksman, S.A.; Horning, E.S.; Spencer, E.L. The production of two antibacterial substances, fumigacin and clavacin. Am. Assoc. Adv. Sci. 1942, 96, 202–203. [Google Scholar] [CrossRef] [PubMed]
  7. Wiesner, B. Bactericidal effects of aspergillus clavatus. Nature 1942, 149, 356–357. [Google Scholar] [CrossRef]
  8. Martins, M.; Gimeno, A.; Martins, H.; Bernardo, F. Co-occurrence of patulin and citrinin in portuguese apples with rotten spots. Food Addit. Contam. 2002, 19, 568–574. [Google Scholar] [CrossRef] [PubMed]
  9. Barreira, M.J.; Alvito, P.C.; Almeida, C.M. Occurrence of patulin in apple-based-foods in portugal. Food Chem. 2010, 121, 653–658. [Google Scholar] [CrossRef]
  10. Baert, K.; de Meulenaer, B.; Kamala, A.; Kasase, C.; Devlieghere, F. Occurrence of patulin in organic, conventional, and handcrafted apple juices marketed in belgium. J. Food Prot. 2006, 69, 1371–1378. [Google Scholar] [PubMed]
  11. Saxena, N.; Dwivedi, P.D.; Ansari, K.M.; Das, M. Patulin in apple juices: Incidence and likely intake in an indian population. Food Addit. Contam. 2008, 1, 140–146. [Google Scholar] [CrossRef] [PubMed]
  12. Yuan, Y.; Zhuang, H.; Zhang, T.; Liu, J. Patulin content in apple products marketed in northeast china. Food Control 2010, 21, 1488–1491. [Google Scholar] [CrossRef]
  13. Schumacher, D.M.; Metzler, M.; Lehmann, L. Mutagenicity of the mycotoxin patulin in cultured chinese hamster v79 cells, and its modulation by intracellular glutathione. Arch. Toxicol. 2005, 79, 110–121. [Google Scholar] [CrossRef] [PubMed]
  14. Osswald, H.; Frank, H.; Komitowski, D.; Winter, H. Long-term testing of patulin administered orally to sprague-dawley rats and swiss mice. Food Cosmet. Toxicol. 1976, 16, 243–247. [Google Scholar] [CrossRef]
  15. Wichmann, G.; Herbarth, O.; Lehmann, I. The mycotoxins citrinin, gliotoxin, and patulin affect interferon-γ rather than interleukin-4 production in human blood cells. Environ. Toxicol. 2002, 17, 211–218. [Google Scholar] [CrossRef] [PubMed]
  16. Devaraj, H.; Radha, S.K.; Shanmugasundaram, E. Neurotoxic effect of patulin. Indian J. Exp. Biol. 1982, 20, 230–231. [Google Scholar] [PubMed]
  17. Ciegler, A.; Beckwith, A.; Jackson, L.K. Teratogenicity of patulin and patulin adducts formed with cysteine. Appl. Environ. Microbiol. 1976, 31, 664–667. [Google Scholar] [PubMed]
  18. Donmez-Altuntas, H.; Gokalp-Yildiz, P.; Bitgen, N.; Hamurcu, Z. Evaluation of genotoxicity, cytotoxicity and cytostasis in human lymphocytes exposed to patulin by using the cytokinesis-block micronucleus cytome (CBMN cyt) assay. Mycotoxin Res. 2013, 29, 63–70. [Google Scholar] [CrossRef] [PubMed]
  19. Nunes, C.A. Biological control of postharvest diseases of fruit. Eur. J. Plant Pathol. 2012, 133, 181–196. [Google Scholar] [CrossRef]
  20. Droby, S.; Wisniewski, M.; Macarisin, D.; Wilson, C. Twenty years of postharvest biocontrol research: Is it time for a new paradigm? Postharvest Biol. Technol. 2009, 52, 137–145. [Google Scholar] [CrossRef]
  21. Cao, J.; Zhang, H.; Yang, Q.; Ren, R. Efficacy of pichia caribbica in controlling blue mold rot and patulin degradation in apples. Int. J. Food Microbiol. 2013, 162, 167–173. [Google Scholar] [CrossRef] [PubMed]
  22. Castoria, R.; Morena, V.; Caputo, L.; Panfili, G.; de Curtis, F.; De Cicco, V. Effect of the biocontrol yeast rhodotorula glutinis strain LS11 on patulin accumulation in stored apples. Phytopathology 2005, 95, 1271–1278. [Google Scholar] [CrossRef] [PubMed]
  23. Coelho, A.; Celli, M.; Sataque Ono, E.; Hoffmann, F.; Pagnocca, F.; Garcia, S.; Sabino, M.; Harada, K.; Wosiacki, G.; Hirooka, E. Patulin biodegradation using Pichia ohmeri and Saccharomyces cerevisiae. World Mycotoxin J. 2008, 1, 325–331. [Google Scholar] [CrossRef]
  24. Castoria, R.; Mannina, L.; Durán-Patrón, R.; Maffei, F.; Sobolev, A.P.; de Felice, D.V.; Pinedo-Rivilla, C.; Ritieni, A.; Ferracane, R.; Wright, S.A. Conversion of the mycotoxin patulin to the less toxic desoxypatulinic acid by the biocontrol yeast Rhodosporidium kratochvilovae strain LS11. J. Agric. Food Chem. 2011, 59, 11571–11578. [Google Scholar] [CrossRef] [PubMed]
  25. Bevardi, M.; Frece, J.; Mesarek, D.; Bošnir, J.; Mrvčić, J.; Delaš, F.; Markov, K. Antifungal and antipatulin activity of Gluconobacter oxydans isolated from apple surface. Arch. Ind. Hyg. Toxicol. 2013, 64, 279–284. [Google Scholar] [CrossRef] [PubMed]
  26. Coelho, A.R.; Celli, M.G.; Ono, E.Y.S.; Wosiacki, G.; Hoffmann, F.L.; Pagnocca, F.C.; Hirooka, E.Y. Penicillium expansum versus antagonist yeasts and patulin degradation in vitro. Braz. Arch. Biol. Technol. 2007, 50, 725–733. [Google Scholar] [CrossRef]
  27. Zhu, R.; Yu, T.; Guo, S.; Hu, H.; Zheng, X.; Karlovsky, P. Effect of the yeast Rhodosporidium paludigenum on postharvest decay and patulin accumulation in apples and pears. J. Food Prot. 2015, 78, 157–163. [Google Scholar] [CrossRef] [PubMed]
  28. Zhu, R.; Feussner, K.; Wu, T.; Yan, F.; Karlovsky, P.; Zheng, X. Detoxification of mycotoxin patulin by the yeast Rhodosporidium paludigenum. Food Chem. 2015, 179, 1–5. [Google Scholar] [CrossRef] [PubMed]
  29. Iwahashi, Y.; Hosoda, H.; Park, J.-H.; Lee, J.-H.; Suzuki, Y.; Kitagawa, E.; Murata, S.M.; Jwa, N.-S.; Gu, M.-B.; Iwahashi, H. Mechanisms of patulin toxicity under conditions that inhibit yeast growth. J. Agric. Food Chem. 2006, 54, 1936–1942. [Google Scholar] [CrossRef] [PubMed]
  30. Ianiri, G.; Idnurm, A.; Wright, S.A.; Durán-Patrón, R.; Mannina, L.; Ferracane, R.; Ritieni, A.; Castoria, R. Searching for genes responsible for patulin degradation in a biocontrol yeast provides insight into the basis for resistance to this mycotoxin. Appl. Environ. Microbiol. 2013, 79, 3101–3115. [Google Scholar] [CrossRef] [PubMed]
  31. Ianiri, G.; Idnurm, A.; Castoria, R. Transcriptomic responses of the basidiomycete yeast sporobolomyces sp. To the mycotoxin patulin. BMC Genom. 2016, 17, 1–15. [Google Scholar] [CrossRef] [PubMed]
  32. Di, S.V.; Pitonzo, R.; Cicero, N.; D’Oca, M.C. Mycotoxin contamination of animal feedingstuff: Detoxification by gamma-irradiation and reduction of aflatoxins and ochratoxin A concentrations. Food Addit. Contam. 2014, 31, 2034–2039. [Google Scholar]
  33. Shi, L.; Liang, Z.; Li, J.; Hao, J.; Xu, Y.; Huang, K.; Tian, J.; He, X.; Xu, W. Ochratoxin A biocontrol and biodegradation by Bacillus subtilis cw 14. J. Sci. Food Agric. 2014, 94, 1879–1885. [Google Scholar] [CrossRef] [PubMed]
  34. Dong, X.; Jiang, W.; Li, C.; Ma, N.; Xu, Y.; Meng, X. Patulin biodegradation by marine yeast kodameae ohmeri. Food Additives & Contaminants Part A Chemistry Analysis Control Exposure & Risk Assessment 2015, 32, 352–360. [Google Scholar]
  35. Zhang, H.; Dong, M.; Yang, Q.; Tibiru, A.M.; Li, J.; Zhang, X. Biodegradation of zearalenone by Saccharomyces cerevisiae: Possible involvement of zen responsive proteins of the yeast. J. Proteomics 2016, 143, 416–423. [Google Scholar] [CrossRef] [PubMed]
  36. Folger, B.C. Patulin degradation by yeast protein extract. Master’s Theses, University of Minnesota, Minneapolis, MN, 2014. [Google Scholar]
  37. Majoul, T.; Bancel, E.; Triboï, E.; Ben Hamida, J.; Branlard, G. Proteomic analysis of the effect of heat stress on hexaploid wheat grain: Characterization of heat-responsive proteins from total endosperm. Proteomics 2003, 3, 175–183. [Google Scholar] [CrossRef] [PubMed]
  38. Calderwood, S.K.; Murshid, A.; Prince, T. The shock of aging: Molecular chaperones and the heat shock response in longevity and aging–a mini-review. Gerontology 2009, 55, 550–558. [Google Scholar] [CrossRef] [PubMed]
  39. Morimoto, R.I. Proteotoxic stress and inducible chaperone networks in neurodegenerative disease and aging. Genes Dev. 2008, 22, 1427–1438. [Google Scholar] [CrossRef] [PubMed]
  40. Voellmy, R.; Boellmann, F. Chaperone regulation of the heat shock protein response. Adv. Exp. Med. Biol. 2007, 23, 89–99. [Google Scholar]
  41. Bukau, B.; Deuerling, E.; Pfund, C.; Craig, E.A. Getting newly synthesized proteins into shape. Cell 2000, 101, 119–122. [Google Scholar] [CrossRef]
  42. Hartl, F.U.; Hayer-Hartl, M. Molecular chaperones in the cytosol: From nascent chain to folded protein. Science 2002, 295, 1852–1858. [Google Scholar] [CrossRef] [PubMed]
  43. Young, J.C.; Barral, J.M.; Hartl, F.U. More than folding: Localized functions of cytosolic chaperones. Trends Biochem. Sci. 2003, 28, 541–547. [Google Scholar] [CrossRef] [PubMed]
  44. Pratt, W.B.; Toft, D.O. Regulation of signaling protein function and trafficking by the hsp90/hsp70-based chaperone machinery. Exp. Biol. Med. 2003, 228, 111–133. [Google Scholar]
  45. Kepes, F.; Schekman, R. The yeast sec53 gene encodes phosphomannomutase. J. Biol. Chem. 1988, 263, 9155–9161. [Google Scholar] [PubMed]
  46. Seifert, G.J. Nucleotide sugar interconversions and cell wall biosynthesis: How to bring the inside to the outside. Curr. Opin. Plant Biol. 2004, 7, 277–284. [Google Scholar] [CrossRef] [PubMed]
  47. Lerouge, P.; Cabanes-Macheteau, M.; Rayon, C.; Fischette-Lainé, A.-C.; Gomord, V.; Faye, L. N-glycoprotein biosynthesis in plants: Recent developments and future trends. Plant Mol. Biol. 1998, 38, 31–48. [Google Scholar] [CrossRef] [PubMed]
  48. Spiro, R.G. Protein glycosylation: Nature, distribution, enzymatic formation, and disease implications of glycopeptide bonds. Glycobiology 2002, 12, 43R–56R. [Google Scholar] [CrossRef] [PubMed]
  49. Kurtzman, C.; Fell, J.; Boekhout, T. Definition, classification and nomenclature of the yeasts. The yeasts, a taxonomic study 2011, 1, 3–5. [Google Scholar]
  50. Li, S.-S.; Cheng, C.; Li, Z.; Chen, J.-Y.; Yan, B.; Han, B.-Z.; Reeves, M. Yeast species associated with wine grapes in china. Int. J. Food Microbiol. 2010, 138, 85–90. [Google Scholar] [CrossRef] [PubMed]
  51. Zheng, X.F. P. caribbica shown to be safe in physiological, acute toxicity and Ames test in animal. Jiangsu University: Zhenjiang, China, Unpublished work. 2016. [Google Scholar]
  52. MacDonald, S.; Long, M.; Gilbert, J.; Felgueiras, I. Liquid chromatographic method for determination of patulin in clear and cloudy apple juices and apple puree: Collaborative study. J. AOAC Int. 2000, 83, 1387–1394. [Google Scholar] [PubMed]
  53. Li, B.; Lai, T.; Qin, G.; Tian, S. Ambient ph stress inhibits spore germination of penicillium expansum by impairing protein synthesis and folding: A proteomic-based study. J. Proteome Res. 2010, 9, 298–307. [Google Scholar] [CrossRef] [PubMed]
  54. Bradford, M.M. A rapid and sensitive method for the quantitation of microgram quantities of protein utilizing the principle of protein-dye binding. Anal. Biochem. 1976, 72, 248–254. [Google Scholar] [CrossRef]
  55. Wang, Y.; Yang, L.H.; Li, Q.; Ma, Z.; Chu, C. Differential proteomic analysis of proteins in wheat spikes induced by fusarium graminearum. Proteomics 2005, 5, 4496–4503. [Google Scholar] [CrossRef] [PubMed]
  56. Zhang, L.; Yu, Z.; Jiang, L.; Jiang, J.; Luo, H.; Fu, L. Effect of post-harvest heat treatment on proteome change of peach fruit during ripening. J. Proteom. 2011, 74, 1135–1149. [Google Scholar] [CrossRef] [PubMed]
Figure 1. Efficacy of cell-free filtrate of P. caribbica on the degradation of patulin. The x axis represents the time after the addition of patulin (h: hour), the y axis represents the concentration of the patulin in the medium. CK: NYDB + patulin, Supernatant: P. caribbica cultuered in NYDB medium + patulin. Results are presented as means ± SD of triplicate experiments. The data at the same time were analyzed by the t test. The significant difference was assessed at the level p < 0.05.
Toxins 08 00289 g001
Figure 2. Efficacy of viable and heat-killed P. caribbica cells on degradation of patulin. The x axis represents the time after the addition of patulin (h: hour), the y axis represents the concentration of the patulin in the medium. Results are presented as means ± SD of triplicate experiments. The data at the same time were analyzed by the analysis of variance (ANOVA) in the statistical program SPSS/PC version 17.0. The significant difference was assessed at the level p < 0.05.
Toxins 08 00289 g002
Figure 3. Effects of cycloheximide on degradation of patulin by P. caribbica. The x axis represents the time after the addition of patulin (h: hour), the y axis represents the concentration of the patulin in the medium. Results are presented as means ± SD of triplicate experiments. The data at the same time were analyzed by the analysis of variance (ANOVA) in the statistical program SPSS/PC version 17.0. The significant difference was assessed at the level p < 0.05.
Toxins 08 00289 g003
Figure 4. Efficacy of cell-free filtrate of P. caribbica which was induced 6 h by patulin on degradation of patulin. The x axis represents the time after the addition of patulin (h: hour), the y axis represents the concentration of the patulin in the medium. Results are presented as means ± SD of triplicate experiments. The data at the same time were analyzed by the t test. The significant difference was assessed at the level p < 0.05.
Toxins 08 00289 g004
Figure 5. Effects of intracellular enzymes of P. caribbica on degradation of patulin. (A): The HPLC result of standard patulin samples in phosphate buffer at 24 h after incubation; (B): The HPLC result of patulin+P-E (extracted from the P. caribbica induced by patulin);(C): The HPLC result of patulin+E (extracted from P. caribbica); (D): The patulin content at 0, 12, and 24 h after treatment. The red arrows in A, B, and C represent the peaks of patulin. The data are presented as means ± SD of triplicate experiments. The data at the same time were analyzed by the analysis of variance (ANOVA) in the statistical program SPSS/PC version 17.0. The significant difference was assessed at the level p < 0.05.
Toxins 08 00289 g005
Figure 6. Two-dimensional pattern of intracellular proteins of P. caribbica after cultivation for 24 h in NYDB and NYDB amended with patulin. (A): Protein extracted from P. caribbica which was harvested from NYDB at 24 h after incubation; (B): Protein extracted from P. caribbica which was harvested from NYDB amended with patulin at 24 h after incubation; (C): Gene ontology (GO) analysis of the differentially expressed proteins of P. caribbica when treated with patulin.
Toxins 08 00289 g006
Table 1. Proteins identified with PMF.
Molecular FunctionSpotProtein NameNCBI AccessionMassPISpeciesScoreSequence Coverage (%)Number of Mass Values Matched
Serine-type endopeptidase activity2Chymotrypsinogen Agi|11761526,2208.52Bos taurus206164
Serine-type endopeptidase activity21Chymotrypsinogengi|11761626,3094.99Bos taurus11061
Isocitrate lyase activity4Isocitrate lyasegi|14641375761,9376.31Meyerozyma guilliermondii ATCC 626012452
Isocitrate lyase activity8Isocitrate lyasegi|14641375761,9376.31Meyerozyma guilliermondii ATCC 6260429125
Isocitrate lyase activity11Isocitrate lyase and phosphorylmutasegi|34423242062,2826.78Candida tenuis ATCC 105736752
Citratesynthase activity6Citrate synthasegi|14642197543,9956.25Meyerozyma guilliermondii ATCC 626011952
Acetyl-CoA hydrolase activity10Acetyl-CoA hydrolasegi|14641779758,3855.96Meyerozyma guilliermondii ATCC 626022262
Phosphopyruvate hydratase activity15Enolase 1gi|14641538446,9515.42Meyerozyma guilliermondii ATCC 626011731
Phosphomannomutase activity17Phosphomannomutasegi|14642373928,6785.26Meyerozyma guilliermondii ATCC 6260361195
Stress response20Heat shock protein SSB1gi|14642066166,4215.29Meyerozyma guilliermondii ATCC 6260260105
Stress response22Heat shock protein 70 2gi|14641377770,1775.04Meyerozyma guilliermondii ATCC 62609511712
Unclassified12DEHA2F04796pgi|5042397335,9266.24Debaryomyces hansenii CBS7676172
Unclassified13Conserved hypothetical proteingi|14641776534,9167.17Meyerozyma guilliermondii ATCC 6260219133
Unclassified14Hypothetical protein PGUG_05640gi|14641329865,2565.85Meyerozyma guilliermondii ATCC 626017052
Unclassified16DEHA2G14058pgi|5042708947,2105.28Debaryomyces hansenii CBS76719772
Unclassified5Hypothetical protein PGUG_05024gi|14641419732,1187.77Meyerozyma guilliermondii ATCC 6260122102
Unclassified9DEHA2D06160pgi|5042038154,2825.68Debaryomyces hansenii CBS76713382
Unclassified23Conserved hypothetical proteingi|14641682544,1465.33Meyerozyma guilliermondii ATCC 6260280134
Unclassified24Hypothetical protein PGUG_00755gi|14642288820,3175.45Meyerozyma guilliermondii ATCC 62608461
Unclassified25Hypothetical protein PGUG_04067gi|14641473634,2346.64Meyerozyma guilliermondii ATCC 6260104113
Unclassified24Hypothetical protein PGUG_03175gi|14641896262,0155.21Meyerozyma guilliermondii ATCC 6260272124
Unclassified29Hypothetical protein PGUG_00646gi|19034479478,7448.19Meyerozyma guilliermondii ATCC 6260296116
Unclassified30Hypothetical protein LOC100448380gi|297701166105,9795.19Pongo abelii8533
Unclassified31Hypothetical protein PGUG_03973gi|14641454838,1395.53Meyerozyma guilliermondii ATCC 626012751
Unclassified32Hypothetical protein PGUG_01788gi|14642032137,0675.56Meyerozyma guilliermondii ATCC 626010992
Unclassified33Hypothetical protein PGUG_00294gi|14642194835,9915.22Meyerozyma guilliermondii ATCC 62608882
Unclassified1Chain Zgi|23035024,6628.23Bos taurus316296

