
A Structure Identification and Toxicity Assessment of the Degradation Products of Aflatoxin B1 in Peanut Oil under UV Irradiation


Abstract
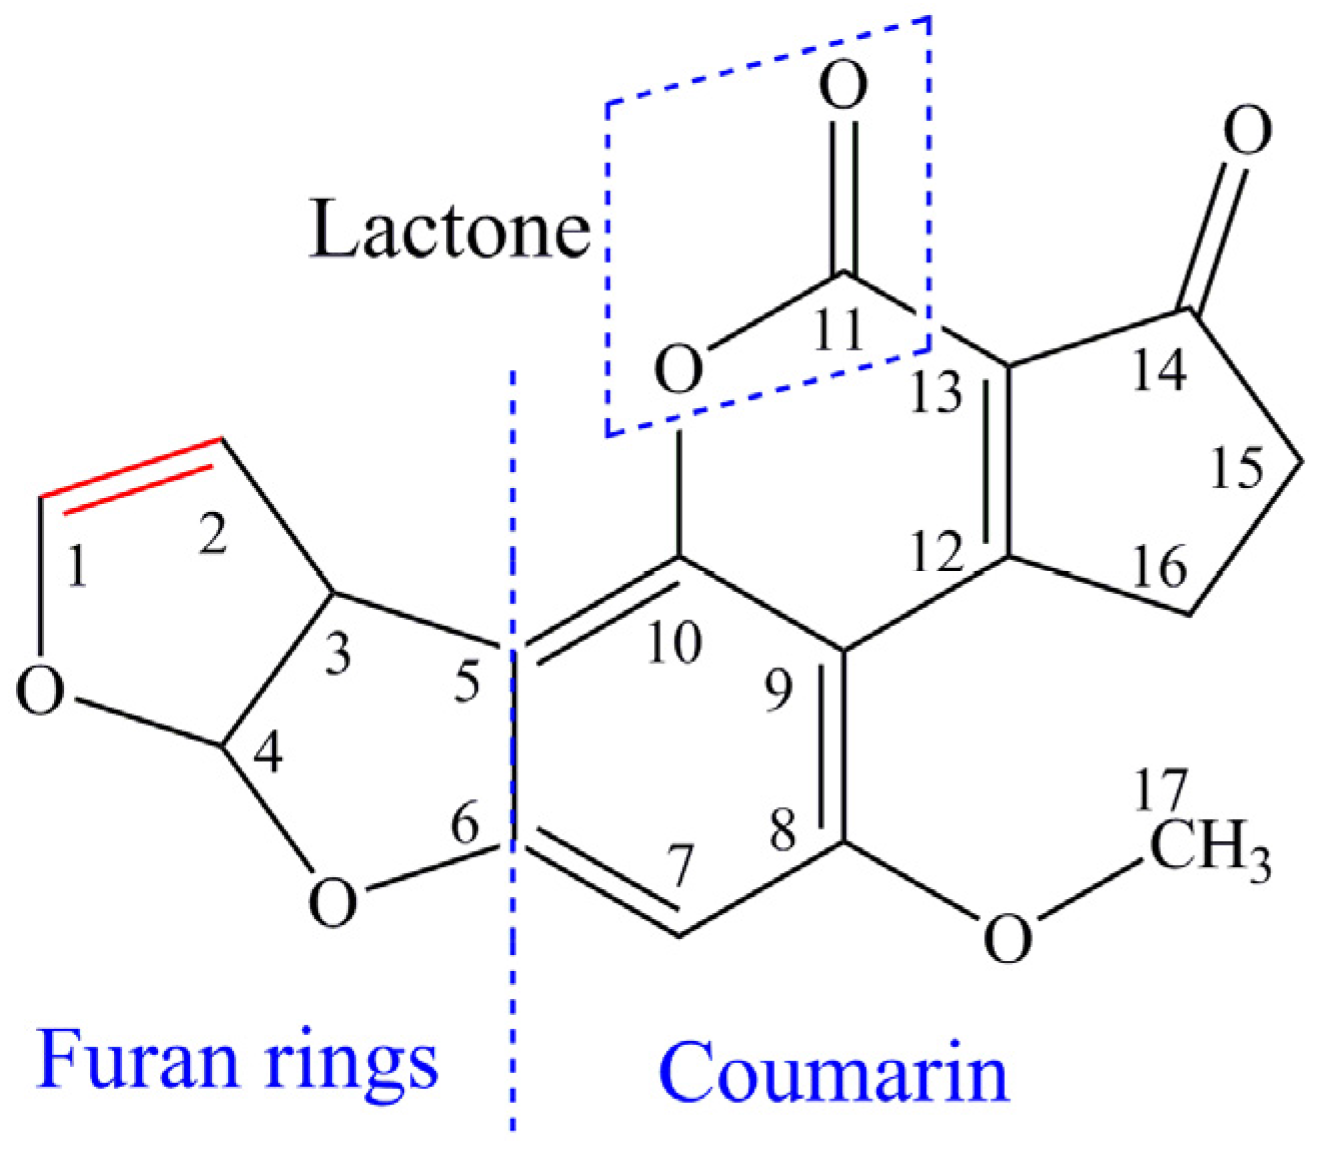
:1. Introduction
2. Results and Discussions
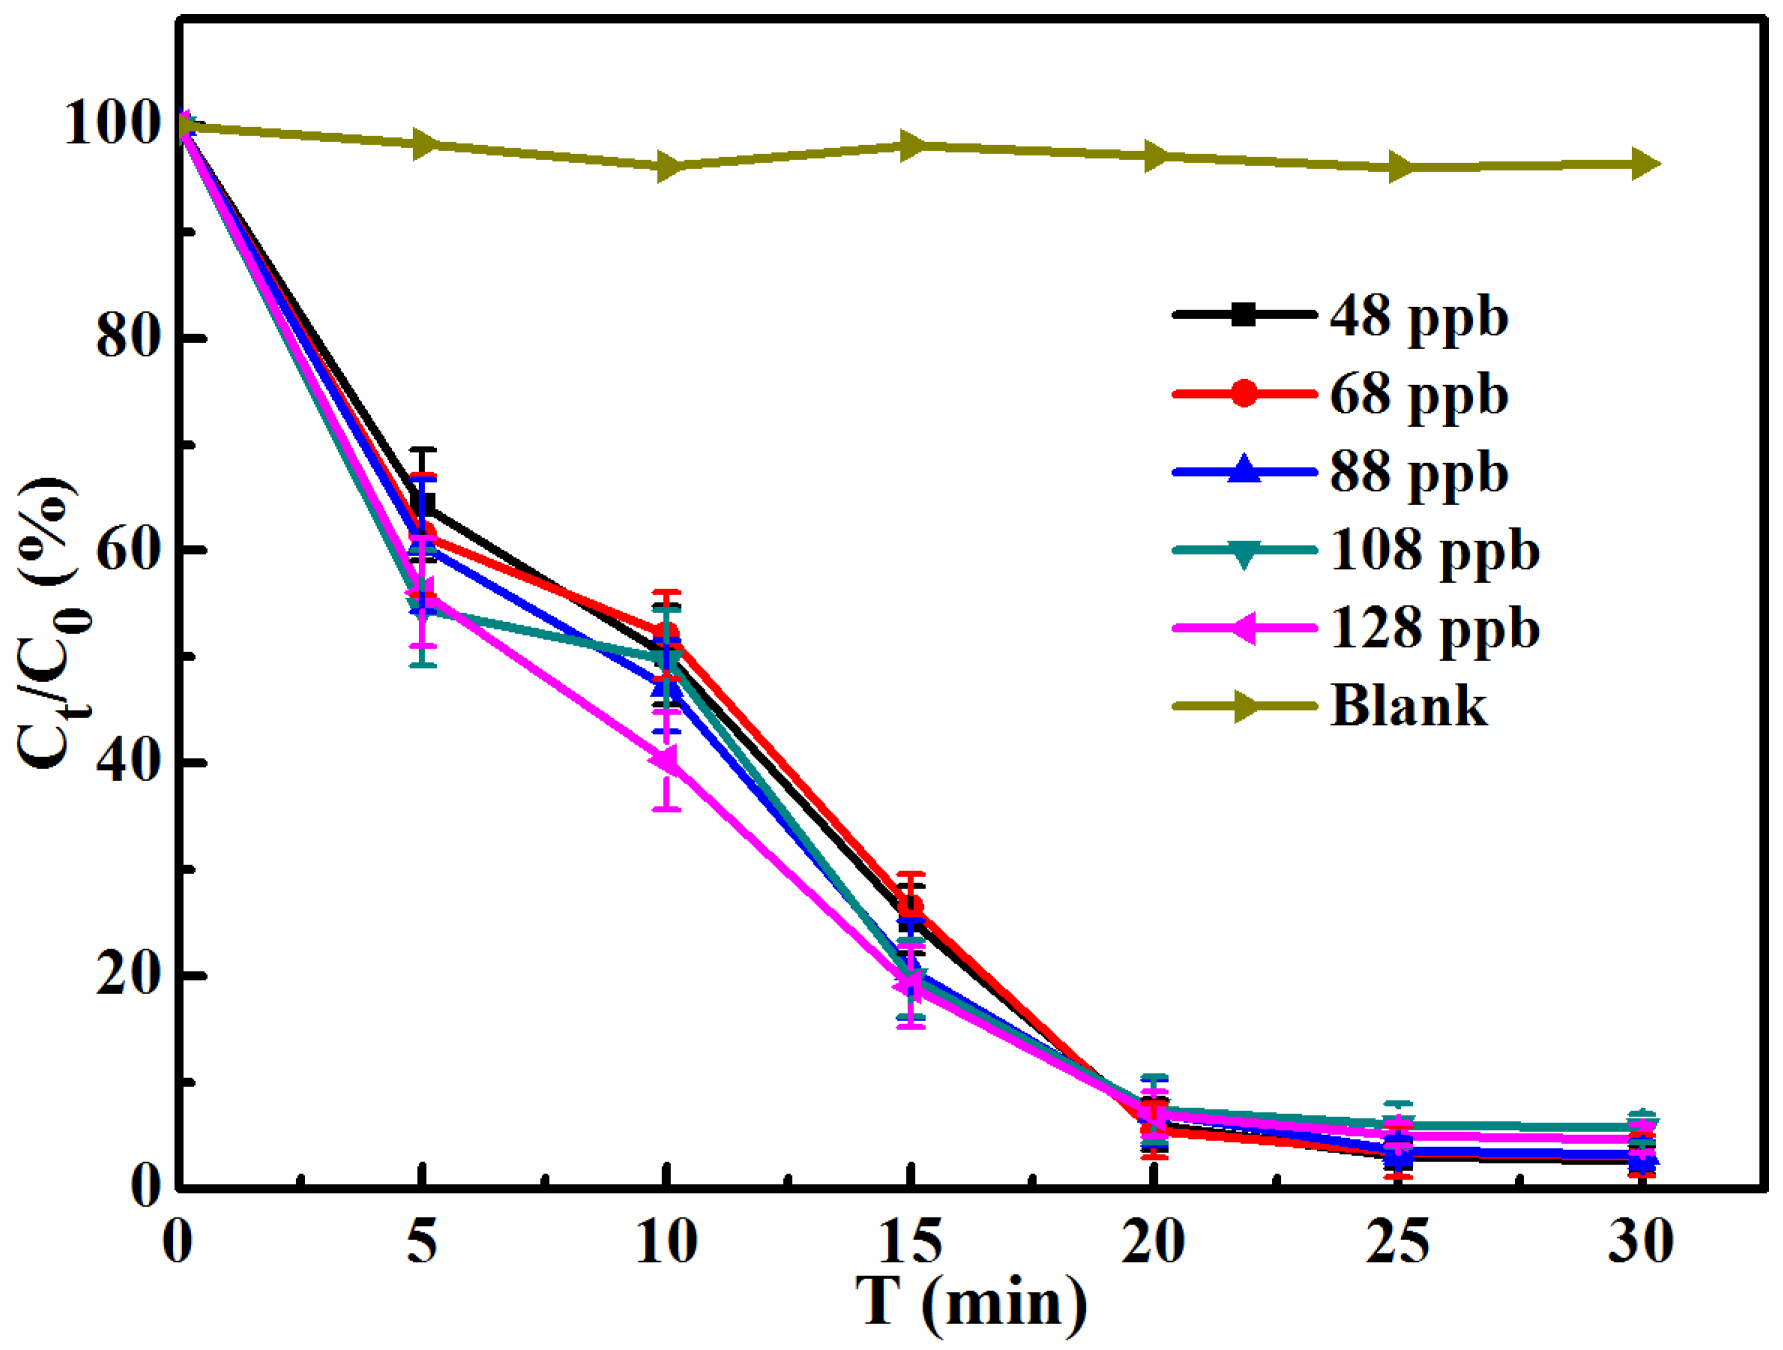
2.1. Effect of the AFB1 Initial Concentration on Degradation Performance in Peanut Oil
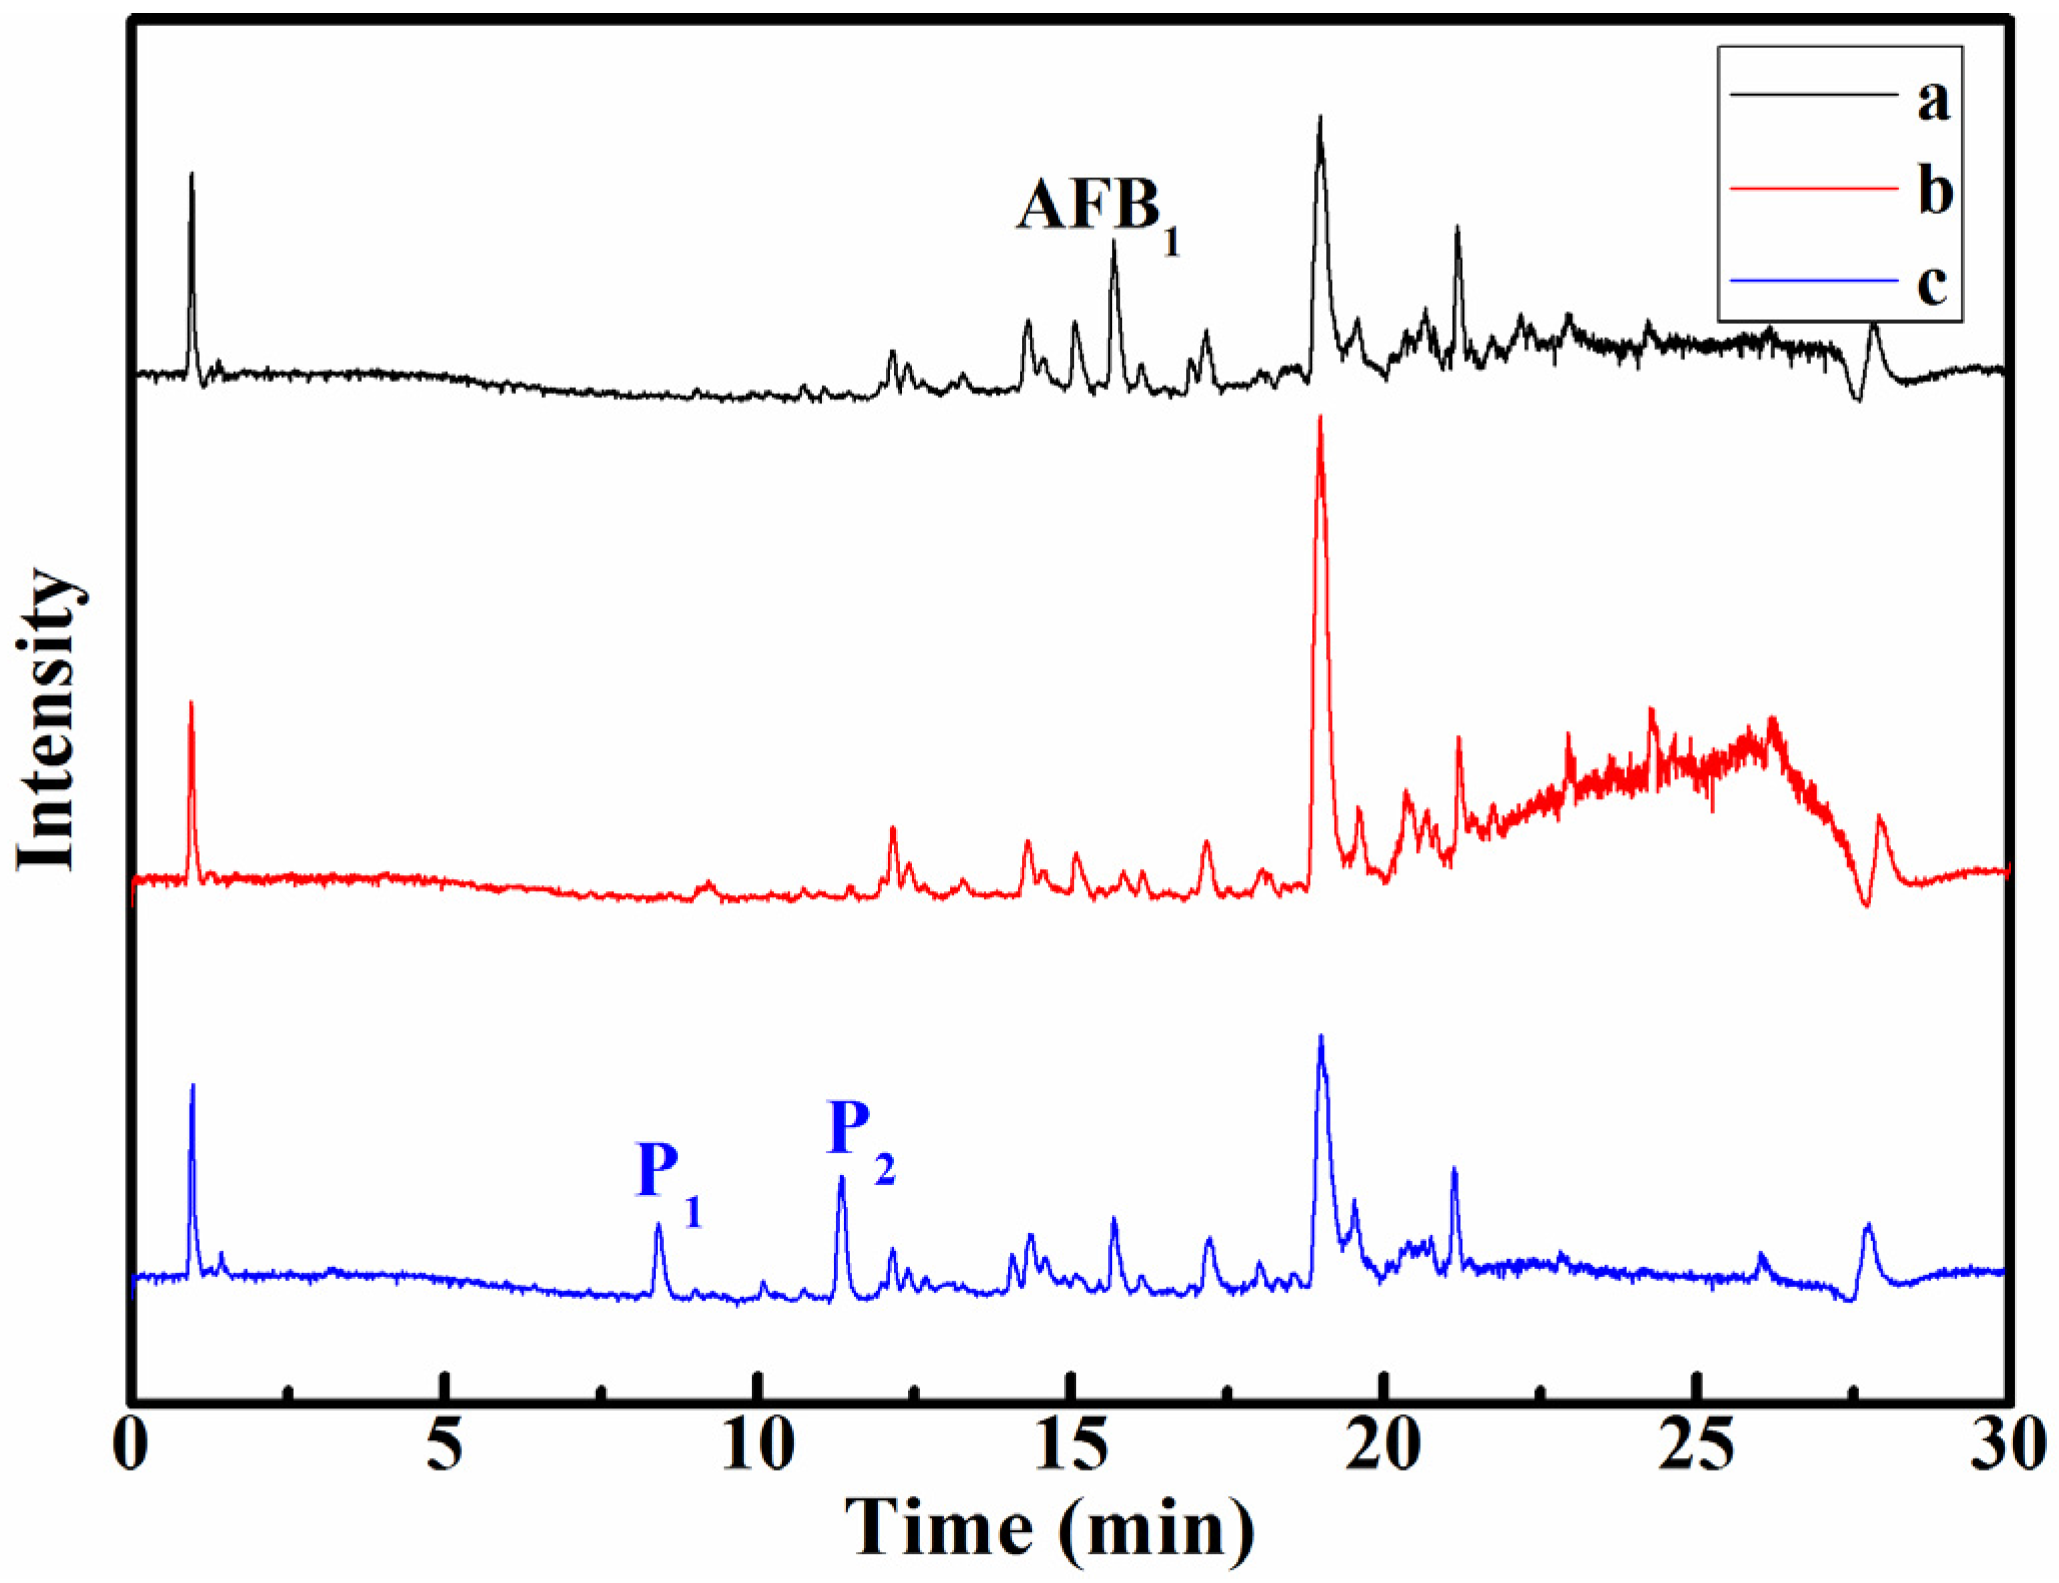
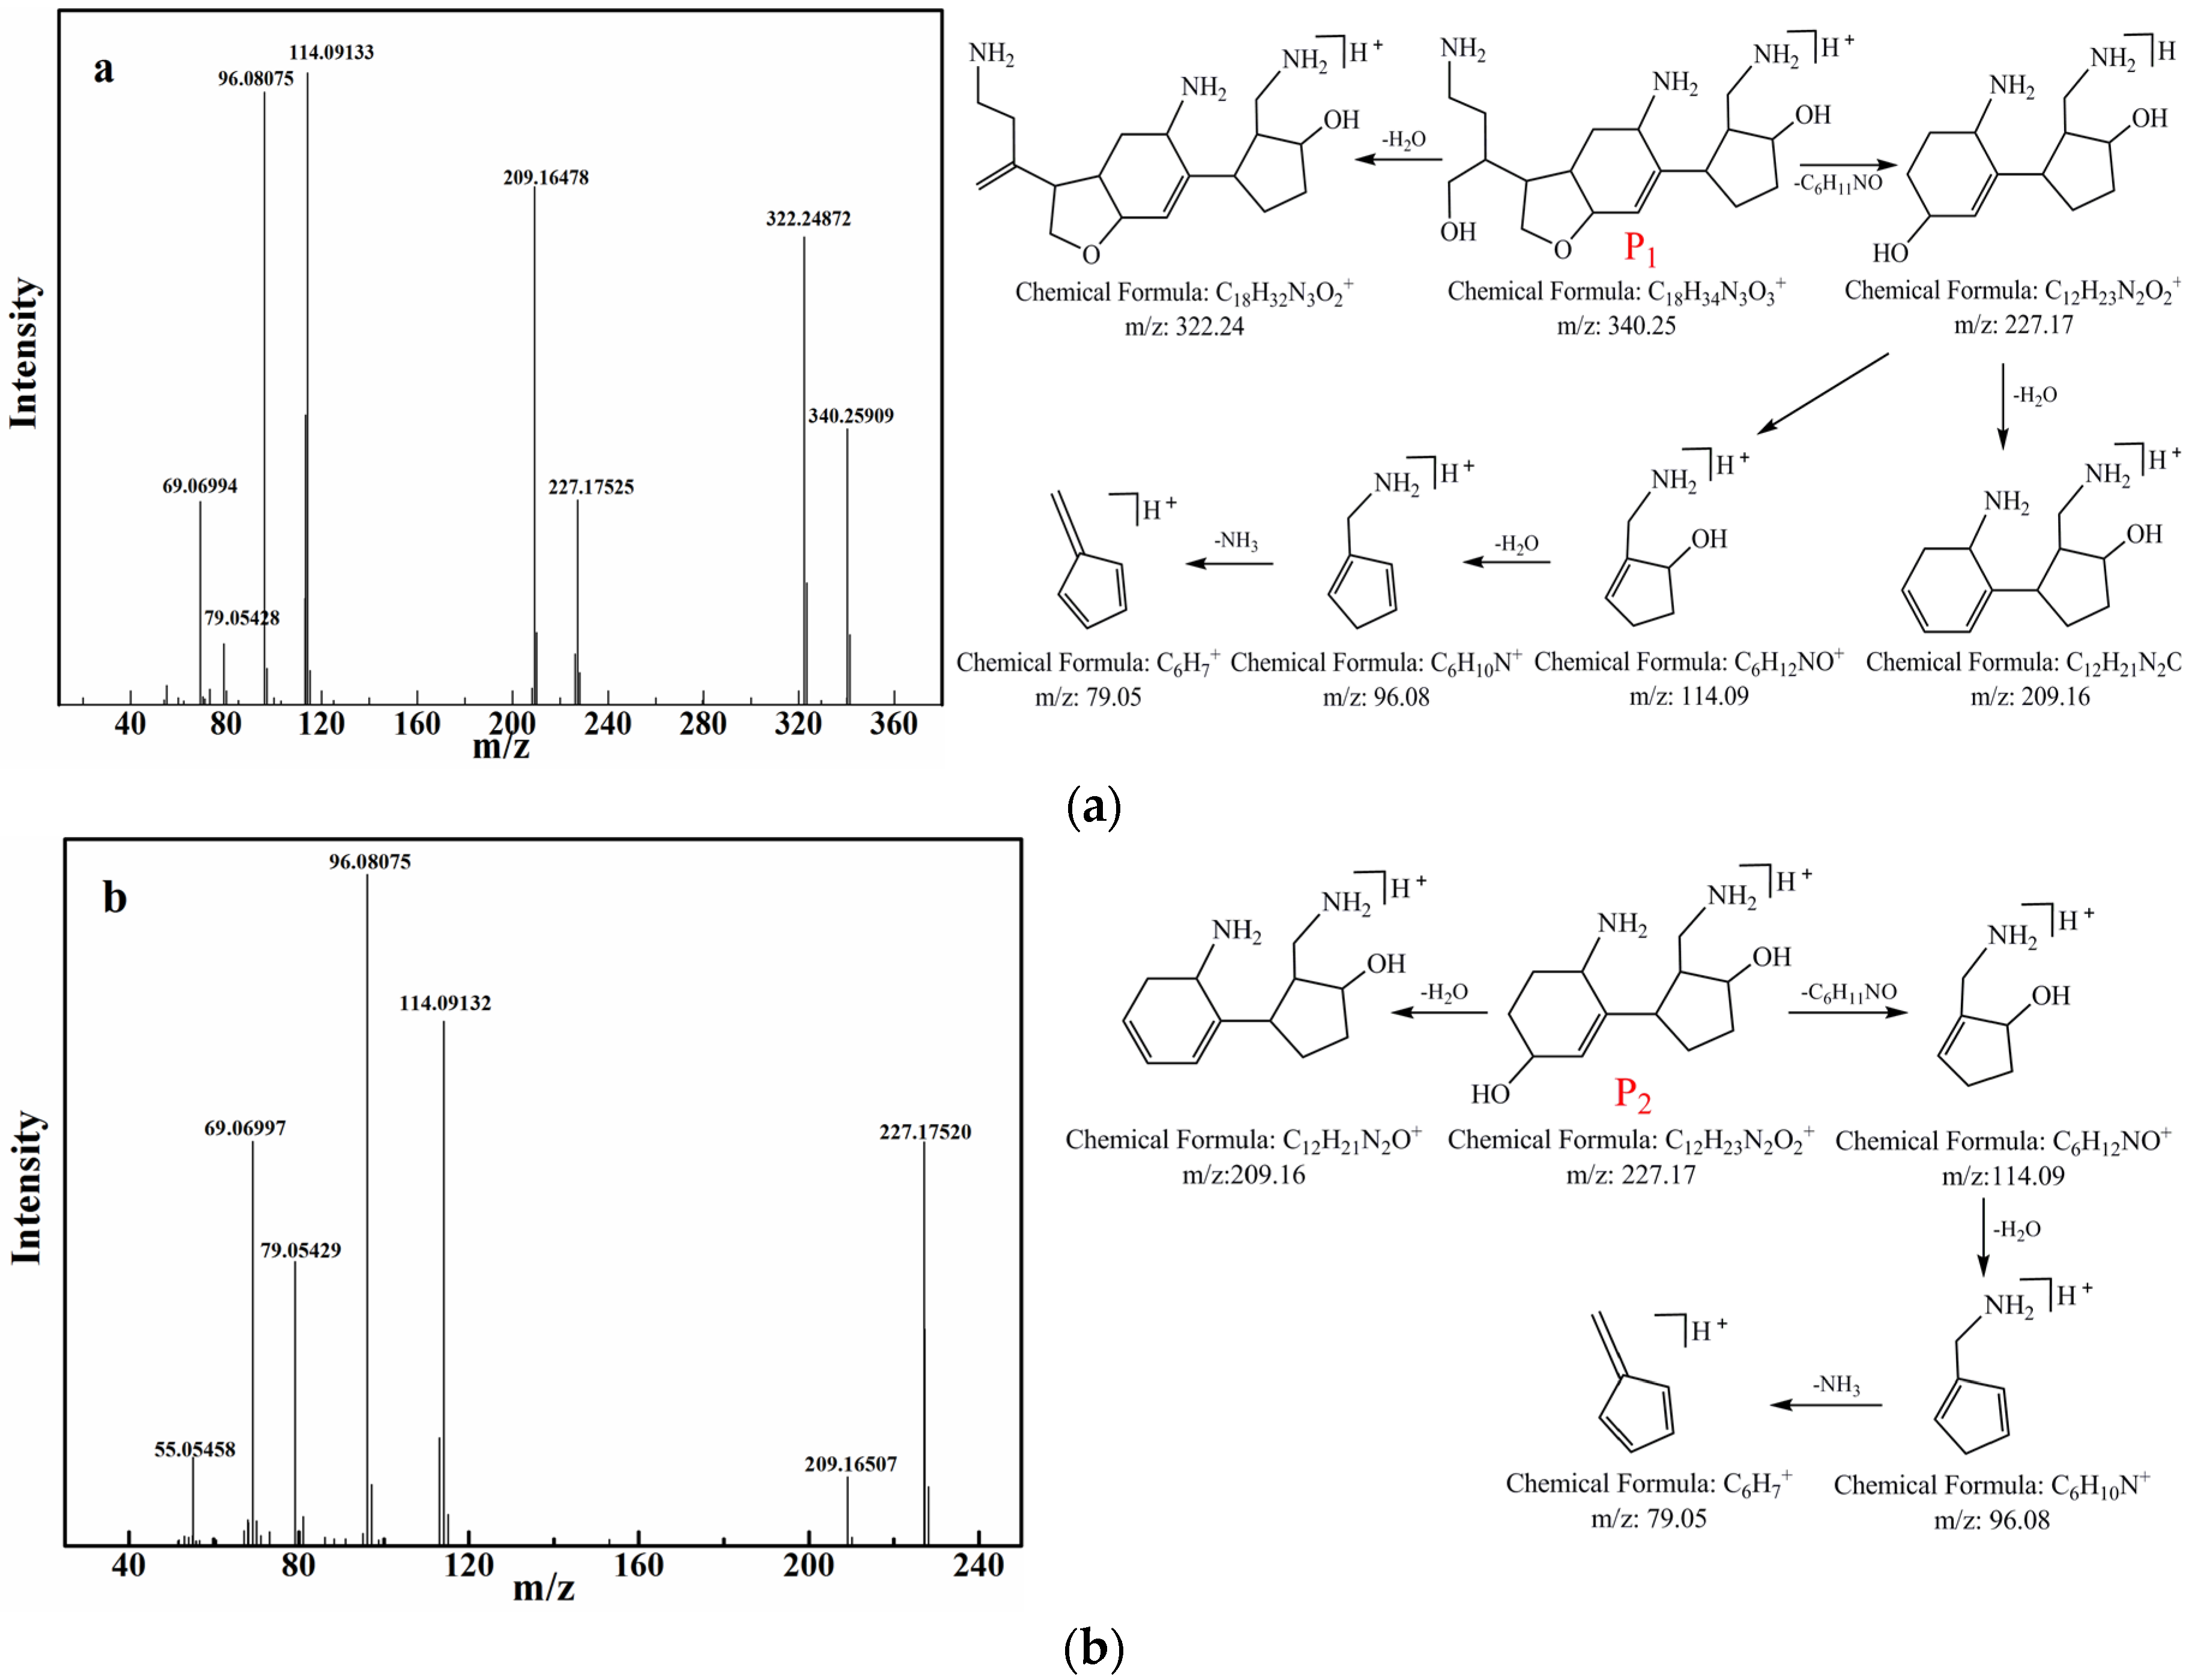
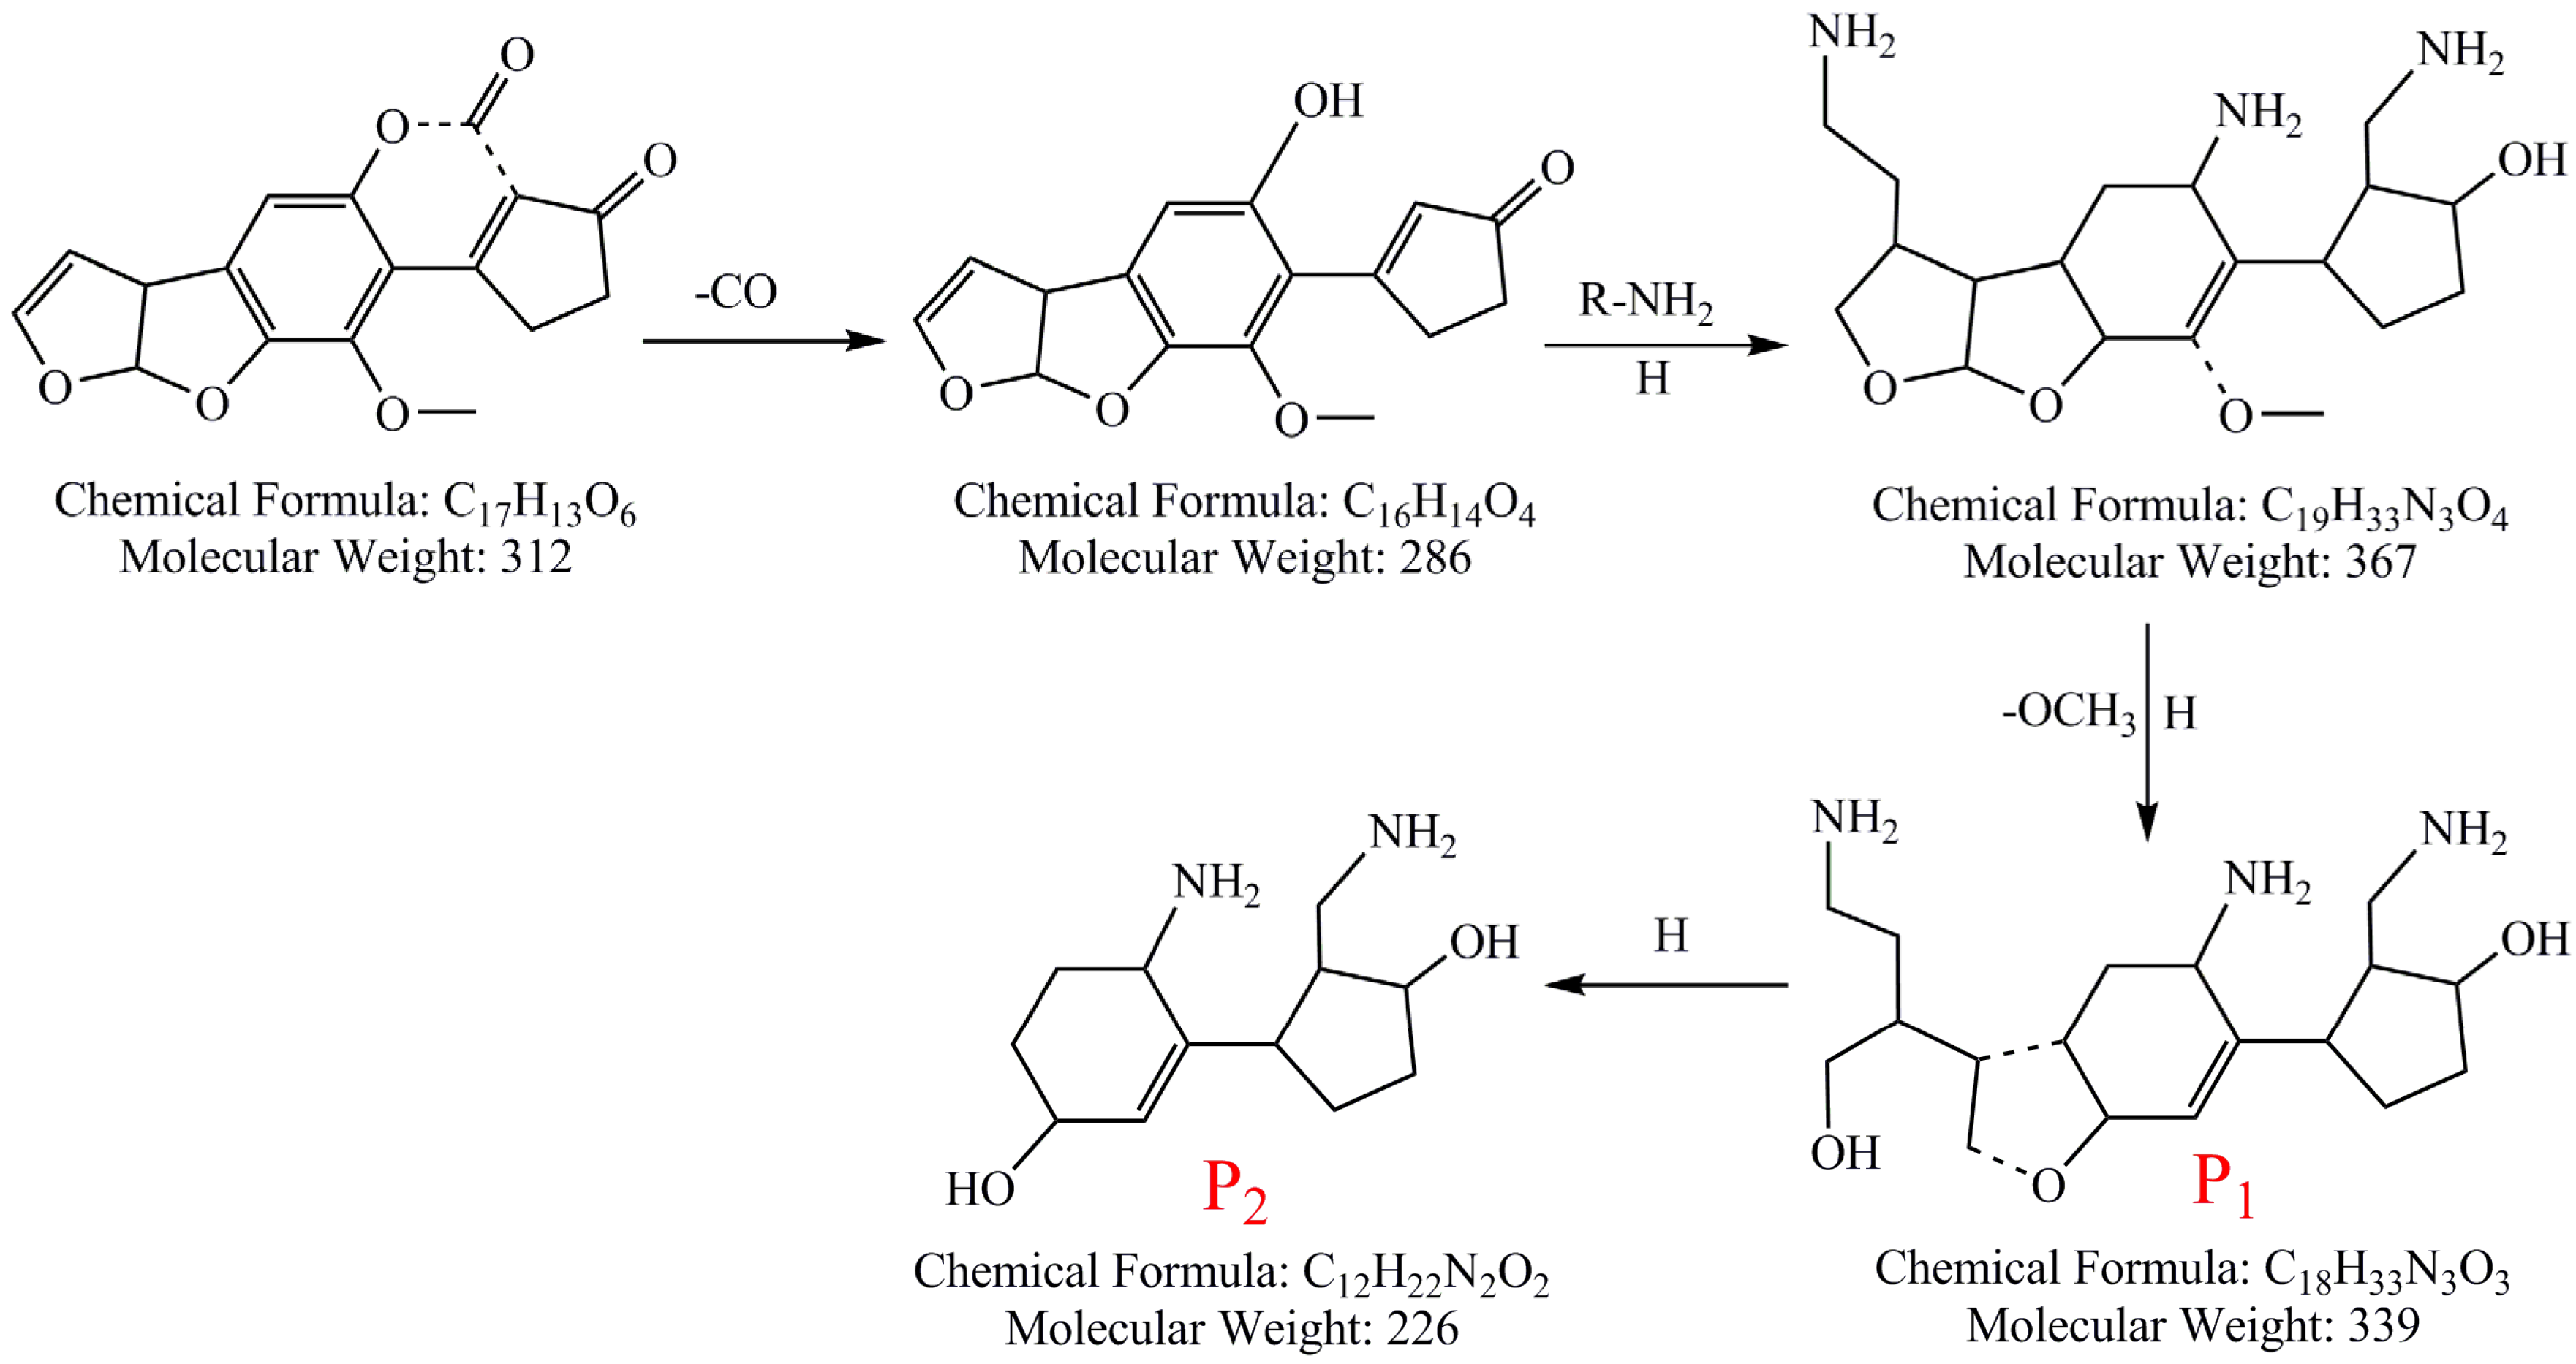
2.2. Identification of Photodegradation Products of AFB1 in Peanut Oil
2.3. Proposed Pathway of AFB1 under UV Irradiation in Peanut Oil
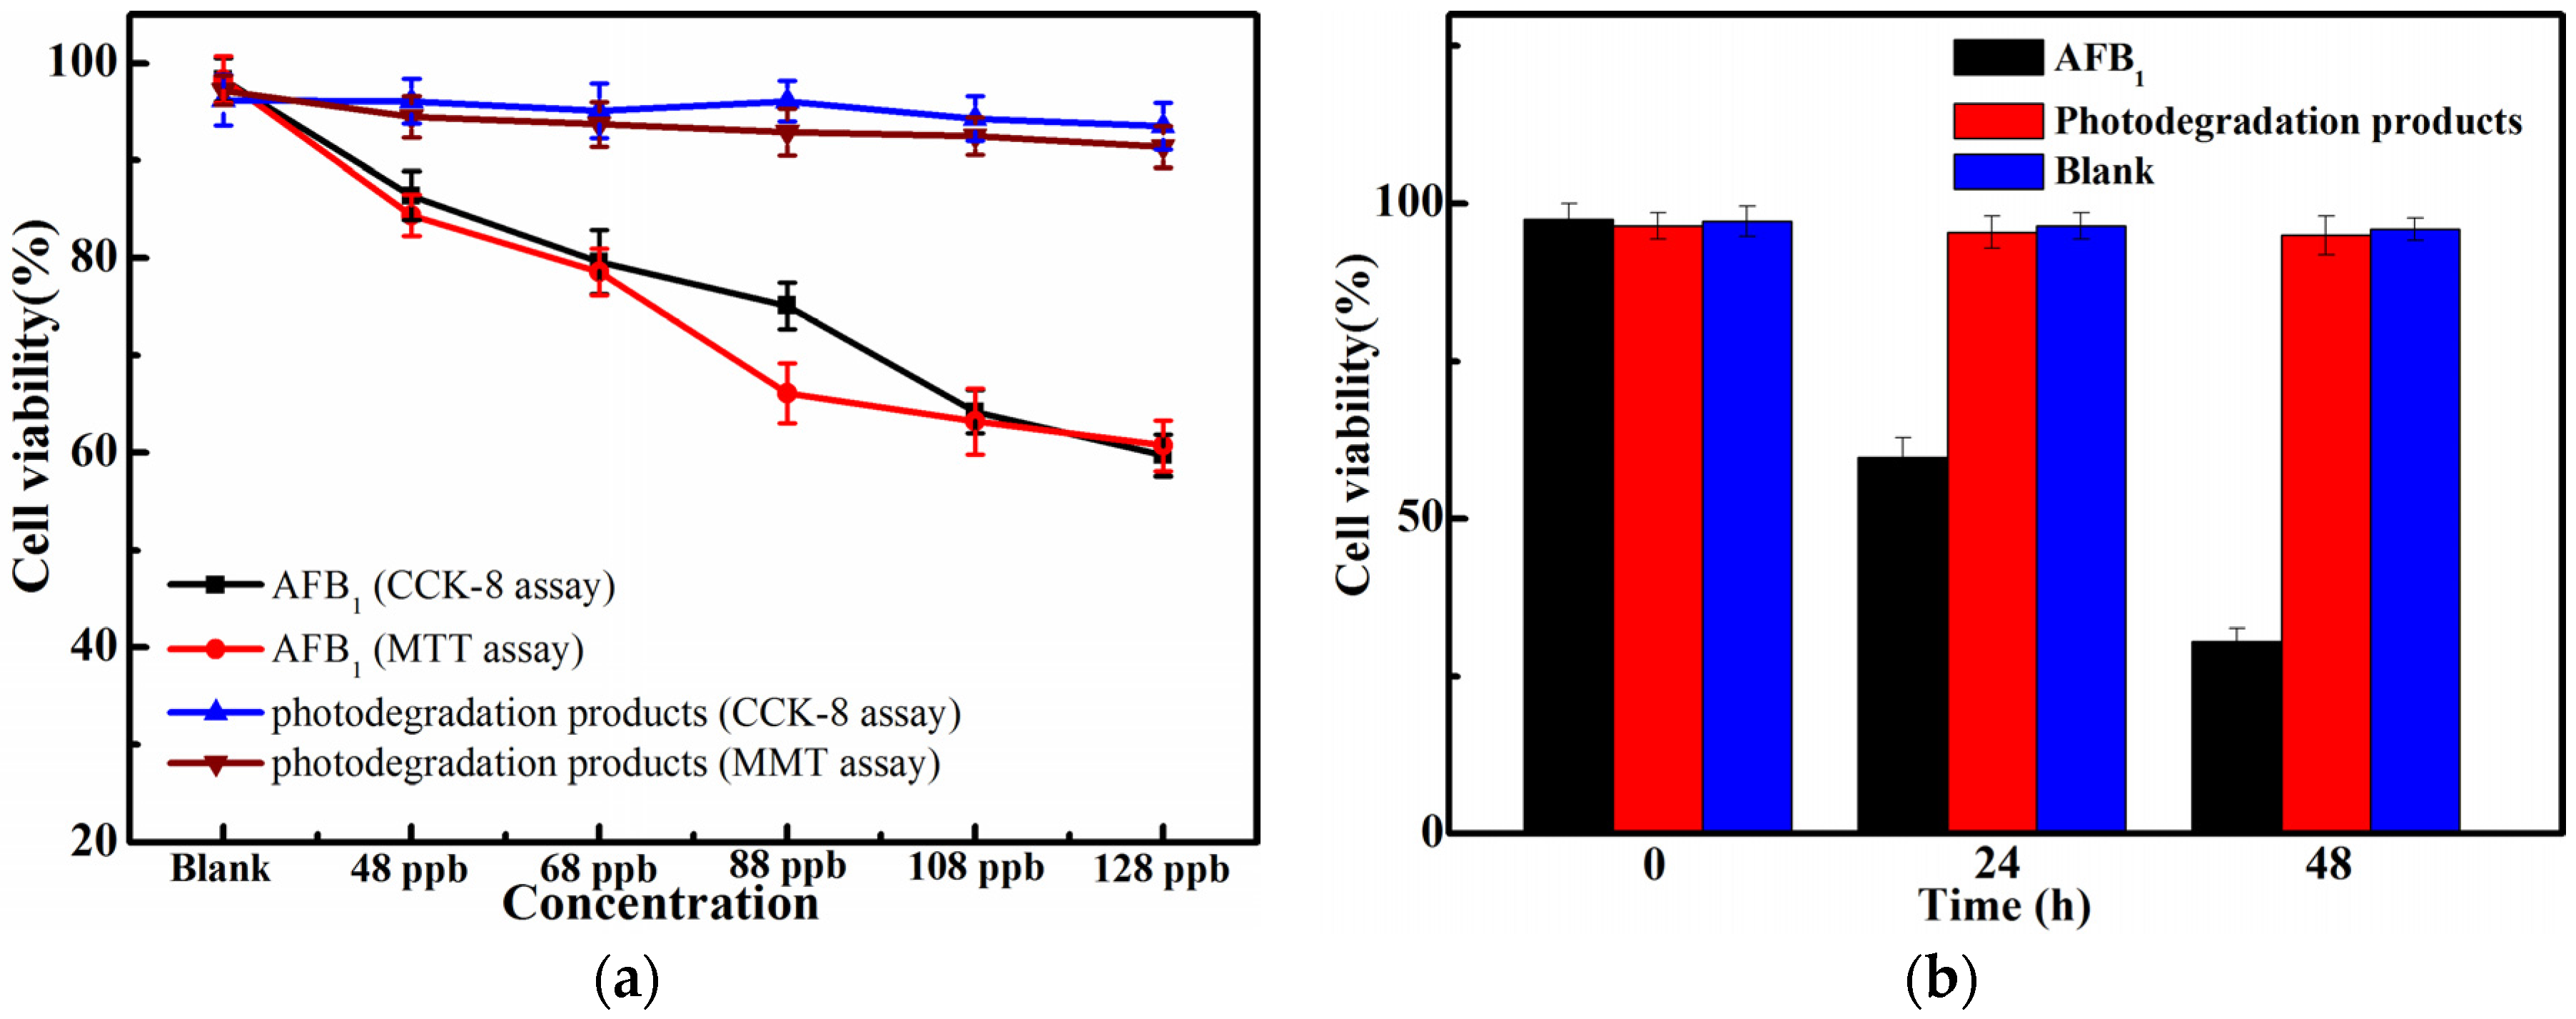
2.4. Cell Viability Assay of AFB1 and Its Photodegradation Products
3. Conclusions
4. Materials and Methods
4.1. Materials and Synthesis
4.2. Photodegradation Treatment
4.2.1. Extraction and Instrumental Analysis for AFB1 in Peanut Oil
4.2.2. Test Compounds of Photodegradation Products
4.3. Cell Viability Assay
4.3.1. Cell Culture
4.3.2. Cell Viability Assay
Acknowledgments
Author Contributions
Conflicts of Interest
References
- Wee, J.; Day, D.M.; Linz, J.E. Effects of zinc chelators on aflatoxin production in Aspergillus parasiticus. Toxins 2016, 8, 171. [Google Scholar] [CrossRef] [PubMed]
- Torres, A.M.; Barros, G.G.; Palacios, S.A.; Chulze, S.N.; Battilani, P. Review on pre- and post-harvest management of peanuts to minimize aflatoxin contamination. Food Res. Int. 2014, 62, 11–19. [Google Scholar] [CrossRef]
- Monograph on the evaluation of carcinogenic risks to humans. IARC, International Agency for Research on Cancer (IARC); World Health Organization: Lyon, France, 2002; Volume 171, p. 82. [Google Scholar]
- Rustom, I.Y.S. Aflatoxin in food and feed: Occurrence, legislation and inactivation by physical methods. Food Chem. 1997, 59, 57–67. [Google Scholar] [CrossRef]
- Kang, F.X.; Ge, Y.Y.; Hu, X.J.; Goikavi, C.; Waigi, M.G.; Gao, Y.Z.; Ling, W.T. Understanding the sorption mechanisms of aflatoxin B1 to kaolinite, illite, and smectite clays via a comparative computational study. J. Hazard Mater. 2016. [Google Scholar] [CrossRef] [PubMed]
- Chen, R.; Ma, F.; Li, P.W.; Zhang, W.; Ding, X.X.; Zhang, Q.; Li, M.; Wang, Y.R.; Xu, B.C. Effect of ozone on aflatoxins detoxification and nutritional quality of peanuts. Food Chem. 2014, 146, 284–288. [Google Scholar] [CrossRef] [PubMed]
- Alberts, J.F.; Engelbrecht, Y.; Steyn, P.S.; Holzapfel, W.H.; van Zyl, W.H. Biological degradation of aflatoxin B1 by Rhodococcus erythropolis culture. Int. J. Food Microbiol. 2006, 109, 121–126. [Google Scholar] [CrossRef] [PubMed]
- Samarajeewa, U.; Sen, A.C.; Couen, M.D.; Wei, C.I. Detoxification of aflatoxins in foods and feeds by physical and chemical methods. J. Food Prot. 1990, 53, 489–501. [Google Scholar]
- Liu, R.J.; Jin, Q.Z.; Huang, J.H.; Liu, Y.F.; Wang, X.G.; Mao, W.Y.; Wang, S.S. Photodegradation of aflatoxin B1 in peanut oil. Eur. Food Res. Technol. 2011, 232, 843–849. [Google Scholar] [CrossRef]
- Tripathi, S.; Mishra, H.N. Enzymatic coupled with UV degradation aflatoxin B1 in red chili powder. J. Food Qual. 2010, 33, 186–203. [Google Scholar] [CrossRef]
- Wang, B.; Mahoney, N.E.; Pan, Z.L.; Khir, R.; Wu, B.G.; Ma, H.L.; Zhao, L.M. Effectiveness of pulsed light treatment for degradation and detoxification of aflatoxin B1 and B2 in rough rice and rice bran. Food Control 2016, 59, 461–467. [Google Scholar] [CrossRef]
- Liu, R.J.; Jin, Q.Z.; Tao, G.J.; Shan, L.; Huang, J.H.; Liu, Y.F.; Wang, X.G.; Mao, W.Y.; Wang, S.S. Photodegradation kinetics and byproducts identification of the aflatoxin B1 in aqueous medium by ultra-performance liquid chromatography-quadrupole time-of-flight mass spectrometry. J. Mass. Spectrom. 2010, 45, 553–559. [Google Scholar] [CrossRef] [PubMed]
- Liu, R.J.; Jin, Q.Z.; Tao, G.J.; Huang, J.H.; Liu, Y.F.; Wang, X.G.; Zhou, X.L.; Mao, W.Y.; Wang, S.S. In vitro toxicity of aflatoxin B1 and its photodegradation products in HepG2 cells. J. Appl. Toxicol. 2012, 32, 276–281. [Google Scholar] [CrossRef] [PubMed]
- Liu, R.J.; Jin, Q.Z.; Tao, G.J.; Shan, L.; Liu, Y.F.; Wang, X. LC-MS and UPLC-Quadrupole time-of-flight MS for identification of photodegradation products of aflatoxin B1. Chromatographia 2007, 71, 107–112. [Google Scholar] [CrossRef]
- Gawade, S.P. Photodynamic studies on aflatoxin B1 using UV radiation in the presence of methylene blue. Indian J. Pharm. Educ. Res. 2010, 44, 142–147. [Google Scholar]
- Diao, E.J.; Shen, X.Z.; Zhang, Z.; Ji, N.; Ma, W.W.; Dong, H.Z. Safety evaluation of aflatoxin B1 in peanut oil after ultraviolet irradiation detoxification in a photodegradation reactor. Int. J. Food Sci. Tech. 2015, 50, 41–47. [Google Scholar] [CrossRef]
- Netto-Ferreira, J.C.; Heyne, B.; Scaiano, J.C. Photophysics and photochemistry of aflatoxins B1 and B2. Photochem. Photobiol. Sci. 2011, 10, 1701–1708. [Google Scholar] [CrossRef] [PubMed]
- Gosetti, F.; Bolfi, B.; Manfredi, M.; Calabrese, G.; Marengo, E. Determination of eight polyphenols and pantothenic acid in extra-virgin olive oil samples by a simple, fast, high-throughput and sensitive ultra high performance liquid chromatography with tandem mass spectrometry method. J. Sep. Sci. 2015, 38, 3130–3136. [Google Scholar] [CrossRef] [PubMed]
- Shi, R.; Guo, Y.; Vriesekoop, F.; Yuan, Q.P.; Zhao, S.H.; Liang, H. Improving oxidative stability of peanut oil under microwave treatment and deep fat frying by stearic acid-surfacant-tea polyphenols complex. Eur. J. Lipid Sci. Technol. 2015, 117, 1008–1015. [Google Scholar] [CrossRef]
- Iram, W.; Anjum, T.; Iqbal, M.; Ghaffar, A.; Abbas, M. Mass spectrometric identification and toxicity assessment of degraded products of aflatoxin B1 and B2 by Corymbia citriodora aqueous extracts. Sci. Rep. 2015, 5. [Google Scholar] [CrossRef] [PubMed]
- Suban, P.; Chen, Z. Elements of Photochemistry; People’s Education Press: Beijing, China, 1982; p. 36. [Google Scholar]
- Wogan, G.N.; Edwards, G.S.; Newberne, P.M. Structure-activity relationships in toxicity and carcinogenicity of aflatoxins and analogs. Cancer Res. 1971, 31, 1936–1942. [Google Scholar] [PubMed]
- Verma, R.J. Aflatoxin cause DNA damage. Int. J. Hum. Genet. 2004, 4, 231–236. [Google Scholar]
- Mishra, H.N.; Das, C. A review on biological control and metabolism of aflatoxin. Crit. Rev. Food Sci. 2003, 43, 245–264. [Google Scholar] [CrossRef] [PubMed]
- Wang, F.; Xie, F.; Xue, X.F.; Wang, Z.D.; Fan, B.; Ha, Y.M. Structure elucidation and toxicity analyses of the radiolytic products of aflatoxin B1 in methyl alcohol-water solution. J. Hazard. Mater. 2011, 192, 1192–1202. [Google Scholar] [CrossRef] [PubMed]
- Lee, L.S.J.; Dunn, J.; Delucca, A.J.; Ciegler, A. Role of lactone ring of aflatoxin B1 in toxicity and mutagenicity. Experientia 1981, 37, 16–17. [Google Scholar] [CrossRef] [PubMed]


| Theoretical Mass | Experimental Mass | Fragment Formula | Mass Error (ppm) |
|---|---|---|---|
| 79.05478 | 79.05429 | C6H7 | −6.19823 |
| 79.05478 | 79.05428 | C6H7 | −6.32473 |
| 96.08132 | 96.08075 | C6H10N | −5.93247 |
| 114.09189 | 114.09132 | C6H12NO | −4.99597 |
| 114.09189 | 114.09133 | C6H12NO | −4.90832 |
| 209.16539 | 209.16478 | C12H21N2O | −2.91635 |
| 209.16539 | 209.16507 | C12H21N2O | −1.52989 |
| 227.17595 | 227.17520 | C12H23N2O2 | −3.30141 |
| 227.17595 | 227.17525 | C12H23N2O2 | −3.08131 |
| 340.26002 | 340.25909 | C18H34N3O3 | −2.73320 |
© 2016 by the authors; licensee MDPI, Basel, Switzerland. This article is an open access article distributed under the terms and conditions of the Creative Commons Attribution (CC-BY) license (http://creativecommons.org/licenses/by/4.0/).
Share and Cite
Mao, J.; He, B.; Zhang, L.; Li, P.; Zhang, Q.; Ding, X.; Zhang, W. A Structure Identification and Toxicity Assessment of the Degradation Products of Aflatoxin B1 in Peanut Oil under UV Irradiation. Toxins 2016, 8, 332. https://0-doi-org.brum.beds.ac.uk/10.3390/toxins8110332
Mao J, He B, Zhang L, Li P, Zhang Q, Ding X, Zhang W. A Structure Identification and Toxicity Assessment of the Degradation Products of Aflatoxin B1 in Peanut Oil under UV Irradiation. Toxins. 2016; 8(11):332. https://0-doi-org.brum.beds.ac.uk/10.3390/toxins8110332
Chicago/Turabian StyleMao, Jin, Bing He, Liangxiao Zhang, Peiwu Li, Qi Zhang, Xiaoxia Ding, and Wen Zhang. 2016. "A Structure Identification and Toxicity Assessment of the Degradation Products of Aflatoxin B1 in Peanut Oil under UV Irradiation" Toxins 8, no. 11: 332. https://0-doi-org.brum.beds.ac.uk/10.3390/toxins8110332