Article

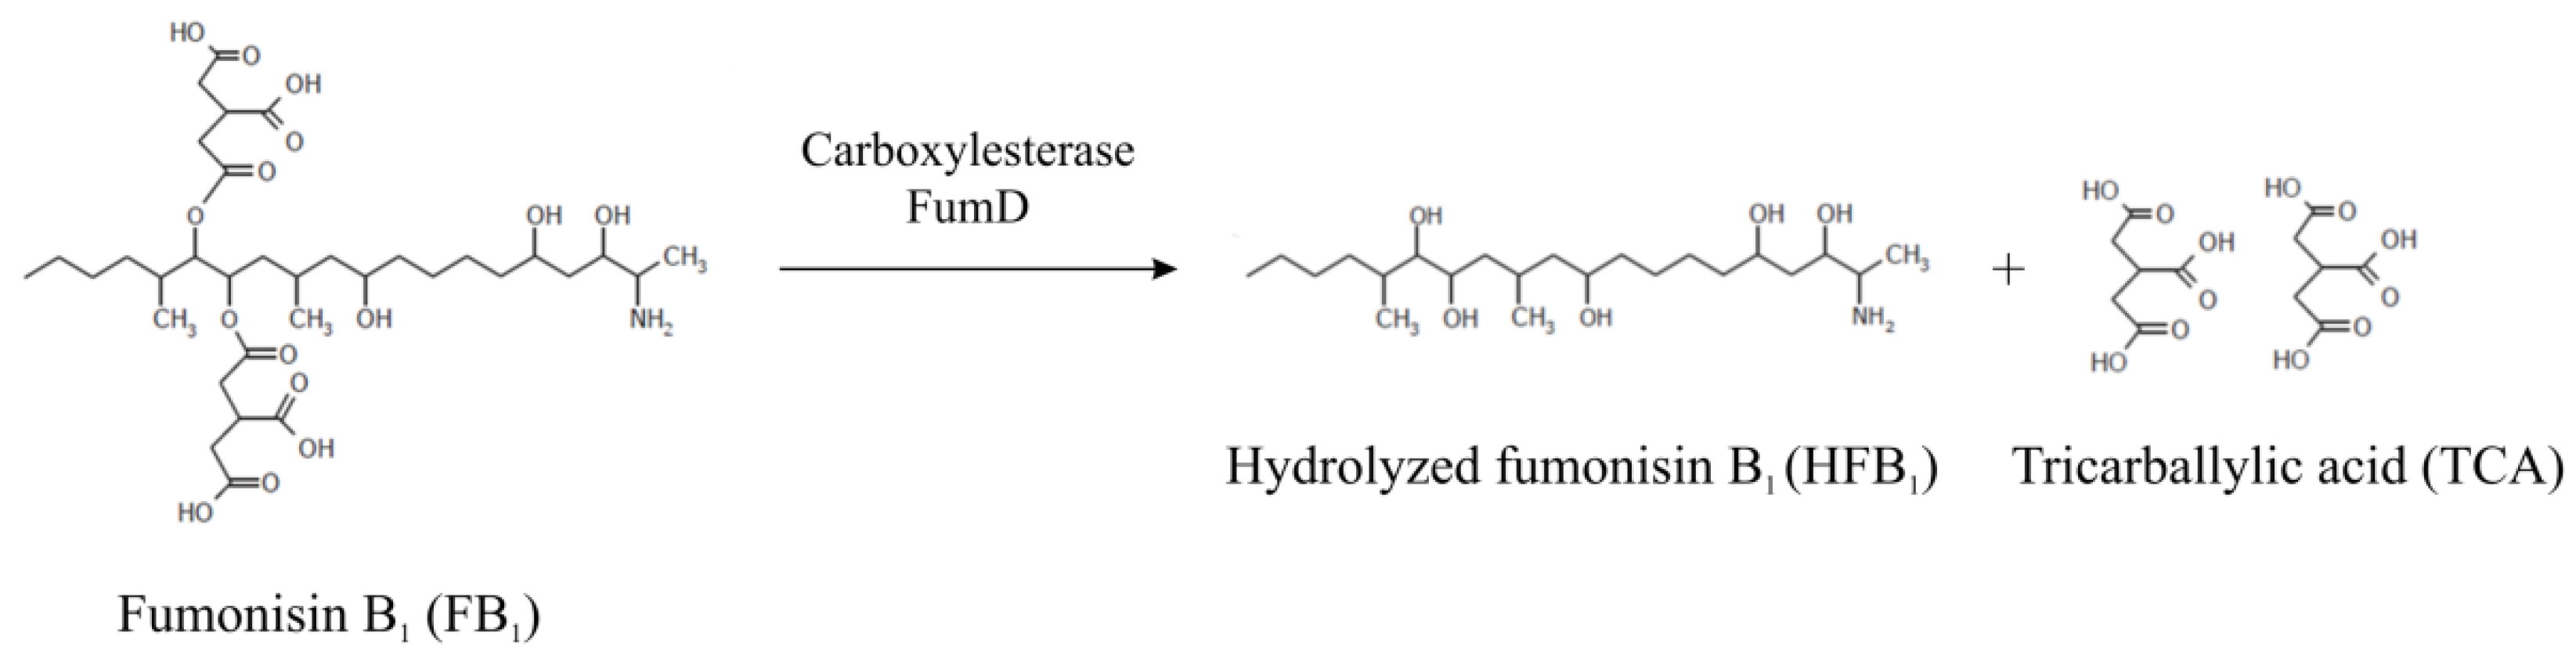
Gastrointestinal Degradation of Fumonisin B1 by Carboxylesterase FumD Prevents Fumonisin Induced Alteration of Sphingolipid Metabolism in Turkey and Swine

by
Sabine Masching
1,
Karin Naehrer
1,
Heidi-Elisabeth Schwartz-Zimmermann
2,*,
Mihai Sărăndan
3,
Simone Schaumberger
1,
Ilse Dohnal
4,
Veronika Nagl
4 and
Dian Schatzmayr
4
1
BIOMIN Holding GmbH, Erber Campus 1, 3131 Getzersdorf, Austria
2
Christian Doppler Laboratory for Mycotoxin Metabolism, Center for Analytical Chemistry, Department for Agrobiotechnology (IFA-Tulln), University of Natural Resources and Life Sciences, Vienna (BOKU), Konrad Lorenz Str. 20, 3430 Tulln, Austria
3
Faculty of Veterinary Medicine Timișoara, Calea Aradului 119, 300645 Timișoara, Romania
4
BIOMIN Research Center, Technopark 1, 3430 Tulln, Austria
*
Author to whom correspondence should be addressed.
Submission received: 1 February 2016 / Revised: 3 March 2016 / Accepted: 14 March 2016 / Published: 21 March 2016
(This article belongs to the Collection Fusarium Toxins – Relevance for Human and Animal Health)

Abstract

:
The mycotoxin fumonisin B1 (FB1) is a frequent contaminant of feed and causes various adverse health effects in domestic animals. Hence, effective strategies are needed to prevent the impact of fumonisins on livestock productivity. Here we evaluated the capability of the fumonisin carboxylesterase FumD to degrade FB1 to its less toxic metabolite hydrolyzed FB1 (HFB1) in the gastrointestinal tract of turkeys and pigs. First, an ex vivo pig model was used to examine the activity of FumD under digestive conditions. Within 2 h of incubation with FumD, FB1 was completely degraded to HFB1 in the duodenum and jejunum, respectively. To test the efficacy of the commercial application of FumD (FUMzyme) in vivo, female turkeys (n = 5) received either basal feed (CON), fumonisin-contaminated feed (15 mg/kg FB1+FB2; FB) or fumonisin-contaminated feed supplemented with FUMzyme (15 U/kg; FB+FUMzyme) for 14 days ad libitum. Addition of FUMzyme resulted in significantly decreased levels of FB1 in excreta, whereas HFB1 concentrations were significantly increased. Compared to the FB group (0.24 ± 0.02), the mean serum sphinganine-to-sphingosine (Sa/So) ratio was significantly reduced in the FB+FUMzyme group (0.19 ± 0.02), thus resembling values of the CON group (0.16 ± 0.02). Similarly, exposure of piglets (n = 10) to 2 mg/kg FB1+FB2 for 42 days caused significantly elevated serum Sa/So ratios (0.39 ± 0.15) compared to the CON group (0.14 ± 0.01). Supplementation with FUMzyme (60 U/kg) resulted in gastrointestinal degradation of FB1 and unaffected Sa/So ratios (0.16 ± 0.02). Thus, the carboxylesterase FumD represents an effective strategy to detoxify FB1 in the digestive tract of turkeys and pigs.

1. Introduction

Fumonisins are a group of mycotoxins mainly produced by Fusarium verticillioides and F. proliferatum. Numerous fumonisin analogues have been identified so far, among them fumonisin B1 (FB1), fumonisin B2 (FB2), and fumonisin B3 (FB3) [1]. Based on both prevalence and toxicity, FB1 is clearly the most relevant [2]. The major agricultural commodity affected by fumonisins is maize [3]. Recent surveys highlight the widespread prevalence of FB1 (56%) in feed and feed raw materials, with concentrations in individual samples reaching levels up to 77.5 mg/kg FB1 [4]. Yet, average FB1 concentrations in contaminated feed samples are markedly lower and range from 0.3 mg/kg to 2.0 mg/kg depending on the region [5].
Although FB1 is poorly bioavailable in all investigated species, it induces genotoxic, neurotoxic, nephrotoxic, and carcinogenic effects [3], a phenomenon also referred to as the “fumonisin paradox” [6]. Fumonisin toxicity is mainly based on an inhibition of the enzyme ceramide synthase, which causes a disruption of the sphingolipid metabolism [7]. The resulting alterations in levels of the free sphingoid bases sphinganine (Sa) and sphingosine (So) are reflected by an elevated sphinganine-to-sphingosine (Sa/So) ratio. In experimental animal models, the Sa/So ratio, determined in serum, urine, or various tissues, serves as a specific biomarker for FB1 exposure (biomarker of effect) [2]. In livestock, exposure to FB1 can cause lethal syndromes such as equine leukoencephalomalacia (ELEM) or porcine pulmonary edema (PPE) [8,9]. In addition, FB1 increases the susceptibility to pathogens such as Bordetella bronchiseptica, Pasteurella multocida, or porcine reproductive and respiratory syndrome virus and enhances the severity of related diseases [10]. Further important targets of FB1 toxicity are the immune system and the gastrointestinal tract [11,12,13]. Due to this wide range of negative effects on animal health and livestock productivity, guidance levels for fumonisins in animal feedstuffs have been implemented e.g., by the European Commission [14] or the Center for Veterinary Medicine of the Food and Drug Administration [15]. Recommended maximum FB1 concentrations in swine and poultry feed vary from 5–10 mg/kg and 20–50 mg/kg, respectively. However, recent findings underline the potential health risks deriving also from dietary FB1 concentrations below such guideline levels [16,17].
Since fumonisins have a significant economic impact [18], different strategies have been developed to reduce FB1 levels in cereal crops. Application of good agricultural practices, such as plant breeding, crop rotation, tillage or adequate harvesting time can help to control fumonisin contamination [19]. Still, these preventive measures can only reduce, but not completely eliminate FB1 in commodities. Consequently, post-harvest techniques are indispensable, which include chemical and physical decontamination methods and biological inactivation. In general, mycotoxins are highly stable to physical and chemical treatments [20]. Since physical and chemical decontamination techniques are cost-intensive and may result in derivatives with unknown toxicity [21], the deactivation of mycotoxins in the gastrointestinal tract of animals via adsorption or biotransformation is often more applicable in practice.
Mycotoxin adsorption is based on the ability of a feed additive to bind the toxin resulting in a reduction of its bioavailability and subsequent elimination via feces. The binder-toxin complex must be stable during the complete digestion process, while the unspecific adsorption of nutrients and minerals in the feed has to be avoided. The efficacy of a binding material depends on the physical properties and chemical structure of the binder and the target mycotoxin [22]. In general, high adsorption rates have been reported in vitro as well as in vivo for aflatoxins but not for other mycotoxins, such as fumonisins, zearalenone, and trichothecenes [23]. An alternative approach for the elimination of mycotoxins in vivo is the biotransformation and resulting degradation of mycotoxins into non-toxic metabolites by microorganisms or purified enzymes. Several microorganisms with the capability to degrade mycotoxins have been isolated from soil, gut microbiota, or rumen fluid [24]. Previously, our group isolated the fumonisin-degrading bacterium Sphingopyxis sp. MTA144 from soil, elucidated the respective catabolic pathway and identified the gene cluster encoding enzymes for FB1 degradation [25,26,27]. Most prominently, FumD, a type-B carboxylesterase, was found to catalyze detoxification of FB1 by hydrolysis of both tricarballylic acid (TCA) side chains (Figure 1). The resulting compound, hydrolyzed fumonisin B1 (HFB1), has been demonstrated to have a greatly reduced toxicity compared to FB1 in rodents and pigs [28,29,30,31].
This article describes a set of three consecutive experiments which were performed to evaluate the potential of the fumonisin carboxylesterase FumD to detoxify FB1 in turkeys and pigs. First, an ex vivo experiment was performed to investigate the activity of FumD under digestive conditions. To this end, intestinal contents of the pig small intestine were spiked with FB1, incubated with or without the addition of FumD and subsequently analyzed for FB1 and HFB1. Thereafter, two feeding trials were performed to test the efficacy of the commercial application of FumD (FUMzyme). Turkeys and pigs were exposed to diets containing fumonisin concentrations below the recommended guideline levels for 14 and 42 days, respectively. The effect of FUMzyme was assessed by measuring specific fumonisin biomarkers in excreta (FB1, HFB1, partially hydrolyzed fumonisins pHFB1a and pHFB1b,) and serum (Sa/So ratio) of animals.

2. Results and Discussion

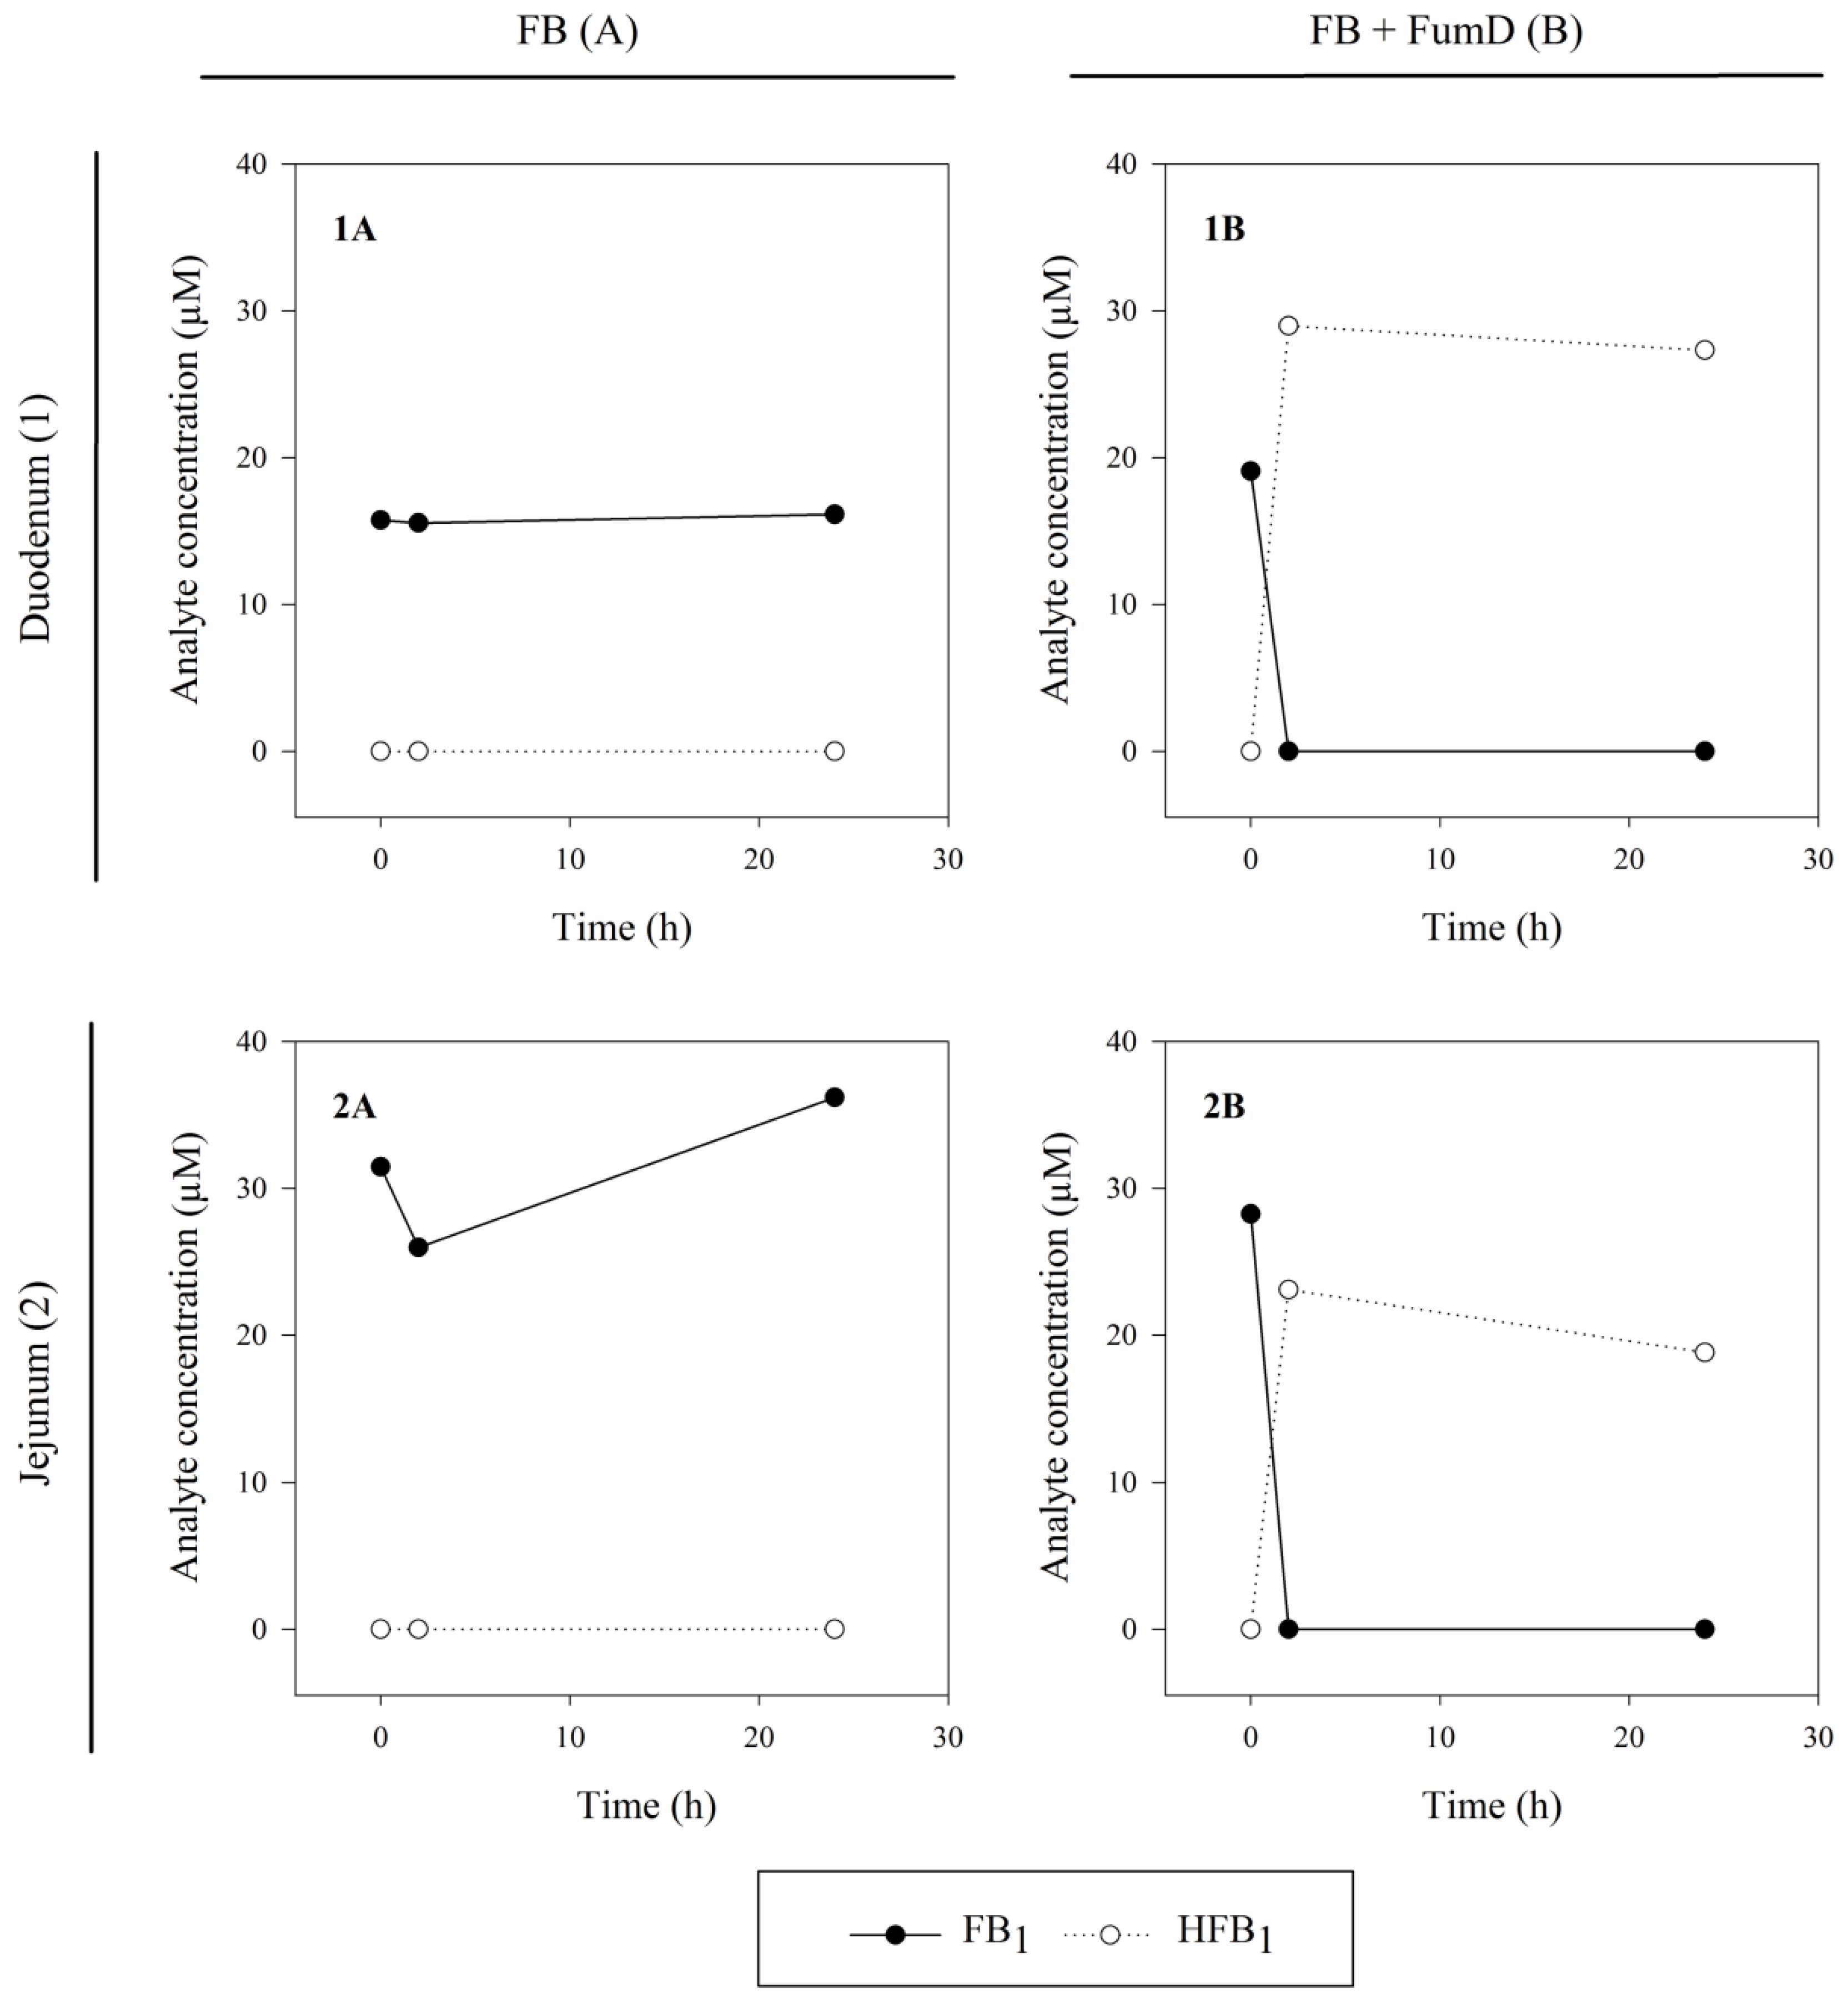
2.1. Enzyme Activity under Intestinal Conditions (Ex Vivo Model)

Several factors like pH-value or temperature can have a significant influence on the activity of enzymes. Hence, it was important to evaluate the principal capability of FumD to cleave FB1 under digestive conditions prior to in vivo efficacy tests. In a straightforward approach, different parts of the pig intestine (duodenum, jejunum) were dissected and intestinal contents were spiked with FB1. Subsequently, samples were treated with pure water (FB) or water containing FumD (FB+FumD). Levels of FB1 and HFB1 in the intestinal contents were monitored over a 24 h incubation period.
As can be deduced from Figure 2, the sole addition of water did not induce degradation of FB1. Toxin levels remained in the added concentration range with only slight variations in jejunum (Figure 2, inlays 1A and 2A). Toxin amounts applied in this experiment (5 mL of 60 µg/mL FB1 solution, 83.1 µM) were aimed at a final concentration of 10 µg/mL FB1 (10 µg/mL, 13.9 µM) in the individual gut segments and selected based on an estimated volume of the intestinal contents of 25 mL. However, the content of the parts dissected from the jejunum was overestimated. As a consequence, respective FB1 concentrations were approximately two-fold higher compared to the FB1 levels measured in duodenal samples. Independent of the time point and the gut segment, HFB1 could not be detected in FB samples (Figure 2, inlays 1A and 2A). By contrast, addition of FumD (5 mL of 1.2 U/mL FumD solution) resulted in a decrease in FB1 concentrations within 2 h. The degradation of FB1 in the intestinal samples was accompanied by an increase in HFB1 levels (Figure 2, inlays 1B and 2B). Partially-hydrolyzed fumonisins (pHFB1a, pHFB1b), the molecules resulting from removal of one of the two tricarballylic side chains, were not detected.
Despite the limited extent of this ex vivo experiment, obtained results showed the potential of FumD to degrade FB1 to HFB1 under digestive conditions. Rapid detoxification of FB1 in proximal parts of the intestine is of particular importance for the prevention of adverse health effects of fumonisins, mainly for two reasons. First, although no studies are currently available that elucidate the exact location or the cellular mechanism of FB1 uptake from the gut, it is reasonable to assume that an early degradation of FB1 reduces the total amount of absorbed toxin, thereby helping to prevent systemic toxicosis. Second, FB1 not only exhibits systemic effects in animals, but also significantly impacts gut health. For instance, this mycotoxin has been demonstrated to impair gut morphology [31,32], reduce the intestinal barrier function [33,34], alter the local immune response [17,35] and to induce the expression of stress proteins, especially in the colon [36]. Moreover, FB1 negatively affected the balance of the gut microbiota in pigs [37] and predisposed the intestinal colonization of a pathogenic Escherichia coli strain [38]. By contrast, reports on the intestinal effects of HFB1 are rare. Grenier et al. [31] observed no significant influence of HFB1 on the intestinal lesion score or the villi morphometry in piglets exposed to 2.8 µmol HFB1/kg b.w./day for two weeks. Compared to its parent toxin, HFB1 only slightly modified the expression of cytokines in the gastrointestinal tract. Thus, the application of FumD could represent a useful approach to counteract toxic effects of FB1 on the intestine [39].

2.2. Efficacy of FUMzyme in Turkeys

To evaluate the efficacy of the commercial application of FumD (FUMzyme) in vivo, a feeding trial with turkeys was performed. Since turkeys are more sensitive to FB1 exposure than poultry (summarized by Benlasher et al. [40]), this species was chosen as the avian model for our experiment. Turkeys were fed basal diet (CON), fumonisin-contaminated diet (15 mg/kg FB1+FB2; FB), or a fumonisin-contaminated diet supplemented with FUMzyme (15 mg/kg FB1+FB2, 15 U/kg FUMzyme; FB+FUMzyme) for 14 days ad libitum. Potential degradation of FB1 was investigated by analyzing excreta for FB1, pHFB1a, pHFB1b, and HFB1 by LC-MS/MS. Results for the different sampling time points (day 7, day 14) are listed in Table 1.
As expected, none of the investigated analytes was detected in excreta of the CON group, nor in the FB and FB+FUMzyme group prior to FB1 exposure (day 0). By contrast, significant levels of FB1 as well as minor levels of pHBF1a, pHFB1b, and HFB1 were found in excreta of turkeys fed the fumonisin-contaminated diet. In general, FB1 was reported not to undergo substantial metabolism in vivo [3]. So far, formation of pHFB1a, pHFB1b, and HFB1 after FB1 exposure has been described in monkeys [41], pigs [42], and rats [43]. Studies on the toxicokinetics of FB1 in avian species are limited [44]. Although the generally poor bioavailability of this mycotoxin was confirmed also for turkeys (3.2% after single oral administration of 100 mg FB1/kg b.w., [45]), formation of the different FB1 metabolites has not been investigated so far. Thus, the current study represents the first report on the occurrence of pHFB1a, pHFB1b, and HFB1 in turkeys, thereby contributing to an increased knowledge on the metabolism of FB1 in avian species. On day 7, levels of pHFB1a and pHFB1b in excreta of the FB group were quite low (mainly ranging between the respective LOD and LOQ), while HFB1 concentrations ranged from 125 to 269 ng/g in the individual animals. However, compared to FB1 excretion (2690 ± 1470 ng/g), the formation of the mentioned metabolites was negligible. Moreover, neither pHFB1a, nor pHFB1b or HFB1 were detected in excreta samples of day 14. This fact may be attributed to individual and time-dependent variations in formation/excretion of pHFB1a, pHFB1b, and HFB1, as well as to the used sampling procedure (spot samples).
Supplementation of the fumonisin-contaminated diet with FUMzyme resulted in a reduction of FB1 levels in excreta, which became statistically significant by day 14 (p = 0.002). Levels of HFB1 in the FB+FUMzyme group reached maximum values of 2080 ng/g and 1700 ng/g in individual samples collected on day 7 and day 14, respectively. Compared to the FB group, this increase was significant already after seven days of treatment (p = 0.005). Similarly, pHFB1b levels were markedly elevated in the FB+FUMzyme group on day 7 and 14. In contrast, no relevant elevation of pHFB1a was observed.
In order to determine whether the degradation of FB1 was accompanied by a reduction of its toxicity, we assessed the influence of the different treatment diets on the sphingolipid metabolism. In turkeys, FB1 exposure can lead to reduced weight gain, elevated feed conversion ratio, hepatotoxicity (reflected e.g., by increased organ weights, hepatocelluar lesions), alteration of serum enzymes, or suppression of the immune system [46,47]. Yet, effects of fumonisins on performance parameters or liver weights were found to become evident only at high levels of dietary FB1 (50–325 mg/kg FB1 upwards) [48,49,50]. On the contrary, disruption of the sphingolipid metabolism was observed after chronic exposure to comparable low doses of FB1 [40,51]. Since an increase in the Sa/So ratio precedes other signs of toxicity, this parameter was suggested as a sensitive fumonisin biomarker in turkeys [50,51].
As shown in Table 2, Sa/So ratios of the FB group were significantly elevated compared to the animals receiving the basal diet. Notably, effects on the sphingolipid metabolism were detectable as early as 14 days after fumonisin exposure in the present study. Similarly, Tardieu et al. [51] found increased liver Sa/So ratios in turkeys fed diets containing 20 mg/kg FB1 and 10 mg/kg FB1 for 7 and 35 days, respectively. Based on these two studies it can be assumed that dietary fumonisin concentrations at or below recommended guideline levels [14,15] have consistent influence on the sphingolipid biosynthesis in turkeys.
By contrast, serum Sa/So levels of the FB+FUMzyme group did not differ significantly from values obtained in the CON group. Compared to the FB group, mean Sa/So levels were significantly reduced. Hence, the biotransformation of FB1 to HFB1 observed in the excreta samples was indeed associated with the absence of sphingolipid metabolism impairment and can be therefore regarded as a detoxification process.

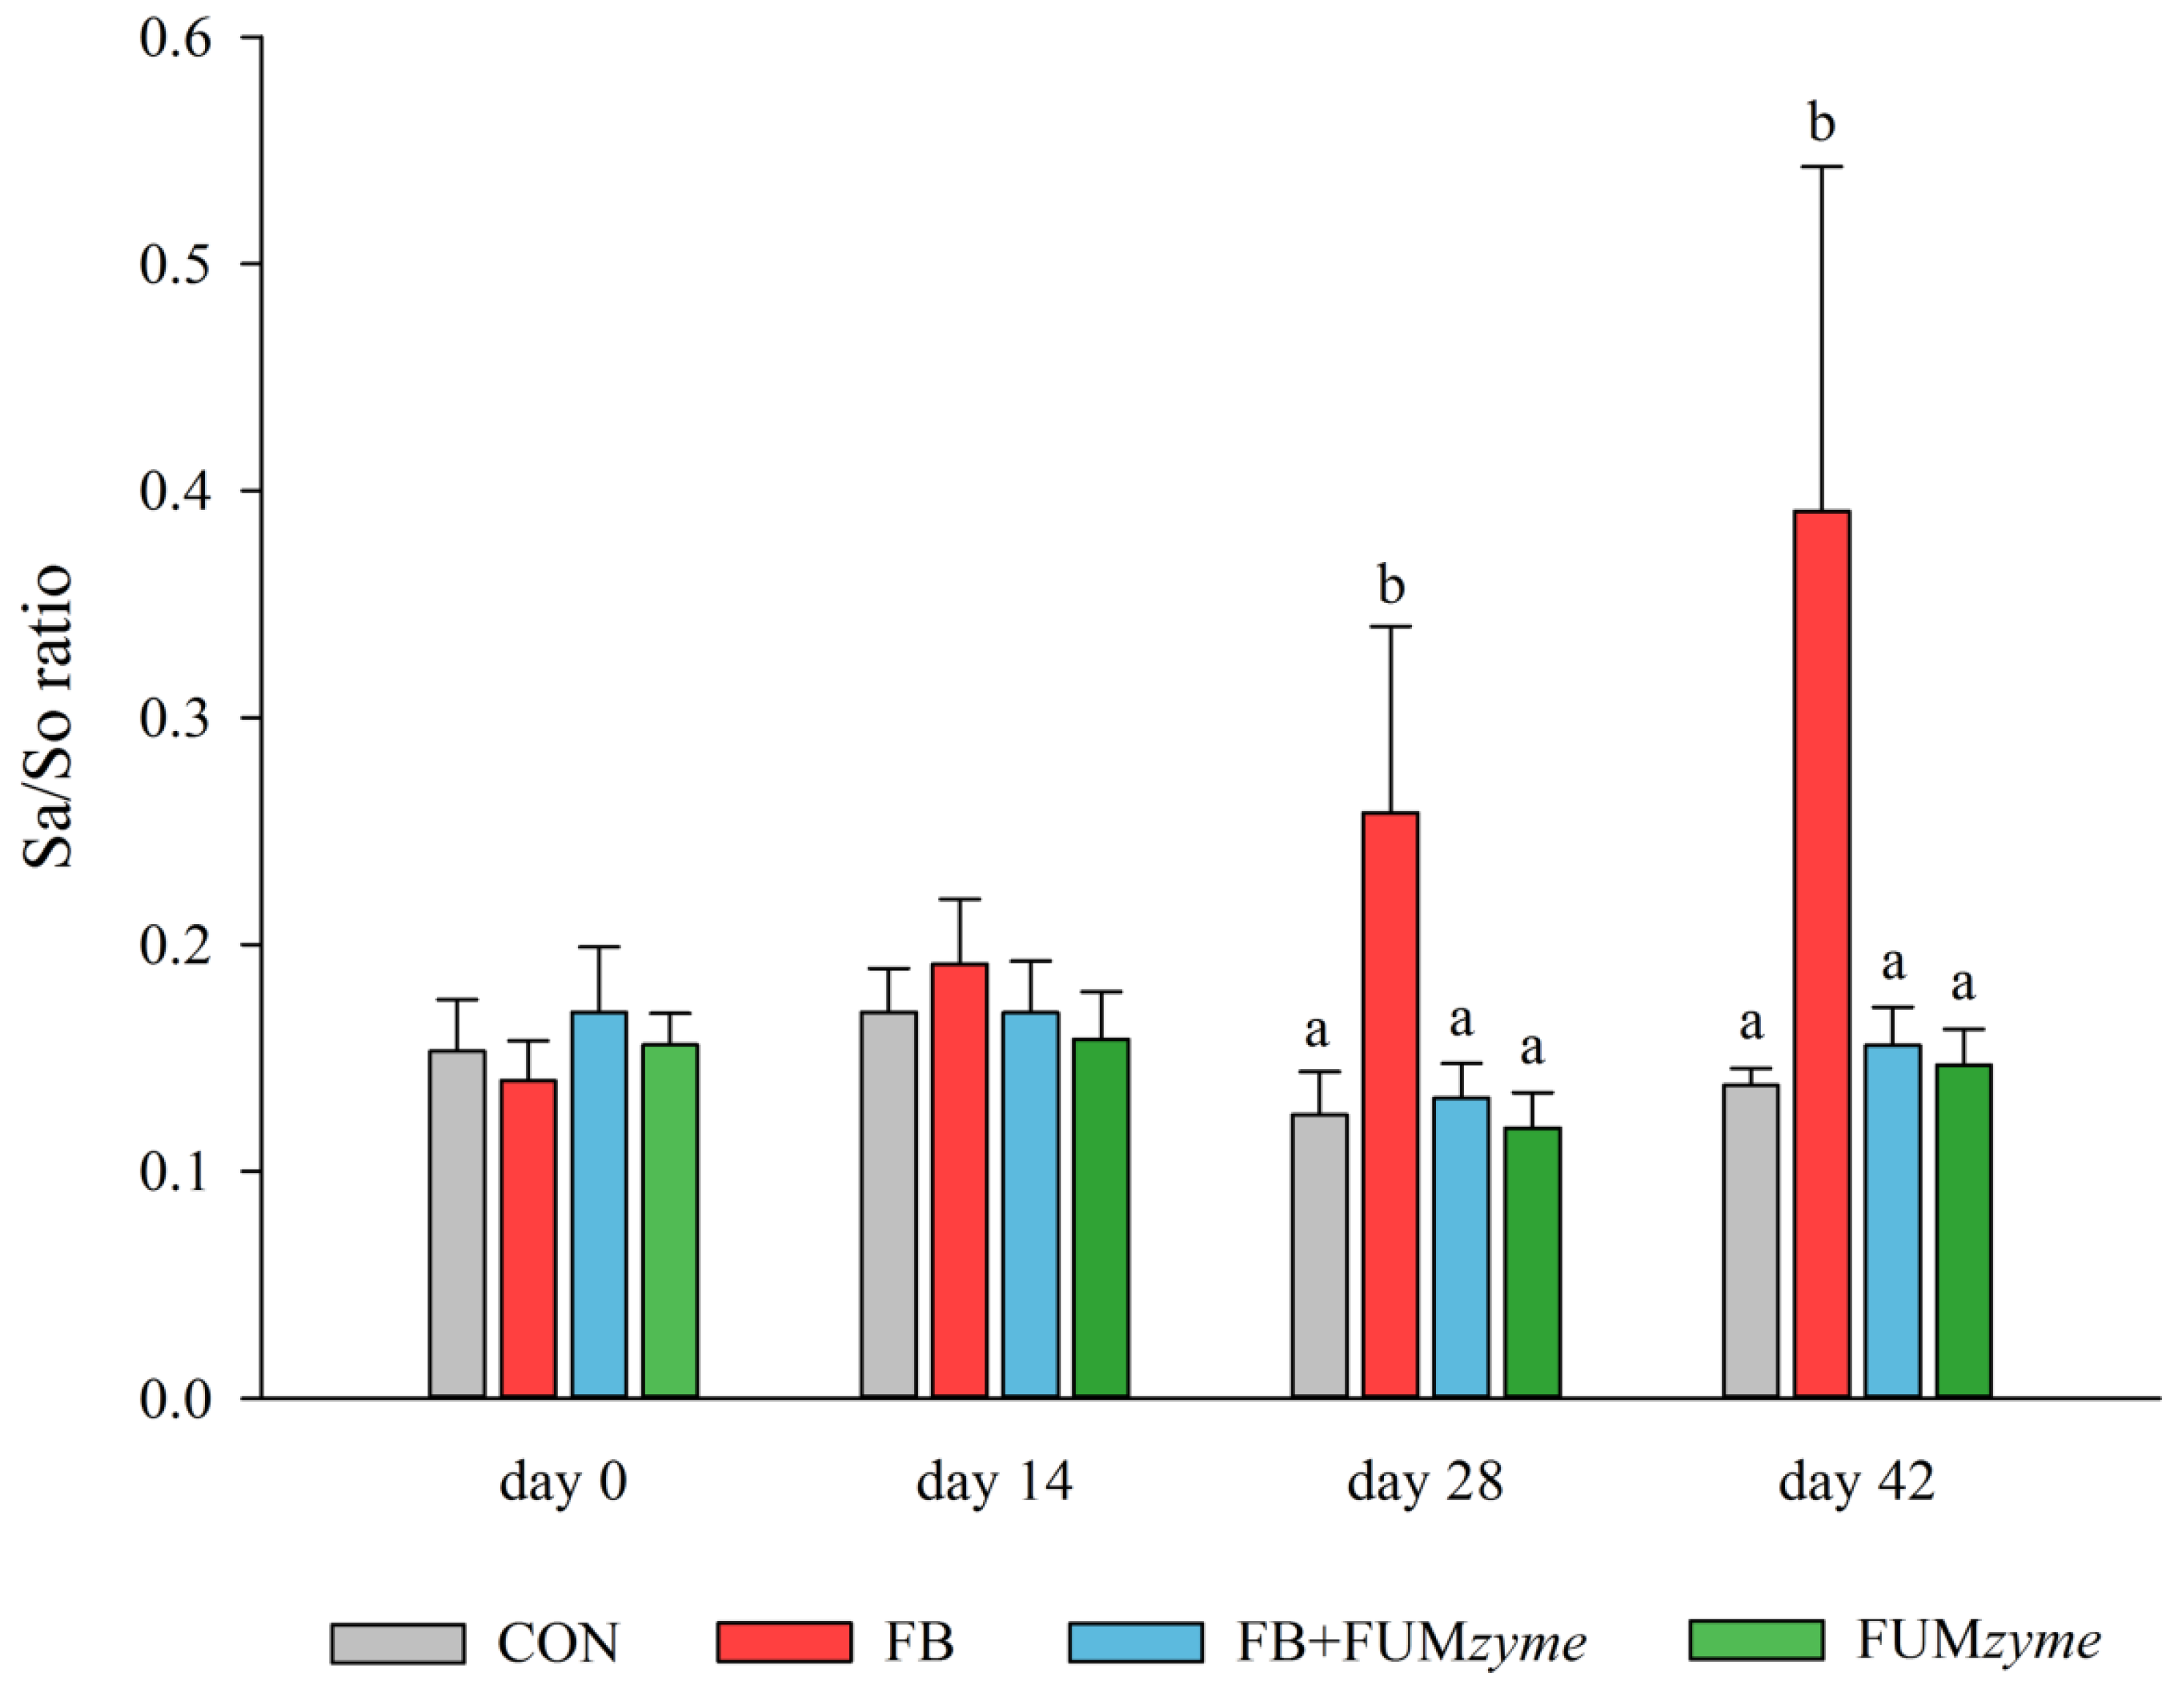
2.3. Efficacy of FUMzyme in Pigs

To test the efficacy of FUMzyme in pigs, a second feeding trial was conducted. Weaned piglets received either basal feed (CON), fumonisin-contaminated feed (2 mg/kg FB1+FB2; FB), fumonisin-contaminated feed supplemented with FUMzyme (2 mg/kg FB1+FB2, 60 U/kg FUMzyme; FB+FUMzyme) or basal feed supplemented with FUMzyme (60 U/kg; FUMzyme) for 42 days. Different treatment diets had no significant impact on performance parameters (data not shown), whereas effects on FB1, pHFB1a, pHFB1b, and HFB1 levels in feces samples collected on day 0, 14, 28, and 42 were marked (Table 3).
Detectable amounts of FB1 in the CON group are a reflection of the minimal fumonisin contamination of the used basal diet (as noted in Section 3.3.2). Notably, relatively high concentrations of FB1 were found in feces samples of the CON group on day 14 and 42. Individual differences in FB1 excretion might partly account for this phenomenon. However, since similar levels of FB1 were also detected in feces samples of the FUMzyme group on day 14 and 21, an inhomogeneous distribution of FB1 in the applied basal feed is a more likely explanation. Although this represents a limitation of our study, fecal FB1 levels were still significantly increased in the FB group compared to the CON group, reaching maximum concentrations of up to 16,600 ng/g in individual piglets. Additionally, certain amounts of pHFB1a, pHFB1b, and HFB1 were found in the feces of FB1 exposed animals. Hydrolysis of FB1 in swine has been observed previously both in vitro (after incubation with caecal content) [52] and in vivo [42]. While in these reports a predominant formation of partially-hydrolyzed FB1 was proposed, we found rather similar levels of pHFB1a, pHFB1b, and HFB1 in feces of the FB group.
Similarly to results obtained in turkeys, supplementation of the fumonisin-contaminated diet with FUMzyme led to significantly reduced FB1 levels in feces as early as day 14. This decrease was accompanied by increased concentrations of fecal HFB1. Whenever comparison of means was possible (analyte concentrations in respective treatment groups > LOQ), HFB1 levels of the FB+FUMzyme group were significantly elevated compared to both the FB and CON group. As expected, metabolite patterns in feces of the FUMzyme and CON group were rather similar.
The effect of different treatment diets on serum Sa/So ratio is depicted in Figure 3. During the whole experiment, Sa/So ratios of the CON group remained unaffected, ranging from 0.15 ± 0.02 (day 0) to 0.14 ± 0.01 (day 42). While dietary FB1 had no effect on the sphingolipid metabolism after 14 days of exposure, Sa/So ratios were significantly elevated on day 28 (0.26 ± 0.08). By day 42, Sa/So ratios of the FB group had further increased (0.39 ± 0.015), reaching maximum levels of 0.76 in individual samples. On both of these sampling days, levels of Sa and So were significantly elevated compared to values obtained in the CON group. In line with Riley et al. [53], the increase in Sa was more prominent (5.8-fold increase on day 14, 11.4-fold increase on day 28) than the elevation of So (2.3- and 2.5-fold). Previously, feed concentrations as low as 5–6 mg/kg total fumonisins were shown to cause increased serum Sa/So ratios in pigs [39,53]. However, to the best of our knowledge the contamination level applied in the present study (2 mg/kg FB1+FB2) is the lowest one so far reported to impair the porcine sphingolipid metabolism. Since alterations in the sphingolipid biosynthesis are directly linked to adverse health effects in swine, e.g., to left-sided heart failure and onset of PPE [9], our findings underline the potential risks deriving from low dietary FB1 concentrations for pig health and productivity.

3. Experimental Section

3.1. Chemicals and Reagents

Acetonitrile (ACN, LC grade), methanol (MeOH, LCMS grade), formic acid, and ammonium formate were purchased from VWR International GmbH (Vienna, Austria). Water was purified using an Arium 611 VF water purification system (Sartorius, Vienna, Austria). Chemicals for preparation of enzyme buffer solution (Tris (hydroxymethyl) aminomethan, Tris; hydrochloric acid, HCl; bovine serum albumin, BSA) were obtained from Sigma Aldrich (Vienna, Austria). FB1 and 13C-FB1 mycotoxin standards were purchased from Romer Labs GmbH (Tulln, Austria). Standards of pHFB1a, pHFB1b, and HFB1 were produced as described in [54]. Sphingolipid standards (d-erythro-sphinganine, d-erythro-shpingosine) were from Avanti Polar Lipids (Alabaster, AL, USA).

3.2. Ex Vivo Model

3.2.1. Preparation of Enzyme and Toxin Solutions

The fumonin caroboxylesterase FumD was produced by expression of the gene fumD in Pichia pastoris according to [25,39]. By definition, one enzyme unit (U) of FumD corresponds to the enzyme activity that releases 1 µmol tricarballylic acid per minute from 100 µM FB1 in 20 mM Tris-HCl buffer (adjusted to pH 8.0) containing 0.1 mg/mL BSA at 30 °C. Enzyme solution of 1.2 U/mL was prepared by dissolving FumD in water containing 0.1 mg/mL BSA. For spiking of intestinal samples, solid FB1 standard was dissolved in water to yield a concentration of 60 µg/mL.

3.2.2. Experimental Setup

Intestines of a fattening pig (crossbred, sow: Landrace × Large White, boar: Pietrain; six months old) were collected immediately after slaughter from a local abattoir and transported on ice to the laboratory. Time between death of the animal and further preparation of intestinal samples did not exceed 30 min. From different parts of the small intestine (duodenum, jejunum), two pieces of defined length (ca. 10 cm) were dissected, respectively.
Subsequently, all intestinal samples were spiked with FB1 by sterile injection of 5 mL toxin solution (60 µg/mL FB1, 83.1 µM) and incubated on an orbital shaker for 1 h at 39 °C. Afterwards, 5 mL of water were injected into positive controls (one sample per gut section; FB), whereas the remaining samples were inoculated with 5 mL of enzyme solution (1.2 U/mL; FB+FumD). Applied amounts of FB1 and FumD were based on estimated volumes of the intestinal contents of 25 mL and should result in final concentrations of 10 µg/mL FB1 (13.9 µM) and 0.2 U/mL FumD in the intestinal contents. Samples of the intestinal contents were collected immediately before addition of enzyme/water (0 h) and after 2 h and 24 h of incubation (orbital shaker, 39 °C). Samples were heat-inactivated (95 °C, 5 min) and stored at −20 °C until further analysis.

3.2.3. Sample Clean-Up and Analysis of FB1 and HFB1 by Liquid Chromatography-Mass Spectrometry

Samples were allowed to reach room temperature and centrifuged at 16,000× g for 10 min. Thereafter, 20 µL of the supernatants were evaporated to dryness under compressed air and re-dissolved in 200 µL water/acetonitrile (75/25, v/v; water contained 0.04% formic acid and was adjusted to pH 3.0 by addition of 6.1 mM ammonium formate buffer) containing 200 µg/L 13C-FB1. After final centrifugation (16,000× g, 10 min), sample concentrations of FB1, pHFB1a, pHFB1b, and HFB1 were determined by liquid chromatography-mass spectrometry (LC-MS) as described by Heinl et al. [25].

3.3. In Vivo Trials

3.3.1. Animals and Study Design

To evaluate the efficacy of the commercial application of FumD (FUMzyme) in vivo, two consecutive feeding trials were performed. All procedures related to these experiments were carried out following the European Guidelines for the Care and Use of Animals for Research Purpose [55] and according to Austrian or Romanian law. The animal experiments were approved by the Austrian Agency for Health and Food Safety Ltd. and the Scientific Ethics Committee of the Faculty of Veterinary Medicine Timisoara (223/07032014), respectively.
First, a short-time feeding trial with turkeys was performed at the Center for Animal Nutrition (Waxenecker KEG, Mank, Austria). Female turkeys (Hybrid Converter; 10 weeks old) were obtained from a local producer. Animals were housed in groups (5 animals/pen) on wood shavings under controlled environmental conditions and a 16/8-h light/dark cycle. After an acclimatization period of seven days, 15 turkeys were individually marked and allocated to one of the following three groups (n = 5): negative control (CON), toxin group (FB) and product group (FB+FUMzyme). While animals of the FUM group received feed contaminated with 15 mg/kg FB1+FB2, the diet of the FB+FUMzyme group contained 15 mg/kg FB1+FB2 and 15 U/kg FUMzyme (Table 4). Animals had free access to feed and water for the whole duration of the trial. On days 0, 7, and 14, excreta samples were collected from all individual animals. To this end, individual animals were put in a separate sampling pen until they defecated, which did not take longer than 30 minutes. This pen was cleaned after each individual sample collection to avoid cross-contamination of feces samples. At the end of the experiment (d14), birds were killed by electric stunning and bleeding. Serum samples were collected during exsanguination. Excreta as well as serum samples were frozen at −20 °C until further analysis.
Second, a pig feeding trial was conducted at SC Pork Prod Srl (Iratos, Romania). Animals were housed in pens on scattered floor under controlled conditions and had free access to water. At weaning, 140 piglets (PIC 337; 28 days old; 70 castrated males, 70 females) were individually identified and weighted. Using a randomized block design, animals were allocated to one of four different treatment groups (n = 35), taking into consideration both the sex and the body weight of the animals. Piglets received either blank feed (CON), feed contaminated with 2 mg/kg FB1+FB2 (FB), feed contaminated with 2 mg/kg FB1+FB2 and substituted with 60 U/kg FUMzyme (FB+FUMzyme), or blank feed substituted with 60 U/kg FUMzyme (FUMzyme) for 42 days (Table 4). The diets were provided in dry form and ad libitum. On days 0, 14, 28, and 42, pigs were individually weighted. In addition, serum samples (collected from the jugular vein) and individual feces samples (collected from the rectum) were taken from ten piglets per group at each of these time points. While the number of 35 animals per group was chosen in order to match the density in industrial breeding conditions, the number of 10 animals per group for biomarker analysis was set on the basis of statistical sample size calculation. These ten piglets were randomly identified by numbers on their back at the beginning of the experiment and were then used throughout the whole experiment for sample collection. Serum and feces samples were frozen at −20 °C until further analysis.

3.3.2. Feed Composition

Turkey and pig basal feed was formulated to meet species-specific requirements (Table 5) and analyzed for the presence of relevant mycotoxins, namely FB1 (limit of quantification, LOQ, 80 µg/kg), FB2 (LOQ 80 µg/kg), deoxynivalenol (LOQ 150 µg/kg), aflatoxin B1 (LOQ 0.8 µg/kg), aflatoxin B2 (LOQ 0.3 µg/kg), ochratoxin A (LOQ 0.5 µg/kg), T-2 toxin (LOQ 80 µg/kg) and HT-2 toxin (LOQ 140 µg/kg) (Romer Labs GmbH, Tulln, Austria). Mycotoxin levels exceeding the respective LOQ were only found for FB1 (130 µg/kg; pig basal starter feed) and deoxynivalenol (310 µg/kg; poultry basal feed).
For artificial contamination of treatment diets with fumonisins (FB groups), culture material of F. verticillioides, containing (10.5 g/kg FB1 and 4.18 g/kg FB2), was obtained from Romer Labs GmbH. To ensure homogeneous distribution of fumonisins within the diets, a premix was prepared using inulin. The culture material-inulin-premix was added to the basal feed at inclusion rates of 0.5% (turkey trial) and 0.05% (pig trial). Final fumonisin concentrations were verified by HPLC-MS (Romer Labs GmbH).
For the turkey trial, FumD was produced as described in 3.2.1. Each enzyme batch was separated from the biomass by centrifugation in a disk stack separator and consequently passed through micro-, ultra-, and sterile filtration to exclude any remaining cell material. Finally, the FumD concentrate was mixed with maltodextrin (10%, w/w), spray-dried, and further diluted with maltodextrin to obtain a FUMzyme-premix with 4.28 U/g. This premix was mixed into the basal feed at an inclusion rate of 0.35%. In case of the pig trial, 2 kg/t of a FUMzyme containing feed additive (30,000 U/kg FUMzyme; BIOMIN Holding GmbH, Getzersdorf, Austria) was added to the respective treatment diets. Final concentrations of active enzyme in feed were confirmed via fumonisin esterase activity assay according to [56] (BIOMIN Research Center Quality Control Lab, Tulln, Austria).

3.3.3. HPLC-MS/MS Analysis of Sphingolipids

Serum sample preparation for subsequent HPLC-MS/MS determination of sphinganine (Sa) and sphingosine (So) was performed according to Grenier et al. [17].
Analyses were carried out on a 1290 Infinity series HPLC system (Agilent Technolgies, Waldbronn, Germany) coupled to a Triple Quad 5500 mass spectrometer (AB Sciex, Foster City, CA, USA). Chromatographic separation was achieved on a Kinetex C18 column (150 × 2.1 mm, 2.6 µm) fitted with a UHPLC C18 SecurityGuard ULTRA Cartridge (both Phenomenex, Torrace, CA, USA) at 30 °C. Eluent A consisted of MeOH/water (40/60, v/v) and eluent B of MeOH, both containing 0.15% formic acid. The proportion of B was increased linearly from 35% to 100% (reached at 6.5 min). After a hold-time of 3.5 min at 100% B, the column was re-equilibrated for 2.4 min at 35% B. A sample volume of 1 µL was injected into a flow of 250 µL/min.
The Triple Quad 5500 was operated in positive electrospray ionization mode, using a Turbo V ion spray source with the following settings: source temperature 550, curtain gas 40, GS1 40, GS2 40, ion spray voltage 5500, collision gas 7, dwell time 50 ms. Mass spectrometric detection was performed in selected reaction monitoring mode. In general, mass transitions chosen for analysis were as follows: m/z 302.3 to 60.1 (Sa quantifier; declustering potential, DP +146 V; collision energy; CE +21 eV), m/z 302.3 to 284.4 (Sa qualifier; DP +146 V, CE +19 eV), m/z 300.3 to 252.3 (So quantifier; DP +71 V, CV +23 eV) and m/z 300.3 to 282.3 (So qualifier; DP +71 V, CE +15 eV). In turkey serum samples, the mass transition of m/z 300.3 to 282.3 served as So quantifier, while the mass transition of m/z 302.3 to 284.4 was used as Sa quantifier.
Method validation was performed for pig as well as turkey serum samples and comprised determination of the apparent recovery (RA), the signal suppression/enhancement (SSE), the recovery of the extraction step (RE), the repeatability, limits of detection (LODs), and limits of quantification (LOQs). For this purpose, pooled serum samples of the control group were spiked with appropriate amounts of Sa and So standards prior to and after extraction in triplicate at five different concentration levels (corresponding to a working range of 1–100 ng/mL in measurement solutions for both analytes). MS data evaluation was performed using Multiquant 3.0 software (AB Sciex). RA, SSE and RE were determined as described by Sulyok et al. [57] and are provided in Table 6. LODs were calculated according to the equation LOD = 3s + m, where s corresponds to the standard deviation and m corresponds to the average of the calculated concentrations of 15 blank runs. Similarly, LOQs were calculated using LOQ = 10s + m. LODs of investigated analytes were between 0.6 and 1.8 ng/mL in pig and turkey serum samples, while LOQs ranged from 1.8 to 4.5 ng/mL. Repeatability, calculated as relative standard deviation of samples spiked in triplicate, was between 1% and 11%.
Serum samples of the feeding trial were worked up and analyzed in duplicate. Sa and So concentrations were determined on the basis of neat solvent calibration functions. Sa/So ratios were calculated in MS Excel (2010).

3.3.4. HPLC-MS/MS Analysis of FB1, pHFB1a, pHFB1b, and HFB1

Concentrations of fumonisins in excreta of turkeys were determined by three-fold extraction of 1 g of homogenized excreta samples with 10, 10, and 5 mL of ACN/water/formic acid (74/25/1, v/v/v) by shaking for 30 min, 20 min, and 10 min, respectively. Aliquots of the combined supernatants after centrifugation were diluted 1+4 with extraction solvent prior to LC-MS/MS analysis according to [43,54]. Quantitative analysis was carried out on the basis of neat solvent calibration functions established in the range between 1 and 400 ng/mL. Excreta samples were worked up in duplicate and each extract was analyzed once. Excreta of pigs were analyzed accordingly, except that 300 mg of freeze-dried, homogenized sample were extracted and diluted 1+1 prior to analysis.

3.4. Statistical Analysis

Statistical evaluations were carried out using SPSS (Version 19.0., IBM Corp., Armonk, NY, USA) and results were considered significant at p < 0.05. In general, the statistical methodology included a test for normal distribution of all parameters in all groups (Kolmogorov-Smirnov test).
Normal distributed data were further analyzed by a test for homogeneity of variances (Levene’s test). If variances were homogeneous, either ANOVA followed by Tukey’s HSD test or Student´s t-test was performed, depending on the number of groups compared. If variances were not homogenous, data were evaluated either by Welch test with Tamhane’s T2 test as post hoc test or by t-test for inhomogeneous variances, depending on the number of groups compared. Data that were not normal distributed were further analyzed by Kruskal-Wallis test (non-parametric ANOVA) when several groups were compared or by Mann-Whitney test when only two groups were compared. Kruskal-Wallis tests were followed up by pairwise comparison (available as subfunction of the Kruskal-Wallis test in SPSS).
In groups where single analyte values were <LOD or <LOQ, half of the LOD and half of the LOQ values were used for calculation of means. At several sampling time points, FB1 or its metabolites were below the respective LOD und LOQ values in all individual samples of a treatment group (as indicated by “<LOD” or “<LOQ” in Table 1 and Table 3). In that case, respective data were not included in comparison of means.

4. Conclusions

Our data demonstrate the degradation of FB1 to its less toxic metabolite HFB1 by the use of the carboxylesterase FumD under both ex vivo and in vivo conditions. As reflected by significantly increased Sa/So ratios, dietary fumonisin concentrations below the respective recommended guideline levels caused disruption of the sphingolipid metabolism in turkeys and pigs. In contrast, feed supplementation with the commercial application of FumD (FUMzyme) prevented alterations of the Sa/So ratio in both species. Thus, the application of FUMzyme as feed additive can be regarded as effective strategy to counteract the effects of FB1 in turkeys and pigs.

Acknowledgments

The authors thank the Austrian Research Promotion Agency (FFG) for their financial support and the Federal Ministry of Economy, Family and Youth as well as the National Foundation for Research, Technology for funding the Christian Doppler Laboratory for Mycotoxin Metabolism. Furthermore, we express our gratitude to Roger Berrios and Barbara Doupovec for care of the animals and sample collection. The support of Barbara Doupovec and Karin Schoendorfer in statistical evaluation of data is greatly acknowledged. Finally, we owe sincere gratitude to Petra Mayrhofer, Veronika Slavik, Gerlinde Bichl and Sylvia Caha for their help during sample preparation and to Ryan Hynes for proofreading of the manuscript.

Author Contributions

Sabine Masching coordinated the in vivo studies and supported the data evaluation. Karin Naehrer carried out the ex vivo study and contributed to preparation of the manuscript. Mihai Sărăndan was responsible for the conduction of the pig in vivo study and provided the respective raw data and samples for analysis. Ilse Dohnal performed HPLC-MS/MS analytics of sphingolipids, carried out the corresponding data evaluation and revised the manuscript. Simone Schaumberger designed and conducted the turkey trial and gave support in data evaluation. Heidi Elisabeth Schwartz-Zimmermann carried out analysis of fumonisins in excreta samples, performed the corresponding data evaluation and revised the manuscript. Veronika Nagl assisted in data interpretation and compiled the manuscript. Dian Schatzmayr oversaw the entire project and revised the manuscript.

Conflicts of Interest

The authors declare no conflict of interest.

Abbreviations

The following abbreviations are used in this manuscript:
FB1fumonisin B1
FB2fumonisin B2
FB3fumonisin B3
HFB1hydrolyzed fumonisin B1
pHFB1apartially hydrolyzed fumonisin B1a
pHFB1bpartially hydrolyzed fumonisin B1b
HPLC-MS/MShigh performance liquid chromatography-tandem mass spectrometry
LODlimit of detection
LOQlimit of quantification

References

  1. Rheeder, J.P.; Marasas, W.F.; Vismer, H.F. Production of fumonisin analogs by fusarium species. Appl. Environ. Microbiol. 2002, 68, 2101–2105. [Google Scholar] [CrossRef] [PubMed]
  2. Voss, K.; Riley, R. Fumonisin toxicity and mechanism of action: Overview and current perspectives. Food Saf. 2013, 1, 2013006–2013006. [Google Scholar] [CrossRef]
  3. Voss, K.A.; Smith, G.W.; Haschek, W.M. Fumonisins: Toxicokinetics, mechanism of action and toxicity. Anim. Feed Sci. Technol. 2007, 137, 299–325. [Google Scholar] [CrossRef]
  4. Schatzmayr, G.; Streit, E. Global occurrence of mycotoxins in the food and feed chain: Facts and figures. World Mycotoxin J. 2013, 6, 213–222. [Google Scholar] [CrossRef]
  5. Rodrigues, I.; Naehrer, K. A three-year survey on the worldwide occurrence of mycotoxins in feedstuffs and feed. Toxins 2012, 4, 663–675. [Google Scholar] [CrossRef] [PubMed]
  6. Shier, W.T. The fumonisin paradox: A review of research on oral bioavailability of fumonisin b1, a mycotoxin produced by fusarium moniliforme. Toxin Rev. 2000, 19, 161–187. [Google Scholar] [CrossRef]
  7. Merrill, A.H., Jr.; van Echten, G.; Wang, E.; Sandhoff, K. Fumonisin b1 inhibits sphingosine (sphinganine) n-acyltransferase and de novo sphingolipid biosynthesis in cultured neurons in situ. J. Biol. Chem. 1993, 268, 27299–27306. [Google Scholar] [PubMed]
  8. Caloni, F.; Cortinovis, C. Effects of fusariotoxins in the equine species. Vet. J. 2010, 186, 157–161. [Google Scholar] [CrossRef] [PubMed]
  9. Haschek, W.M.; Gumprecht, L.A.; Smith, G.; Tumbleson, M.E.; Constable, P.D. Fumonisin toxicosis in swine: An overview of porcine pulmonary edema and current perspectives. Environ. Health Perspect. 2001, 109 (Suppl. 2), 251–257. [Google Scholar] [CrossRef] [PubMed]
  10. Antonissen, G.; Martel, A.; Pasmans, F.; Ducatelle, R.; Verbrugghe, E.; Vandenbroucke, V.; Li, S.; Haesebrouck, F.; van Immerseel, F.; Croubels, S. The impact of fusarium mycotoxins on human and animal host susceptibility to infectious diseases. Toxins 2014, 6, 430–452. [Google Scholar] [CrossRef] [PubMed] [Green Version]
  11. Bouhet, S.; Oswald, I.P. The intestine as a possible target for fumonisin toxicity. Mol. Nutr. Food Res. 2007, 51, 925–931. [Google Scholar] [CrossRef] [PubMed]
  12. Taranu, I.; Marin, D.E.; Bouhet, S.; Pascale, F.; Bailly, J.D.; Miller, J.D.; Pinton, P.; Oswald, I.P. Mycotoxin fumonisin b1 alters the cytokine profile and decreases the vaccinal antibody titer in pigs. Toxicol. Sci. 2005, 84, 301–307. [Google Scholar] [CrossRef] [PubMed]
  13. Tessari, E.N.C.; Oliveira, C.A.F.; Cardoso, A.; Ledoux, D.R.; Rottinghaus, G.E. Effects of aflatoxin b1 and fumonisin b1 on body weight, antibody titres and histology of broiler chicks. Br. Poult. Sci. 2006, 47, 357–364. [Google Scholar] [CrossRef] [PubMed]
  14. European Commission. Commission recommendation of 17 August 2006 on the presence of deoxynivalenol, zearalenone, ochratoxin a, t-2 and ht-2 and fumonisins in products intended for animal feeding (2006/576/ec). Off. J. Eur. Union 2006, L229, 7–9. [Google Scholar]
  15. Food and Drug Administration. FDA Mycotoxin Regulatory Guidance. Available online: https://www.ngfa.org/wp-content/uploads/NGFAComplianceGuide-FDARegulatoryGuidanceforMycotoxins8-2011.pdf (accessed on 30 March 2015).
  16. Grenier, B.; Loureiro-Bracarense, A.P.; Lucioli, J.; Pacheco, G.D.; Cossalter, A.M.; Moll, W.D.; Schatzmayr, G.; Oswald, I.P. Individual and combined effects of subclinical doses of deoxynivalenol and fumonisins in piglets. Mol. Nutr. Food Res. 2011, 55, 761–771. [Google Scholar] [CrossRef] [PubMed]
  17. Grenier, B.; Schwartz-Zimmermann, H.E.; Caha, S.; Moll, W.D.; Schatzmayr, G.; Applegate, T.J. Dose-dependent effects on sphingoid bases and cytokines in chickens fed diets prepared with fusarium verticillioides culture material containing fumonisins. Toxins 2015, 7, 1253–1272. [Google Scholar] [CrossRef] [PubMed]
  18. Wu, F. Measuring the economic impacts of fusarium toxins in animal feeds. Anim. Feed Sci. Technol. 2007, 137, 363–374. [Google Scholar] [CrossRef]
  19. Blandino, M.; Reyneri, A.; Colombari, G.; Pietri, A. Comparison of integrated field programmes for the reduction of fumonisin contamination in maize kernels. Field Crops Res. 2009, 111, 284–289. [Google Scholar] [CrossRef]
  20. Milani, J.; Maleki, G. Effects of processing on mycotoxin stability in cereals. J. Sci. Food Agric. 2014, 94, 2372–2375. [Google Scholar] [CrossRef] [PubMed]
  21. Jard, G.; Liboz, T.; Mathieu, F.; Guyonvarc’h, A.; Lebrihi, A. Review of mycotoxin reduction in food and feed: From prevention in the field to detoxification by adsorption or transformation. Food Addit. Contam. Part A 2011, 28, 1590–1609. [Google Scholar] [CrossRef] [PubMed] [Green Version]
  22. Murugesan, G.; Ledoux, D.; Naehrer, K.; Berthiller, F.; Applegate, T.; Grenier, B.; Phillips, T.; Schatzmayr, G. Prevalence and effects of mycotoxins on poultry health and performance, and recent development in mycotoxin counteracting strategies. Poult. Sci. 2015, 94, 1298–1315. [Google Scholar] [CrossRef] [PubMed]
  23. Di Gregorio, M.C.; Neeff, D.V.d.; Jager, A.V.; Corassin, C.H.; Carão, Á.C.d.P.; Albuquerque, R.d.; Azevedo, A.C.d.; Oliveira, C.A.F. Mineral adsorbents for prevention of mycotoxins in animal feeds. Toxin Rev. 2014, 33, 125–135. [Google Scholar] [CrossRef]
  24. McCormick, S.P. Microbial detoxification of mycotoxins. J. Chem. Ecol. 2013, 39, 907–918. [Google Scholar] [CrossRef] [PubMed]
  25. Heinl, S.; Hartinger, D.; Thamhesl, M.; Vekiru, E.; Krska, R.; Schatzmayr, G.; Moll, W.-D.; Grabherr, R. Degradation of fumonisin b1 by the consecutive action of two bacterial enzymes. J. Biotechnol. 2010, 145, 120–129. [Google Scholar] [CrossRef] [PubMed]
  26. Hartinger, D.; Schwartz, H.; Hametner, C.; Schatzmayr, G.; Haltrich, D.; Moll, W.-D. Enzyme characteristics of aminotransferase fumi of sphingopyxis sp. Mta144 for deamination of hydrolyzed fumonisin b1. Appl. Microbiol. Biotechnol. 2011, 91, 757–768. [Google Scholar] [CrossRef] [PubMed]
  27. Hartinger, D.; Moll, W. Fumonisin elimination and prospects for detoxification by enzymatic transformation. World Mycotoxin J. 2011, 4, 271–283. [Google Scholar] [CrossRef]
  28. Collins, T.F.; Sprando, R.L.; Black, T.N.; Olejnik, N.; Eppley, R.M.; Shackelford, M.E.; Howard, P.C.; Rorie, J.I.; Bryant, M.; Ruggles, D.I. Effects of aminopentol on in utero development in rats. Food Chem. Toxicol. 2006, 44, 161–169. [Google Scholar] [CrossRef] [PubMed]
  29. Howard, P.C.; Couch, L.H.; Patton, R.E.; Eppley, R.M.; Doerge, D.R.; Churchwell, M.I.; Marques, M.M.; Okerberg, C.V. Comparison of the toxicity of several fumonisin derivatives in a 28-day feeding study with female B6C3F1 mice. Toxicol. Appl. Pharmacol. 2002, 185, 153–165. [Google Scholar] [CrossRef] [PubMed]
  30. Voss, K.A.; Riley, R.T.; Snook, M.E.; Gelineau-van Waes, J. Reproductive and sphingolipid metabolic effects of fumonisin b1 and its alkaline hydrolysis product in lm/bc mice: Hydrolyzed fumonisin b1 did not cause neural tube defects. Toxicol. Sci. 2009, kfp215. [Google Scholar] [CrossRef] [PubMed]
  31. Grenier, B.; Bracarense, A.-P.F.L.; Schwartz, H.E.; Trumel, C.; Cossalter, A.-M.; Schatzmayr, G.; Kolf-Clauw, M.; Moll, W.-D.; Oswald, I.P. The low intestinal and hepatic toxicity of hydrolyzed fumonisin b1 correlates with its inability to alter the metabolism of sphingolipids. Biochem. Pharmacol. 2012, 83, 1465–1473. [Google Scholar] [CrossRef] [PubMed] [Green Version]
  32. Bracarense, A.P.; Lucioli, J.; Grenier, B.; Drociunas Pacheco, G.; Moll, W.D.; Schatzmayr, G.; Oswald, I.P. Chronic ingestion of deoxynivalenol and fumonisin, alone or in interaction, induces morphological and immunological changes in the intestine of piglets. Br. J. Nutr. 2012, 107, 1776–1786. [Google Scholar] [CrossRef] [PubMed]
  33. Bouhet, S.; Hourcade, E.; Loiseau, N.; Fikry, A.; Martinez, S.; Roselli, M.; Galtier, P.; Mengheri, E.; Oswald, I.P. The mycotoxin fumonisin b1 alters the proliferation and the barrier function of porcine intestinal epithelial cells. Toxicol. Sci. 2004, 77, 165–171. [Google Scholar] [CrossRef] [PubMed]
  34. Basso, K.; Gomes, F.; Bracarense, A.P.L. Deoxynivanelol and fumonisin, alone or in combination, induce changes on intestinal junction complexes and in e-cadherin expression. Toxins 2013, 5, 2341–2352. [Google Scholar] [CrossRef] [PubMed]
  35. Devriendt, B.; Gallois, M.l.; Verdonck, F.; Wache, Y.; Bimczok, D.; Oswald, I.P.; Goddeeris, B.M.; Cox, E. The food contaminant fumonisin b1 reduces the maturation of porcine cd11r1+ intestinal antigen presenting cells and antigen-specific immune responses, leading to a prolonged intestinal etec infection. Vet. Res. 2009, 40, 1–14. [Google Scholar] [CrossRef] [PubMed]
  36. Lallès, J.-P.; Lessard, M.; Oswald, I.P.; David, J.-C. Consumption of fumonisin b 1 for 9 days induces stress proteins along the gastrointestinal tract of pigs. Toxicon 2010, 55, 244–249. [Google Scholar] [CrossRef] [PubMed]
  37. Burel, C.; Tanguy, M.; Guerre, P.; Boilletot, E.; Cariolet, R.; Queguiner, M.; Postollec, G.; Pinton, P.; Salvat, G.; Oswald, I.P. Effect of low dose of fumonisins on pig health: Immune status, intestinal microbiota and sensitivity to salmonella. Toxins 2013, 5, 841–864. [Google Scholar] [CrossRef] [PubMed]
  38. Oswald, I.P.; Desautels, C.; Laffitte, J.; Fournout, S.; Peres, S.Y.; Odin, M.; Le Bars, P.; Le Bars, J.; Fairbrother, J.M. Mycotoxin fumonisin b1 increases intestinal colonization by pathogenic escherichia coli in pigs. Appl. Environ. Microbiol. 2003, 69, 5870–5874. [Google Scholar] [CrossRef] [PubMed]
  39. Grenier, B.; Bracarense, A.-P.F.L.; Schwartz, H.E.; Lucioli, J.; Cossalter, A.-M.; Moll, W.-D.; Schatzmayr, G.; Oswald, I.P. Biotransformation approaches to alleviate the effects induced by fusarium mycotoxins in swine. J. Agric. Food Chem. 2013, 61, 6711–6719. [Google Scholar] [CrossRef] [PubMed] [Green Version]
  40. Benlasher, E.; Geng, X.; Xuan Nguyen, N.T.; Tardieu, D.; Bailly, J.-D.; Auvergne, A.; Guerre, P. Comparative effects of fumonisins on sphingolipid metabolism and toxicity in ducks and turkeys. Avian Dis. 2012, 56, 120–127. [Google Scholar] [CrossRef] [PubMed]
  41. Shephard, G.S.; Thiel, P.G.; Sydenham, E.W.; Savard, M.E. Fate of a single dose of 14c-labelled fumonisin b1 in vervet monkeys. Nat. Toxins 1995, 3, 145–150. [Google Scholar] [CrossRef] [PubMed]
  42. Fodor, J.; Balogh, K.; Weber, M.; Mezes, M.; Kametler, L.; Posa, R.; Mamet, R.; Bauer, J.; Horn, P.; Kovacs, F. Absorption, distribution and elimination of fumonisin b1 metabolites in weaned piglets. Food Addit. Contam. 2008, 25, 88–96. [Google Scholar] [CrossRef] [PubMed]
  43. Hahn, I.; Nagl, V.; Schwartz-Zimmermann, H.E.; Varga, E.; Schwarz, C.; Slavik, V.; Reisinger, N.; Malachová, A.; Cirlini, M.; Generotti, S. Effects of orally administered fumonisin B1 (FB1), partially hydrolysed FB1, hydrolysed FB1 and N-(1-deoxy-d-fructos-1-yl) FB1 on the sphingolipid metabolism in rats. Food Chem. Toxicol. 2015, 76, 11–18. [Google Scholar] [CrossRef] [PubMed]
  44. Guerre, P. Fusariotoxins in avian species: Toxicokinetics, metabolism and persistence in tissues. Toxins 2015, 7, 2289–2305. [Google Scholar] [CrossRef] [PubMed]
  45. Tardieu, D.; Bailly, J.-D.; Skiba, F.; Grosjean, F.; Guerre, P. Toxicokinetics of fumonisin B1 in turkey poults and tissue persistence after exposure to a diet containing the maximum european tolerance for fumonisins in avian feeds. Food Chem. Toxicol. 2008, 46, 3213–3218. [Google Scholar] [CrossRef] [PubMed] [Green Version]
  46. Weibking, T.S.; Ledoux, D.R.; Brown, T.P.; Rottinghaus, G.E. Fumonisin toxicity in turkey poults. J. Vet. Diagn. Investig. 1993, 5, 75–83. [Google Scholar] [CrossRef]
  47. Li, Y.C.; Ledoux, D.R.; Bermudez, A.J.; Fritsche, K.L.; Rottinghaus, G.E. The individual and combined effects of fumonisin B1 and moniliformin on performance and selected immune parameters in turkey poults. Poult. Sci. 2000, 79, 871–878. [Google Scholar] [CrossRef] [PubMed]
  48. Bermudez, A.J.; Ledoux, D.R.; Turk, J.R.; Rottinghaus, G.E. The chronic effects of fusarium moniliforme culture material, containing known levels of fumonisin B1, in turkeys. Avian Dis. 1996, 231–235. [Google Scholar] [CrossRef]
  49. Ledoux, D.; Bermudez, A.; Rottinghaus, G. Effects of feeding fusarium moniliforme culture material, containing known levels of fumonisin B1, in the young turkey poult. Poult. Sci. 1996, 75, 1472–1478. [Google Scholar] [CrossRef] [PubMed]
  50. Broomhead, J.N.; Ledoux, D.R.; Bermudez, A.J.; Rottinghaus, G.E. Chronic effects of fumonisin B1 in broilers and turkeys fed dietary treatments to market age. Poult. Sci. 2002, 81, 56–61. [Google Scholar] [CrossRef] [PubMed]
  51. Tardieu, D.; Bailly, J.D.; Skiba, F.; Metayer, J.P.; Grosjean, F.; Guerre, P. Chronic toxicity of fumonisins in turkeys. Poult. Sci. 2007, 86, 1887–1893. [Google Scholar] [CrossRef] [PubMed]
  52. Fodor, J.; Meyer, K.; Gottschalk, C.; Mamet, R.; Kametler, L.; Bauer, J.; Horn, P.; Kovacs, F.; Kovacs, M. In vitro microbial metabolism of fumonisin B1. Food Addit. Contam. 2007, 24, 416–420. [Google Scholar] [CrossRef] [PubMed]
  53. Riley, R.T.; An, N.-H.; Showker, J.L.; Yoo, H.-S.; Norred, W.P.; Chamberlain, W.J.; Wang, E.; Merrill, A.H.; Motelin, G.; Beasley, V.R. Alteration of tissue and serum sphinganine to sphingosine ratio: An early biomarker of exposure to fumonisin-containing feeds in pigs. Toxicol. Appl. Pharmacol. 1993, 118, 105–112. [Google Scholar] [CrossRef] [PubMed]
  54. Schwartz-Zimmermann, H.E.; Hahn, I.; Moll, W.-D.; Grenier, B.; Nagl, V.; Hartinger, D.; Slavik, V.; Caha, S.G.O.; Krska, R.; Berthiller, F. Analytical and biological validation of methods for determining fumonisin biomarkers in pigs, chicken and rats. Manuscript in preparation.
  55. European Commission. Directive 2010/63/eu of the european parliament and of the council of of 22 september 2010 on the protection of animals used for scientific purposes. Off. J. Eur. Union 2010, L 276/33, 1–47. [Google Scholar]
  56. European Union Reference Laboratory. Evaluation Report on the Analytical Methods Submitted in Connection with the Application for Authorisation of a Feed Additive According to Regulation (ec) No 1831/2003. Available online: https://ec.europa.eu/jrc/sites/default/files/FinRep-FAD-2013-0002-FUMzyme.doc_.pdf (accessed on 13 August 2015).
  57. Sulyok, M.; Berthiller, F.; Krska, R.; Schuhmacher, R. Development and validation of a liquid chromatography/tandem mass spectrometric method for the determination of 39 mycotoxins in wheat and maize. Rapid Commun. Mass Spectrom. 2006, 20, 2649–2659. [Google Scholar] [CrossRef] [PubMed]
Figure 1. Biotransformation of FB1 to HFB1 mediated by the fumonisin carboxylesterase FumD.
Toxins 08 00084 g001
Figure 2. Activity of FumD under digestive conditions (ex vivo pig model). Concentrations of FB1 and HFB1 (µM) were determined in intestinal contents of duodenum (1) and jejunum (2) previously spiked with 5 mL of an FB1 solution (83.1 µM, aiming for final concentration of 13.9 µM in intestinal contents) and additionally treated with 5 mL of pure water (FB (A)) or 5 mL of water containing FumD (1.2 U/mL, aiming for final concentration of 0.2 U/mL in intestinal contents, FB+FumD (B)). Samples were collected prior to (0 h) and after 2 h and 24 h of incubation at 39 °C, respectively.
Toxins 08 00084 g002
Figure 3. Mean serum sphinganine-to-sphingosine ratios (Sa/So) of piglets receiving either basal feed (CON), fumonisin-contaminated feed (2 mg/kg FB1+FB2; FB), fumonisin-contaminated feed supplemented with FUMzyme (2 mg/kg FB1+FB2, 60 U/kg FUMzyme; FB+FUMzyme), or basal feed supplemented with FUMzyme (60 U/kg; FUMzyme). Samples were collected from individual piglets (n = 10) prior to and after 14, 28, and 42 days of exposure to the different treatment diets, respectively. Error bars represent the standard deviation and superscript letters indicate significant differences between treatment groups (p < 0.05).
Toxins 08 00084 g003
Table 1. Concentrations of FB1, pHFB1a, pHFB1b, and HFB1 (ng/g) recovered in excreta of turkeys receiving either basal feed (CON), fumonisin-contaminated feed (15 mg/kg FB1+FB2; FB) or fumonisin-contaminated feed supplemented with FUMzyme (15 mg/kg FB1+FB2, 15 U/kg FUMzyme; FB+FUMzyme). Samples were collected from the individual animals (n = 5) on day 7 and day 14. Superscript letters indicate significant differences of analytes (mean ± standard deviation (SD)) between treatment groups on a respective sampling day (p < 0.05).
DayTreatment Group (n = 5)FB1 ± SD (ng/g)pHFB1a ± SD (ng/g)pHFB1b ± SD (ng/g)HFB1 ± SD (ng/g)
0CON<LOD<LOD<LOD<LOD
FB<LOD<LOD<LOD<LOD
FB+FUMzyme<LOD<LOD<LOD<LOD
7CON<LOD<LOD<LOD<LOD
FB2690 ± 147040.8 ± 32.3<LOQ194 ± 54.2 a
FB+FUMzyme1450 ± 92962.4 ± 46.1308 ± 2481340 ± 382 b
14CON<LOD<LOD<LOD<LOD
FB5240 ± 1930 a<LOD<LOD<LOD
FB+FUMzyme1190 ± 652 b<LOD407 ± 3801650 ± 368
FB1, fumonisin B1 (LOD 170 ng/g, LOQ 480 ng/g); pHFB1a, partially-hydrolyzed fumonisin B1a (LOD 30 ng/g, LOQ 80 ng/g); pHFB1b, partially-hydrolyzed fumonisin B1b (LOD 30 ng/g, LOQ 220 ng/g); HFB1, hydrolyzed fumonisin B1 (LOD 40 ng/g, LOQ 120 ng/g); <LOD, analyte concentration in all five individual samples below the limit of detection; <LOQ, analyte concentration in all five individual samples below the limit of quantification
Table 2. Serum sphinganine (Sa) and sphingosine (So) concentrations (ng/mL, mean ± standard deviation (SD)) as well as corresponding sphinganine-to-sphingosine ratios (Sa/So) of turkeys (n = 5) receiving basal feed (CON), fumonisin-contaminated feed (15 mg/kg FB1+FB2; FB) or fumonisin-contaminated feed supplemented with FUMzyme (15 mg/kg FB1+FB2, 15 U/kg FUMzyme; FB+FUMzyme) for 14 days ad libitum. Superscript letters indicate significant differences between treatment groups (p < 0.05).
Treatment GroupSa ± SD (ng/mL)So ± SD (ng/mL)Sa/So ± SD
CON6.61 ± 2.5142.1 ± 17.40.16 ± 0.02 a
FB8.03 ± 1.3134.5 ± 7.290.24 ± 0.02 b
FB+FUMzyme8.00 ± 3.4941.4 ± 17.40.19 ± 0.02 a
Table 3. Concentrations of FB1, pHFB1a, pHFB1b, and HFB1 (ng/g) recovered in feces of swine receiving either basal feed (CON), fumonisin-contaminated feed (2 mg/kg FB1+FB2; FB), fumonisin-contaminated feed supplemented with FUMzyme (2 mg/kg FB1+FB2, 60 U/kg FUMzyme; FB+FUMzyme), or basal feed supplemented with FUMzyme (60 U/kg; FUMzyme). Samples were collected from individual piglets (n = 10) prior to (day 0) and after 14, 28, and 42 days of exposure to the different treatment diets, respectively. Superscript letters indicate significant differences of analytes (mean ± standard deviation (SD)) between treatment groups on respective sampling day (p < 0.05).
DayTreatment Group (n = 10)FB1 ± SD (ng/g)pHFB1a ± SD (ng/g)pHFB1b ± SD (ng/g)HFB1 ± SD (ng/g)
0CON<LOQ<LOQ<LOQ<LOQ
FB<LOQ<LOQ<LOQ184 ± 285 a
FB+FUMzyme<LOQ<LOQ32.5 ± 17.2<LOQ
FUMzyme<LOQ<LOD<LOQ545 ± 548 b
14CON2350 ± 1960 a314 ± 174 a366 ± 221 a355 ± 190 a
FB6870 ± 815 b275 ± 153 a244 ± 177 a305 ± 225 a
FB+FUMzyme1980 ± 394 a844 ± 223 b929 ± 246 b1820 ± 269 b
FUMzyme1580 ± 609 a< LOQ142 ± 41.8 a231 ± 72.1 a
28CON<LOQ<LOQ<LOQ<LOQ
FB11,900 ± 1300 a<LOQ106 ± 26.5 a<LOQ
FB+FUMzyme2020 ± 442 b689 ± 201703 ± 213 b1510 ± 212
FUMzyme<LOQ<LOQ122 ± 30.9 a<LOQ
42CON (n = 9)3170 ± 235 a<LOQ256 ± 48.2 a<LOQ
FB14,900 ± 860 b252 ± 95.9 a326 ± 40.5 b349 ± 298 a
FB+FUMzyme5650 ± 1390 c1170 ± 113 b983 ± 104 c1820 ± 293 b
FUMzyme549 ± 322 d<LOQ175 ± 26.5 d321 ± 153 a
FB1, fumonisin B1 (LOD 56.0 ng/g, LOQ 560 ng/g); pHFB1a, partially-hydrolyzed fumonisin B1a (LOD 41.6 ng/g, LOQ 413 ng/g); pHFB1b, partially-hydrolyzed fumonisin B1b (LOD 9.6 ng/g, LOQ 51.2 ng/g); HFB1, hydrolyzed fumonisin B1 (LOD 83.2 ng/g, LOQ 416 ng/g); <LOD, analyte concentration in all ten individual samples below the limit of detection; <LOQ, analyte concentration in all ten individual samples below the limit of detection or below the limit of quantification.
Table 4. Concentrations of fumonsins and FUMzyme in different treatment diets of the turkey and pig feeding trial, respectively.
TrialTreatment Group∑ FB1+FB2 (mg/kg)FUMzyme (U/kg)
TurkeyCON--
FB15-
FB+FUMzyme1515
PigCON--
FB2-
FB+FUMzyme260
FUMzyme-60
Table 5. Composition of basal diets used in the turkey and pig feeding trial.
Ingredient (%)TurkeyPig
Corn44.242.3
Soybean meal31.024.0
Wheat15.020.0
Whey powder-4.5
Vegetable fat-1.5
Vegetable protein-1.1
Sunflower/palm kernel oil3.31.9
Pumpkin seed cake0.7-
Lignocellulose0.6-
Calcium carbonate1.90.8
Calcium phosphate1.81.4
Natrium carbonate0.3-
Natrium chloride0.20.2
Magnesium phosphate0.1-
Potassium diformiate 0.1
Lysine0.30.6
Methionine0.20.2
Threonine0.10.2
Tryptophan-0.1
Valine-0.1
Vitamin/mineral-premix0.3 11 2
Analyzed Composition 3
Crude protein (g)227193
Crude fibre (g)3627
Starch (g)441515
Metabolizable energy (MJ)14.216.2
1 Main ingredients and final concentrations in basal diet: vitamin A (14.1 MIU/kg), vitamin D3 (4.9 MIU/kg), vitamin E (100 mg/kg), vitamin C (87 mg/kg), vitamin B1 (4.9 mg/kg), vitamin K3 (3.5 mg/kg), iron (110 mg/kg), copper (24 mg/kg), zinc (72 mg/kg). 2 Main ingredients and final concentrations in basal diet: vitamin A (16875 IU/kg), vitamin D3 (2000 IU/kg), vitamin E (253.75 mg/kg), vitamin C (63.5 mg/kg), vitamin B1 (4 mg/kg), vitamin K3 (4.37 mg/kg), iron (151.12 mg/kg), copper (170.0 mg/kg), zinc (126.75 mg/kg). 3 Corresponding to 1000 g dry matter/kg.
Table 6. Method performance parameters for sphingoid bases sphinganine (Sa) and sphinogosine (So) in turkey and pig serum.
MatrixAnalyteRA a ± RSD (%)SSE b ± RSD (%)RE c ± RSD (%)
Turkey serumSa93.4 ± 1.198.2 ± 2.795.2 ± 2.9
So90.6 ± 0.593.4 ± 4.197.3 ± 4.5
Pig serumSa82.5 ± 0.596.7 ± 7.485.6 ± 7.7
So79.9 ± 5.794.2 ± 5.985.2 ± 10.5
a Apparent recovery. b Signal suppression/enhancement. c Extraction recovery.

