
Probing the Characterization of the Interaction of Aflatoxins B1 and G1 with Calf Thymus DNA In Vitro

College of Food Science, Southwest University, Beibei District, Chongqing 400715, China
*
Author to whom correspondence should be addressed.
†
These authors contributed equally to this work.
Toxins 2017, 9(7), 209; https://0-doi-org.brum.beds.ac.uk/10.3390/toxins9070209
Submission received: 19 April 2017
/
Revised: 20 June 2017
/
Accepted: 28 June 2017
/
Published: 1 July 2017
(This article belongs to the Collection Aflatoxins)
Abstract
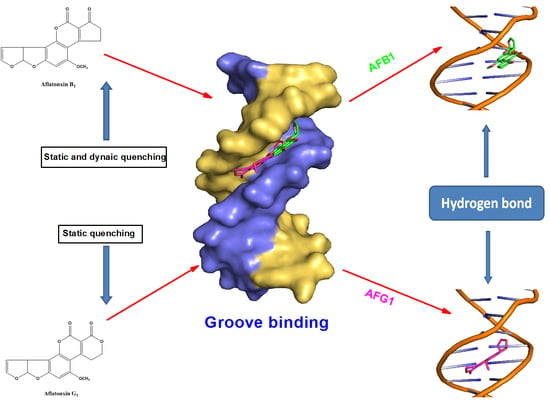
:The binding characterization of aflatoxins with calf thymus DNA (ctDNA) under physiological conditions was investigated. Multispectroscopic techniques, ctDNA melting, viscosity measurements, and molecular docking techniques were employed to elucidate the binding mechanism of the aflatoxins with DNA. The fluorescence results indicated that both aflatoxin B1 (AFB1) and aflatoxin G1 (AFG1) bound to the ctDNA, forming complexes through hydrogen bonding. The binding constants of AFB1 and AFG1 with ctDNA reached up to 103 L·mol−1 and 104 L·mol−1, respectively, and AFG1 exhibited a higher binding propensity than that of AFB1. Furthermore, both AFB1 and AFG1 bound to the ctDNA through groove binding, as evidenced by the results of the spectroscopic, iodide quenching effect, viscosity, and ctDNA melting measurements. Changes in the circular dichroism signal manifested that both AFB1 and AFG1 induced an increase in the right-handed helicity, but only minimally influenced the base stacking of the DNA. A molecular docking study of the aflatoxin’s binding with the DNA revealed a groove binding mode, which was driven mainly by hydrogen bonding. This study of aflatoxin–ctDNA interaction may provide novel insights into the toxicological effect of the mycotoxins.
1. Introduction
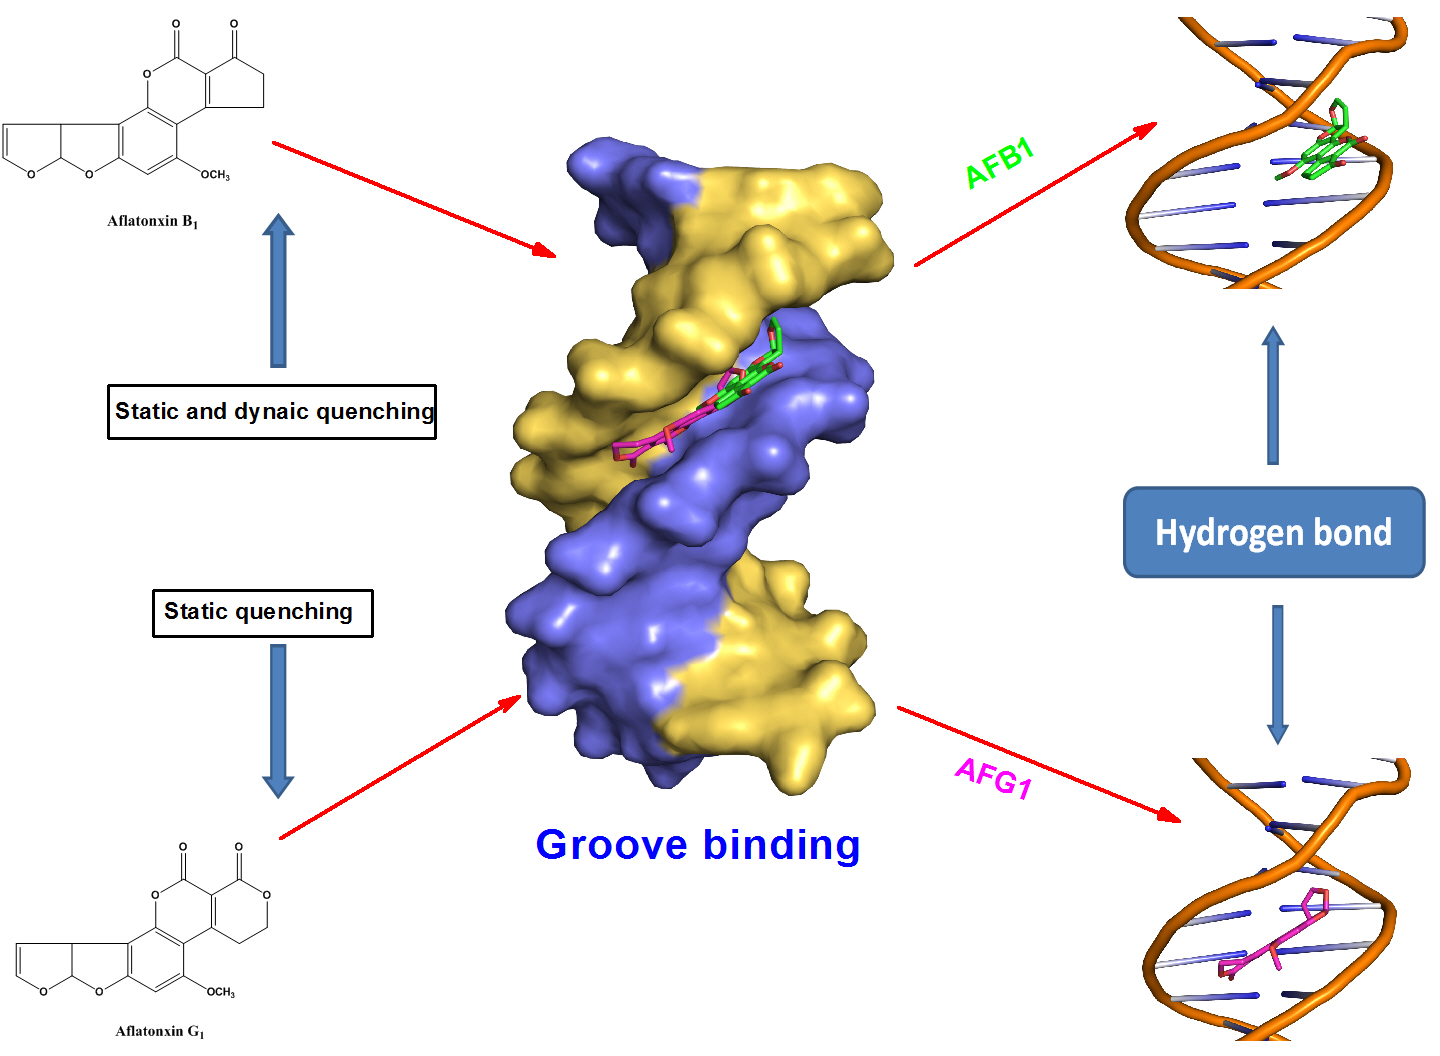
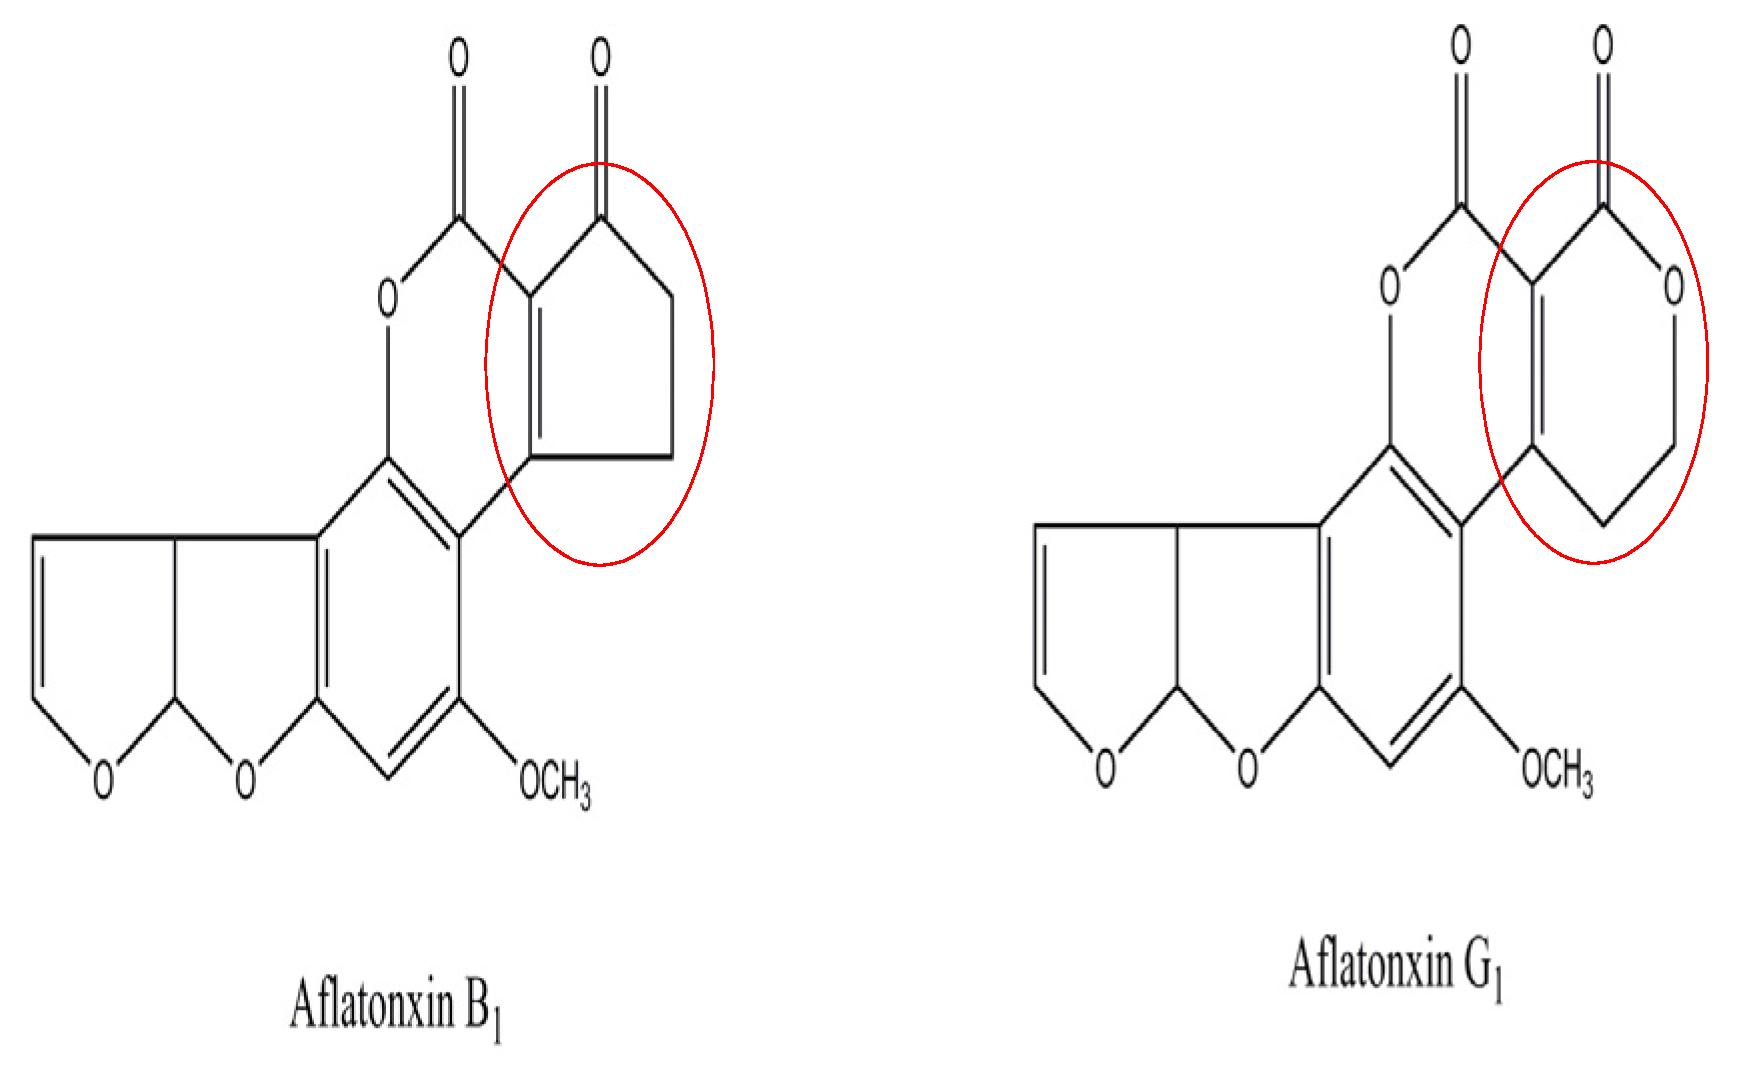
Aflatoxins are among the most toxic mycotoxins and have attracted considerable attention because of the great threat they pose to human health. The aflatoxin contamination of animal feeds and food has become an important issue because of the potential adverse health effects of aflatoxin, including kidney disorders, immune suppression, and even cancers [1]. The exposure to aflatoxins has adverse effects on the animal and food industries [2]. Aflatoxin B1 (AFB1) and aflatoxin G1 (AFG1) (Figure 1) are secondary toxic metabolites mainly produced by the fungi Aspergillus flavus and Aspergillus parasiticus, and commonly contaminate peanut, corn, cotton and other oil crops [3].
AFB1 is one of the most toxic mycotoxins and has been classified as a group I known human carcinogen [4]. It also displays other biological effects such as mutagenicity and teratogenicity in humans and animals [5]. Moreover, the International Agency for Research on Cancer has classified AFG1 as a group 2B toxin, indicating that it is possibly carcinogenic to humans [6]. AFG1 possesses a similar structure to that of AFB1, and AFG1 toxicity is known as second only to AFB1 toxicity among all the aflatoxins. AFG1 has also induced liver-tumor formation in experimental animals, but usually at a lower occurrence than that of AFB1 [7].
DNA is an important macromolecule that carries substantial hereditary information, controls cellular metabolism, and facilitates the biological synthesis of protein [8]. DNA has been proven as a target molecule of various drugs, pesticides, and toxic compounds [9,10]. Pesticides and other harmful substances could enter cells and interact with the DNA, which may cause a change in the DNA, and even lead to genetic mutations or the occurrence of cancer [11,12]. Therefore, exploring the interaction mechanisms of aflatoxins with DNA is of great importance for selecting therapeutic drugs and understanding DNA damage mechanisms. Generally, small molecules interact with DNA through covalent or noncovalent interactions. Additionally, small molecules interact with DNA in a noncovalent binding through three modes: (i) intercalation between the base pairs; (ii) groove binding; and (iii) electrostatic interaction [13]. Among the three binding modes, intercalative binding is the most effective, and causes the greatest damage on the DNA’s conformation. AFB1 is metabolized as AFB1–exo-8,9-epoxide by human cytochrome P450s after entering the body. AFB1–exo-8,9-epoxide can bind covalently to DNA to form the AFB1–DNA adduct [14]. The formation of the AFB1–N7−Gua adduct has been proven to be related to the occurrence of hepatic tumors in trout and rats [15].
However, a portion of aflatoxins can directly interact with DNA in cells without being metabolized as their epoxides. In this case, a reversible noncovalent interaction ensues between the aflatoxins and the DNA. To some extent, owing to the reversibility of noncovalent interactions, it is typically preferred over covalent adduct formation when keeping the drug metabolism and toxic side effects in mind [16]. In our study, the noncovalent interactions of two kinds of aflatoxins with calf thymus DNA (ctDNA) were investigated in vitro. UV–vis spectroscopy, fluorescence spectroscopy, circular dichroism (CD), and molecular docking were employed to study the interaction mechanisms of aflatoxins with DNA. Competitive displacement, iodide quenching effect, viscosity, and DNA melting assays were used to identify the binding mode. We hope that this study will be helpful to further an understanding of the binding mechanisms of aflatoxins with DNA and the toxicological effects of aflatoxins.
2. Results
2.1. Dialysis Assay
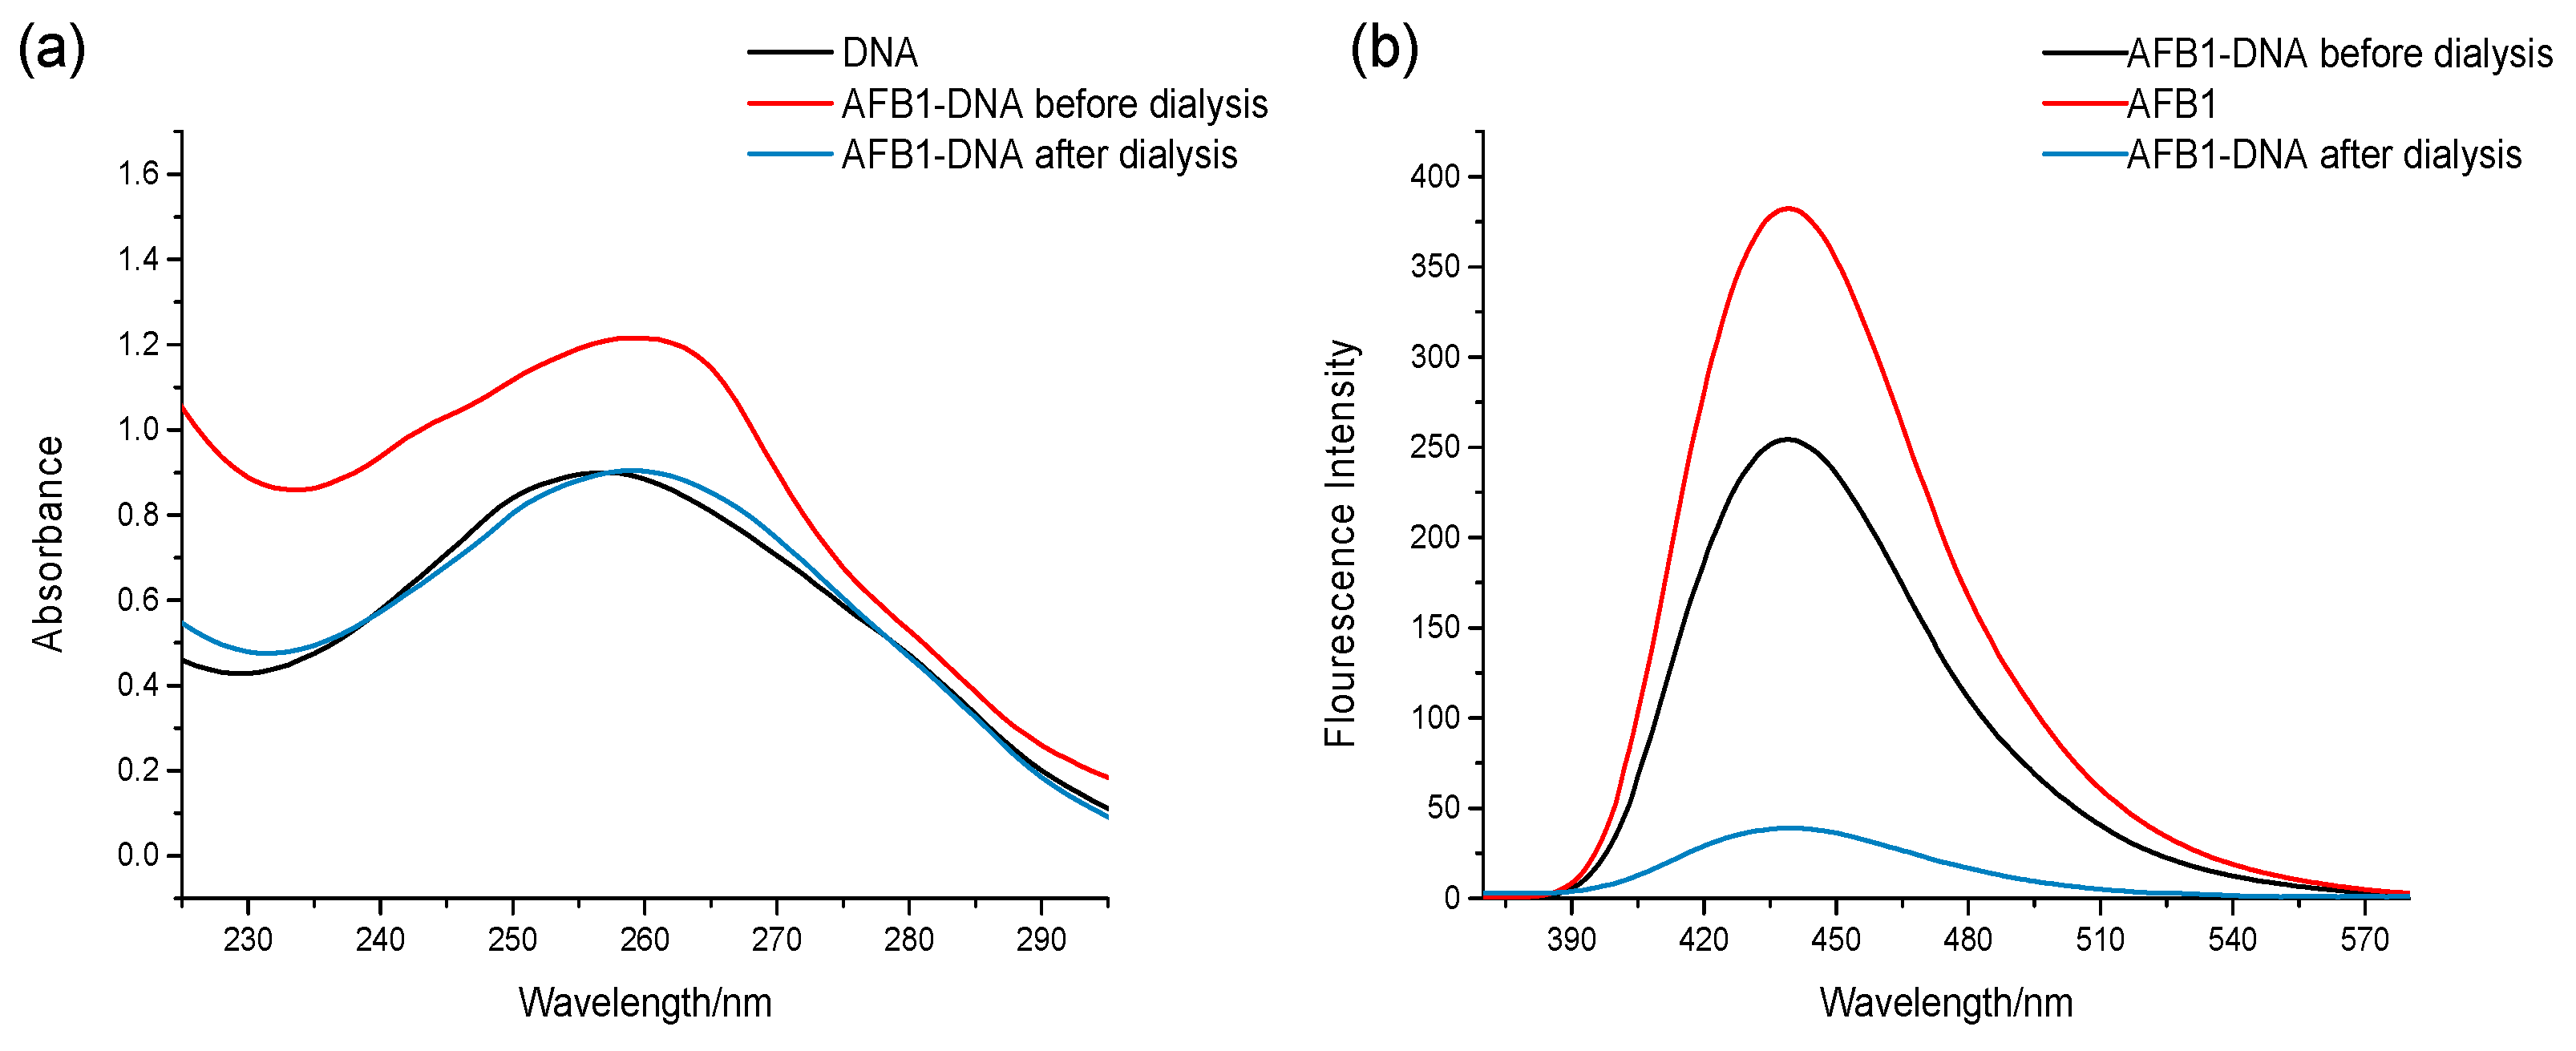
Aflatoxins can bind to DNA via covalent interactions (irreversible binding) or noncovalent interactions (reversible binding). Hence, we initially explored the interaction mode of the binding between AFB1/AFG1 and DNA. In this study, dialysis was employed to investigate the binding mode between AFB1/AFG1 and DNA [16]. If the bind between AFB1/AFG1 and the DNA was noncovalent, the UV absorbance and fluorescence emission of the AFB1/AFG1–DNA complex would be changed after the dialysis because of the separation of the small molecules from the DNA. This could be attributed to the reversibility of the interaction. However, owing to the fact that covalent binding is irreversible, if the combination of AFB1/AFG1 and DNA were covalent, the UV absorbance and fluorescence emission of the AFB1/AFG1–DNA complex would not be significantly altered after the dialysis. Therefore, we studied the changes in the UV absorbance/fluorescence spectra of the AFB1–DNA and AFG1–DNA complexes in this manner. Figure 2 shows whether the absorbance or emission of the AFB1–DNA complex had changed after dialysis. The reason for the change in spectra was that AFB1 was separated from the DNA. The absorbance and emission spectra changes of the AFG1–DNA complex were in agreement with that of the AFB1–DNA complex. Hence, the interaction between AFB1/AFG1 and ctDNA was noncovalent rather than covalent.
2.2. Fluorescence and Resonance Light Scattering (RLS) Spectra
2.2.1. Fluorescence Studies
Given that aflatoxins could emit fluorescence under ultraviolet irradiation, a series of experiments based on fluorescence spectroscopy were performed to explore the binding mechanism of aflatoxins to DNA. AFB1/AFG1 displayed strong emission spectra, with emission maxima at 440 nm when excited at 365 nm. The fluorescence intensity of AFB1/AFG1 consistently decreased with increasing amounts of ctDNA. Moreover, the quenching rates of AFB1/AFG1 were 37% and 61.5% when the DNA concentration reached 5 × 10⁻⁵ mol·L−1, whereas the position and shape of the peaks did not change. Thus, AFB1/AFG1 interacts with ctDNA through noncovalent bonds rather than covalent bonds [17]. This finding indicates that DNA is a potential target of small molecules and directly confirms the interaction between AFB1/AFG1 and ctDNA [18].
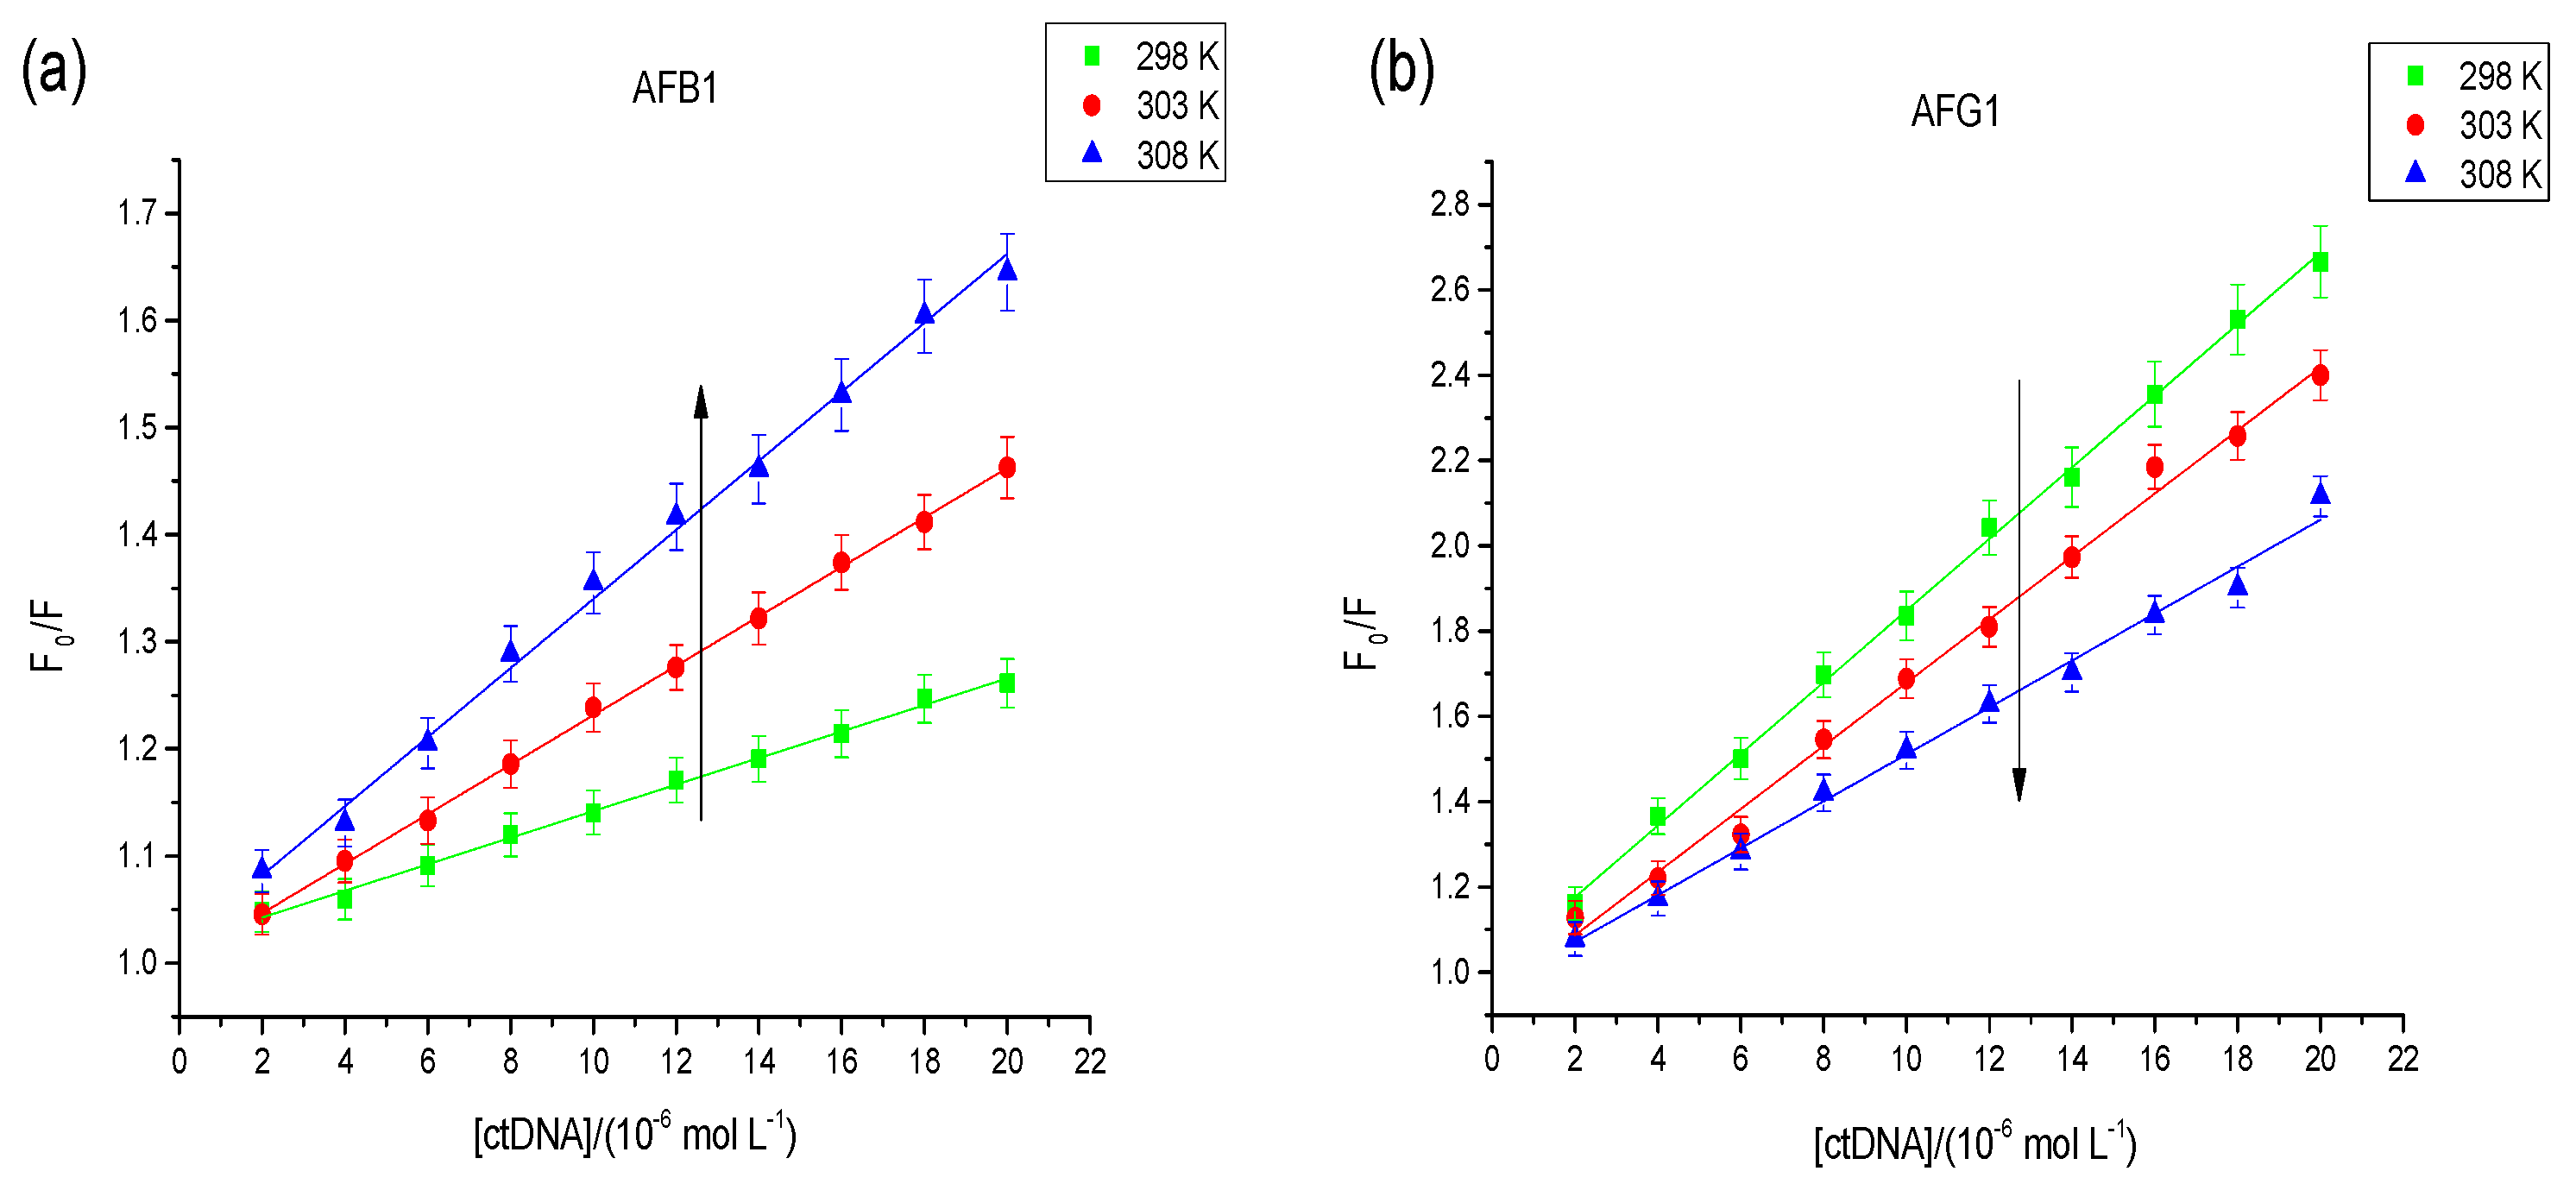
The common types of fluorescence quenching include static quenching, dynamic quenching, and the combination of both. Therefore, fluorescence data could be studied using the Stern–Volmer equation [19]:
where F0 and F are the fluorescence intensities in the absence and presence of a quencher; Kq is the quenching rate constant of the biomolecules; τ0 is the average lifetime of the biomolecule without a quencher (1 × 10⁻⁸ s); Ksv is the Stern–Volmer quenching constant; and [Q] is the quencher’s concentration [20].
Dynamic quenching depends on diffusion, that is, a temperature rise will increase the effectiveness of the collision molecule, thus Ksv will be increased. Static quenching occurs when ground-state complexes are formed by the binding of fluorophore and quencher molecules [21]. In contrast, the stability of ground-state complexes will be reduced with an increased temperature, thus Ksv will be decreased. As shown in the Figure 3, the type of quenching interaction between AFG1 and the DNA was static quenching; however, both static and dynamic quenching was found between AFB1 and the DNA.
The binding constant (Ka) for the complex formed between AFB1/AFG1 and ctDNA was estimated using modified Stern−Volmer equation [22]:
where fa is the fraction of accessible fluorescence, and Ka is the modified Stern−Volmer association constant for the accessible fluorophores. The constant Ka is the quotient of an ordinate 1/fa and slope 1/faKa. The corresponding Ka values at three different temperatures are displayed in Table 1. The altered trend of Ka with rising temperature agrees with the trend of Ksv analyzed previously. This result indicates that the binding of AFB1/AFG1 with DNA was feasible, and that a reversible AFB1/AFG1–DNA complex may have formed [23]. The Ka value of the AFB1–DNA complex at 298 K was 4.12 × 10³ L·mol−1, which agrees with that obtained through subsequent UV spectroscopy and supports the effective role of static and dynamic quenching [24]. A comparison shows that the Ka of the AFG1–DNA complex was greater than that of the AFB1–DNA complex. The difference in Ka mainly depends on the structural differences of the aflatoxins. This indicates that the hexatomic ring of AFG1 has a larger dimension and stronger stability than the five-member ring of AFB1 and that induced AFG1 has a stronger DNA binding than AFB1.
The corresponding thermodynamic parameters were analyzed to further probe the characteristics of the interaction between aflatoxins and DNA. Several binding forces exist between small molecules and biological macromolecules, including electrostatic interactions, van der Waals interactions, hydrogen bonds, and hydrophobic forces. The thermodynamic parameters were calculated using the following equations to explore the acting forces [25]:
where R refers to the gas constant (8.314 J·K−1·mol−1), T refers to the temperature in Kelvin, and K is the binding constant at different temperatures (298, 303, and 308 K). ΔH can be considered a constant when the temperature varies in small degrees. According to the perspective of Ross and Subramanian, the main interaction force can be concluded as follows: (1) hydrophobic interactions, ΔH > 0 and ΔS > 0; (2) van der Waals or hydrogen bonds, ΔH < 0 and ΔS < 0; and (3) hydrogen bonding with hydrophobic interactions, ΔH < 0 or ΔH ≈ 0 and ΔS > 0 [25]. As shown in Table 2, the hydrogen bonding with hydrophobic interaction played a major roles in the binding between AFB1 and the DNA and contributed to the stability of the complex. Unlike AFB1, the negative values of ΔH and ΔS indicate that the AFG1–DNA complexation process was driven mainly by hydrogen bonds and van der Waals forces. Moreover, the two kinds of binding reaction were also spontaneous as indicated by the negative signs of the ΔG values [25].
2.2.2. RLS Spectral Analysis
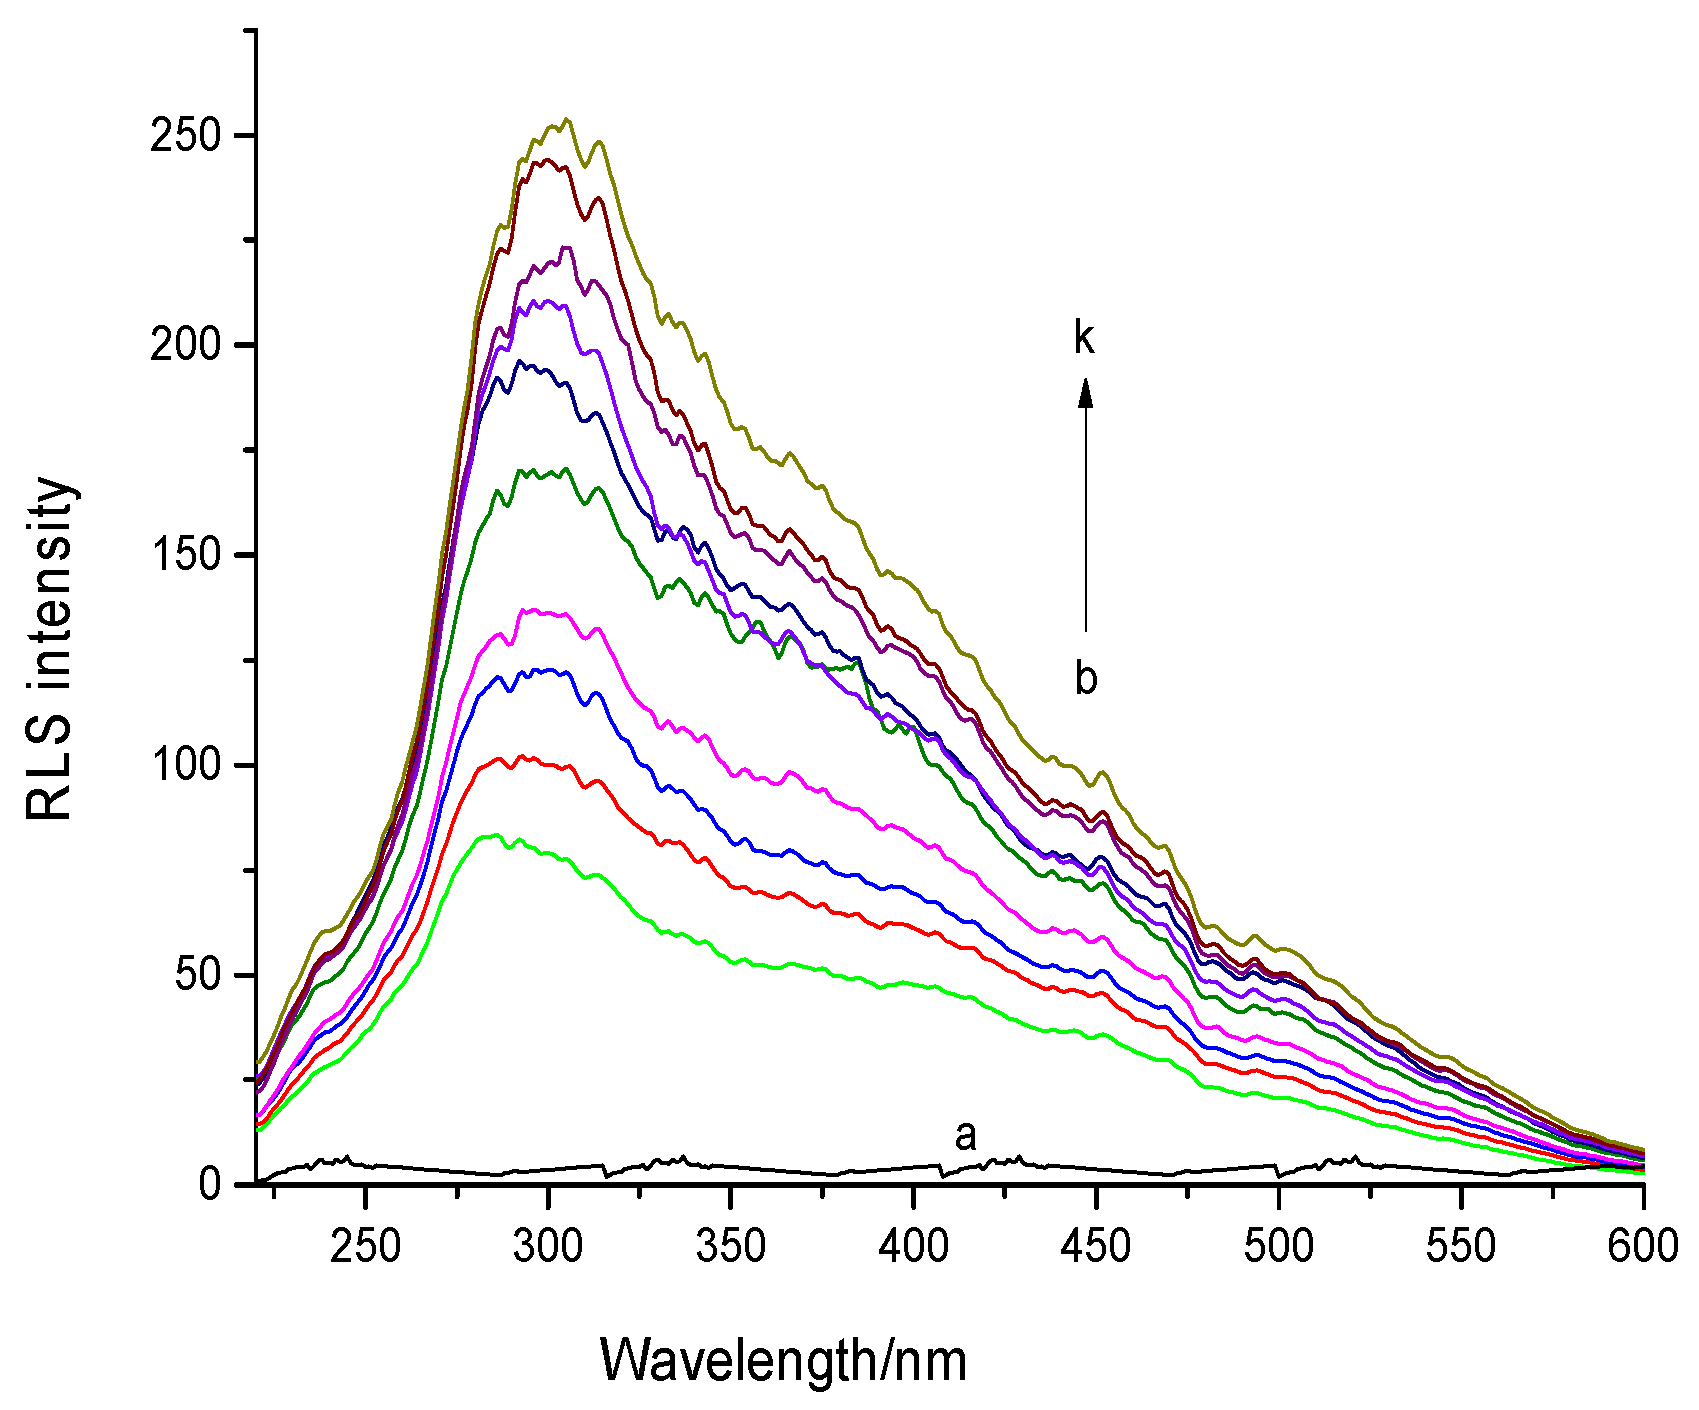
The RLS spectra of AFB1 and the AFB1−ctDNA system in the phosphate-buffered saline (PBS) buffer (pH 7.4) are shown in Figure 4. The RLS intensity of AFB1 was significantly increased with the increasing of the ctDNA concentration, which indicated that AFB1 interacted with the DNA. According to RLS theory, RLS intensity is related to the dimension of the formed particle, that is, larger particles would produce stronger light-scattering signals [26,27]. Therefore, we concluded that the formation of an AFB1-DNA complex was due to the addition of DNA. Based on the results of previous related studies, we assumed that the enhancement of the RLS signal of AFB1was due to the groove binding of the ctDNA rather than intercalation [9,28]. Further experiments were performed to confirm this conclusion.
2.3. Competitive Displacement Assays
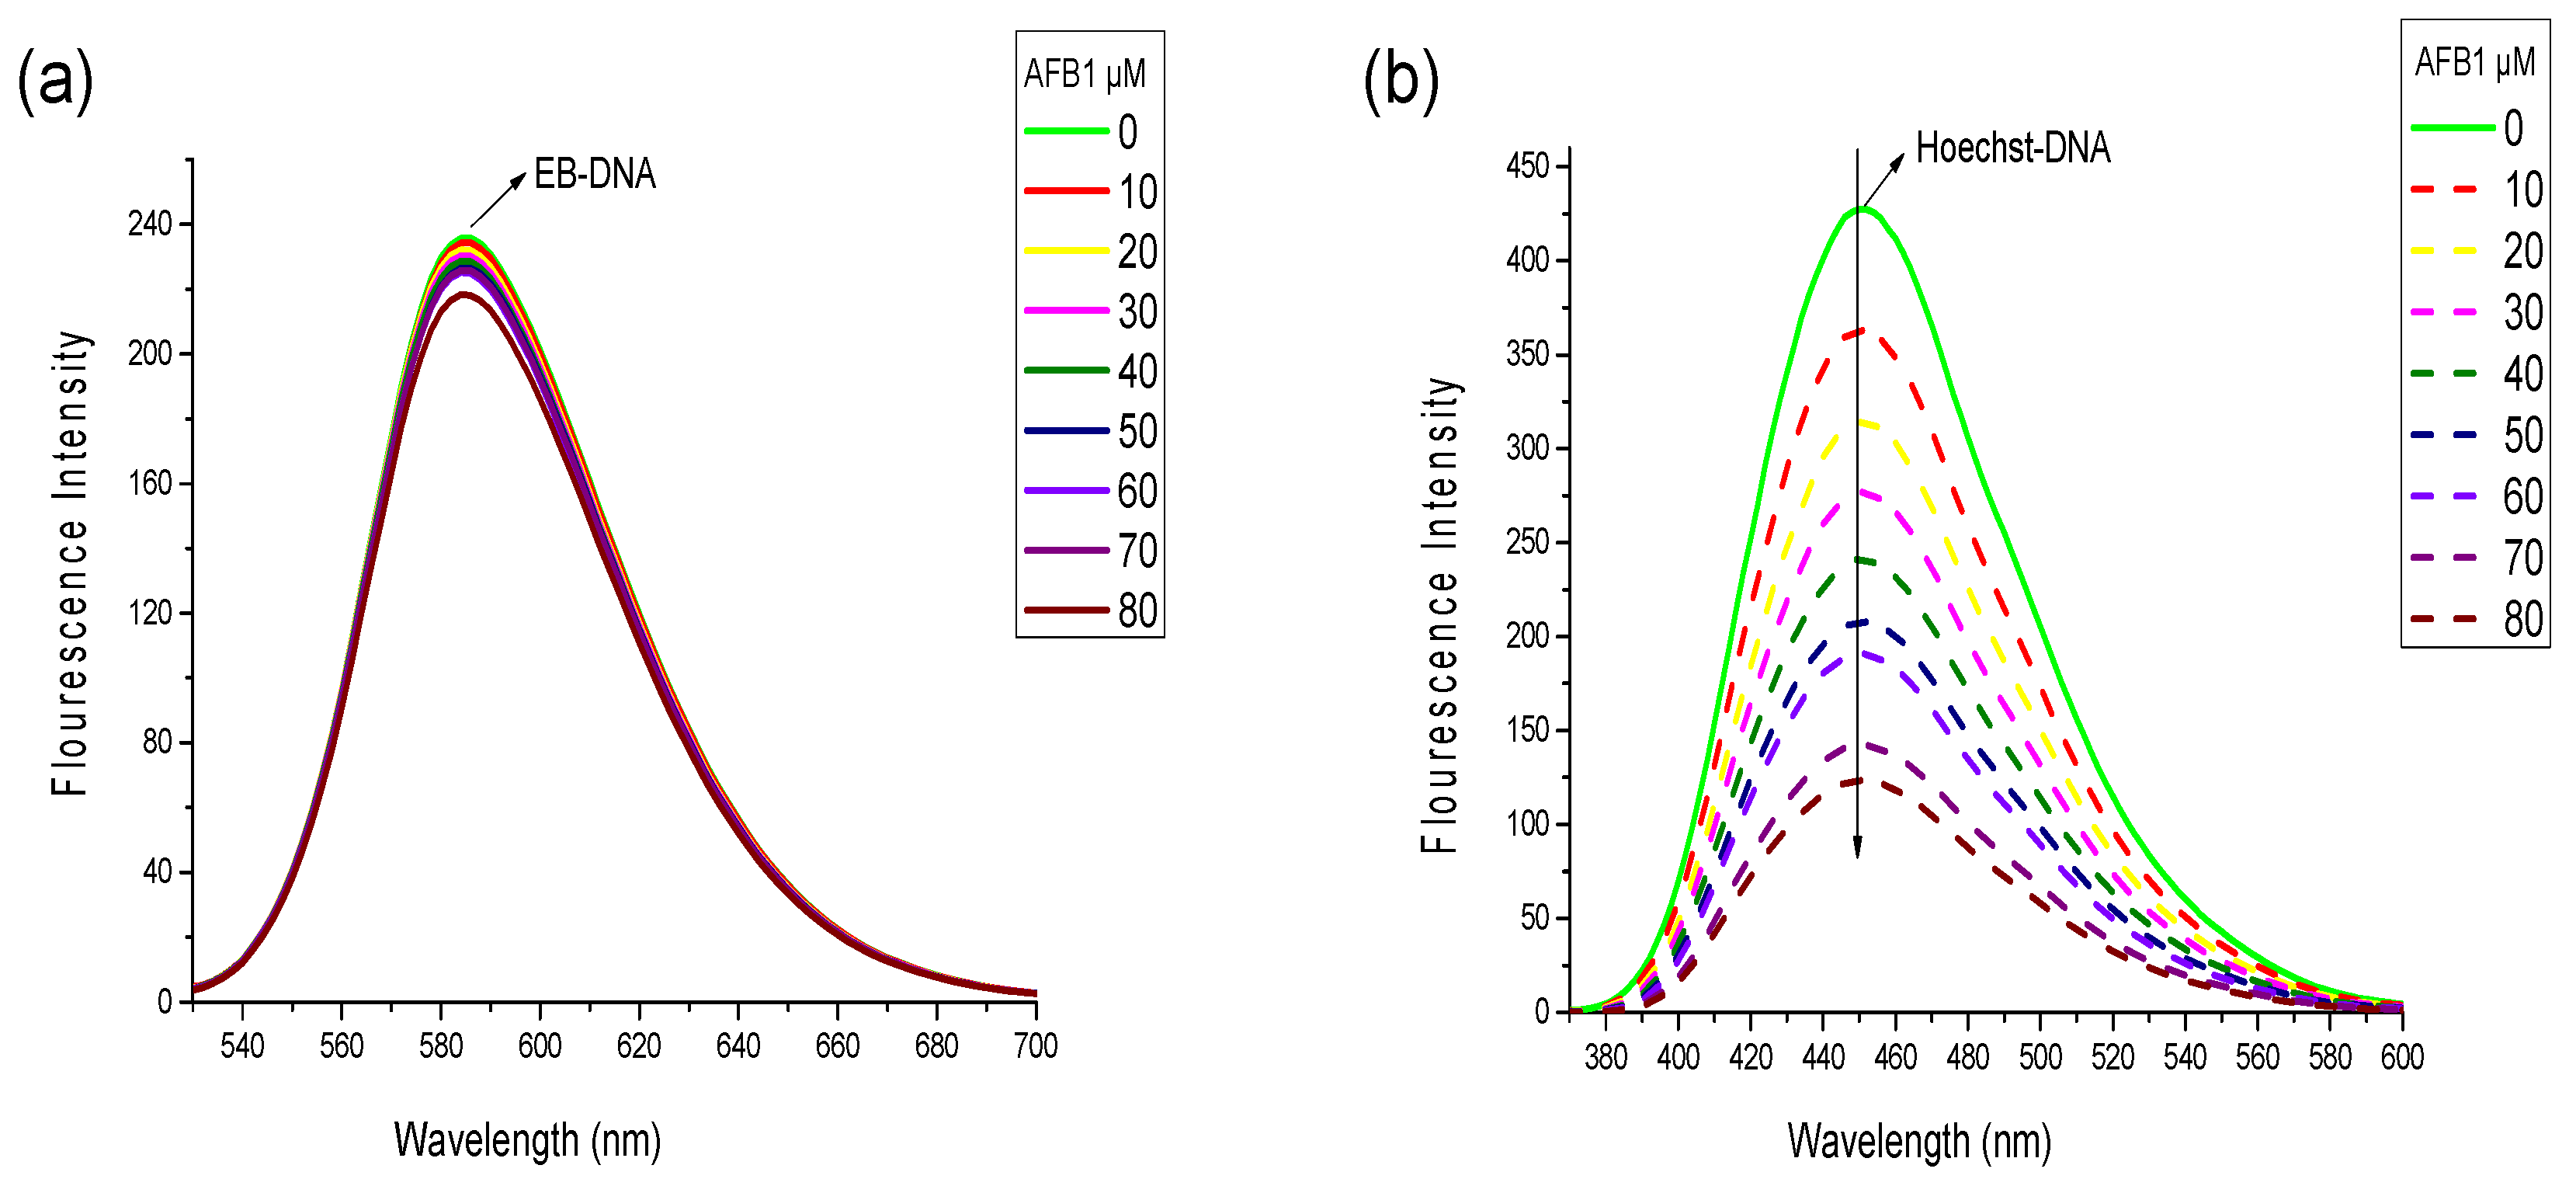
To identify the binding mode of AFB1/AFG1 to the DNA from various aspects, competitive displacement experiments were performed. Considering that any small molecule replacing the binding dye, such as EB and Hoechst 33258, from DNA will interact with the DNA via the same mode as the replaced dye, the binding mode of AFB1/AFG1 could be elucidated by studying the changes in fluorescence spectra of a dye–DNA complex with the addition of aflatoxins [29]. EB used as a fluorescence probe and could bind to DNA via intercalation [30]. Notably, neither a shift nor quenching of the fluorescence peak of EB was observed when AFB1/AFG1 was added, suggesting that no interaction existed between AFB1/AFG1 and EB. Similar results were observed with Hoechst 33258. Free EB has very weak fluorescence intensity in a PBS buffer. However, the fluorescence intensity of EB increased when the planar ring of EB was inserted between base pairs in the DNA double helix [30]. The fluorescence spectra of the EB–ctDNA complex in the absence and presence of AFB1 are shown in Figure 5a. With increasing AFB1 concentration, the emission intensity of the EB–DNA complex’s slightly decreased and did not significantly change. The final fluorescence intensity reached 90% of the original EB–DNA fluorescence intensity with the addition of AFB1, indicating that AFB1 did not replace the EB from the DNA’s double helix.
Hoechst 33258 is a classic groove-binding dye that binds in the minor groove of DNA [31]. Similar to EB, Hoechst 33258 can produce intense fluorescence through when it binds to DNA through groove binding. At this point, we observed an apparent fluorescence quenching effect different from that in Figure 5b. With the addition of AFB1, the fluorescence intensity of the Hoechst 33258–DNA solution remarkably decreased at 457 nm because many Hoechst 33258 molecules were replaced from the DNA‘s groove and released into the solution. AFG1 caused a similar reduction in the fluorescence intensity of the EB/Hoechst 33258-ctDNA complex. Given the above results, we inferred that groove binding is the major binding mode between AFB1/AFG1 and ctDNA.
2.4. UV–Visible Spectroscopy
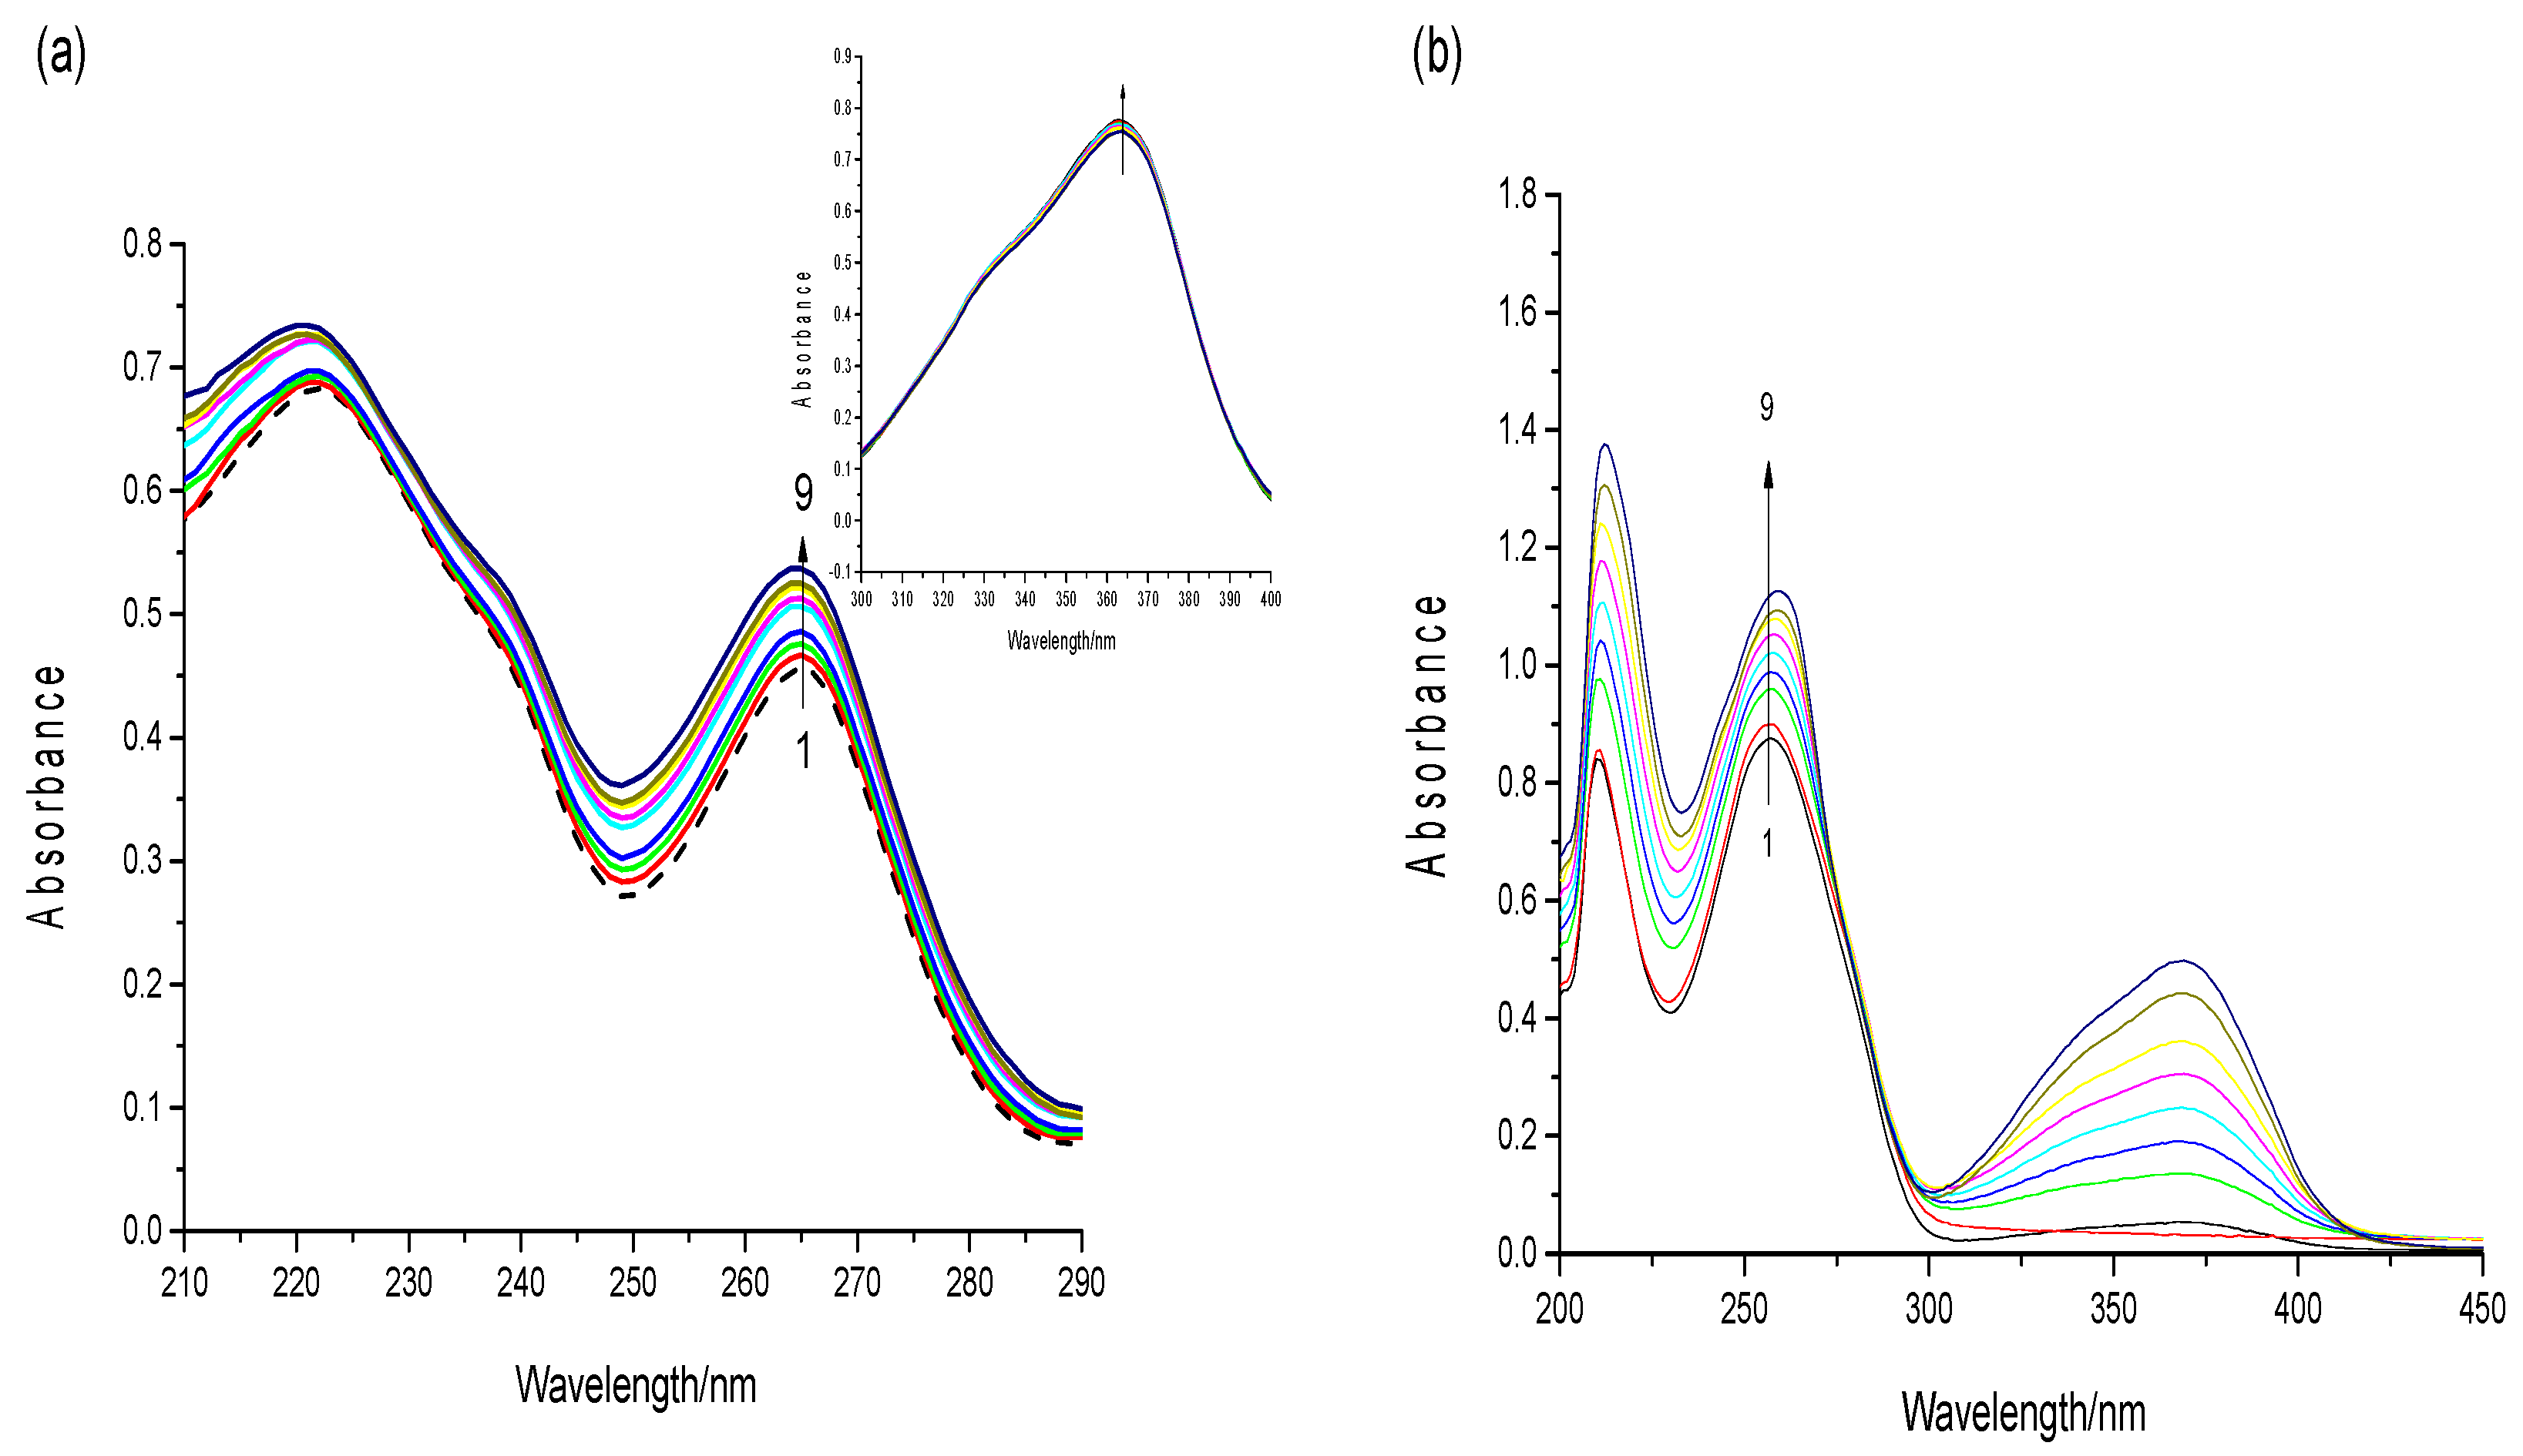
DNA has a characteristic absorption peak at approximately 260 nm, which is caused by aromatic base and phosphate chromophores [32]. To thoroughly observe the spectrum changes, a high concentration of aflatoxins (3.5 × 10⁻⁵ mol·L−1) was used in a UV–vis absorption experiment. The UV spectra of the AFB1 solution as ctDNA was added was obtained. As shown in Figure 6a, with an increasing concentrations of ct-DNA, AFB1 exhibited significant hyperchromism with slight blue shift at 267 nm and 221 nm. However, the absorption peak of AFB1 at 365 nm revealed only slight hyperchromism. The peak at 365 nm was a characteristic peak of the AFB1 molecule, which related to the toxicity of AFB1. Additionally, the peaks at 267/221 nm were attributed to the bifuran structure of AFB1. Based on this result, we inferred that DNA binding greatly influenced the bifuran structure of AFB1. Similar results were noted on the behavior of ctDNA in the presence of AFG1.
Moreover, the UV–vis spectra of the DNA with the addition of AFB1 are shown in Figure 6b. The absorption peak of DNA at 260/210 nm exhibited a gradual increase and red shift with the increasing concentration of AFB1. The hyperchromicity may be attributed to external contact (groove or electrostatic binding) or the disruption of the DNA’s secondary structure [33]. Also, the absence of isobestic points in the UV–vis spectroscopy indicated that the complex formations had noncovalent interactions, such as groove binding [34]. These results indicate that the binding of AFB1 to ctDNA is nonintercalating, which is possibly caused by hydrophobic forces or hydrogen bonding of the oxygen atoms in AFB1 with the DNA’s nucleobases [35]. The phenomena observed with increasing AFG1 concentration were similar to those observed for AFB1.
For a qualitative determination of the interaction intensity between AFB1/AFG1 and ctDNA, the binding constants (Kb) were calculated using the following equation [36]:
where A0 and A are the absorbance of AFB1/AFG1 in the absence and presence of DNA, and εG and εH–G are their absorption coefficients respectively. G and H–G represents the ctDNA and AFB1/AFG1–DNA species. In the plot of A0/(A − A0) versus 1/[DNA], Kb was obtained by obtaining the intercept-to-slope ratio. The Kb value of the AFB1–DNA complex was found to be 4.26 × 10³ L·mol−1, which was less than that of the AFG1–DNA complex (Kb = 1.43 × 10⁴ L·mol−1). The calculated Kb values at 298 K (order of 103 or 104) were smaller than that reported for a typical classic intercalator (order of 105) [37]. Furthermore, by comparison with the Kb value of other DNA groove binders, the binding mode between AFB1/AFG1 and the DNA was deduced to be groove binding [38].
2.5. Viscosity Measurements
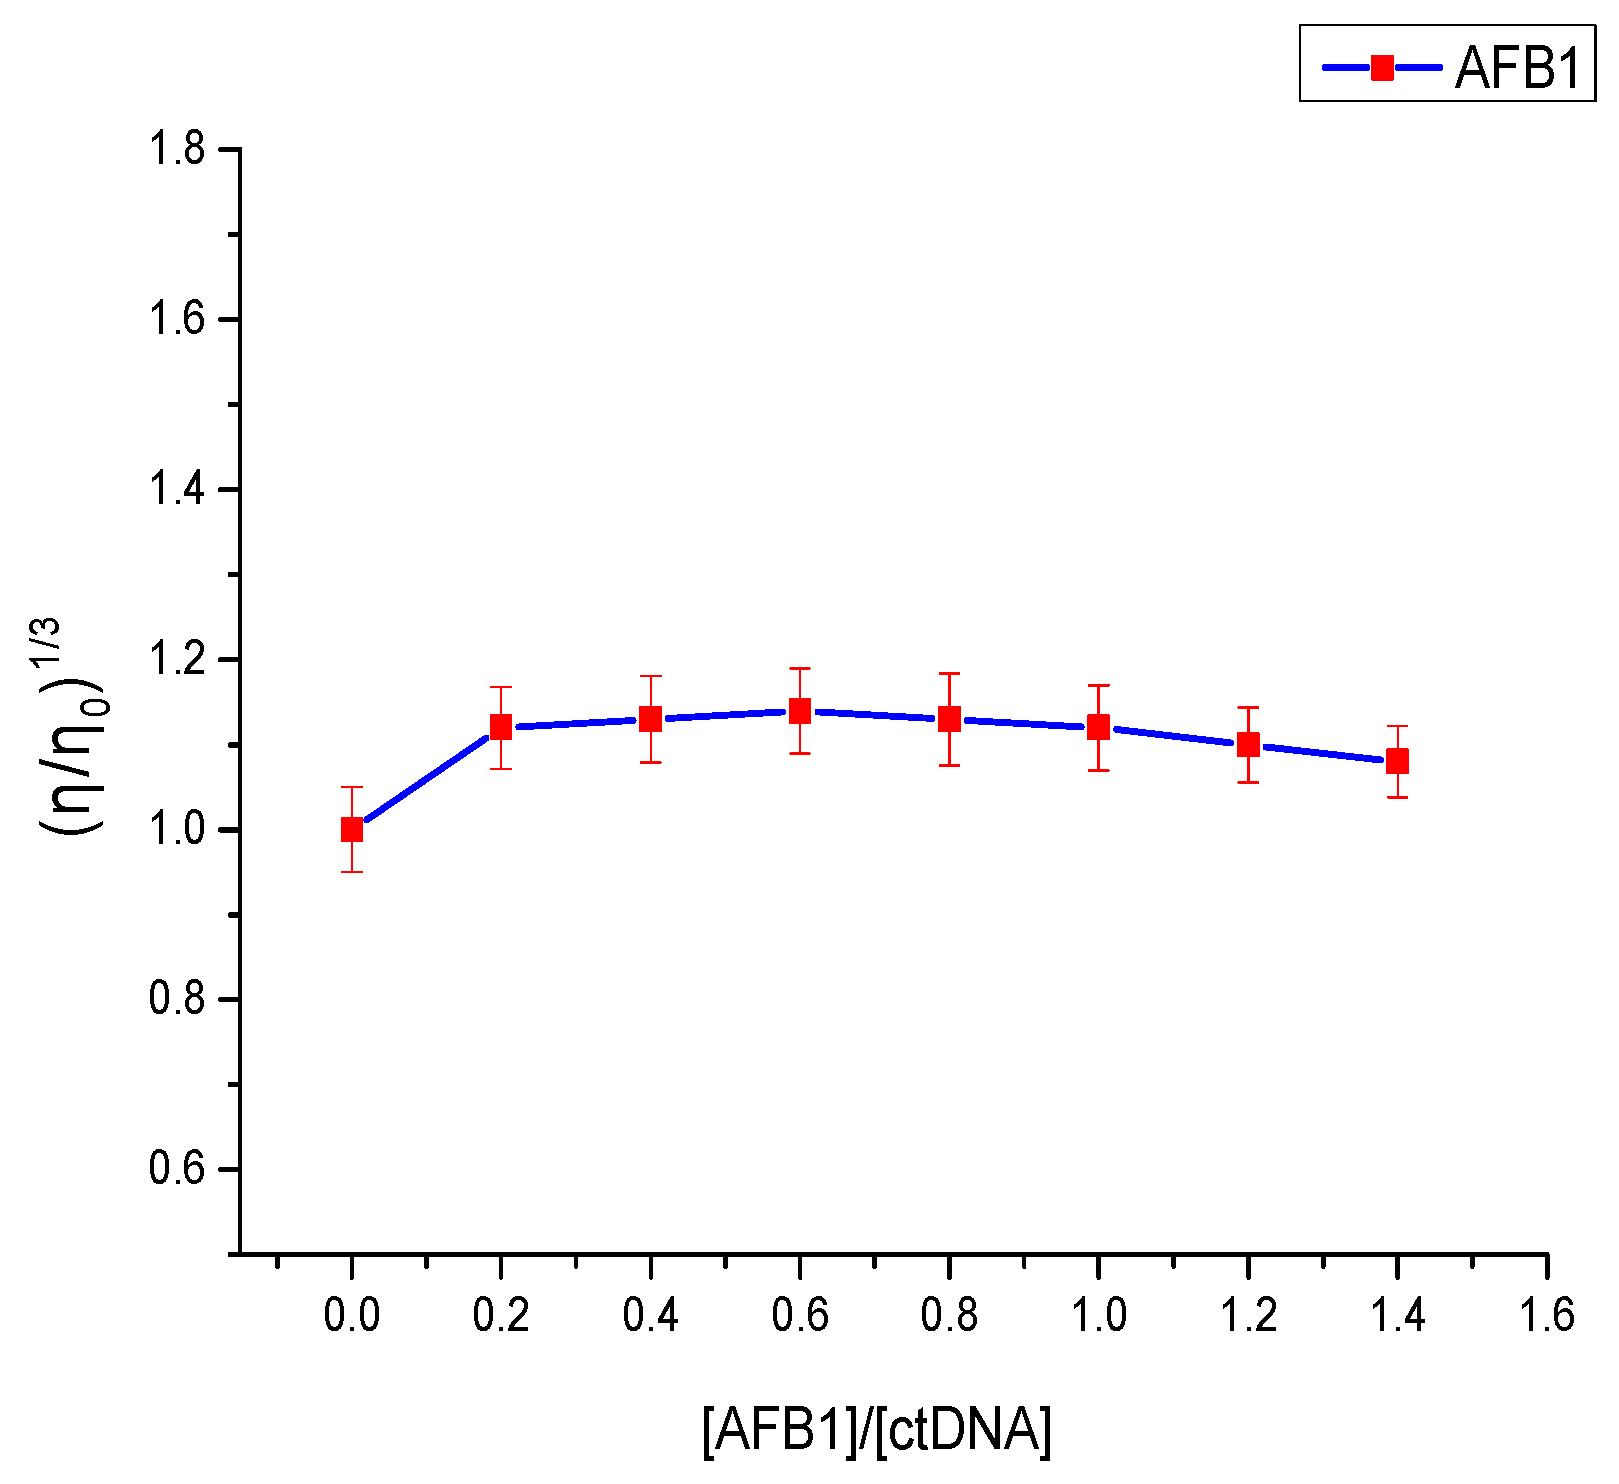
Viscosity experiments are regarded as the least ambiguous and effective tool to explore the binding mode of small molecules to DNA [39]. Intercalation binding increases DNA viscosity because small-molecule intercalation requires a sufficiently large space between base pairs to accommodate the bound molecules and elongate the double-helix DNA [40]. In contrast, few changes were observed on the DNA’s viscosity when electrostatic interaction or groove binding ensued during the binding process [41]. As seen in Figure 7, the viscosity of the DNA solution showed no significant change upon the addition of AFB1. Similarly, such change was exhibited in the binding of AFG1 to the DNA. This proved that the binding mode of AFB1/AFG1 to ctDNA is groove binding.
2.6. DNA Melting Assay
The thermal melting temperature (Tm) is the temperature at which half of a DNA sample melts and it reflects the stability change of the DNA double-helix structure [29]. Thermal melting temperature is also an important parameter for determining the binding mode of small molecules to DNA [42]. Small-molecule interaction with DNA could influence Tm. Generally, intercalative binding could stabilize the DNA helix structure and increase the Tm of the DNA by approximately 5–8 °C, whereas nonintercalation binding, such as groove or electrostatic binding, along the phosphate backbone of DNA causes small changes in the Tm [43]. The melting curves of the DNA in the absence and presence of AFB1 are shown in Figure 8. As shown, the Tm of the DNA in the absence of AFB1 was 73 ± 1 °C. Meanwhile, the observed Tm of DNA in the presence of AFB1 was 74 ± 1 °C. These results clearly indicate that AFB1’s addition has minimal to no effect on the Tm of DNA. Hence, we concluded that the interaction of AFB1 with DNA did not increase the stability of the DNA’s double-helix structure. A similar change was observed in the binding of AFG1 to DNA. When AFG1 was added to DNA solution, the Tm of the DNA increased from 73 ± 1 °C to 75 ± 1 °C. The results provided further evidence for the nonintercalative binding between AFB1/AFG1 and DNA.
2.7. Effect of Ionic Intensity
To further distinguish the binding mode between aflatoxins and DNA, the effect of ionic intensity was employed as an efficient method. DNAs’ double helices are anionic polyelectrolytes with phosphate groups [34]. In this study, NaCl was used to control the ionic intensity of the systems. Given that Na+ was released to neutralize negative charges on the phosphate backbone of the the DNA when the NaCl dissolves, the electrostatic repulsion between the phosphate backbone was reduced, and the shrinkage degree of the DNA chains was gradually increased [44]. The ions would also compete for the binding sites between the small molecules and the phosphate backbone of the DNA; hence, the free concentration of the small molecules was increased in the solutions [44]. When the binding mode was electrostatic interaction, with the addition of NaCl, the fluorescence quenching degree of the small molecules by the DNA would attenuate the competition between the NaCl and the small molecules.
To determine whether or not AFB1/AFG1 has an electrostatic binding with DNA, the effect of NaCl on the fluorescence of the AFB1–DNA and AFG1–DNA systems was studied. In Figure 9, F0 refers to the fluorescence intensity of aflatoxin–DNA systems in the absence of NaCl, and F corresponds to the fluorescence intensity of the aflatoxin–DNA systems in the presence of NaCl. As shown in Figure 9, after adding the DNA, no major changes in the fluorescence intensity were observed in either the AFB1–DNA complex or the AFG1–DNA complex. The results suggested that the interaction between AFB1/AFG1 and DNA excluded electrostatic interaction and groove binding would be predicted.
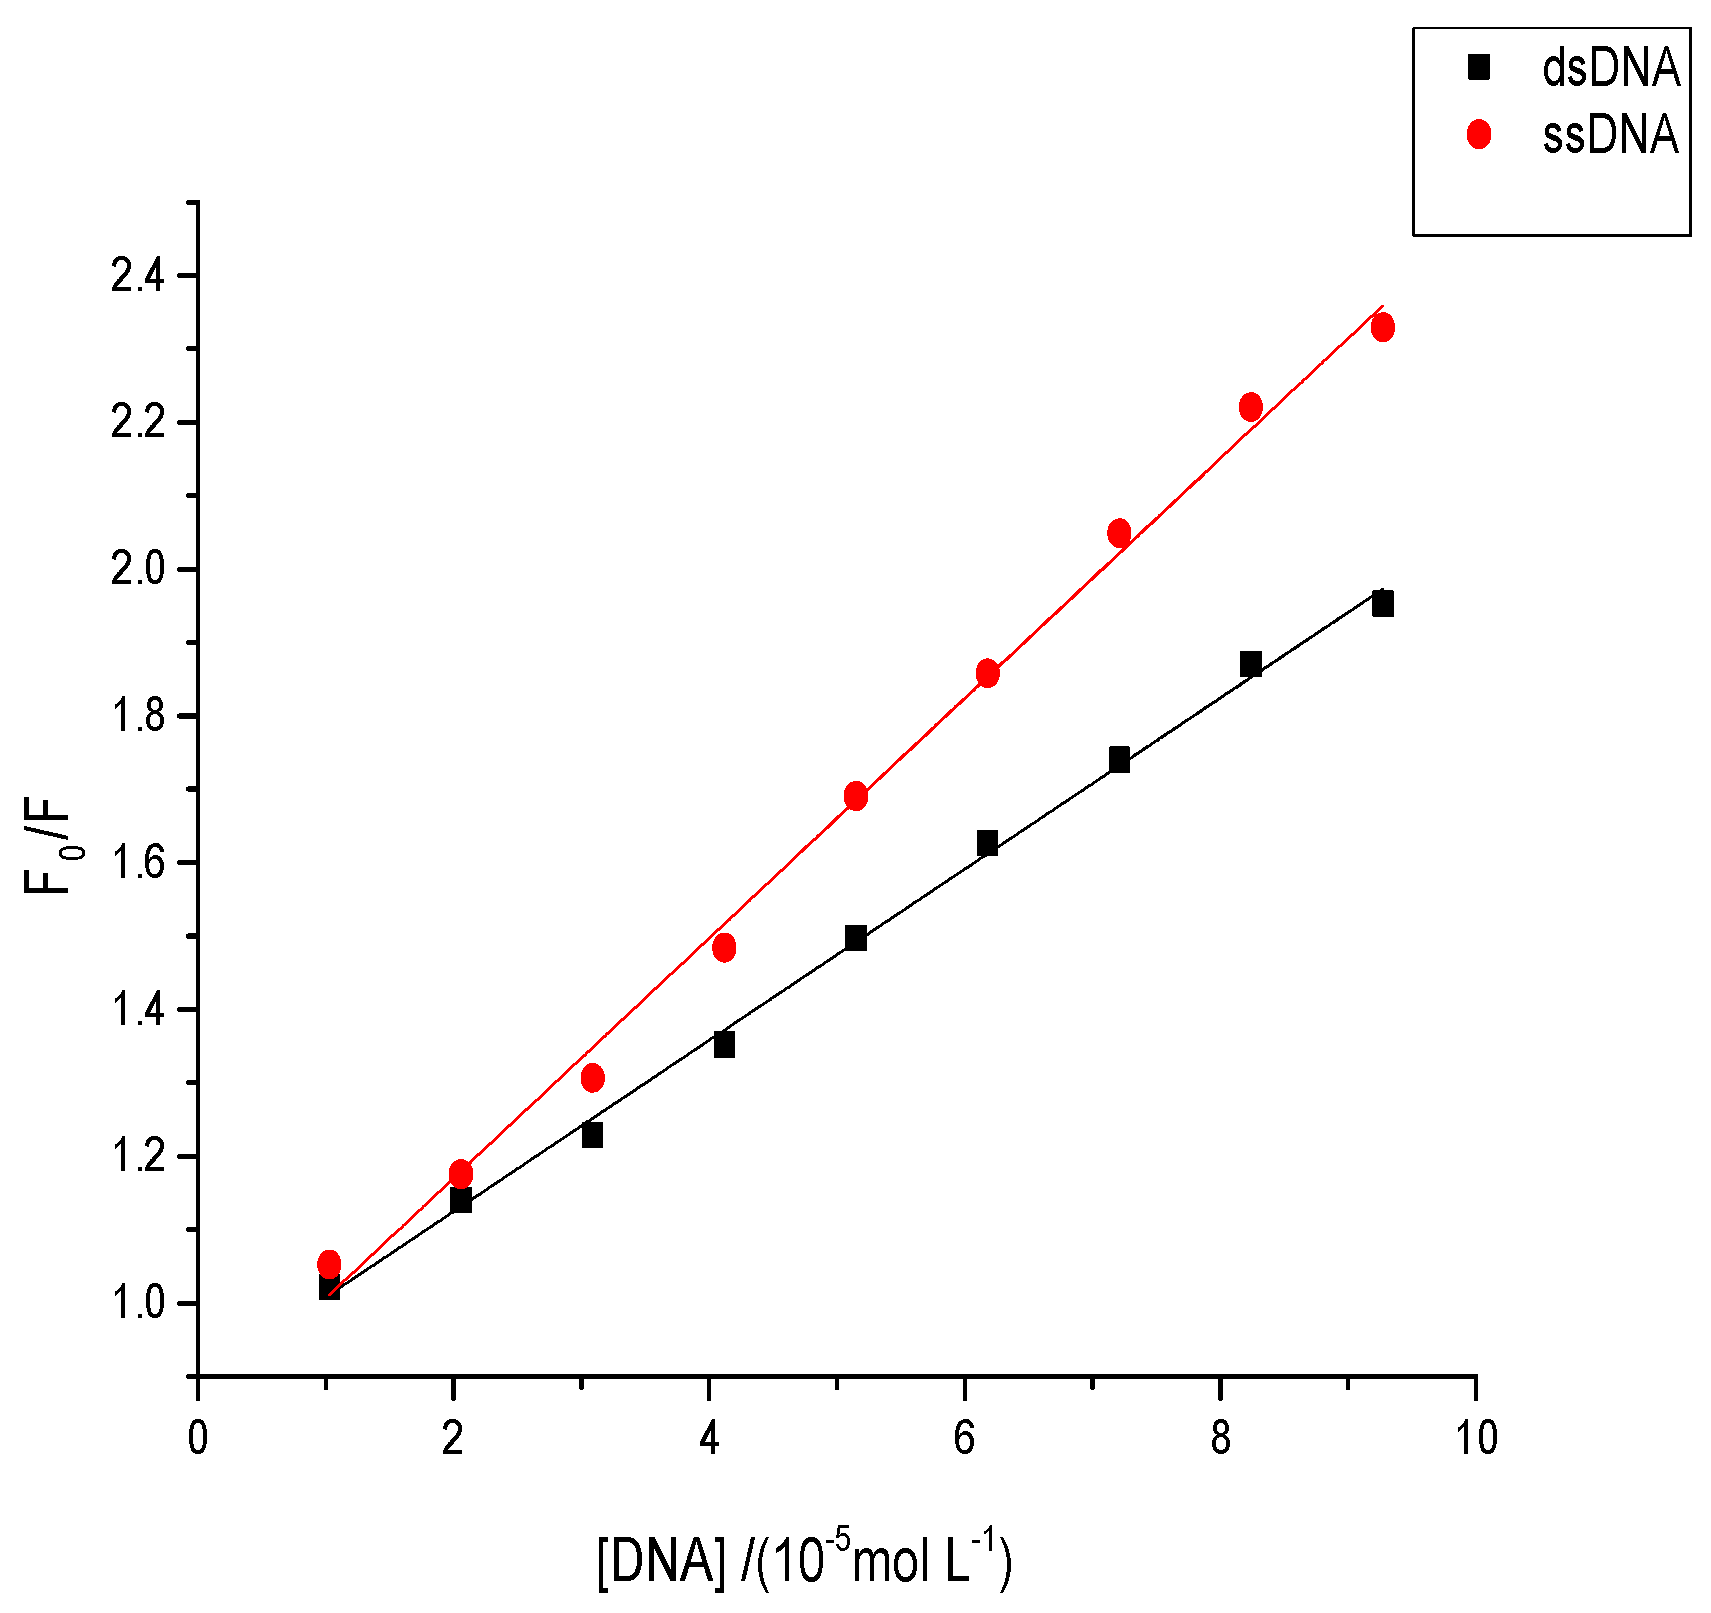
2.8. Effects of Aflatoxins on Native or Denatured DNA
A difference was observed in the quenching effect of single-stranded DNA (ssDNA) and double-stranded DNA (dsDNA) when small molecules bound with the DNA under different interaction modes. Under the grooving mode, the quenching effect of ssDNA should be stronger than that of dsDNA owing to the enlarged space groove, which allows binding between small molecules and DNA in the groove [45]. Conversely, a weaker quenching effect of ssDNA than dsDNA was noted when small molecules intercalated between the DNA base pairs because the double strands were denatured [45]. The quenching effects of both ssDNA and dsDNA also slightly differed when small molecules interacted with the DNA phosphate groups through an electrostatic binding mode [45]. The fluorescence quenching plots of AFB1/AFG1 upon the addition of different concentrations of dsDNA and ssDNA are shown in Figure 10. As shown, the ssDNA exhibited a greater slope than dsDNA in both AFB1 and AFG1. This also indicated that the Ksv value of AFB1/AFG1 with ssDNA was larger than that with dsDNA. Moreover, the results suggest that the binding mode of AFB1/AFG1 to ctDNA might be groove binding. These results were in agreement with the above mentioned experiments.
2.9. Circular Dichroism Spectral Measurement
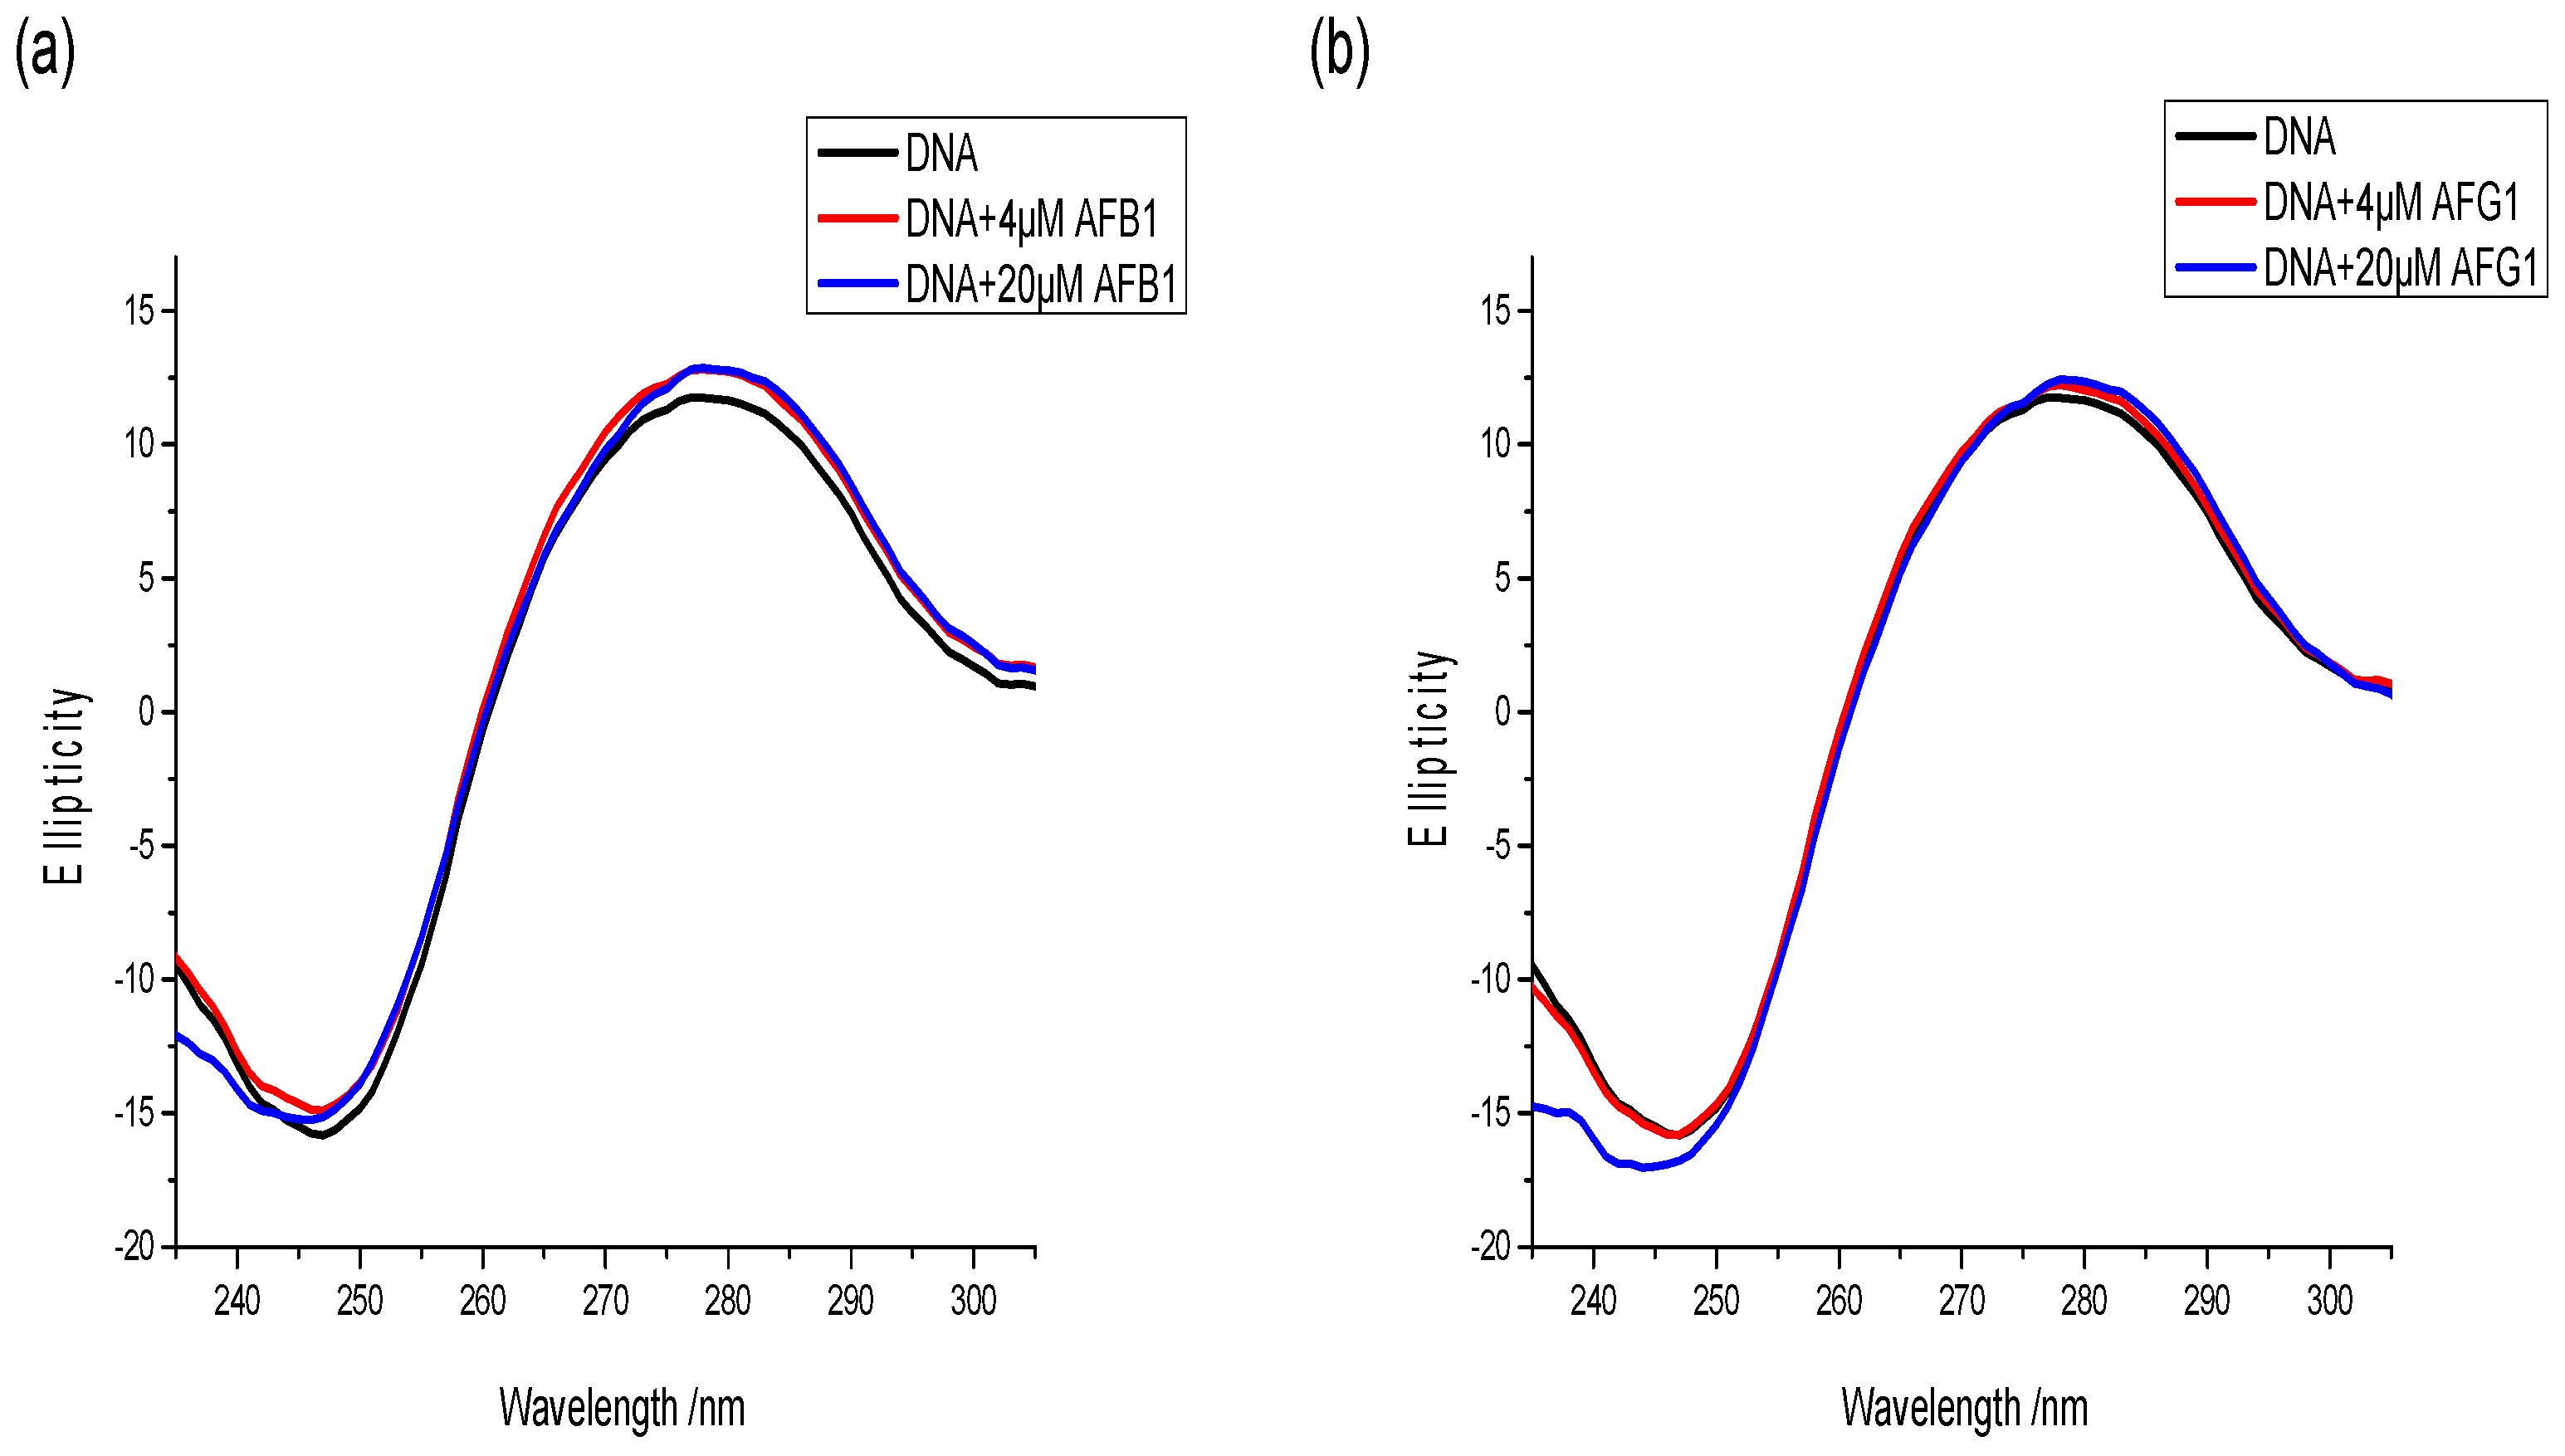
CD is a powerful and sensitive technique for monitoring the conformational alteration of DNA with the binding of exogenous substances [46]. CD signals are sensitive to the mode of DNA binding with the target, particularly within the 180–320 nm wavelength range [47]. Hence, a CD spectral study was conducted to detect the conformational change of DNA caused by the interacting aflatoxins. The CD spectra of the free DNA were characterized as two peaks, including a positive peak at around 275 nm (corresponding to the base-pair stacking) and a negative peak at around 245 nm ascribed to the right-handed helicity of B-DNA [48]. These two peaks are marker peaks of B-DNA assigned to the corresponding changes of DNA structure in the presence of small molecules. The intercalation mode changes the secondary structure of DNA, leading to significant alternation in the CD spectra of DNA, such as the changes in intensity and position of the peaks. Meanwhile, the groove binding and electrostatic interaction do not change CD spectra of the DNA because groove binding and electrostatic interaction have less or lack perturbation on the base stacking and helicity bands [49].
The changes in the CD spectra of the free DNA with increasing AFB1 and AFG1 concentrations were investigated and are shown in Figure 11. As shown, the intensities of the negative peak increased slightly. Moreover, the positive peaks were negligibly altered after AFB1/AFG1 binding. In addition, no significant shift was observed in the peak position regardless of AFB1 or AFG1 binding. Moreover, the binding of both aflatoxins to DNA could induce an increase in the right-handed helicity of DNA, but the B-DNA conformation was not destroyed [50]. This might be because AFB1/AFG1 bound in the minor groove region of DNA, making the double-helix structure of DNA to become loose [51]. Although a different effect on the intensity of CD spectra of DNA was noted with the binding of two aflatoxins, the same positive cotton effect on the AFB1–DNA and AFG1–DNA system was noted. This indicates that the effect of two aflatoxins on DNA conformation was similar, but only to varying degrees. With addition of AFG1, the intensity change of the negative peak was larger than that of AFB1, which indicated that AFG1 has a greater influence on the structure of DNA compared with AFB1. These conclusions are in accordance with the results from the fluorescence studies.
2.10. Molecular Docking Studies
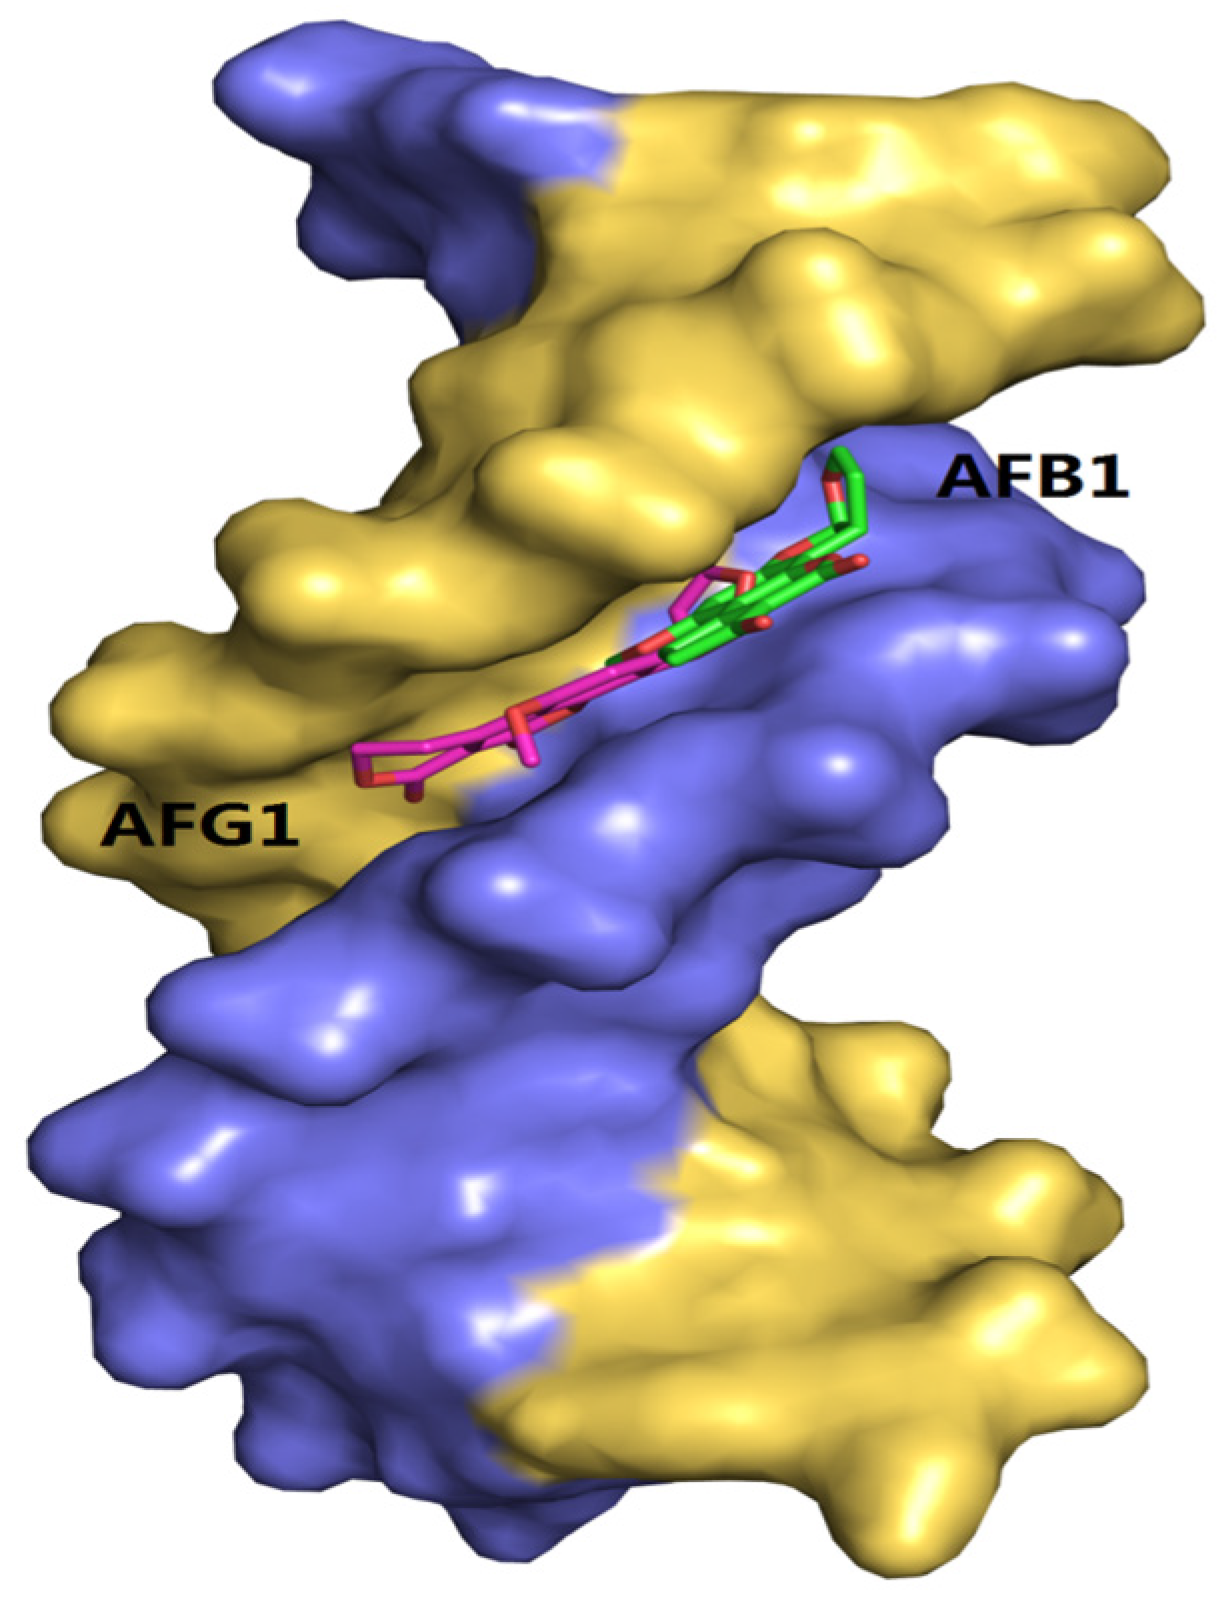
Molecular docking methods were originally used for drug design and are significantly important in structural molecular biology [52]. With the aid of docking software, we can predict the binding mode or binding sites of the interactions between ligands and macromolecules, and also obtain some information about the formation of energetically favorable complexes [53]. In addition, owing to the limitation of the theoretical methods, it should be associated with the other available experimental data [54]. In this study, the molecular docking analysis of the AFB1/AFG1–DNA complexes is shown in Figure 12. The results show that the binding modes of the AFB1/AFG1–DNA complexes were similar, that is, groove binding. The difference was that AFG1 bound with the A–T residues in the minor groove, paralleled to the trend of the double helix. Many groove binders with small dimensions were inclined to bind in the region of rich A–T base pairs, because this region was narrower than that of the rich C–G base pairs [55]
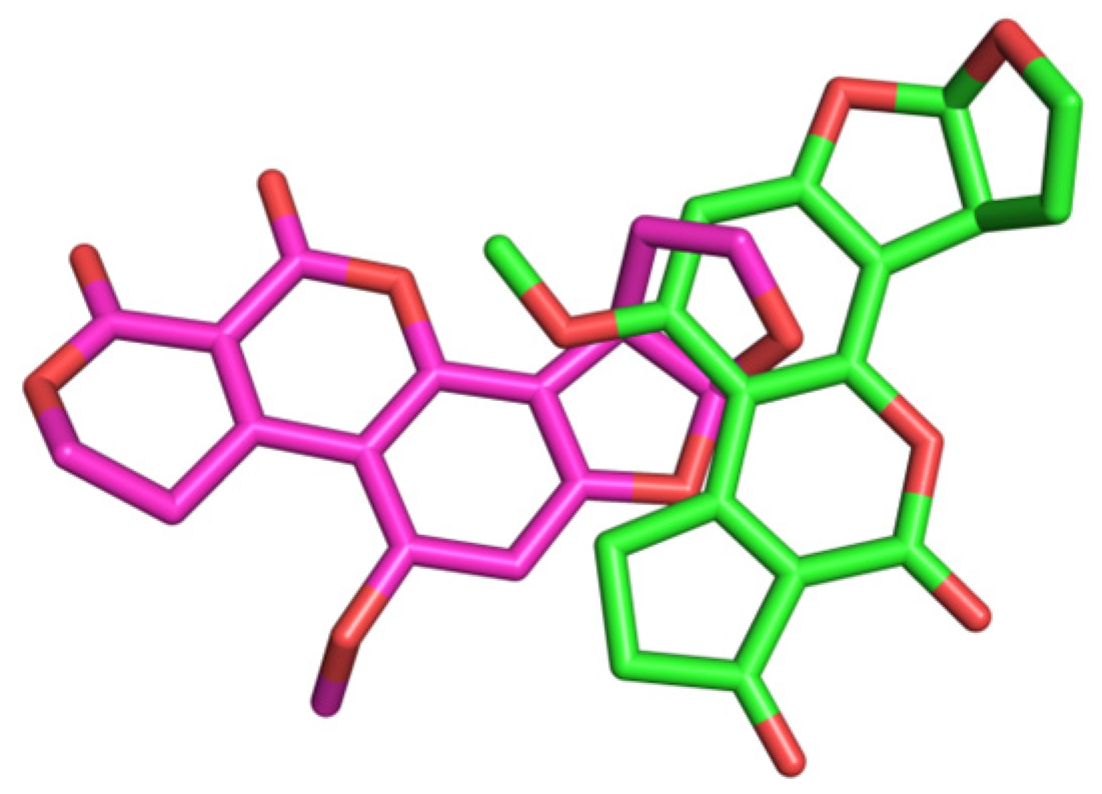
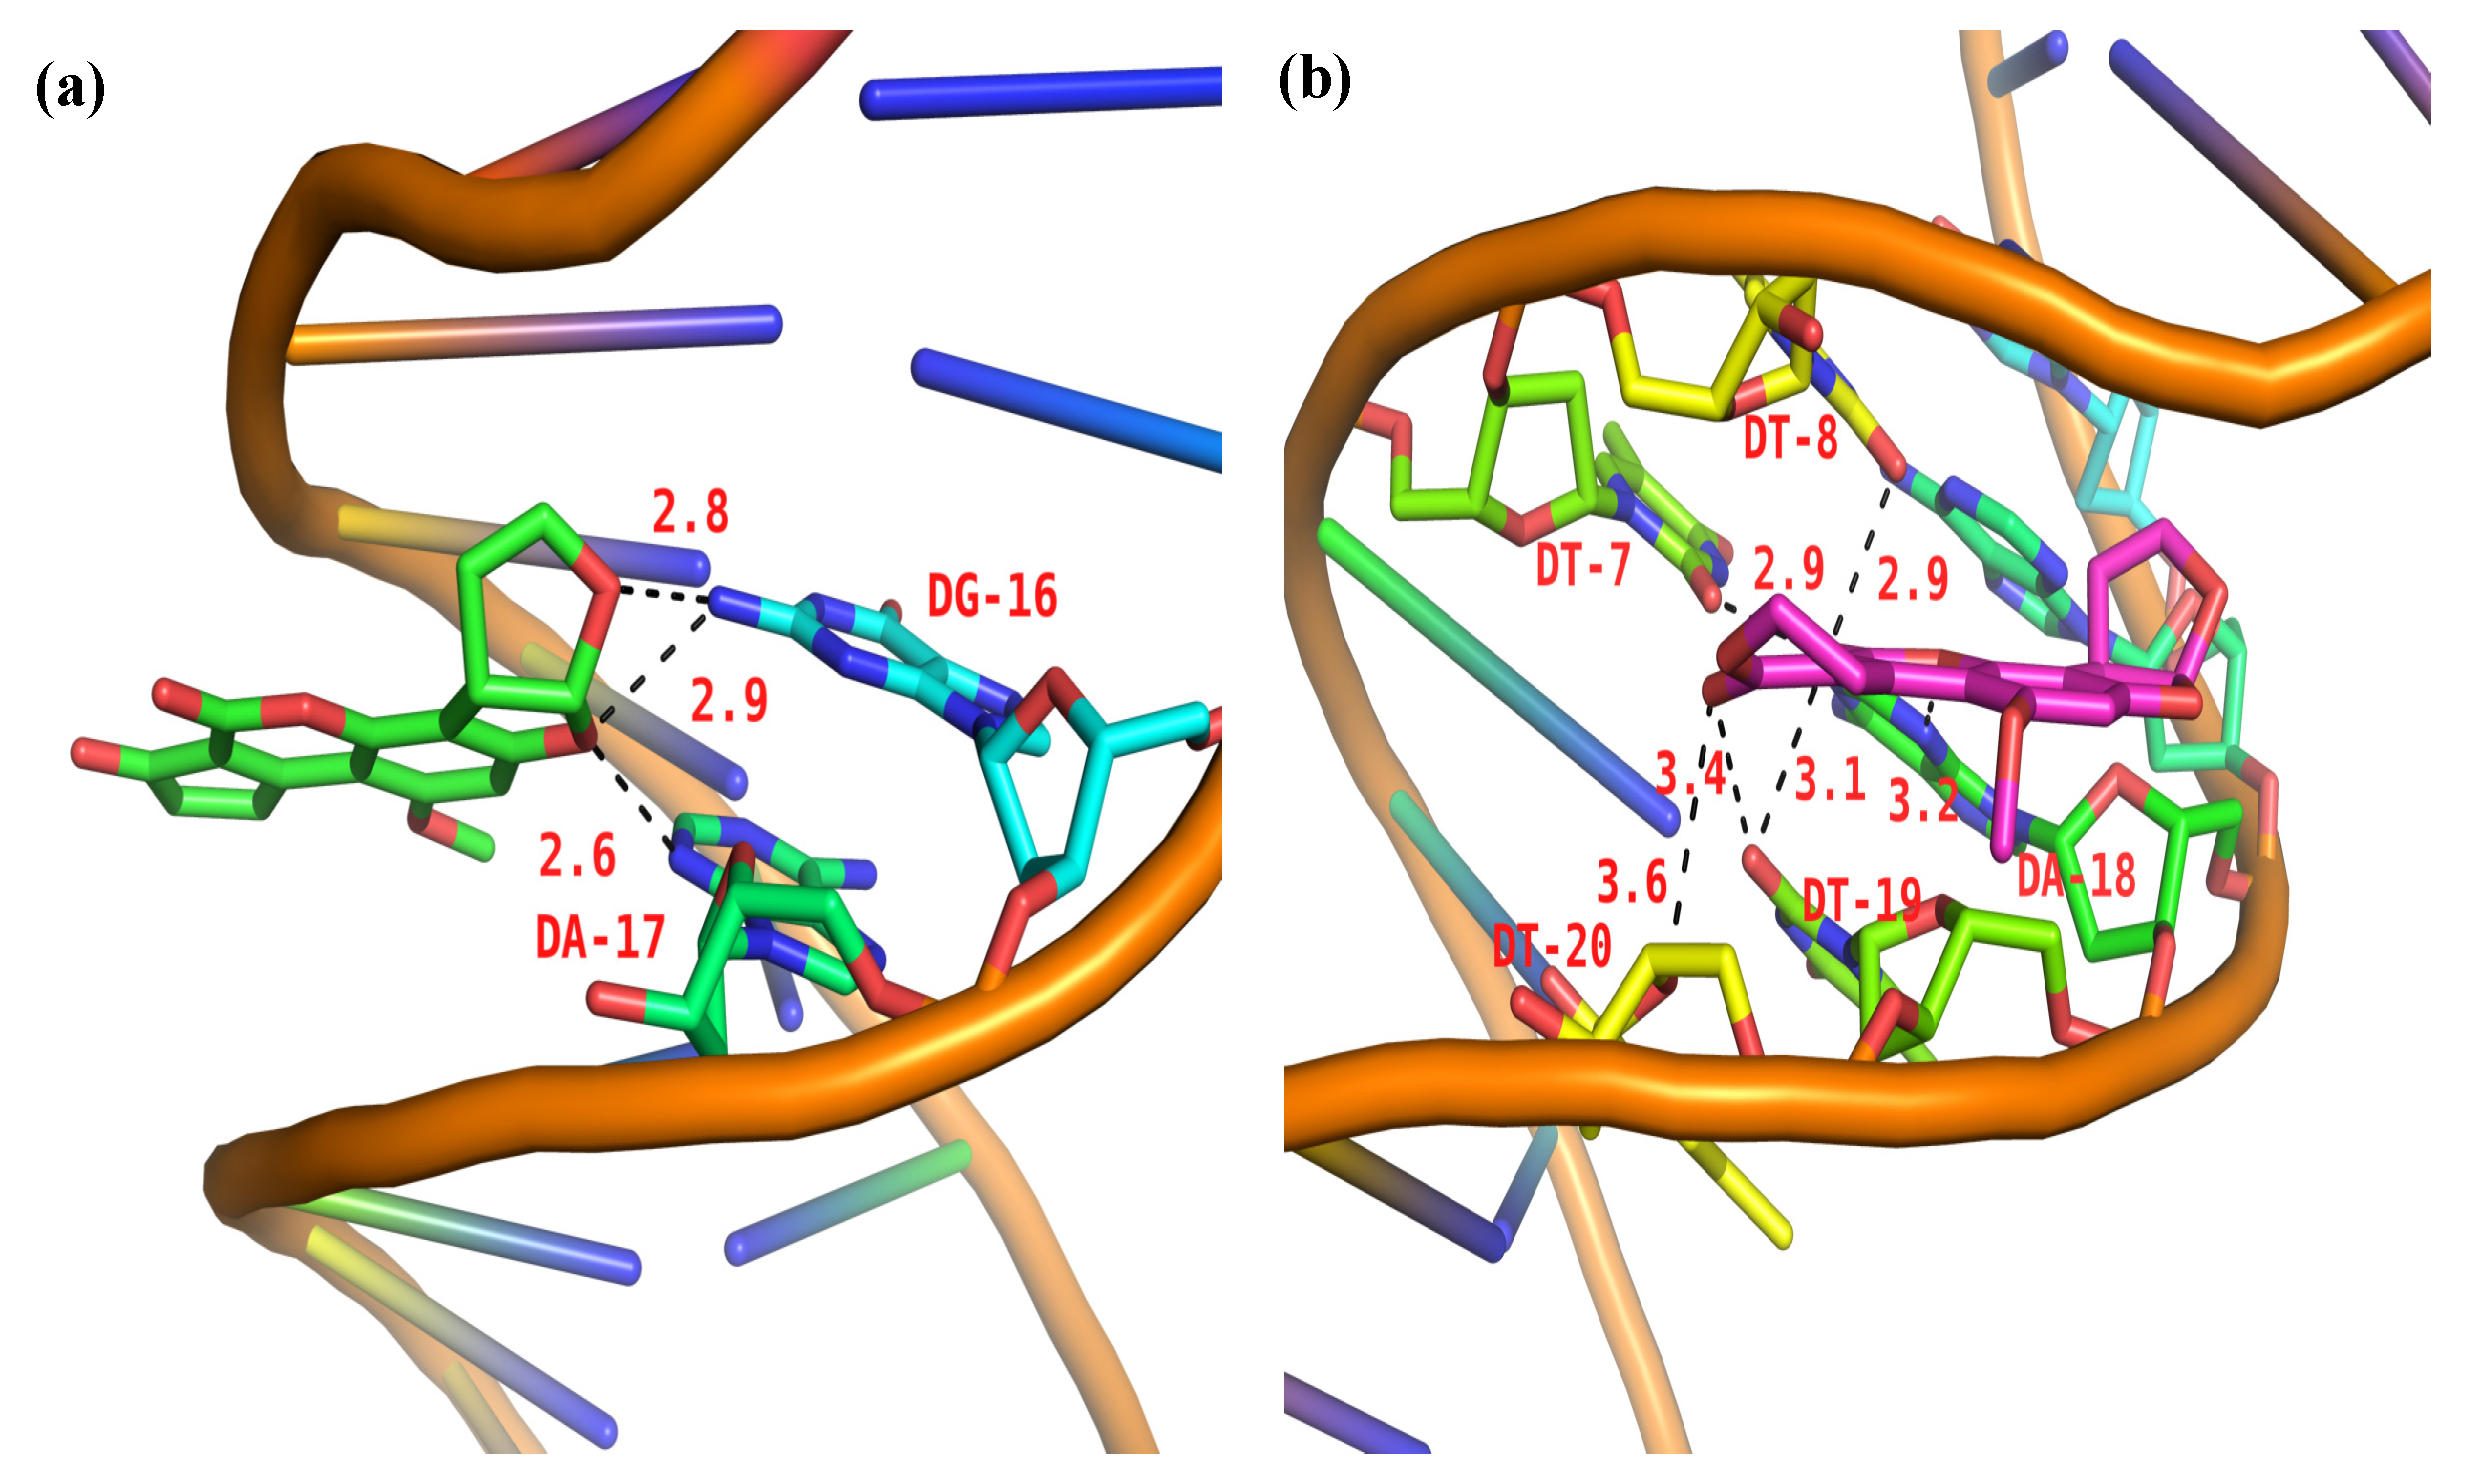
The 100 docking results manifested that AFB1/AFG1 can bind with DNA with different energies. As shown in Table 3, AFG1 possessed the lowest binding energy of –8.29 kcal·mol−1, whereas that of AFB1 was –7.78 kcal·mol−1 when bound with the DNA. The binding free energy can reflect the degree of binding between a ligand and a receptor to some extent, that is, the smaller the binding free energy, the closer the binding. The energies obtained from the molecular docking studies were consistent with our thermodynamic study. In the binding conformation, AFG1’s molecular structure attained a certain degree of translation and reversion compared with AFB1. By comparing the folding of the binding conformation of AFB1/AFG1 with the DNA (Figure 13), the two carbonyl O atoms in the AFG1 structure all approached the interior of the DNA groove during binding, whereas that of the AFB1 approached the exterior of the DNA groove. This difference can be attributed to the larger contact area between AFG1 and the DNA than between AFB1 and the DNA. The carbonyl O also belongs to the hydrogen bond acceptor, and moves toward the inside of the DNA groove. This behavior is beneficial to the formation of hydrogen bonds. All of these differences explain the variations in the above-mentioned energy analysis. Hydrogen bonding plays a significant role in DNA structure formation and the total stability of the system, and therefore the formation of hydrogen bonds has been explored [56]. Three hydrogen bonds formed between AFB1 and two DNA bases (DA-17 and DG-16) (Figure 14a). One of the hydrogen bonds was formed between the O3 atom of AFB1 and DG-16, and the others were formed between the O6 atom of AFB1 and DA-17 associated with DG-16 on the B-chain. All of the hydrogen bonds were strong between AFB1 and the DNA (distance from 2.5 Å to 3.0 Å) (Table 4). Meanwhile, AFG1 formed six hydrogen bonds with different DNA bases on the A- or B-chain (Figure 14b). These bonds included two strong hydrogen bonds, three moderate hydrogen bonds, and one weak hydrogen bond (Table 4). Among the six hydrogen bonds, three were located in the carbonyl O atom of C-20, two were formed in the carbonyl O atom of C-19, and the other was built in the O18 atom of AFB1. When hydrogen bonds were formed between AFB1/AFG1 and the DNA, the positions of AFB1 and AFG1 differed because of their molecular structures. We inferred that these positions were related to the different toxic effects of AFB1 and AFG1 in vivo. Thus, we concluded that the molecular docking results further verified that AFB1/AFG1 interacts with DNA through groove binding, which was consistent with the spectroscopic studies.
3. Discussion
In this work, the characteristics of the interaction between AFB1/AFG1 and ctDNA in a pH 7.4 Tris-HCl buffer were determined through different spectroscopic methods coupled with viscosity measurements, DNA melting assay, and molecular docking techniques. The fluorescence results demonstrated that ctDNA quenched the intrinsic fluorescence of AFB1/AFG1 through different quenching mechanisms. The AFG1–DNA complexation was driven mainly by hydrogen bonding and van der Waals forces. Unlike AFG1, hydrogen bonding with hydrophobic interactions played major roles in the binding of AFB1 with the DNA. The binding constant values of the AFG1–DNA complex were always larger than those of the AFB1–DNA complex even in different temperatures. Based on the denatured DNA and viscosity measurements, as well as the UV absorption spectroscopy and competitive binding study, we concluded that both AFB1 and AFG1 interacted with ctDNA via the groove binding mode. CD analysis suggested partial conformation changes on ctDNA upon AFB1’s addition and AFG1’s addition. Moreover, the results of molecular docking showed that the specific binding site mainly existed between AFB1/AFG1 and the A–T base pairs of ctDNA via the formation of hydrogen bonds.
The experimental results indicated that AFB1/AFG1 could directly bind with DNA through noncovalent interactions after AFB1/AFG1 enters into the body unmetabolized. Moreover, owing to such binding, aflatoxins influenced the DNA’s structure and even damaged the DNA. We believe that the data gathered in this study will help in understanding the mechanism of DNA damage and the toxicological effects of aflatoxins. Additionally, the results of this study also provide guidance for the construction of an in vitro digestion model. This research can serve as a basis for the revision of food safety standards, and provide a comprehensive reference on risk assessment for mycotoxins.
4. Materials and Methods
4.1. Chemicals and Reagents
The ctDNA (D1501-100 mg) was purchased from Sigma Corporation (St. Louis, MO, USA) and dissolved in phosphate-buffered saline (PBS) (pH 7.4) at 4 °C with occasional stirring to ensure the formation of a homogeneous solution. The absorbance ratio at 260/280 nm was recorded to check the purity of the DNA solution. The ctDNA’s concentration was determined by using the absorption at 260 nm and the molar absorption coefficient ε260 = 6600 L·mol−1·cm−1. The stock solution (4 × 10⁻³ mol·L−1) of AFB1/AFG1 (Sigma) was prepared by dissolving it in 95% (v/v) methanol. The ethidium bromide (EB) and Hoechst 33258 were purchased from Sigma Corporation. A total of 0.05 mol·L−1 PBS (containing NaH2PO4·2H2O and Na2HPO4·12H2O at pH 7.40) was used to simulate physiological conditions. The NaH2PO4·2H2O, Na2HPO4·12H2O, NaCl, and methanol were purchased from Kelong Chemical Reagent Factory (Chengdu, China). All of the other reagents were of analytical grade, and double-distilled water was used in all of the experiments.
4.2. Instrumentation
The UV–vis absorption spectra were recorded on a Shimadzu UV-2450 spectrophotometer (Shimadzu, Tokyo, Japan) using a 1.0× 1.0 cm quartz cell. The fluorescence and resonance light scattering (RLS) measurements were performed using a F-4500 spectrofluorometer (Hitachi, Tokyo, Japan) using a 1.0 cm quartz cell. The viscosity measurements were performed on an Ubbelohde viscometer (Φ 0.7–0.8 mm, Shanghai Qianfeng Rubber and Glass Co., Shanghai, China). The CD spectra were obtained on a MOS 450 CD spectrometer (Bio-Logic, Paris, France) using a 1.0 mm path quartz cuvette. The pH was measured using a pH S-25 digital pH meter (Leici, Shanghai, China).
4.3. Dialysis Assays
Dialysis bags (MWCO 1 kDa)(Sigma-Aldrich, St. Louis, MO, USA) were used for the solutions of AFB1–DNA and AFG1–DNA. The solutions, including 1.51 × 10⁻⁴ mol·L−1 DNA and 4 × 10⁻⁵ mol·L−1 AFB1/AFG1, were dialyzed for 24 h at room temperature. The UV absorbance and fluorescence emission values were recorded for the solutions in the dialysis bags.
4.4. Fluorescence and Resonance Light Scattering (RLS) Spectra
The fluorescence quenching spectra were obtained in the range of 300–700 nm at an excitation wavelength of 365 nm. The fluorescence spectra were obtained at three temperatures (298, 303, and 308 K). The excitation and emission slits were set at 5 nm.
A 1.0 mL solution containing 8 × 10⁻⁶ mol·L−1 AFB1/AFG1 was added to the quartz cuvette and then titrated through successive additions of ctDNA (concentration range from 1.6 × 10⁻⁶ mol·L−1 to 16 × 10−6 mol·L−1). Then, the solutions were mixed sufficiently and allowed to stand for 10 min to achieve equilibrium. The RLS spectra were obtained through synchronous scanning (Δλ = 0 nm) with a wavelength range of 200−700 nm at room temperature. Both the excitation and emission slits were set at 5 nm.
4.5. Competitive Displacement Assays
The displacement assays of Ethidium bromide (EB) and Hoechst 33258 were performed with a solution containing a fixed concentration of EB/Hoechst 33258 and ctDNA (2 × 10⁻⁶ mol·L−1 and 4 × 10⁻⁵ mol·L−1). Then, the solution was titrated by increasing the AFB1/AFG1 concentrations (from 0 to 8 × 10⁻⁵ mol·L−1). The EB–DNA mixture was excited at 515 nm, and the emission spectra ranged from 400 nm to 700 nm. Meanwhile, the DNA–Hoechst 33258 complex was excited at 340 nm, and the emission spectra ranged from 300 nm to 700 nm.
4.6. UV–Visible Spectroscopy
The absorption spectra of AFB1/AFG1 and the AFB1/AFG1–DNA complexes were obtained in the wavelength range of 190–500 nm. The experiments were performed by using a fixed small-molecule concentration (3.5 × 10⁻⁵ mol·L−1) while varying the ctDNA concentration from 0 to 25.6 × 10⁻⁶ mol·L−1. Another experiment involved a fixed DNA concentration (2 × 10⁻⁵ mol·L−1) while varying the ctDNA concentration from 0 to 32 × 10−6 mol·L−1.
4.7. Viscosity Measurements
The viscosity assay of the fixed ctDNA solution (2 × 10⁻⁵ mol·L−1) was performed in the absence and presence of AFB1/AFG1 at various concentrations (from 0 to 2.8 × 10⁻⁵ mol·L−1). All of the solutions were thermostated at 25 ± 0.1 °C through a thermostatic bath. The flow times of the different solutions through the capillary were measured in three replicates using a digital stopwatch. The data were presented as (η/η0)1/3 versus the ratios of the concentration of ([AFB1/AFG1]/[ctDNA]), where η and η0 represent the viscosity of ctDNA in the presence and absence of AFB1/AFG1 [16]. The viscosity values were determined from the formula η = (t−t0)/t0, where t and t0 are the observed flow time of ctDNA-containing solutions and buffer solutions [16].
4.8. DNA Melting Assay
The melting-temperature (Tm) experiment was recorded in a thermostat water bath from 20 °C to 100 °C, with 5 °C increments. This part of the experiment was studied in the absence and presence of AFB1/AFG1 by measuring the absorbance intensity of ctDNA solutions at 260 nm. Tm was obtained from the transition midpoint of the thermal denaturation curves based on fss versus temperature (T), that is, fss = (A − A0)/(Af − A0), where A0 is the initial absorbance value, A is the absorbance intensity corresponding to the temperature, and Af is the final absorbance value [57].
4.9. Effect of Ionic Intensity
The effect of ionic intensity was determined by monitoring the change of fluorescence intensity of the systems. To prepare the systems, different NaCl concentrations ranging from 5 mol·L−1 to 45 × 10−3 mol·L−1 were added to the solution containing 2 × 10⁻⁵ mol·L−1 AFB1/AFG1 and 2 × 10⁻⁵ mol·L−1 ctDNA. The excitation and emission wavelengths were set to 365 nm and 440 nm.
4.10. Interaction with Single-Stranded ctDNA (ss-ctDNA) and Double-Stranded ctDNA (ds-ctDNA)
The single-stranded ctDNA (ss-ctDNA) was obtained by heating double-stranded ctDNA (ds-ctDNA) in a boiling water bath for 30 min and then rapidly cooling it in an ice water bath for 8 min [58]. To compare the fluorescence quenching effect of ssDNA and dsDNA on the AFB1/AFG1 intensity, ssDNA or dsDNA solution was successively added to the AFB1/AFG1 solution. Then, the corresponding quenching constants were calculated and compared.
4.11. Circular Dichroism (CD) Spectroscopy
The CD spectra of the solutions containing fixed ctDNA concentrations (1 × 10⁻⁵ mol·L−1) with varying AFB1/AFG1 concentrations (0, 4 × 10⁻⁶, and 20 × 10−6 mol·L−1) were obtained at wavelengths between 200 nm and 500 nm. All of the CD spectra were scanned every 1 nm for four times with a speed of 100 nm·min−1. The baseline of the buffer solution (0.05 mol·L−1 PBS, pH 7.4) of the CD signals was deducted from each spectrum.
4.12. Molecular Docking
The molecular docking experiments were performed with Auto Dock 4.2.6 software. The crystal structures of AFB1 and AFG1 were obtained from the Pubchem database. . With the aid of Auto Dock tools, polar hydrogen atoms and Gasteiger charges were added. The ligand roots of AFB1 and AFG1 were also detected, and the rotatable bonds were defined. The structure of B-DNA dodecamer 5′–d(CGCGAATTCGCG)2–3′ (PDB ID:1BNA) was available in the Protein Data Bank (PDB) [59]. This structure was further modified for docking calculations through Auto Dock tools. All of the water molecules were removed, whereas the Gasteiger charges and essential hydrogen atoms were added. The docking programs were run using Lamarckian Genetic Algorithms to create an interaction between AFB1/AFG1 and DNA. For docking calculations, to cover the entire binding site of DNA and provide space for the ligands to move freely, a grid box of 95 × 102 × 139 points with a grid spacing of 0.375 Å was prepared. All of the other parameters were defined, and the default values were given by Auto Dock. The grid energy of the docking pocket area was calculated by an AutoGrid program. A total of 100 GA runs were accomplished, and the best structure with the lowest binding free energy was used.
4.13. Statistical Analysis
The results were expressed as mean ± SD of at least three independent observations. Origin 9.0 software (OriginLab Corp., Northampton, MA, USA) was used for the background correction of the fluorescence emission spectra and the evaluation of the fluorescence intensities.
In this paper, all of the fluorescence data has been subject to inner filter correction in order to eliminate any inner filter effects.
Acknowledgments
This work was supported by the National Basic Research Program of China [grant number 2013CB127803], the National Natural Science Foundation of China [grant number 31301476] and the National Key R&D Program of China (grant number 2016YFD0400203-2).
Author Contributions
L.M. and J.W. conceived and designed the experiments; J.W. performed the experiments; Y.Z., J.W. and L.M. analyzed the data; Y.Z. contributed reagents/materials/analysis tools; J.W. wrote the paper
Conflicts of Interest
The authors declare no conflict of interest.
References
- Richard, E.; Heutte, N.; Sage, L.; Pottier, D.; Bouchart, V.; Lebailly, P.; Garon, D. Toxigenic fungi and mycotoxins in mature corn silage. Food Chem. Toxicol. 2007, 45, 2420–2425. [Google Scholar] [CrossRef] [PubMed]
- Herebian, D.; Zuehlke, S.; Lamshoeft, M.; Spiteller, M. Multi-mycotoxin analysis in complex biological matrices using LC-ESI/MS: Experimental study using triple stage quadrupole and LTQ-orbitrap. J. Sep. Sci. 2009, 32, 939–948. [Google Scholar] [CrossRef] [PubMed]
- Schenzel, J.; Forrer, H.R.; Vogelgsang, S.; Hungerbuehler, K.; Bucheli, T.D. Mycotoxins in the environment: I. Production and emission from an agricultural test field. Environ. Sci. Technol. 2012, 46, 13067–13075. [Google Scholar] [CrossRef] [PubMed]
- Lu, Z.; Chen, X.; Wang, Y.; Zheng, X.; Li, C.M. Aptamer based fluorescence recovery assay for aflatoxin B1 using a quencher system composed of quantum dots and graphene oxide. Microchim. Acta 2015, 182, 571–578. [Google Scholar] [CrossRef]
- Ivanova, B.; Spiteller, M. Raman spectroscopic and mass spectrometric determination of aflatoxins. Food Anal. Methods 2014, 7, 242–256. [Google Scholar] [CrossRef]
- International Agency for Research on Cancer (IARC). IARC Monographs on the Evaluation of Carcinogenic Risks to Humans; IARC Press: Lyon, France, 2002; pp. 171–230. [Google Scholar]
- Eaton, D.L.; Gallagher, E.P. Mechanism of aflatoxin carcinogenesis. Annu. Rev. Pharmacol. Toxicol. 1994, 34, 135–172. [Google Scholar] [CrossRef] [PubMed]
- Ni, Y.; Wei, M.; Kokot, S. Electrochemical and spectroscopic study on the interaction between isoprenaline and DNA using multivariate curve resolution-alternating least squares. Int. J. Biol. Macromol. 2011, 49, 622–628. [Google Scholar] [CrossRef] [PubMed]
- Zhang, Y.; Zhang, G.; Li, Y.; Hu, Y. Probing the binding of insecticide permethrin to calf thymus DNA by spectroscopic techniques merging with chemometrics method. J. Agric. Food Chem. 2013, 61, 2638–2647. [Google Scholar] [CrossRef] [PubMed]
- Tian, Z.; Huang, Y.; Zhang, Y.; Song, L.; Qiao, Y.; Xu, X.; Wang, C. Spectroscopic and molecular modeling methods to study the interaction between naphthalimide-polyamine conjugates and DNA. J. Photochem. Photobiol. B 2016, 158, 1–15. [Google Scholar] [CrossRef] [PubMed]
- Mehta, J.; Rouah-Martin, E.; Van Dorst, B.; Maes, B.; Herrebout, W.; Scippo, M.L.; Dardenne, F.; Blust, R.; Robbens, J. Selection and characterization of pcb-binding DNA aptamers. Anal. Chem. 2012, 84, 1669–1676. [Google Scholar] [CrossRef] [PubMed]
- Hendry, L.B.; Mahesh, V.B.; Bransome, E.D.; Ewing, D.E. Small molecule intercalation with double stranded DNA: Implications for normal gene regulation and for predicting the biological efficacy and genotoxicity of drugs and other chemicals. Mutat. Res. 2007, 623, 53–71. [Google Scholar] [CrossRef] [PubMed]
- Zhang, Y.; Wang, X.; Ding, L. Interaction between tryptophan-vanillin schiff base and herring sperm DNA. J. Serb. Chem. Soc. 2010, 75, 1191–1201. [Google Scholar] [CrossRef]
- Croy, R.G.; Essigmann, J.M.; Reinhold, V.N.; Wogan, G.N. Identification of principal aflatoxin B1-DNA adduct formed invivo in rat-liver. Proc. Natl. Acad. Sci. USA 1978, 75, 1745–1749. [Google Scholar] [CrossRef] [PubMed]
- Wang, J.S.; Groopman, J.D. DNA damage by mycotoxins. Mutat. Res. 1999, 424, 167–181. [Google Scholar] [CrossRef]
- Shahabadi, N.; Heidari, L. Synthesis, characterization and multi-spectroscopic DNA interaction studies of a new platinum complex containing the drug metformin. Spectrochim. Acta A 2014, 128, 377–385. [Google Scholar] [CrossRef] [PubMed]
- Li, Y.; Zhang, G.; Tao, M. Binding properties of herbicide chlorpropham to DNA: Spectroscopic, chemometrics and modeling investigations. J. Photochem. Photobiol. B 2014, 138, 109–117. [Google Scholar] [CrossRef] [PubMed]
- Shahabadi, N.; Kashanian, S.; Darabi, F. DNA binding and DNA cleavage studies of a water soluble cobalt(II) complex containing dinitrogen schiff base ligand: The effect of metal on the mode of binding. Eur. J. Med. Chem. 2010, 45, 4239–4245. [Google Scholar] [CrossRef] [PubMed]
- Lakowicz, J.R. Principles of fluorescence spectroscopy. In Fluorophores, 3rd ed.; Springer: New York, NY, USA, 2008. [Google Scholar]
- Lakowicz, J.R.; Weber, G. Quenching of fluorescence by oxygen-probe for structural fluctuations in macromolecules. Biochemistry 1973, 12, 4161–4170. [Google Scholar] [CrossRef] [PubMed]
- Sneharani, A.H.; Karakkat, J.V.; Singh, S.A.; Rao, A.G.A. Interaction of curcumin with beta-lactoglobulin-stability, spectroscopic analysis, and molecular modeling of the complex. J. Agric. Food Chem. 2010, 58, 11130–11139. [Google Scholar] [CrossRef] [PubMed]
- Yang, M.M.; Xi, X.L.; Yang, P. Study of the interaction of cephalosporin class medicine with albumin by fluorescence enhancement and fluorescence quenching theories. Chin. J. Chem. 2006, 24, 642–648. [Google Scholar] [CrossRef]
- Hu, Y.J.; Liu, Y.; Xiao, X.H. Investigation of the interaction between berberine and human serum albumin. Biomacromolecules 2009, 10, 517–521. [Google Scholar] [CrossRef] [PubMed]
- Darwish, S.M.; Abu Sharkh, S.E.; Abu Teir, M.M.; Makharza, S.A.; Abu-Hadid, M.M. Spectroscopic investigations of pentobarbital interaction with human serum albumin. J. Mol. Struct. 2010, 963, 122–129. [Google Scholar] [CrossRef]
- Ross, P.D.; Subramanian, S. Thermodynamics of protein association reactions-forces contributing to stability. Biochemistry 1981, 20, 3096–3102. [Google Scholar] [CrossRef] [PubMed]
- Yang, J.; Chen, X.; Fu, R.; Luo, W.A.; Li, Y.; Zhang, M. Kinetics of phase separation in polymer blends revealed by resonance light scattering spectroscopy. Phys. Chem. Chem. Phys. 2010, 12, 2238–2245. [Google Scholar] [CrossRef] [PubMed]
- He, Y.Q.; Liu, S.P.; Kong, L.; Liu, Z.F. A study on the sizes and concentrations of gold nanoparticles by spectra of absorption, resonance rayleigh scattering and resonance non-linear scattering. Spectrochim. Acta A 2005, 61, 2861–2866. [Google Scholar] [CrossRef] [PubMed]
- Zhang, G.; Fu, P.; Wang, L.; Hu, M. Molecular spectroscopic studies of farrerol interaction with calf thymus DNA. J. Agric. Food Chem. 2011, 59, 8944–8952. [Google Scholar] [CrossRef] [PubMed]
- Rehman, S.U.; Sarwar, T.; Ishqi, H.M.; Husain, M.A.; Hasan, Z.; Tabish, M. Deciphering the interactions between chlorambucil and calf thymus DNA: A multi-spectroscopic and molecular docking study. Arch. Biochem. Biophys. 2015, 566, 7–14. [Google Scholar] [CrossRef] [PubMed]
- Baguley, B.C.; Lebret, M. Quenching of DNA-ethidium fluorescence by amsacrine and other antitumor agents-a possible electron-transfer effect. Biochemistry 1984, 23, 937–943. [Google Scholar] [CrossRef] [PubMed]
- Loontiens, F.G.; Regenfuss, P.; Zechel, A.; Dumortier, L.; Clegg, R.M. Binding characteristics of hoechst-33258 with calf thymus DNA, poly d(AT), and d(CCGGAATTCCGG)-multiple stoichiometries and determination of tight-binding with a wide spectrum of site affinities. Biochemistry 1990, 29, 9029–9039. [Google Scholar] [CrossRef] [PubMed]
- Skyrianou, K.C.; Psycharis, V.; Raptopoulou, C.P.; Kessissoglou, D.P.; Psomas, G. Nickel-quinolones interaction part 4-structure and biological evaluation of nickel (II)-enrofloxacin complexes compared to zinc(II) analogues. J. Inorg. Biochem. 2011, 105, 63–74. [Google Scholar] [CrossRef] [PubMed]
- Vujcic, M.T.; Tufegdzic, S.; Novakovic, I.; Djikanovic, D.; Gasic, M.J.; Sladic, D. Studies on the interactions of bioactive quinone avarone and its methylamino derivatives with calf thymus DNA. Int. J. Biol. Macromol. 2013, 62, 405–410. [Google Scholar] [CrossRef] [PubMed]
- Aramesh-Boroujeni, Z.; Khorasani-Motlagh, M.; Noroozifar, M. Multispectroscopic DNA-binding studies of a terbium(III) complex containing 2,2’-bipyridine ligand. J. Biomol. Struct. Dyn. 2016, 34, 414–426. [Google Scholar] [CrossRef] [PubMed]
- Xiao, Y.N.; Zhan, C.X. Studies on the interaction of DNA and water-soluble polymeric schiff base-nickel complexes. J. Appl. Polym. Sci. 2002, 84, 887–893. [Google Scholar] [CrossRef]
- Devi, C.V.; Singh, N.R. Absorption spectroscopic probe to investigate the interaction between Nd(III) and calf-thymus DNA. Spectrochim. Acta A 2011, 78, 1180–1186. [Google Scholar] [CrossRef] [PubMed]
- Zhang, G.; Wang, L.; Zhou, X.; Li, Y.; Gong, D. Binding characteristics of sodium saccharin with calf thymus DNA in vitro. J. Agric. Food Chem. 2014, 62, 991–1000. [Google Scholar] [CrossRef] [PubMed]
- Kashanian, S.; Khodaei, M.M.; Kheirdoosh, F. In vitro DNA binding studies of aspartame, an artificial sweetener. J. Photochem. Photobiol. B 2013, 120, 104–110. [Google Scholar] [CrossRef] [PubMed]
- Charak, S.; Shandilya, M.; Tyagi, G.; Mehrotra, R. Spectroscopic and molecular docking studies on chlorambucil interaction with DNA. Int. J. Biol. Macromol. 2012, 51, 406–411. [Google Scholar] [CrossRef] [PubMed]
- Kashanian, S.; Dolatabadi, J.E.N. DNA binding studies of 2-tert-butylhydroquinone (TBHQ) food additive. Food Chem. 2009, 116, 743–747. [Google Scholar] [CrossRef]
- Bera, R.; Sahoo, B.K.; Ghosh, K.S.; Dasgupta, S. Studies on the interaction of isoxazolcurcumin with calf thymus DNA. Int. J. Biol. Macromol. 2008, 42, 14–21. [Google Scholar] [CrossRef] [PubMed]
- Cui, F.; Huo, R.; Hui, G.; Lv, X.; Jin, J.; Zhang, G.; Xing, W. Study on the interaction between aglycon of daunorubicin and calf thymus DNA by spectroscopy. J. Mol. Struct. 2011, 1001, 104–110. [Google Scholar] [CrossRef]
- Jana, B.; Senapati, S.; Ghosh, D.; Bose, D.; Chattopadhyay, N. Spectroscopic exploration of mode of binding of ctDNA with 3-hydroxyflavone: A contrast to the mode of binding with flavonoids having additional hydroxyl groups. J. Chem. Phys. B 2012, 116, 639–645. [Google Scholar] [CrossRef] [PubMed]
- Wu, F.Y.; Xiang, Y.L.; Wu, Y.M.; Xie, F.Y. Study of interaction of a fluorescent probe with DNA. J. Lumin. 2009, 129, 1286–1291. [Google Scholar] [CrossRef]
- Cai, C.; Chen, X.; Ge, F. Analysis of interaction between tamoxifen and ctDNA in vitro by multi-spectroscopic methods. Spectrochim. Acta A 2010, 76, 202–206. [Google Scholar] [CrossRef] [PubMed]
- Tong, C.; Xiang, G.; Bai, Y. Interaction of paraquat with calf thymus DNA: A terbium(III) luminescent probe and multispectral study. J. Agric. Food Chem. 2010, 58, 5257–5262. [Google Scholar] [CrossRef] [PubMed]
- Shahabadi, N.; Moghadam, N.H. Determining the mode of interaction of calf thymus DNA with the drug sumatriptan using voltammetric and spectroscopic techniques. Spectrochim. Acta A 2012, 99, 18–22. [Google Scholar] [CrossRef] [PubMed]
- Tyagi, G.; Charak, S.; Mehrotra, R. Binding of an indole alkaloid, vinblastine to double stranded DNA: A spectroscopic insight in to nature and strength of interaction. J. Photochem. Photobiol. B 2012, 108, 48–52. [Google Scholar] [CrossRef] [PubMed]
- Chen, L.M.; Liu, J.; Chen, J.C.; Shi, S.; Tan, C.P.; Zheng, K.C.; Ji, L.N. Experimental and theoretical studies on the DNA-binding and spectral properties of water-soluble complex [Ru(Meim)(4)(dpq)]2+. J. Mol. Struct. 2008, 881, 156–166. [Google Scholar] [CrossRef]
- Maheswari, P.U.; Palaniandavar, M. DNA binding and cleavage properties of certain tetrammine ruthenium(II) complexes of modified 1,10-phenanthrolines-effect of hydrogen-bonding on DNA-binding affinity. J. Inorg. Biochem. 2004, 98, 219–230. [Google Scholar] [CrossRef]
- Tao, M.; Zhang, G.; Pan, J.; Xiong, C. Deciphering the groove binding modes of tau-fluvalinate and flumethrin with calf thymus DNA. Spectrochim. Acta A 2016, 155, 28–37. [Google Scholar] [CrossRef] [PubMed]
- Tiwari, R.; Mahasenan, K.; Pavlovicz, R.; Li, C.; Tjarks, W. Carborane clusters in computational drug design: A comparative docking evaluation using autodock, flexX, glide, and surflex. J. Chem. Inf. Model. 2009, 49, 1581–1589. [Google Scholar] [CrossRef] [PubMed]
- Chi, Z.; Liu, R. Phenotypic characterization of the binding of tetracycline to human serum albumin. Biomacromolecules 2011, 12, 203–209. [Google Scholar] [CrossRef] [PubMed]
- Ivanova, B.; Spiteller, M. Structure and properties of camptothecin derivatives, their protonated forms, and model interaction with the topoisomerase I-DNA complex. Biopolymers 2012, 97, 134–144. [Google Scholar] [CrossRef] [PubMed]
- Privalov, P.L.; Dragan, A.I.; Crane-Robinson, C.; Breslauer, K.J.; Remeta, D.P.; Minetti, C.A.S.A. What drives proteins into the major or minor grooves of DNA? J. Mol. Biol. 2007, 365, 1–9. [Google Scholar] [CrossRef] [PubMed]
- Ivanova, B.; Spiteller, M. Substituted benzo i phenanthridines as promising topoisomerase-i non-camptothecin targeting agents: An experimental and theoretical study. Med. Chem. Res. 2013, 22, 5204–5217. [Google Scholar] [CrossRef]
- Bi, S.; Zhao, T.; Wang, Y.; Zhou, H.; Pang, B.; Gu, T. Binding studies of terbutaline sulfate to calf thymus DNA using multispectroscopic and molecular docking techniques. Spectrochim. Acta A 2015, 150, 921–927. [Google Scholar] [CrossRef] [PubMed]
- Song, G.W.; He, Y.; Cai, Z.X. The interaction between levofloxacine hydrochloride and DNA mediated by Cu2+. J. Fluoresc. 2004, 14, 705–710. [Google Scholar] [CrossRef] [PubMed]
- Husain, M.A.; Sarwar, T.; Rehman, S.U.; Ishqi, H.M.; Tabish, M. Ibuprofen causes photocleavage through ros generation and intercalates with DNA: A combined biophysical and molecular docking approach. Phys. Chem. Chem. Phys. 2015, 17, 13837–13850. [Google Scholar] [CrossRef] [PubMed]
Figure 1.
Molecular structures of Aflatoxin B1(AFB1) and Aflatixin G1(AFG1).

Figure 2.
UV Absorption (a) and fluorescence emission (b) spectra of the AFB1-DNA before and after the dialysis. c(DNA) = 1.51 × 10⁻⁴ mol·L−1, c(AFB1) = 1 × 10⁻⁵ mol·L−1 (n = 3).
Figure 2.
UV Absorption (a) and fluorescence emission (b) spectra of the AFB1-DNA before and after the dialysis. c(DNA) = 1.51 × 10⁻⁴ mol·L−1, c(AFB1) = 1 × 10⁻⁵ mol·L−1 (n = 3).

Figure 3.
Stern–Volmer plot for observed fluorescence quenching of AFB1 (a) and AFG1 (b) upon addition of DNA at different temperatures. c(AFB1) = 8 × 10⁻⁶ mol·L−1. c(DNA) = 1.6, 3.2, 4.8, 6.4, 8, 9.6, 11.2, 12.8, 14.4, 16 × 10−6 mol·L−1 (n = 3). “ctDNA” means calf thymus DNA.
Figure 3.
Stern–Volmer plot for observed fluorescence quenching of AFB1 (a) and AFG1 (b) upon addition of DNA at different temperatures. c(AFB1) = 8 × 10⁻⁶ mol·L−1. c(DNA) = 1.6, 3.2, 4.8, 6.4, 8, 9.6, 11.2, 12.8, 14.4, 16 × 10−6 mol·L−1 (n = 3). “ctDNA” means calf thymus DNA.

Figure 4.
Resonance light scattering (RLS) spectra of DNA-AFB1 system at pH 7.4 and 298 K. Curves: (a) c(AFB1) = 0 and c(DNA) = 14.4 × 10⁻⁶ mol·L −1; (b–k) c(DNA) = 0, 1.6, 3.2, 4.8, 6.4, 8, 9.6, 11.2, 12.8 and 14.4 × 10⁻⁶ mol·L−1, respectively, and c(AFB1) = 8 × 10⁻⁶ mol·L−1 (n = 3).
Figure 4.
Resonance light scattering (RLS) spectra of DNA-AFB1 system at pH 7.4 and 298 K. Curves: (a) c(AFB1) = 0 and c(DNA) = 14.4 × 10⁻⁶ mol·L −1; (b–k) c(DNA) = 0, 1.6, 3.2, 4.8, 6.4, 8, 9.6, 11.2, 12.8 and 14.4 × 10⁻⁶ mol·L−1, respectively, and c(AFB1) = 8 × 10⁻⁶ mol·L−1 (n = 3).

Figure 5.
Fluorescence emission spectra of the competitive displacement assays between AFB1 and different dyes. (a) Emission spectra of the EB-DNA complexes in the present of AFB1. c(EB) = 2 × 10⁻⁶ mol·L−1, c(DNA) = 4 × 10⁻⁵ mol·L−1, c(AFB1) = 0, 1, 2, 3, 4, 5, 6, 7, 8 × 10⁻⁵ mol·L−1; (b) Emission spectra of the Hoechst-DNA complexes in the present of AFB1. c(Hoechst) = 2 × 10⁻⁶ mol·L−1, c(DNA) = 4 × 10⁻⁵ mol·L−1, c(AFB1) = 0, 1, 2, 3, 4, 5, 6, 7, 8 × 10⁻⁵ mol·L−1 (n = 3).

Figure 6.
(a) UV-visible absorption spectra of AFB1 (3.5 × 10⁻⁵ mol·L−1) in the presence of increasing concentrations of ctDNA in in a phosphate-buffered saline (PBS buffer (pH 7.4). c(DNA) = 0, 3.2, 6.4, 9.6, 12.8, 16.0, 19.2, 22.4, 25.6 × 10⁻⁶ mol·L−1 (from 1 to 9). Insert: fluorescence intensity at 365 nm; (b) UV-visible absorption spectra of the DNA (2 × 10⁻⁵ mol·L−1) in the presence of increasing concentrations of AFB1 in PBS buffer (pH 7.4). c(AFB1) = 0, 4, 8, 12, 16, 20, 24, 28, 32 × 10−6 mol·L−1 (from 1 to 9) (n = 3).

Figure 7.
Effect of the addition of AFB1 on the relative viscosity of ctDNA at 298 K. c(DNA) = 2 × 10⁻⁵ mol·L−1, [AFB1]/[ctDNA] = 0, 0.2, 0.4, 0.6, 0.8, 1, 1.2, 1.4 (n = 3).
Figure 7.
Effect of the addition of AFB1 on the relative viscosity of ctDNA at 298 K. c(DNA) = 2 × 10⁻⁵ mol·L−1, [AFB1]/[ctDNA] = 0, 0.2, 0.4, 0.6, 0.8, 1, 1.2, 1.4 (n = 3).

Figure 8.
Melting curves of ctDNA at 260 nm in the absence (pink) and the presence (green) of the various concentrations of AFB1 in the PBS buffer. c(DNA) = 8 × 10⁻⁶ mol·L−1, c(AFB1) = 8 × 10⁻⁶ mol·L−1 (n = 3).
Figure 8.
Melting curves of ctDNA at 260 nm in the absence (pink) and the presence (green) of the various concentrations of AFB1 in the PBS buffer. c(DNA) = 8 × 10⁻⁶ mol·L−1, c(AFB1) = 8 × 10⁻⁶ mol·L−1 (n = 3).

Figure 9.
Effect of ionic strength on the fluorescence intensity of the AFB1-DNA complex (a) and the AFG1-DNA complex (b). c(DNA) = c(AFB1) = 2 × 10⁻⁵ mol·L−1, c(NaCl) = 5, 10, 15, 20, 25, 30, 35, 40, 45 × 10−3 mol·L−1. F0 was the fluorescence intensity of AFB1/AFG1-DNA complex without the NaCl and F was the fluorescence intensity of AFB1/AFG1-DNA complex with the various concentrations of NaCl (n = 3).

Figure 10.
Fluorescence quenching plots of AFB1 by double-stranded DNA (dsDNA) and single-stranded DNA (ssDNA) at pH 7.4 and 298 K, c(AFB1) = 5 × 10⁻⁵ mol·L−1. F0 was the fluorescence intensity of AFB1 without DNA and F was the fluorescence intensity of AFB1 with the various concentrations of ssDNA/dsDNA (n = 3).

Figure 11.
The change of circular dichroism (CD) spectrum of ctDNA in the absence and presence of AFB1 (a) and AFG1 (b), c(DNA) = 1 × 10⁻⁵ mol·L−1, c(AFB1) = c(AFG1) = 4 × 10⁻⁶ mol·L−1 and 20 × 10−6 mol·L−1 (n = 3).
Figure 11.
The change of circular dichroism (CD) spectrum of ctDNA in the absence and presence of AFB1 (a) and AFG1 (b), c(DNA) = 1 × 10⁻⁵ mol·L−1, c(AFB1) = c(AFG1) = 4 × 10⁻⁶ mol·L−1 and 20 × 10−6 mol·L−1 (n = 3).

Figure 12.
The molecular docked structures of AFB1/AFG1 binding to DNA through groove interaction. Different small molecules were represented by different colors: AFB1, green; AFG1, pink.
Figure 12.
The molecular docked structures of AFB1/AFG1 binding to DNA through groove interaction. Different small molecules were represented by different colors: AFB1, green; AFG1, pink.

Figure 13.
A comparison of binding conformation overlap between AFB1/AFG1 and DNA (AFB1: green; AFG1: pink).
Figure 13.
A comparison of binding conformation overlap between AFB1/AFG1 and DNA (AFB1: green; AFG1: pink).

Figure 14.
Most probable docking pose of AFB1 (a) and AFG1 (b) with ctDNA (possible hydrogen bonds shown as black dash).
Figure 14.
Most probable docking pose of AFB1 (a) and AFG1 (b) with ctDNA (possible hydrogen bonds shown as black dash).


Table 1.
The Stern-Volmer quenching constants and association constants of AFB1/AFG1 quenched by ctDNA at different temperatures.
Table 1.
The Stern-Volmer quenching constants and association constants of AFB1/AFG1 quenched by ctDNA at different temperatures.
| Aflatoxins | T (K) | Ksv a (L·mol−1) | R b | Ka c (L·mol−1) | R d |
|---|---|---|---|---|---|
| AFB1 | 298 | 1.24 × 10⁴ | 0.9938 | 4.12 × 10³ | 0.9921 |
| 303 | 2.31 × 10⁴ | 0.9959 | 4.97 × 10³ | 0.9901 | |
| 308 | 3.22 × 10⁴ | 0.9902 | 5.48 × 10³ | 0.9881 | |
| AFG1 | 298 | 8.31 × 10⁴ | 0.9912 | 1.89 × 10⁴ | 0.9865 |
| 303 | 7.32 × 10⁴ | 0.9887 | 1.27 × 10⁴ | 0.9908 | |
| 308 | 0.55 × 10⁴ | 0.9908 | 9.82 × 10³ | 0.9918 |
a The Stern–Volmer constant; b The correlation coefficient of the Ksv values; c The binding constant; d The correlation coefficient of the Ka values.
Table 2.
Relative thermodynamic variables for the interaction of AFB1/AFG1 with ctDNA at different temperatures.
Table 2.
Relative thermodynamic variables for the interaction of AFB1/AFG1 with ctDNA at different temperatures.
| Systems | ΔH a (kJ·mol−1) | ΔS b (J·mol−1·K−1) | ΔG c (kJ·mol−1) |
|---|---|---|---|
| AFB1-ctDNA | −24.45 | 17.88 | −31.47 |
| −31.98 | |||
| −32.56 | |||
| AFG1-ctDNA | −27.54 | −19.34 | −36.32 |
| −35.97 | |||
| −35.65 |
a Enthalpy changes; b Entropy change; c Gibbs free energy.
Table 3.
Binding energies of aflatoxins and DNA according to molecule docking result.
| Complex | Intermolecular Energy (kcal·mol−1) | Internal Energy (kcal·mol−1) | Torsional Energy (kcal·mol−1) | Unbound Extended Energy (kcal·mol−1) | Lowest Binding Energy (kcal·mol−1) | Electrostatic Energy (kcal·mol−1) |
|---|---|---|---|---|---|---|
| AFB1-DNA | −8.08 | −0.12 | 0.30 | −0.12 | −7.78 | −0.46 |
| AFG1-DNA | −8.59 | −0.09 | 0.30 | −0.09 | −8.29 | 0.04 |
Table 4.
The strength of hydrogen bonds in the interaction of AFB1/AFG1 with DNA by molecule docking.
Table 4.
The strength of hydrogen bonds in the interaction of AFB1/AFG1 with DNA by molecule docking.
| Small Molecular | Strong Hydrogen Bonds | Moderate Hydrogen Bonds | Weak Hydrogen Bonds |
|---|---|---|---|
| AFB1 | 2.6 Å (DG-16) 2.8 Å (DA-17) 2.9 Å (DA-17) | ||
| AFG1 | 2.9 Å (DT-7) 2.9 Å (DT-8) | 3.1 Å (DT-19) 3.2 Å (DA-18) 3.4 Å (DT-19) | 3.6 Å (DT-20) |
© 2017 by the authors. Licensee MDPI, Basel, Switzerland. This article is an open access article distributed under the terms and conditions of the Creative Commons Attribution (CC BY) license (http://creativecommons.org/licenses/by/4.0/).
Share and Cite
MDPI and ACS Style
Ma, L.; Wang, J.; Zhang, Y. Probing the Characterization of the Interaction of Aflatoxins B1 and G1 with Calf Thymus DNA In Vitro. Toxins 2017, 9, 209. https://0-doi-org.brum.beds.ac.uk/10.3390/toxins9070209
AMA Style
Ma L, Wang J, Zhang Y. Probing the Characterization of the Interaction of Aflatoxins B1 and G1 with Calf Thymus DNA In Vitro. Toxins. 2017; 9(7):209. https://0-doi-org.brum.beds.ac.uk/10.3390/toxins9070209
Chicago/Turabian StyleMa, Liang, Jiaman Wang, and Yuhao Zhang. 2017. "Probing the Characterization of the Interaction of Aflatoxins B1 and G1 with Calf Thymus DNA In Vitro" Toxins 9, no. 7: 209. https://0-doi-org.brum.beds.ac.uk/10.3390/toxins9070209
Note that from the first issue of 2016, this journal uses article numbers instead of page numbers. See further details here.