Utilization of a Gas-Sensing System to Discriminate Smell and to Monitor Fermentation during the Manufacture of Oolong Tea Leaves


Abstract
:1. Introduction
2. Distinguishing the Samples at Various Stages
2.1. Sensor Selection
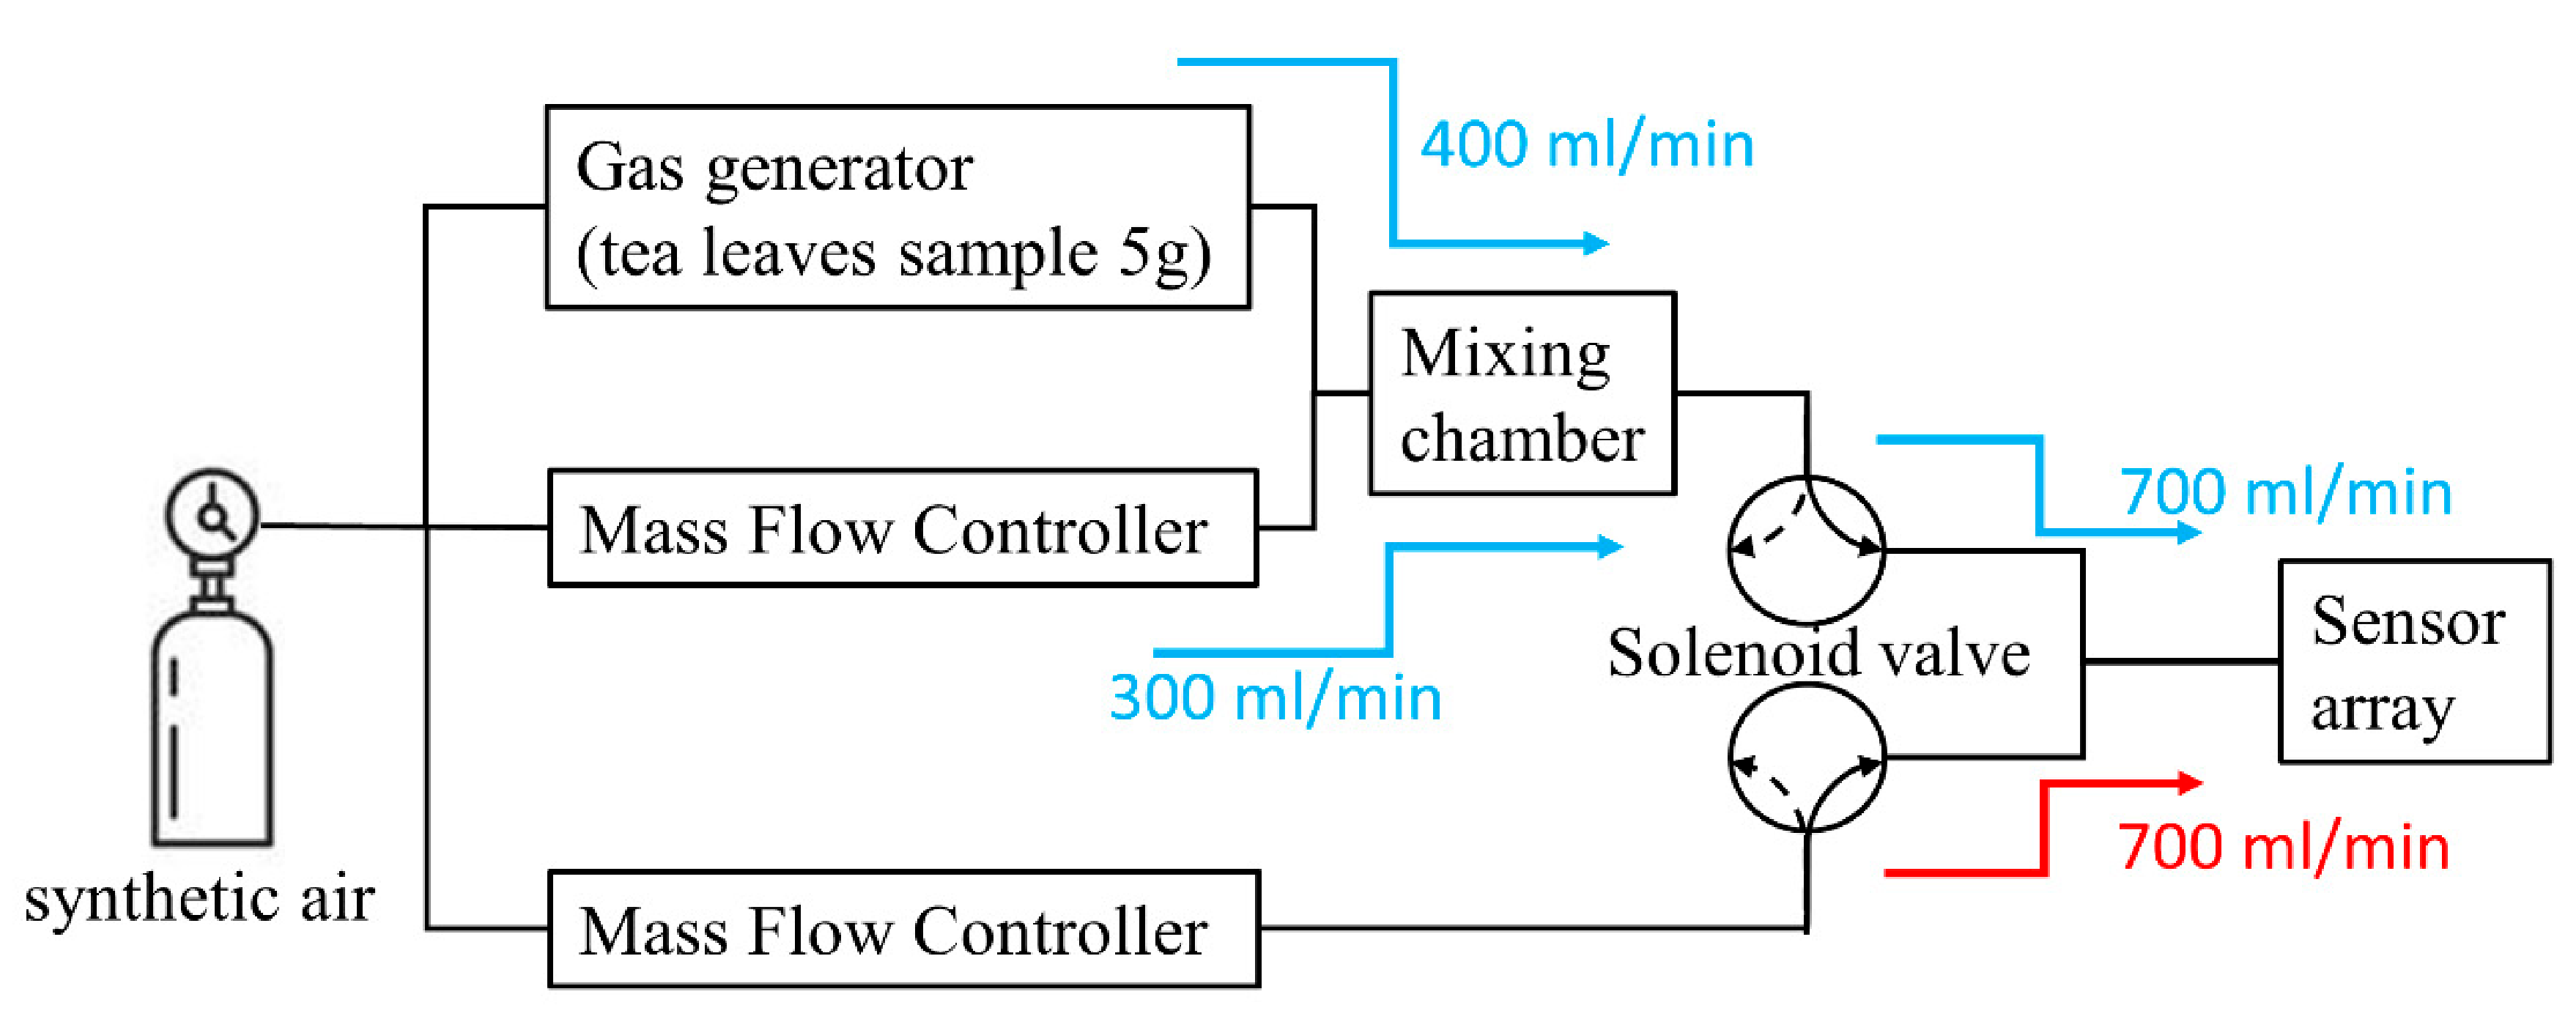
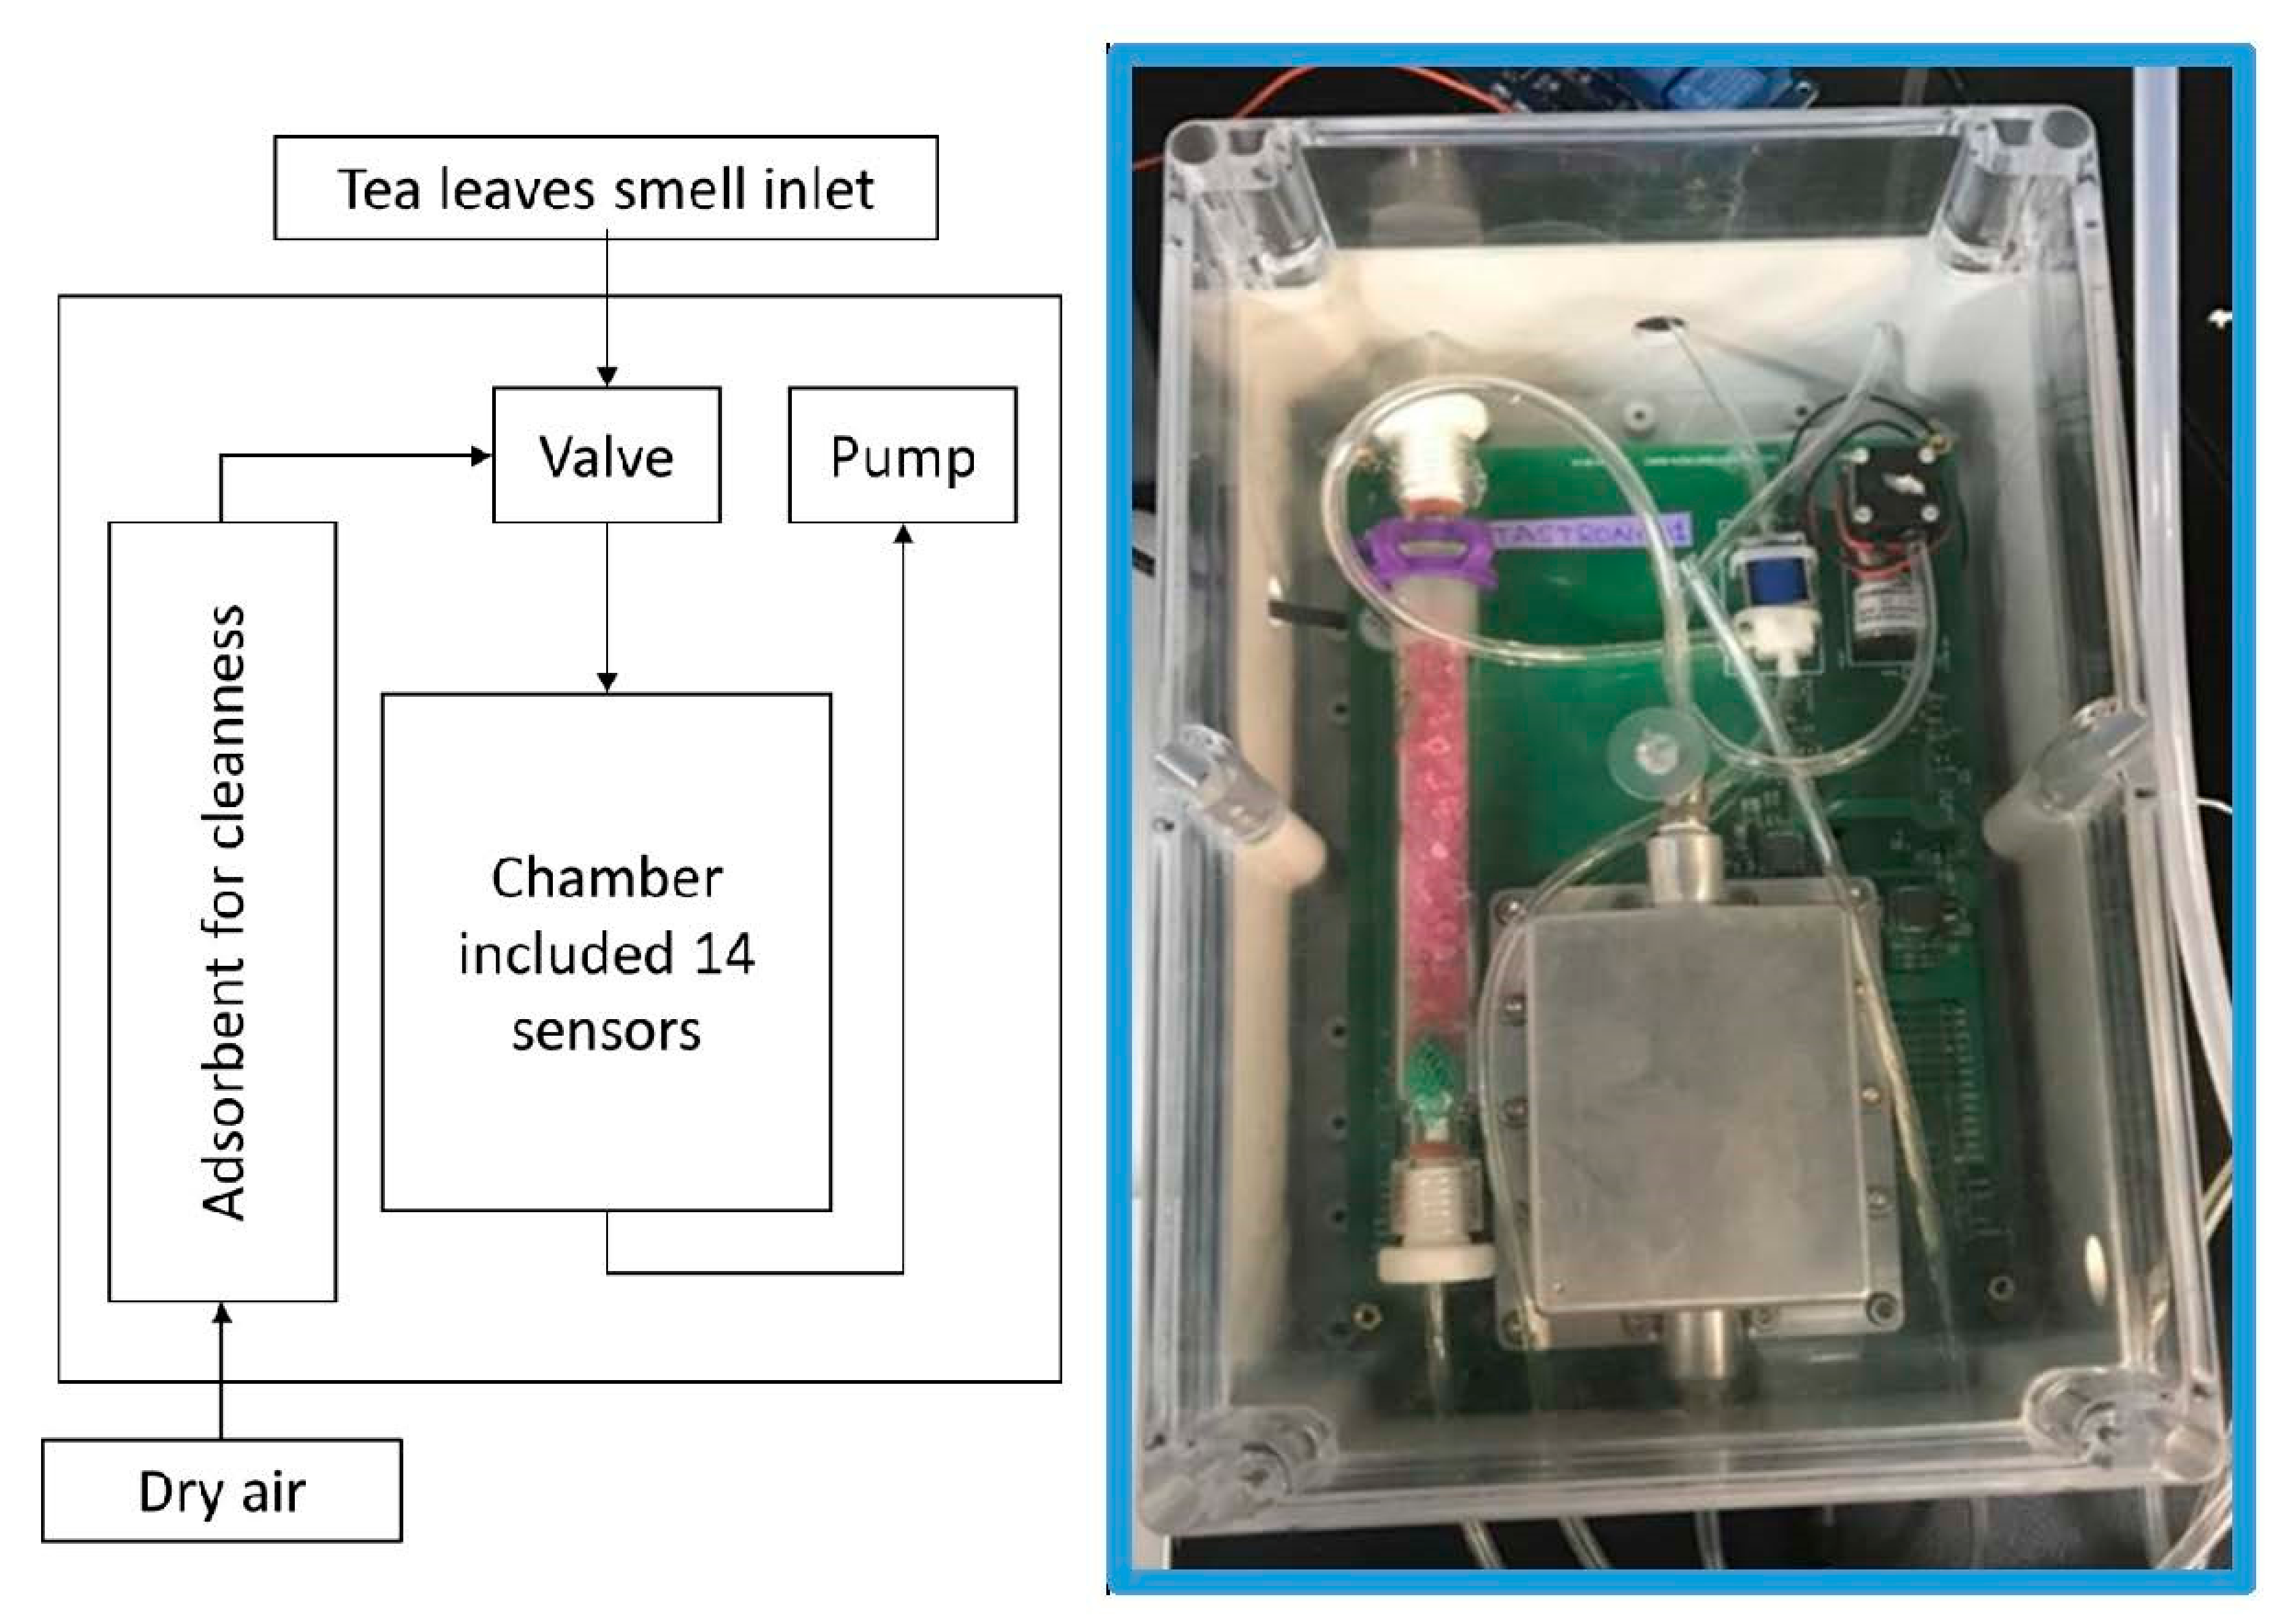
2.2. Gas-Sensing System
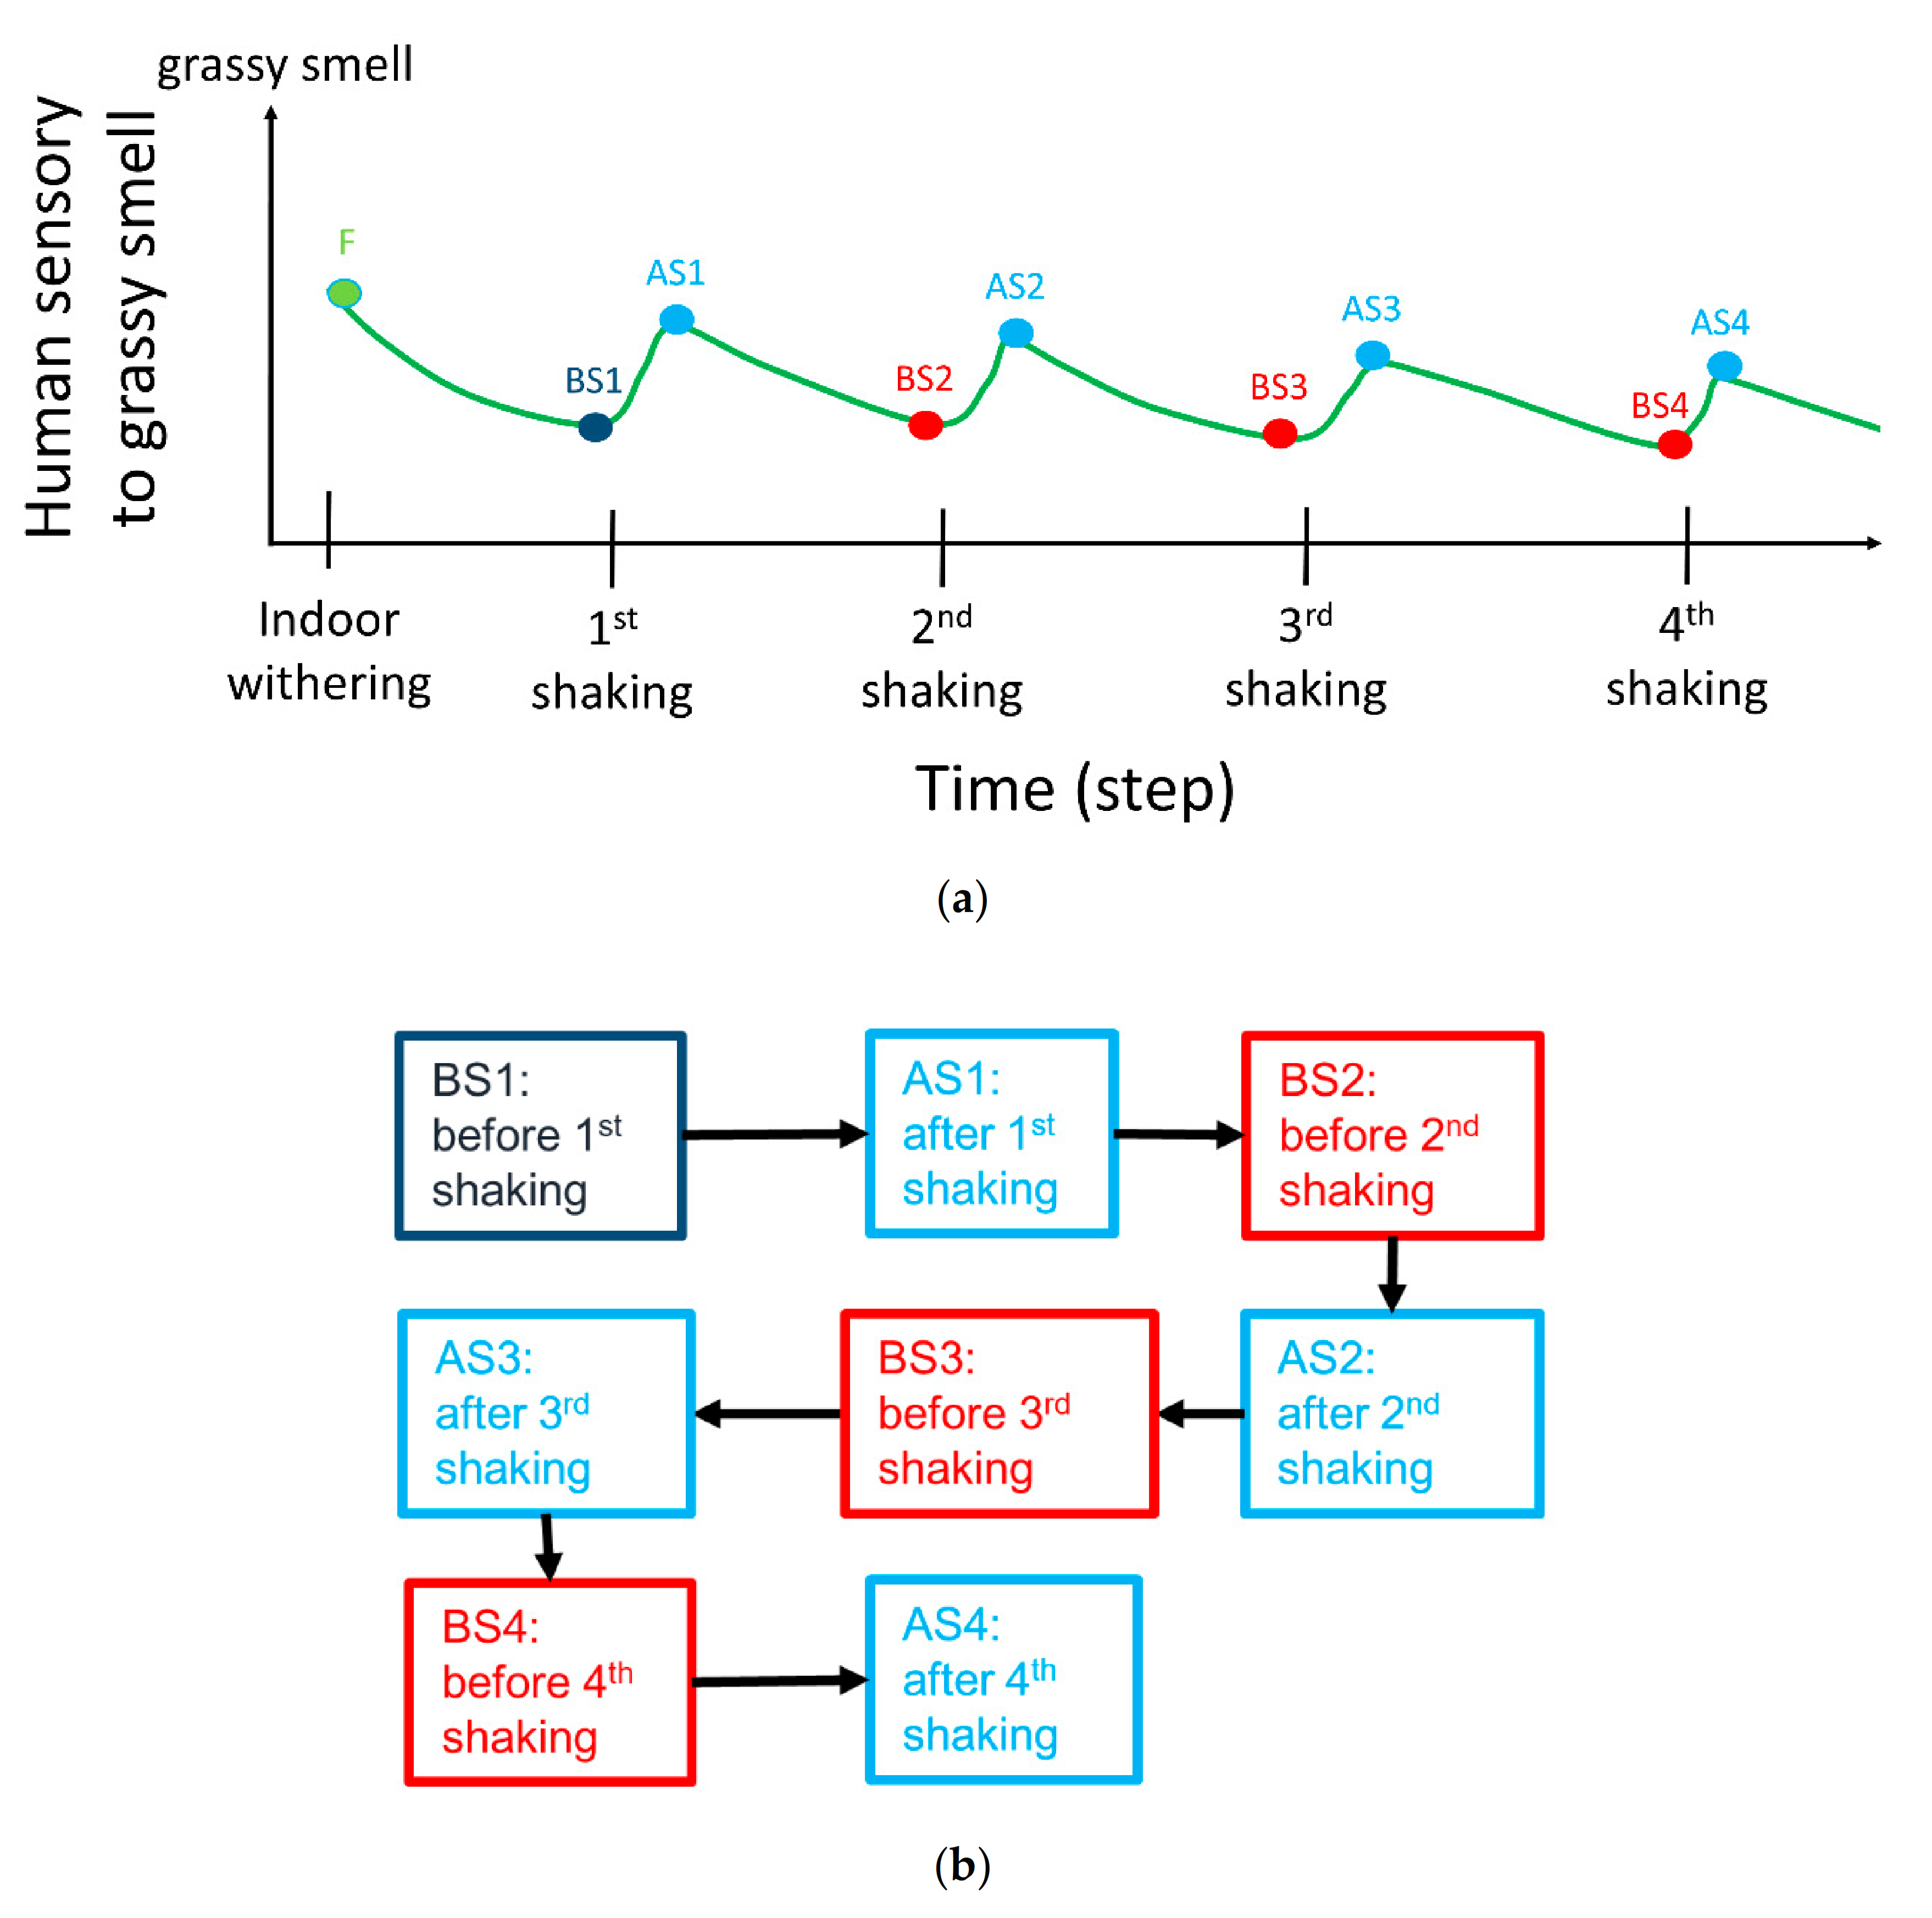
2.3. Introduction of Smell Variation
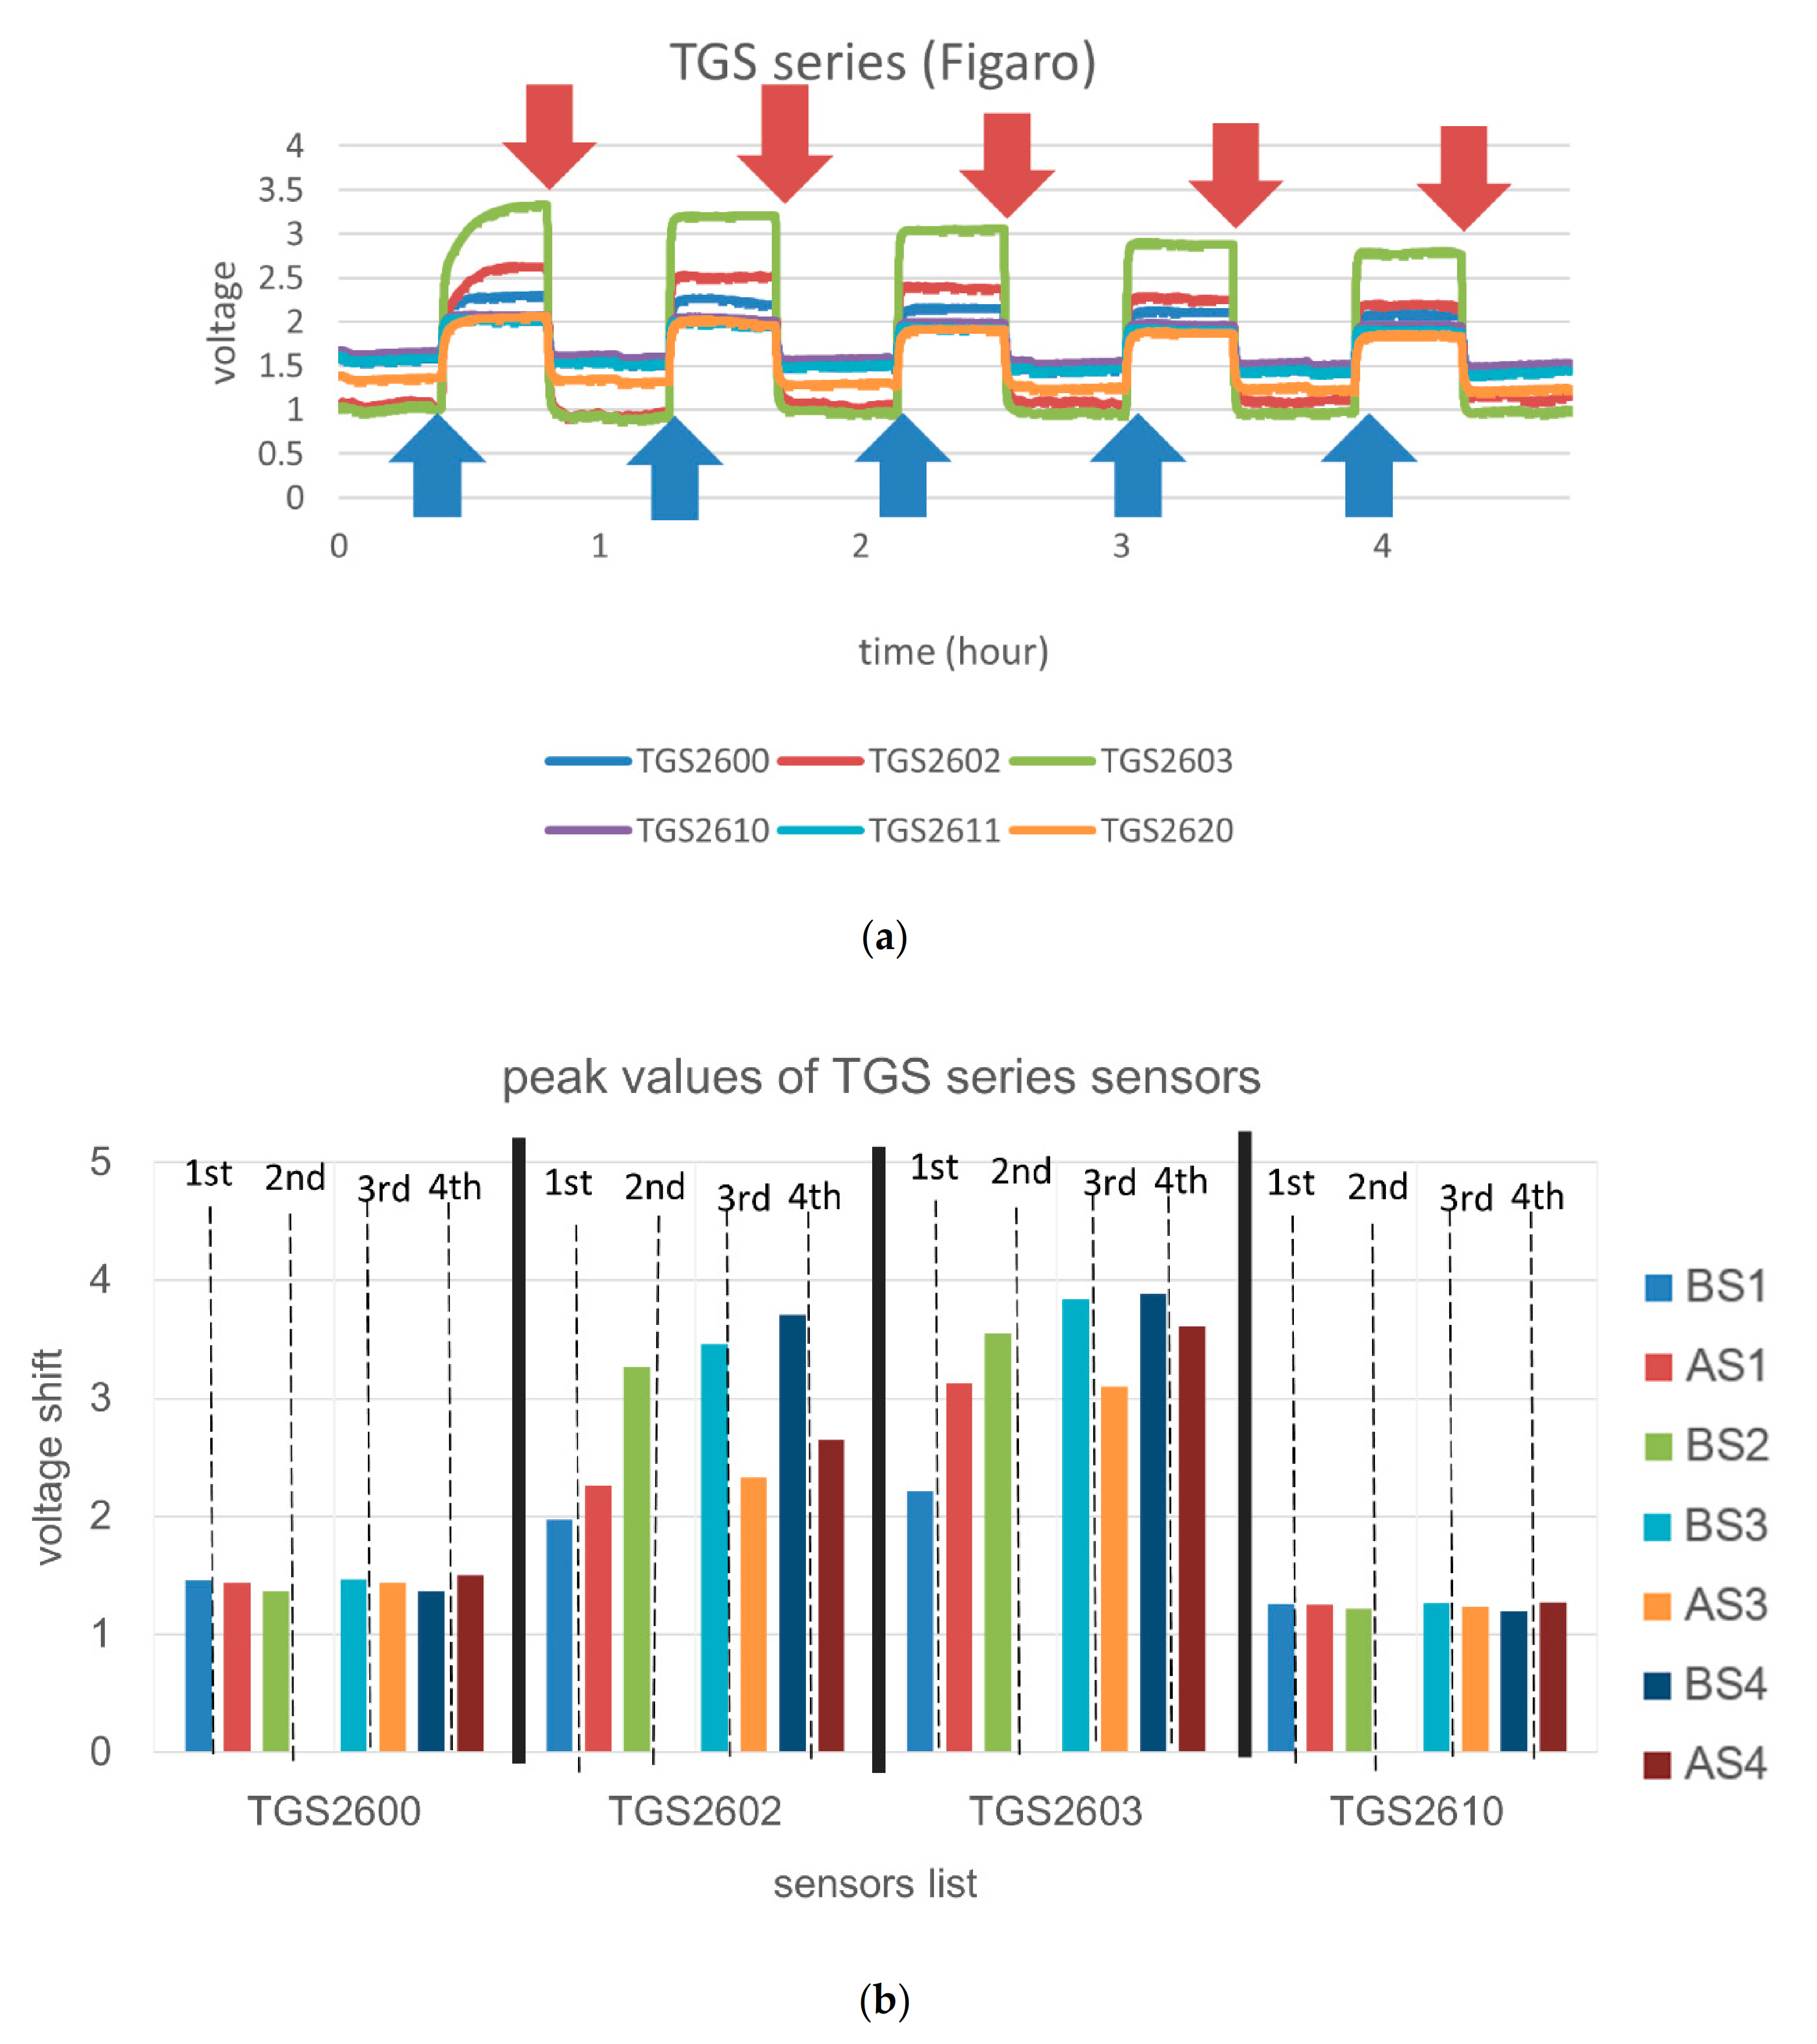
2.4. Results
3. On-Line Experiment
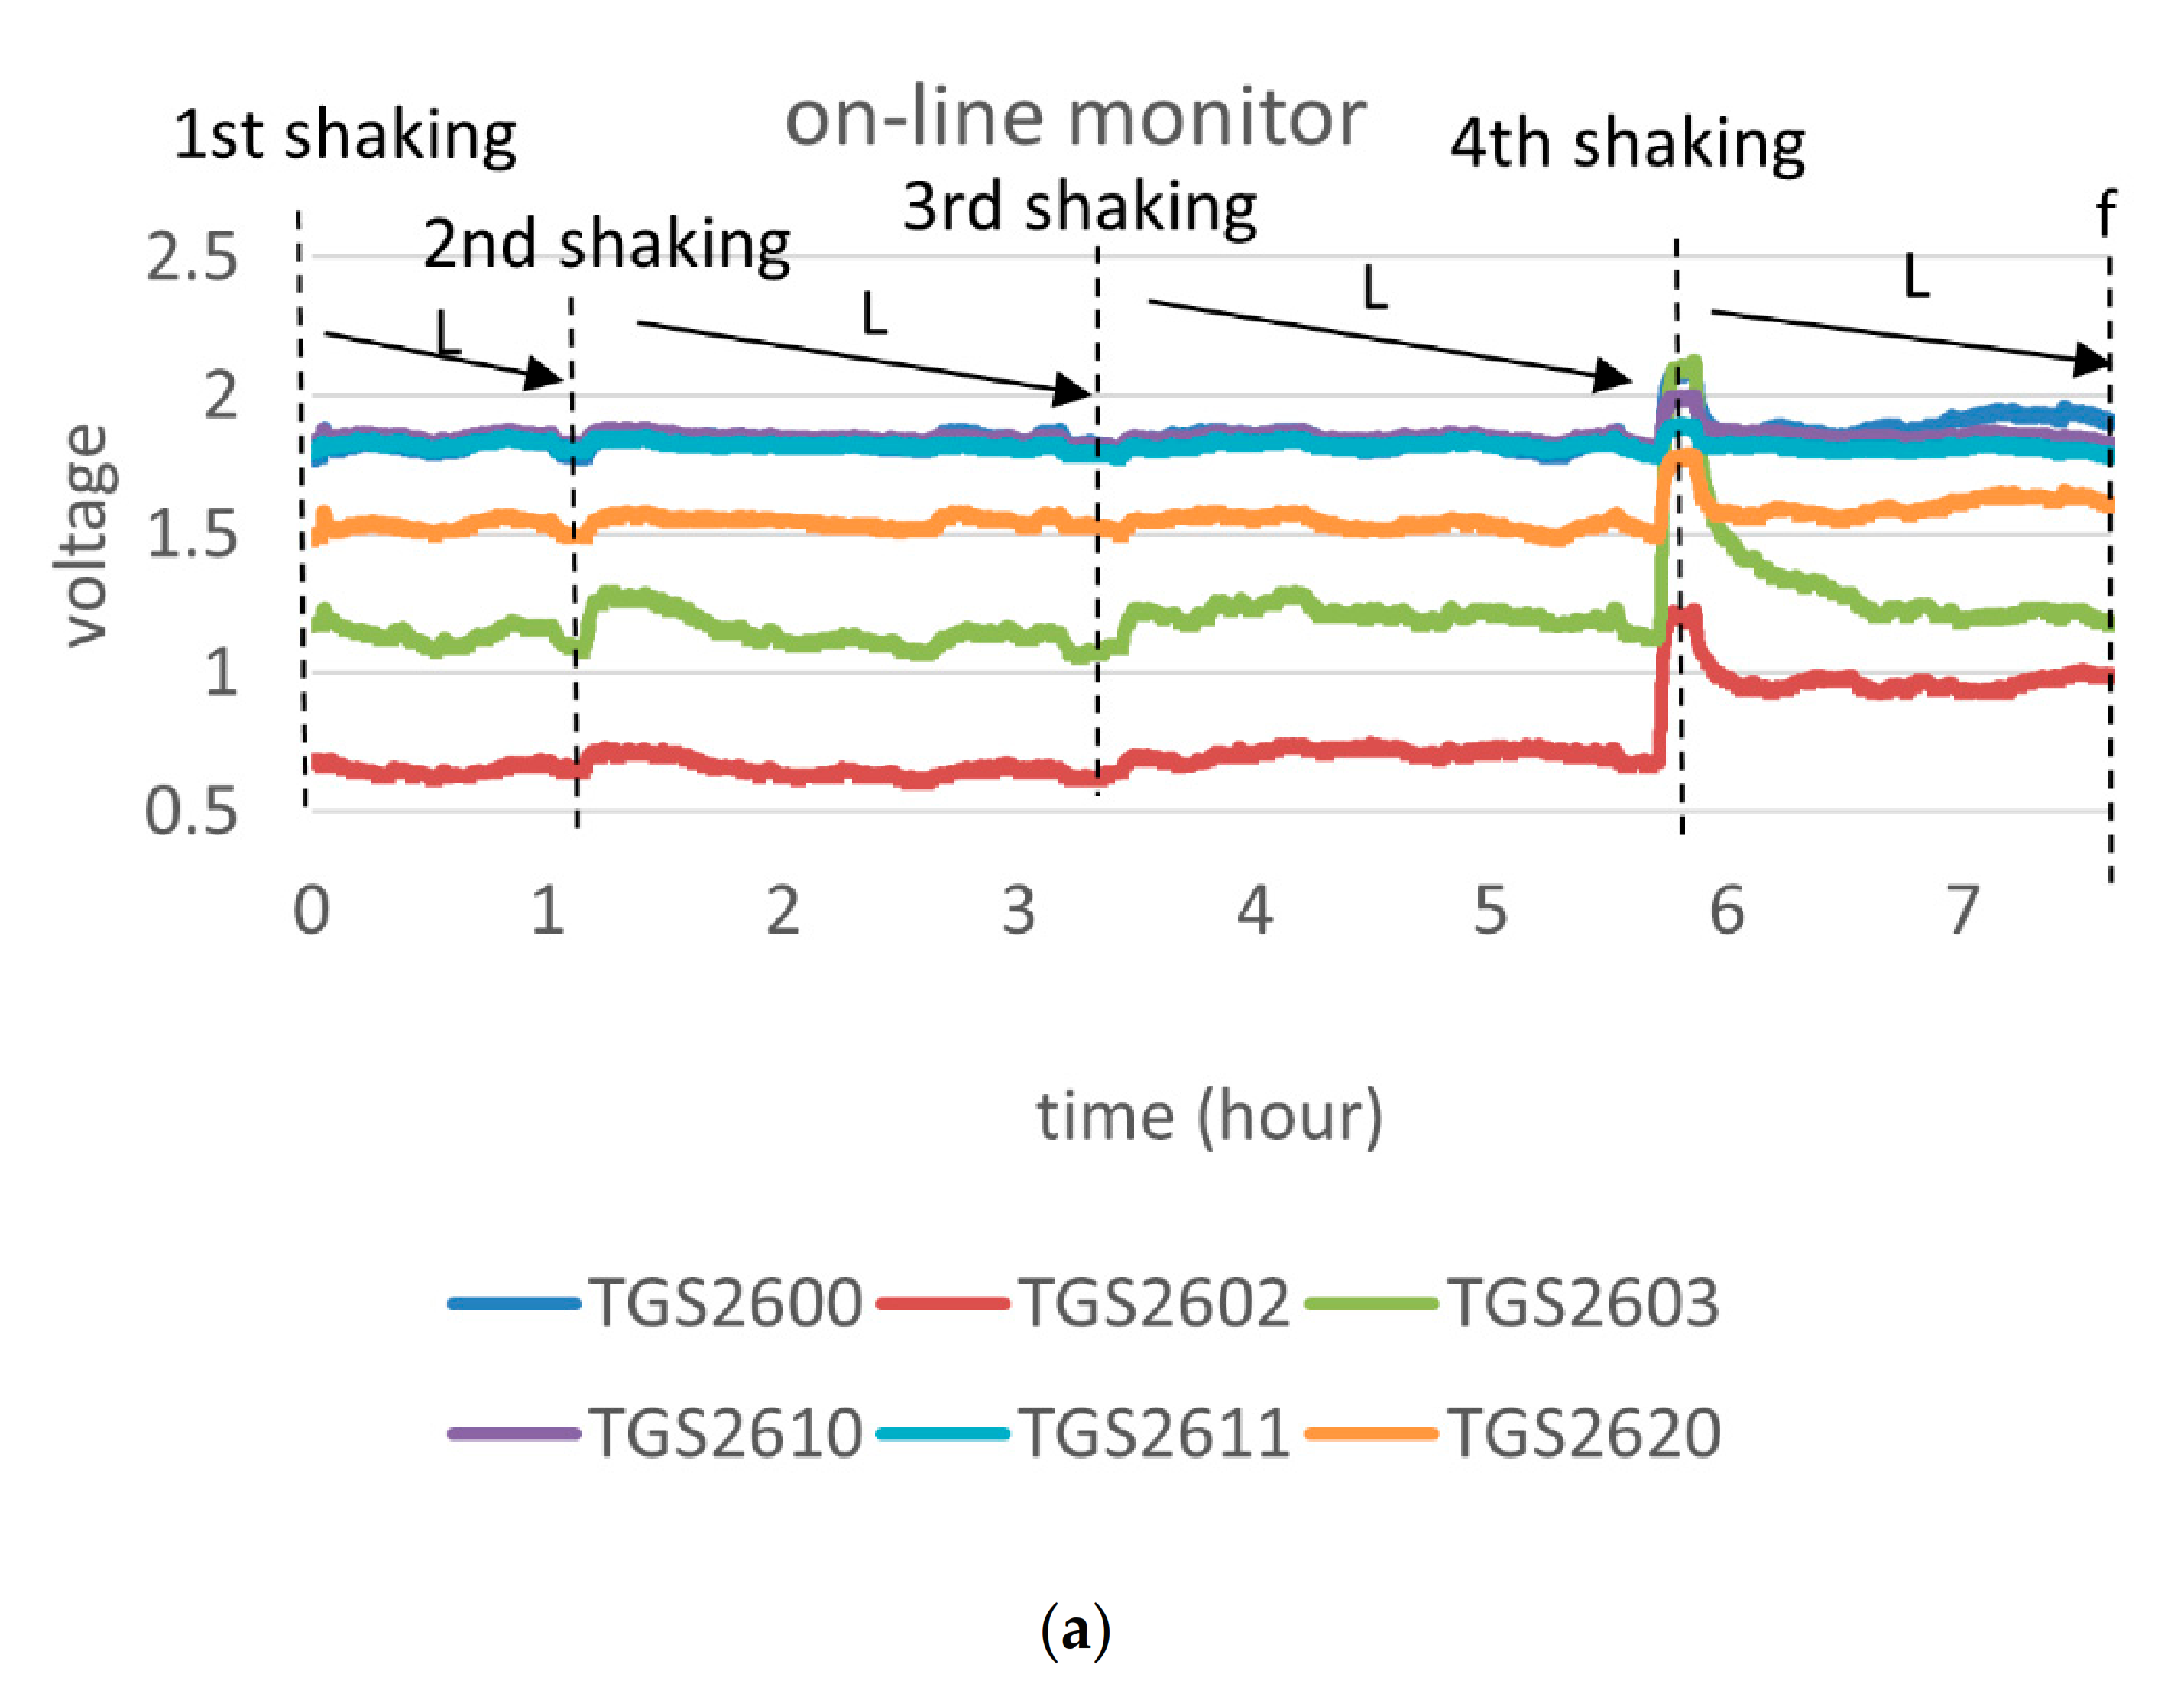
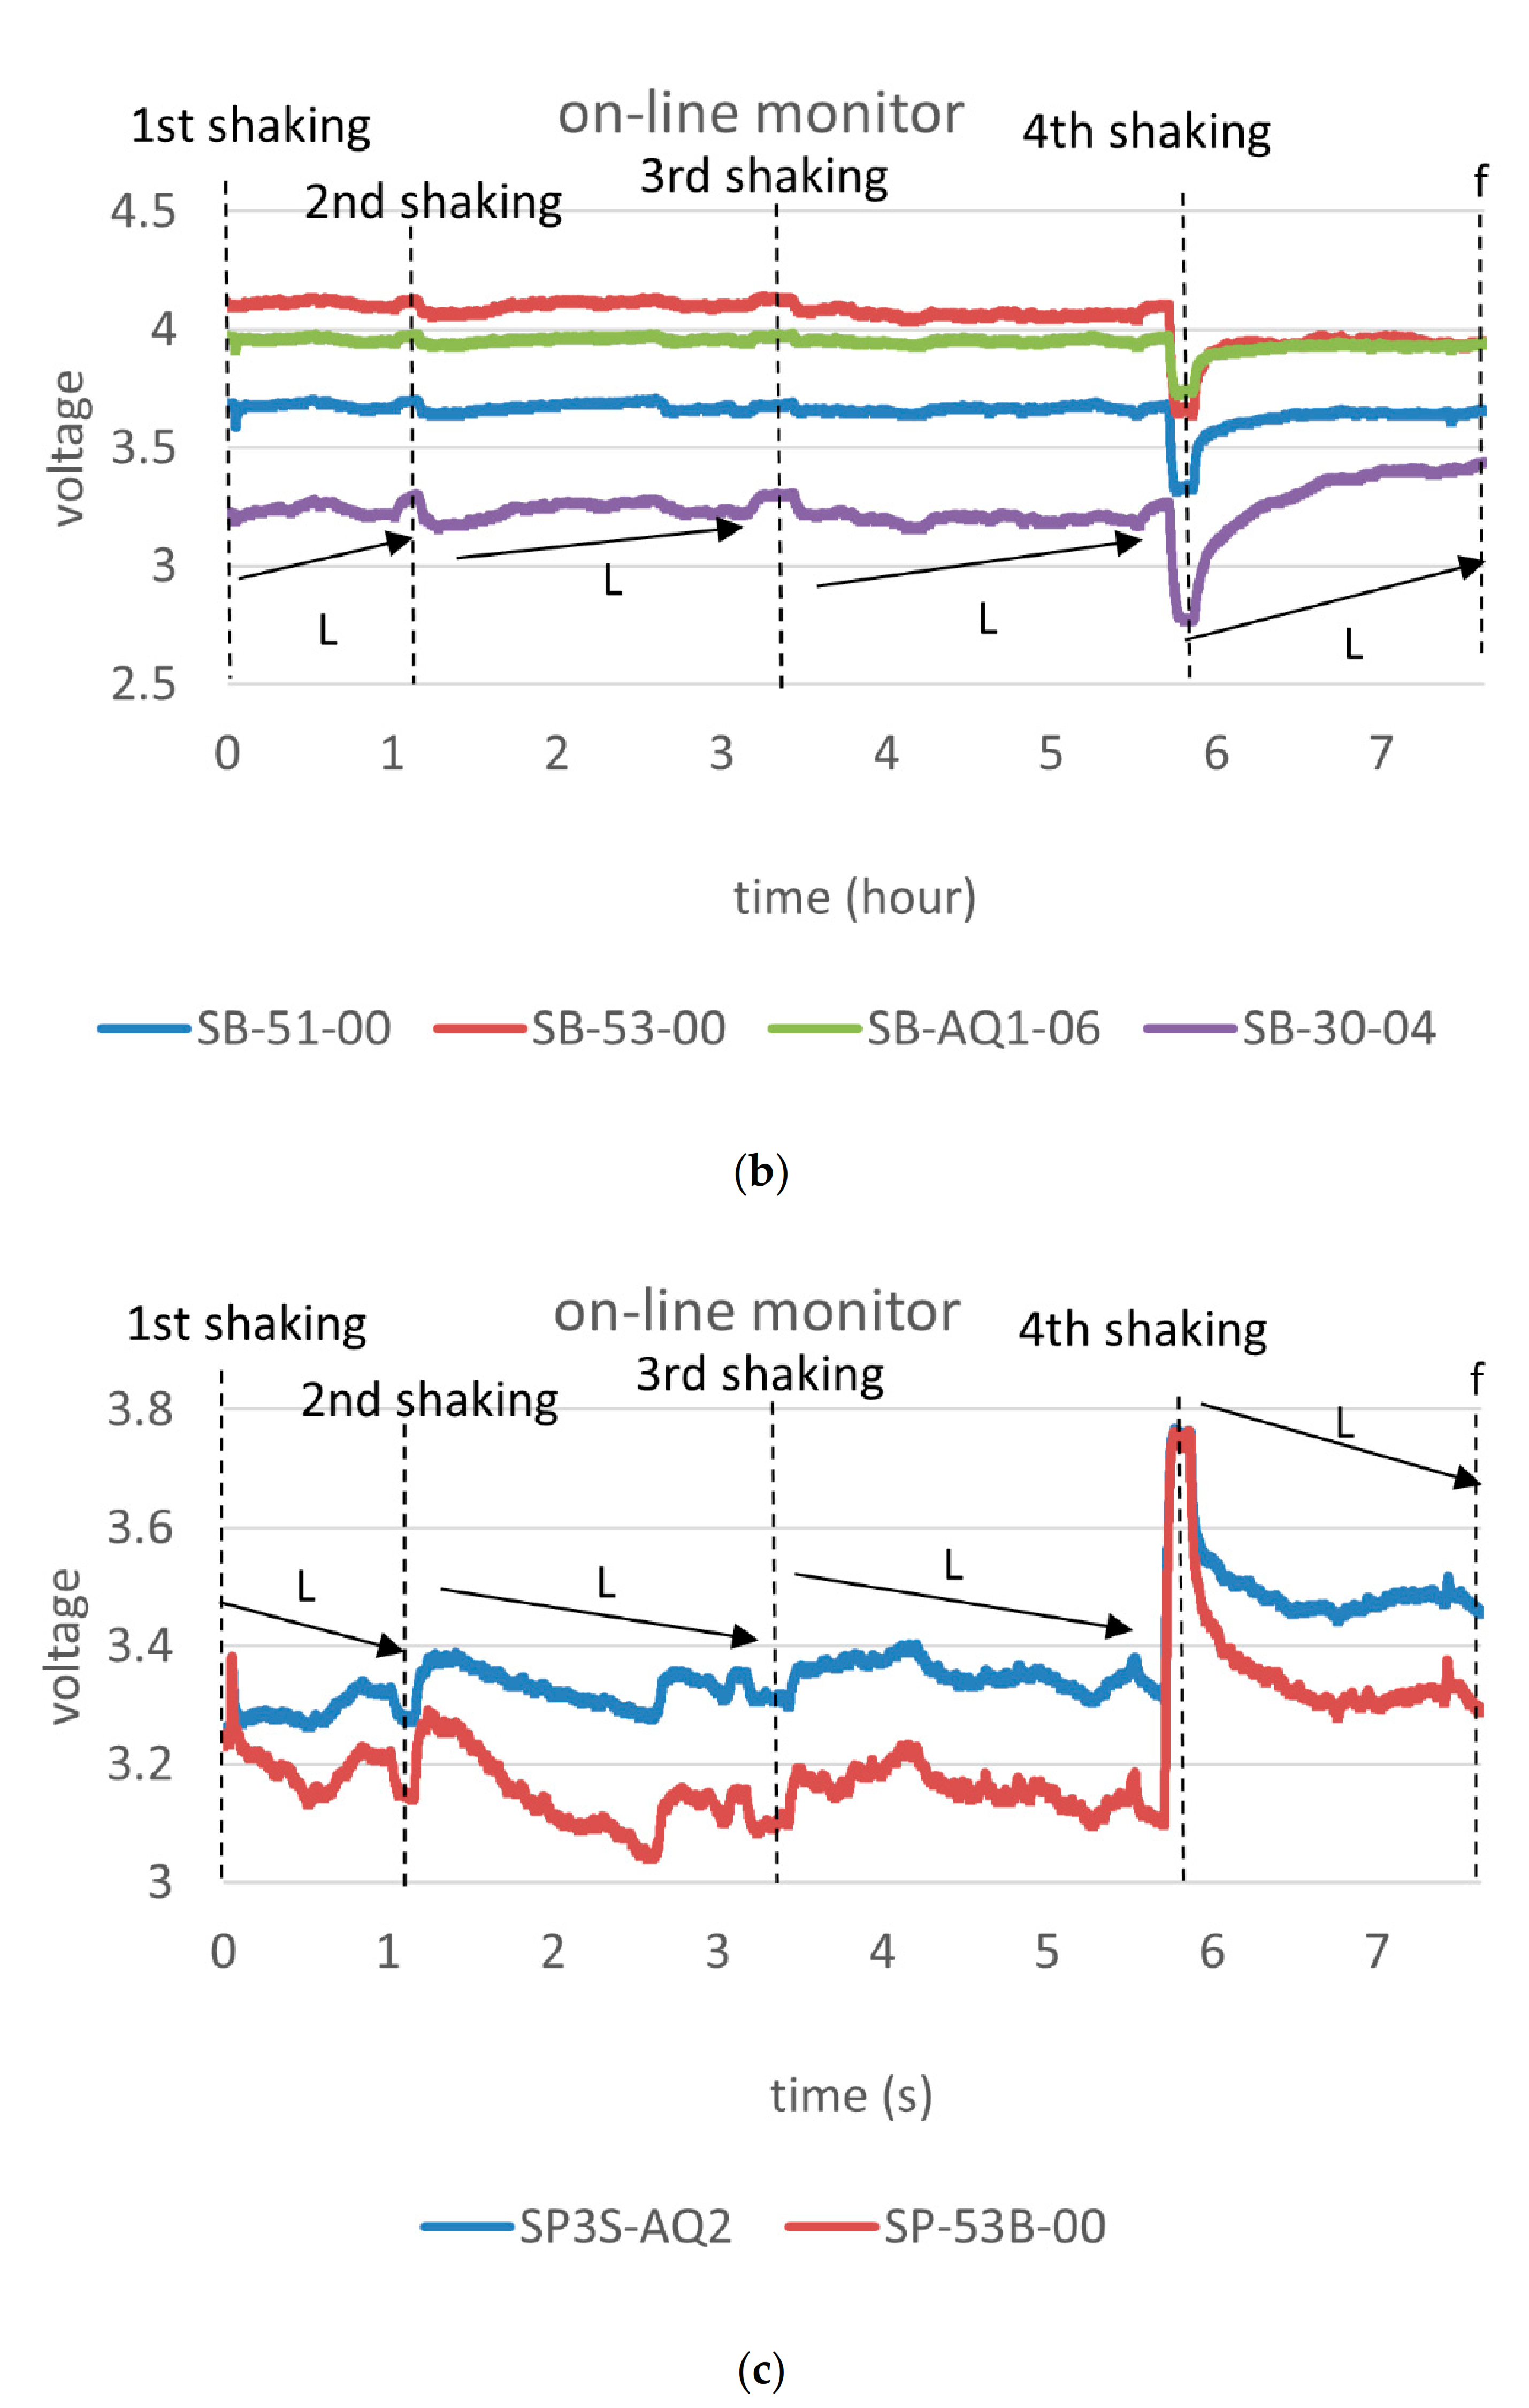
3.1. Gas-Sensing System
3.2. Data Analysis
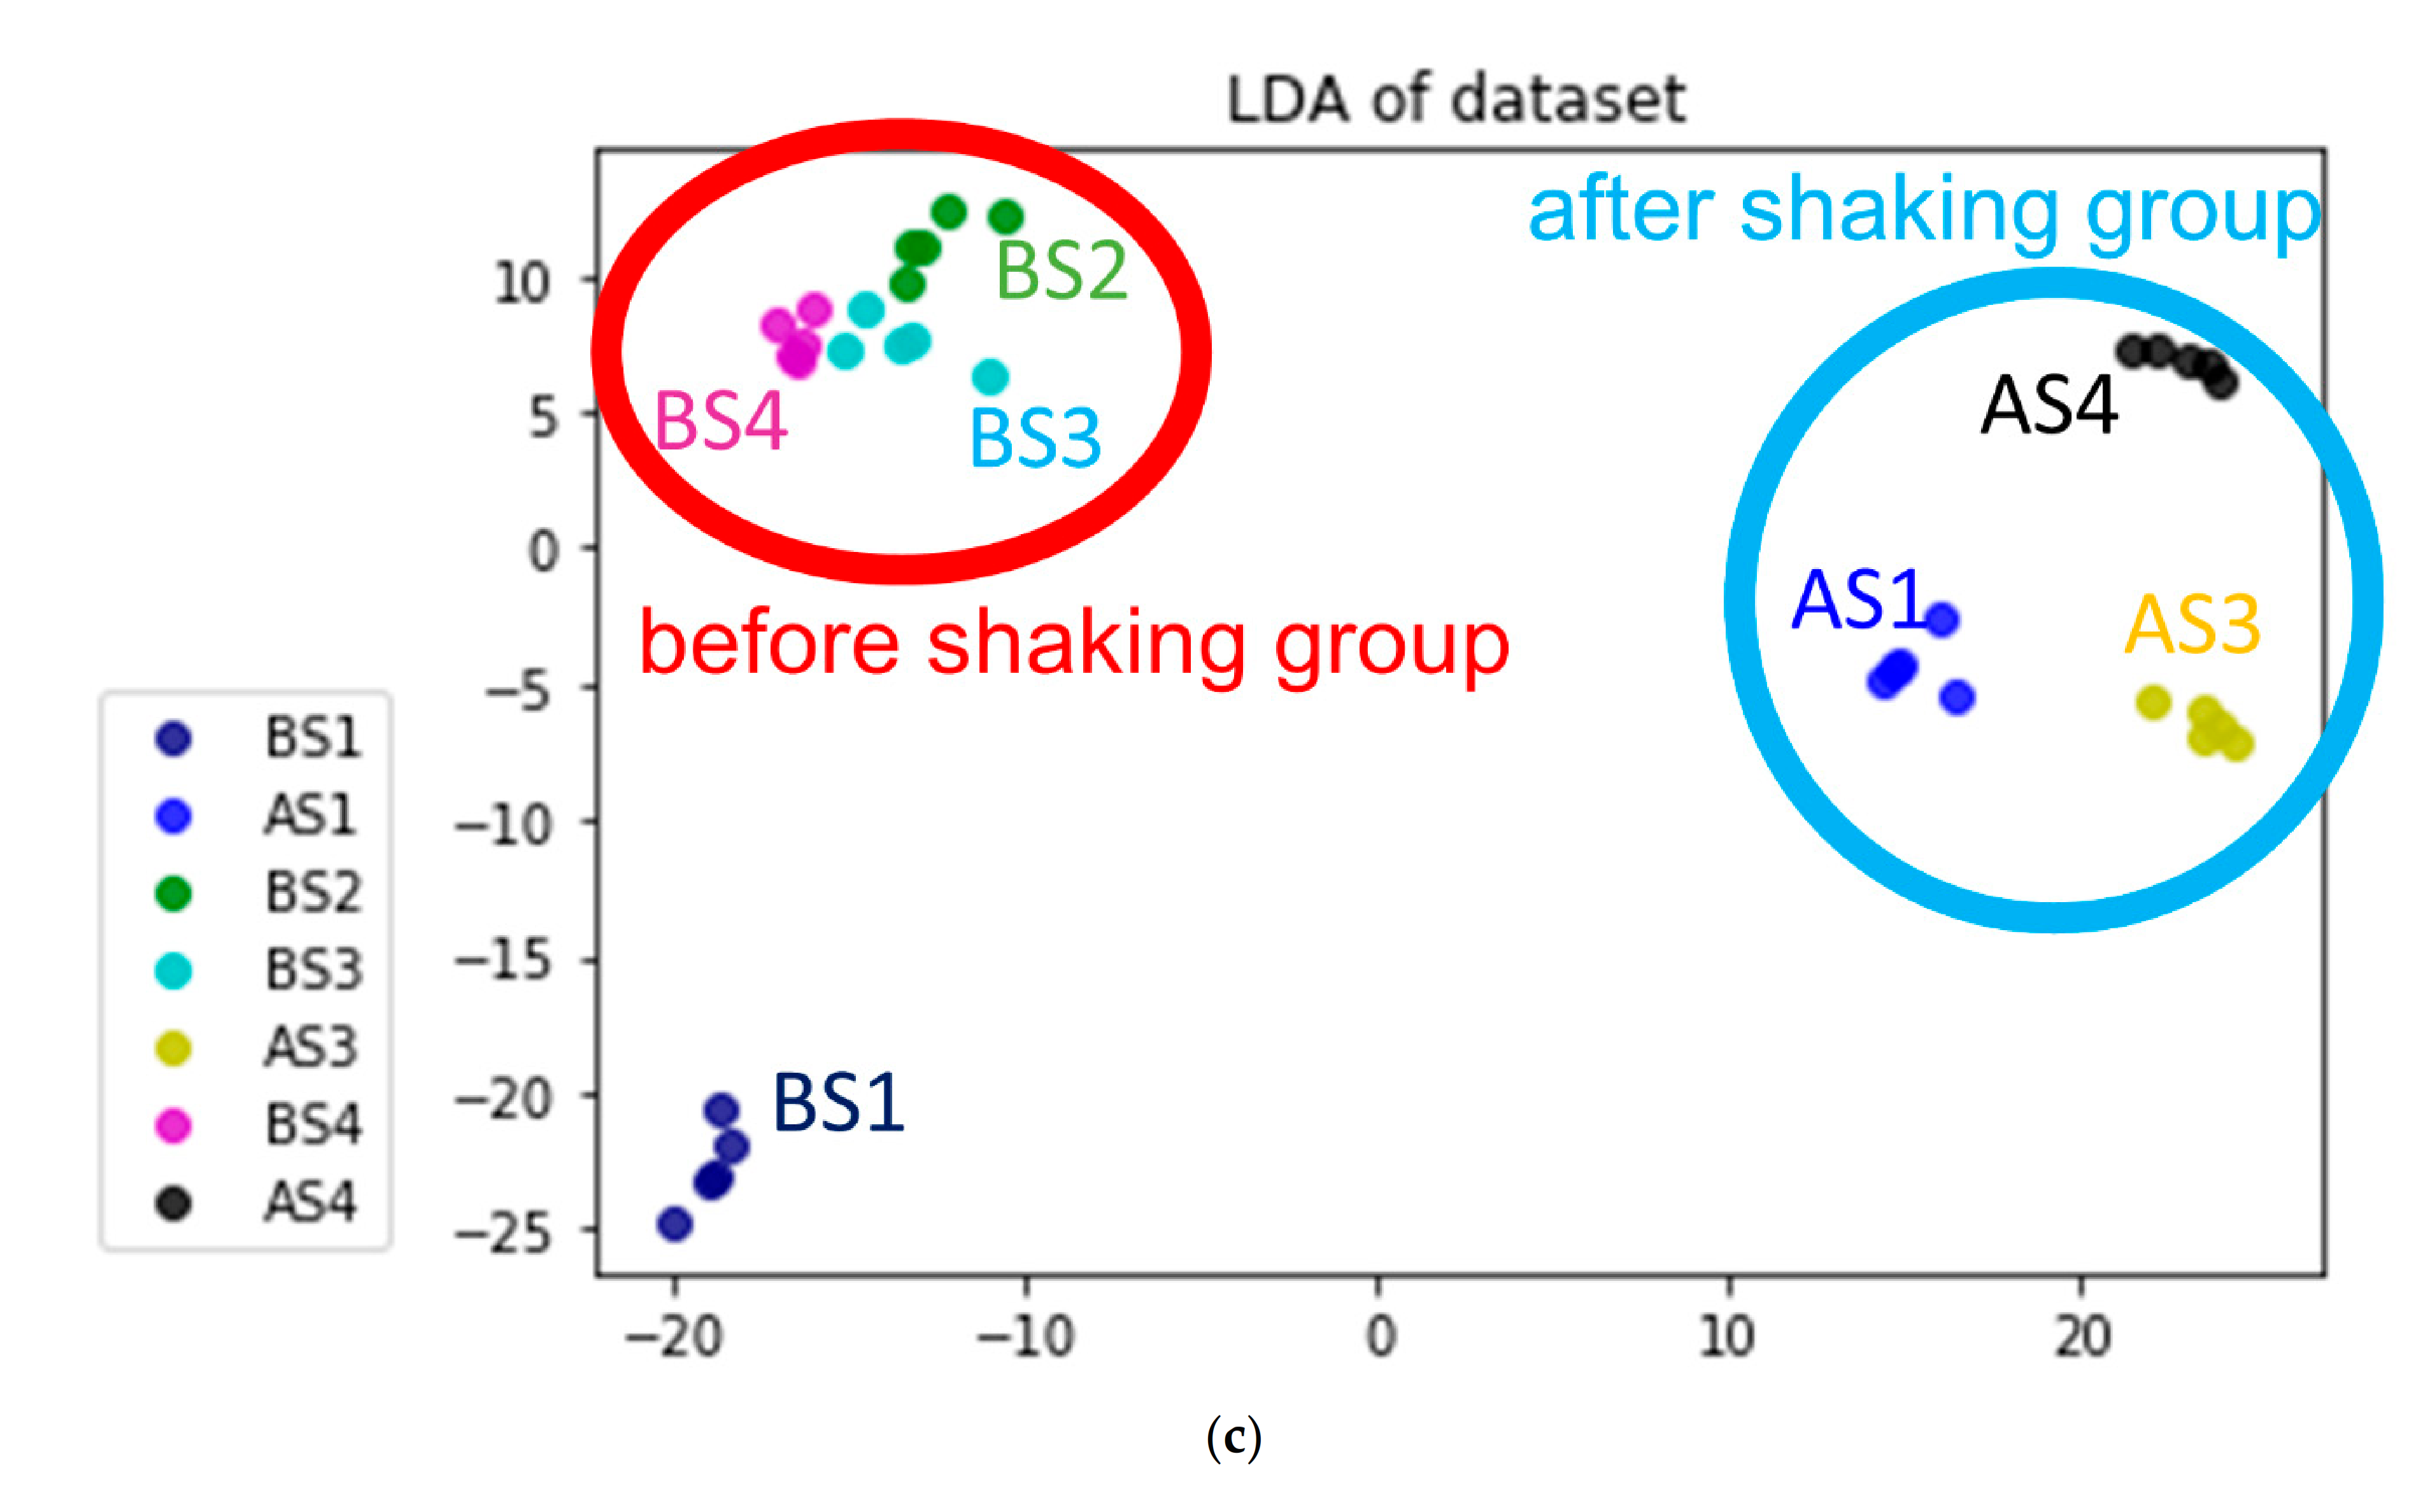
3.3. Result
4. Conclusions
Author Contributions
Funding
Data Availability Statement
Conflicts of Interest
References
- Gonzalez, J.; Coggon, P.T.; Sanoerson, G. A Research Note Biochemistry of tea fermentation: Formation of t-2-hexenal from linolenic acid. J. Food Sci. 1972, 37, 797–798. [Google Scholar] [CrossRef]
- Tanaka, T.; Kouno, I. Oxidation of tea catechins: Chemical structures and reaction mechanism. Food Sci. Technol. Res. 2003, 9, 128–133. [Google Scholar] [CrossRef] [Green Version]
- Wang, Y.; Li, Q.; Wang, Q.; Li, Y.; Ling, J.; Liu, L.; Chen, X.; Bi, K. Simultaneous determination of seven bioactive components in Oolong tea Camellia sinensis: Quality control by chemical composition and HPLC fingerprints. J. Agric. Food Chem. 2012, 60, 256–260. [Google Scholar] [CrossRef] [PubMed]
- Hirose, S.; Tomatsu, K.; Yanase, E. Isolation of key intermediates during formation of oolongtheanins. Tetrahedron Lett. 2013, 54, 7040–7043. [Google Scholar] [CrossRef]
- Menet, M.-C.; Sang, S.; Yang, C.S.; Ho, C.-T.; Rosen, R.T. Analysis of theaflavins and thearubigins from black tea extract by MALDI-TOF mass spectrometry. J. Agric. Food Chem. 2004, 52, 2455–2461. [Google Scholar] [CrossRef] [PubMed]
- Kobayashi, A.; Tachiyama, K.; Kawakami, M.; Yamanishi, T.; Juan, I.-M.; Chiu, W.-F. Effects of solar-withering and turn over treatment during indoor-withering on the formation of pouchong tea aroma. Agric. Biol. Chem. 1985, 49, 1655–1660. [Google Scholar]
- Tsay, J.; Chang, W.-C. Effects of agitation on tea flush during withering process of Paochong tea. In Proceedings of the 2001 International Conference on OCHA (Tea) Culture and Science, Shizuoka City, Japan, 5–8 October 2001; p. 98e100. [Google Scholar]
- Subramanian, N.; Venkatesh, P.; Ganguli, S.; Sinkar, V.P. Role of polyphenol oxidase and peroxidase in the generation of black tea theaflavins. J. Agric. Food Chem. 1999, 47, 2571–2578. [Google Scholar] [CrossRef]
- Lin, S.-Y.; Lo, L.-C.; Chen, I.-Z.; Chen, P.-A. Effect of shaking process on correlations between catechins and volatiles in oolong tea. J. Food Drug Anal. 2016, 24, 500–507. [Google Scholar] [CrossRef] [Green Version]
- Berna, A. Metal oxide sensors for electronic noses and their application to food analysis. Sensors 2010, 10, 3882–3910. [Google Scholar] [CrossRef] [Green Version]
- Dutta, R.; Hines, E.; Gardner, J.; Kashwan, K.; Bhuyan, M. Tea quality prediction using a tin oxide-based electronic nose: An artificial intelligence approach. Sens. Actuators B Chem. 2003, 94, 228–237. [Google Scholar] [CrossRef]
- Yin, X.-T.; Li, J.; Dastan, D.; Zhou, W.-D.; Garmestani, H.; Alamgir, F.M. Ultra-High Selectivity of H2 over CO with a pn Nanojunction based Gas Sensors and its mechanism. Sens. Actuators B Chem. 2020, 319, 128330. [Google Scholar] [CrossRef]
- Zhou, W.-D.; Dastan, D.; Yin, X.-T.; Nie, S.; Wu, S.; Wang, Q.; Li, J. Optimization of gas sensing properties of n-SnO2/p-x CuO sensors for homogenous gases and the sensing mechanism. J. Mater. Sci. Mater. Electr. 2020, 31, 18412–18426. [Google Scholar] [CrossRef]
- Nie, S.; Dastan, D.; Li, J.; Zhou, W.-D.; Wu, S.-S.; Zhou, Y.-W.; Yin, X.-T. Gas-sensing selectivity of n-ZnO/p-Co3O4 sensors for homogeneous reducing gas. J. Phys. Chem. Solids 2021, 150, 109864. [Google Scholar] [CrossRef]
- Shan, K.; Yi, Z.-Z.; Yin, X.-T.; Cui, L.; Dastan, D.; Garmestani, H.; Alamgir, F.M. Diffusion kinetics mechanism of oxygen ion in dense diffusion barrier limiting current oxygen sensors. J. Alloys Compd. 2021, 855, 157465. [Google Scholar] [CrossRef]
- Shan, K.; Yi, Z.-Z.; Yin, X.-T.; Dastan, D.; Dadkhah, S.; Coates, B.T.; Garmestani, H. Mixed conductivities of A-site deficient Y, Cr-doubly doped SrTiO3 as novel dense diffusion barrier and temperature-independent limiting current oxygen sensors. Adv. Powder Technol. 2020. [Google Scholar] [CrossRef]
- Yin, X.-T.; Dastan, D.; Wu, F.-Y.; Li, J. Facile synthesis of SnO2/LaFeO3−XNX composite: Photocatalytic activity and gas sensing performance. Nanomaterials 2019, 9, 1163. [Google Scholar] [CrossRef] [Green Version]
- Zhou, W.-D.; Dastan, D.; Li, J.; Yin, X.-T.; Wang, Q. Discriminable Sensing Response Behavior to Homogeneous Gases Based on n-ZnO/p-NiO Composites. Nanomaterials 2020, 10, 785. [Google Scholar] [CrossRef] [Green Version]
- Yin, X.-T.; Lv, P.; Li, J.; Jafari, A.; Wu, F.-Y.; Wang, Q.; Dastan, D.; Shi, Z.; Yu, S.; Garmestani, H. Nanostructured tungsten trioxide prepared at various growth temperatures for sensing applications. J. Alloys Compd. 2020, 825, 154105. [Google Scholar] [CrossRef]
- Barsan, N.; Weimar, U. Understanding the fundamental principles of metal oxide based gas sensors; the example of CO sensing with SnO2 sensors in the presence of humidity. J. Phys. Condens. Matter 2003, 15, R813. [Google Scholar] [CrossRef]
- Zhang, J.; Qin, Z.; Zeng, D.; Xie, C. Metal-oxide-semiconductor based gas sensors: Screening, preparation, and integration. Phys. Chem. Chem. Phys. 2017, 19, 6313–6329. [Google Scholar] [CrossRef]
- Yin, X.-T.; Zhou, W.-D.; Li, J.; Wang, Q.; Wu, F.-Y.; Dastan, D.; Wang, D.; Garmestani, H.; Wang, X.-M.; Ţălu, Ş. A highly sensitivity and selectivity Pt-SnO2 nanoparticles for sensing applications at extremely low level hydrogen gas detection. J. Alloys Compd. 2019, 805, 229–236. [Google Scholar] [CrossRef]
- Yin, X.-T.; Zhou, W.-D.; Li, J.; Lv, P.; Wang, Q.; Wang, D.; Wu, F.-y.; Dastan, D.; Garmestani, H.; Shi, Z. Tin dioxide nanoparticles with high sensitivity and selectivity for gas sensors at sub-ppm level of hydrogen gas detection. J. Mater. Sci. Mater. Electr. 2019, 30, 14687–14694. [Google Scholar] [CrossRef]
- Hsieh, Y.-C.; Yao, D.-J. Intelligent gas-sensing systems and their applications. J. Micromech. Microeng. 2018, 28, 093001. [Google Scholar] [CrossRef]


| Sensor | Target Gas |
|---|---|
| TGS-2600 | Air contaminants (e.g., hydrogen, carbon monoxide, methane, iso-butane, and ethanol, which exist in cigarette smoke) |
| TGS-2602 | Gaseous air concentrations of odorous gases (e.g., hydrogen, ammonia, ethanol) |
| TGS-2603 | Air contaminants (trimethylamine, methyl mercaptan, etc.) |
| TGS-2610-C00 | Butane, liquefied petroleum gas |
| TGS-2611-C00 | Methane |
| TGS-2620 | Alcohol, vapors of organic solvents |
| SB-51-00 | Hydrogen sulfide |
| SB-53-00 | Ammonia |
| SB-AQ1-06 | Volatile Organic Compounds (VOCs) (for air quality control) |
| SB-30-04 | Alcohol |
| SP3S-AQ2 | VOCs (for air quality control) |
| SP-53B-00 | Ammonia |
| Stage | 2nd Shaking | 3rd Shaking | 4th Shaking | Fixation |
|---|---|---|---|---|
| Process | L | L | L | L |
| Variation | smaller | smaller | smaller | smaller |
| TGS2600 | 1.000→0.989 | 1.000→0.968 | 1.000→1.001 | 1.000→0.912 |
| TGS2602 | 1.000→1.017 | 1.000→0.856 | 1.000→0.957 | 1.000→0.808 |
| TGS2603 | 1.000→0.996 | 1.000→0.838 | 1.000→0.957 | 1.000→0.557 |
| TGS2610 | 1.000→0.995 | 1.000→0.976 | 1.000→0.9996 | 1.000→0.914 |
| TGS2611 | 1.000→0.995 | 1.000→0.982 | 1.000→1.001 | 1.000→0.946 |
| TGS2620 | 1.000→0.988 | 1.000→0.963 | 1.000→0.999 | 1.000→0.902 |
| SB-51-00 | 1.000→1.002 | 1.000→1.016 | 1.000→0.999 | 1.000→1.101 |
| SB-53-00 | 1.000→0.999 | 1.000→1.015 | 1.000→1.004 | 1.000→1.084 |
| SB-AQ1-06 | 1.000→1.001 | 1.000→1.010 | 1.000→0.9995 | 1.000→1.056 |
| SB-30-04 | 1.000→1.000 | 1.000→1.034 | 1.000→1.002 | 1.000→1.242 |
| SP3S-AQ2 | 1.000→0.998 | 1.000→0.970 | 1.000→0.995 | 1.000→0.919 |
| SP-53B-00 | 1.000→0.996 | 1.000→0.932 | 1.000→0.987 | 1.000→0.875 |
Publisher’s Note: MDPI stays neutral with regard to jurisdictional claims in published maps and institutional affiliations. |
© 2021 by the authors. Licensee MDPI, Basel, Switzerland. This article is an open access article distributed under the terms and conditions of the Creative Commons Attribution (CC BY) license (http://creativecommons.org/licenses/by/4.0/).
Share and Cite
Tseng, T.-S.; Hsiao, M.-H.; Chen, P.-A.; Lin, S.-Y.; Chiu, S.-W.; Yao, D.-J. Utilization of a Gas-Sensing System to Discriminate Smell and to Monitor Fermentation during the Manufacture of Oolong Tea Leaves. Micromachines 2021, 12, 93. https://0-doi-org.brum.beds.ac.uk/10.3390/mi12010093
Tseng T-S, Hsiao M-H, Chen P-A, Lin S-Y, Chiu S-W, Yao D-J. Utilization of a Gas-Sensing System to Discriminate Smell and to Monitor Fermentation during the Manufacture of Oolong Tea Leaves. Micromachines. 2021; 12(1):93. https://0-doi-org.brum.beds.ac.uk/10.3390/mi12010093
Chicago/Turabian StyleTseng, Ting-Shiang, Mei-Hui Hsiao, Po-An Chen, Shu-Yen Lin, Shih-Wen Chiu, and Da-Jeng Yao. 2021. "Utilization of a Gas-Sensing System to Discriminate Smell and to Monitor Fermentation during the Manufacture of Oolong Tea Leaves" Micromachines 12, no. 1: 93. https://0-doi-org.brum.beds.ac.uk/10.3390/mi12010093