Arpp19 Promotes Myc and Cip2a Expression and Associates with Patient Relapse in Acute Myeloid Leukemia


Abstract
:
1. Background
2. Materials and Methods
2.1. Patient Cohorts
2.2. Statistical Analysis
2.3. RNA Isolation and cDNA Synthesis
2.4. Quantitative Real-Time PCR (RQ-PCR)
2.5. Cell Culture
2.6. Antibodies
2.7. Western Blot Assay
2.8. siRNAs, shRNAs and Cell Viability Assay
3. Results
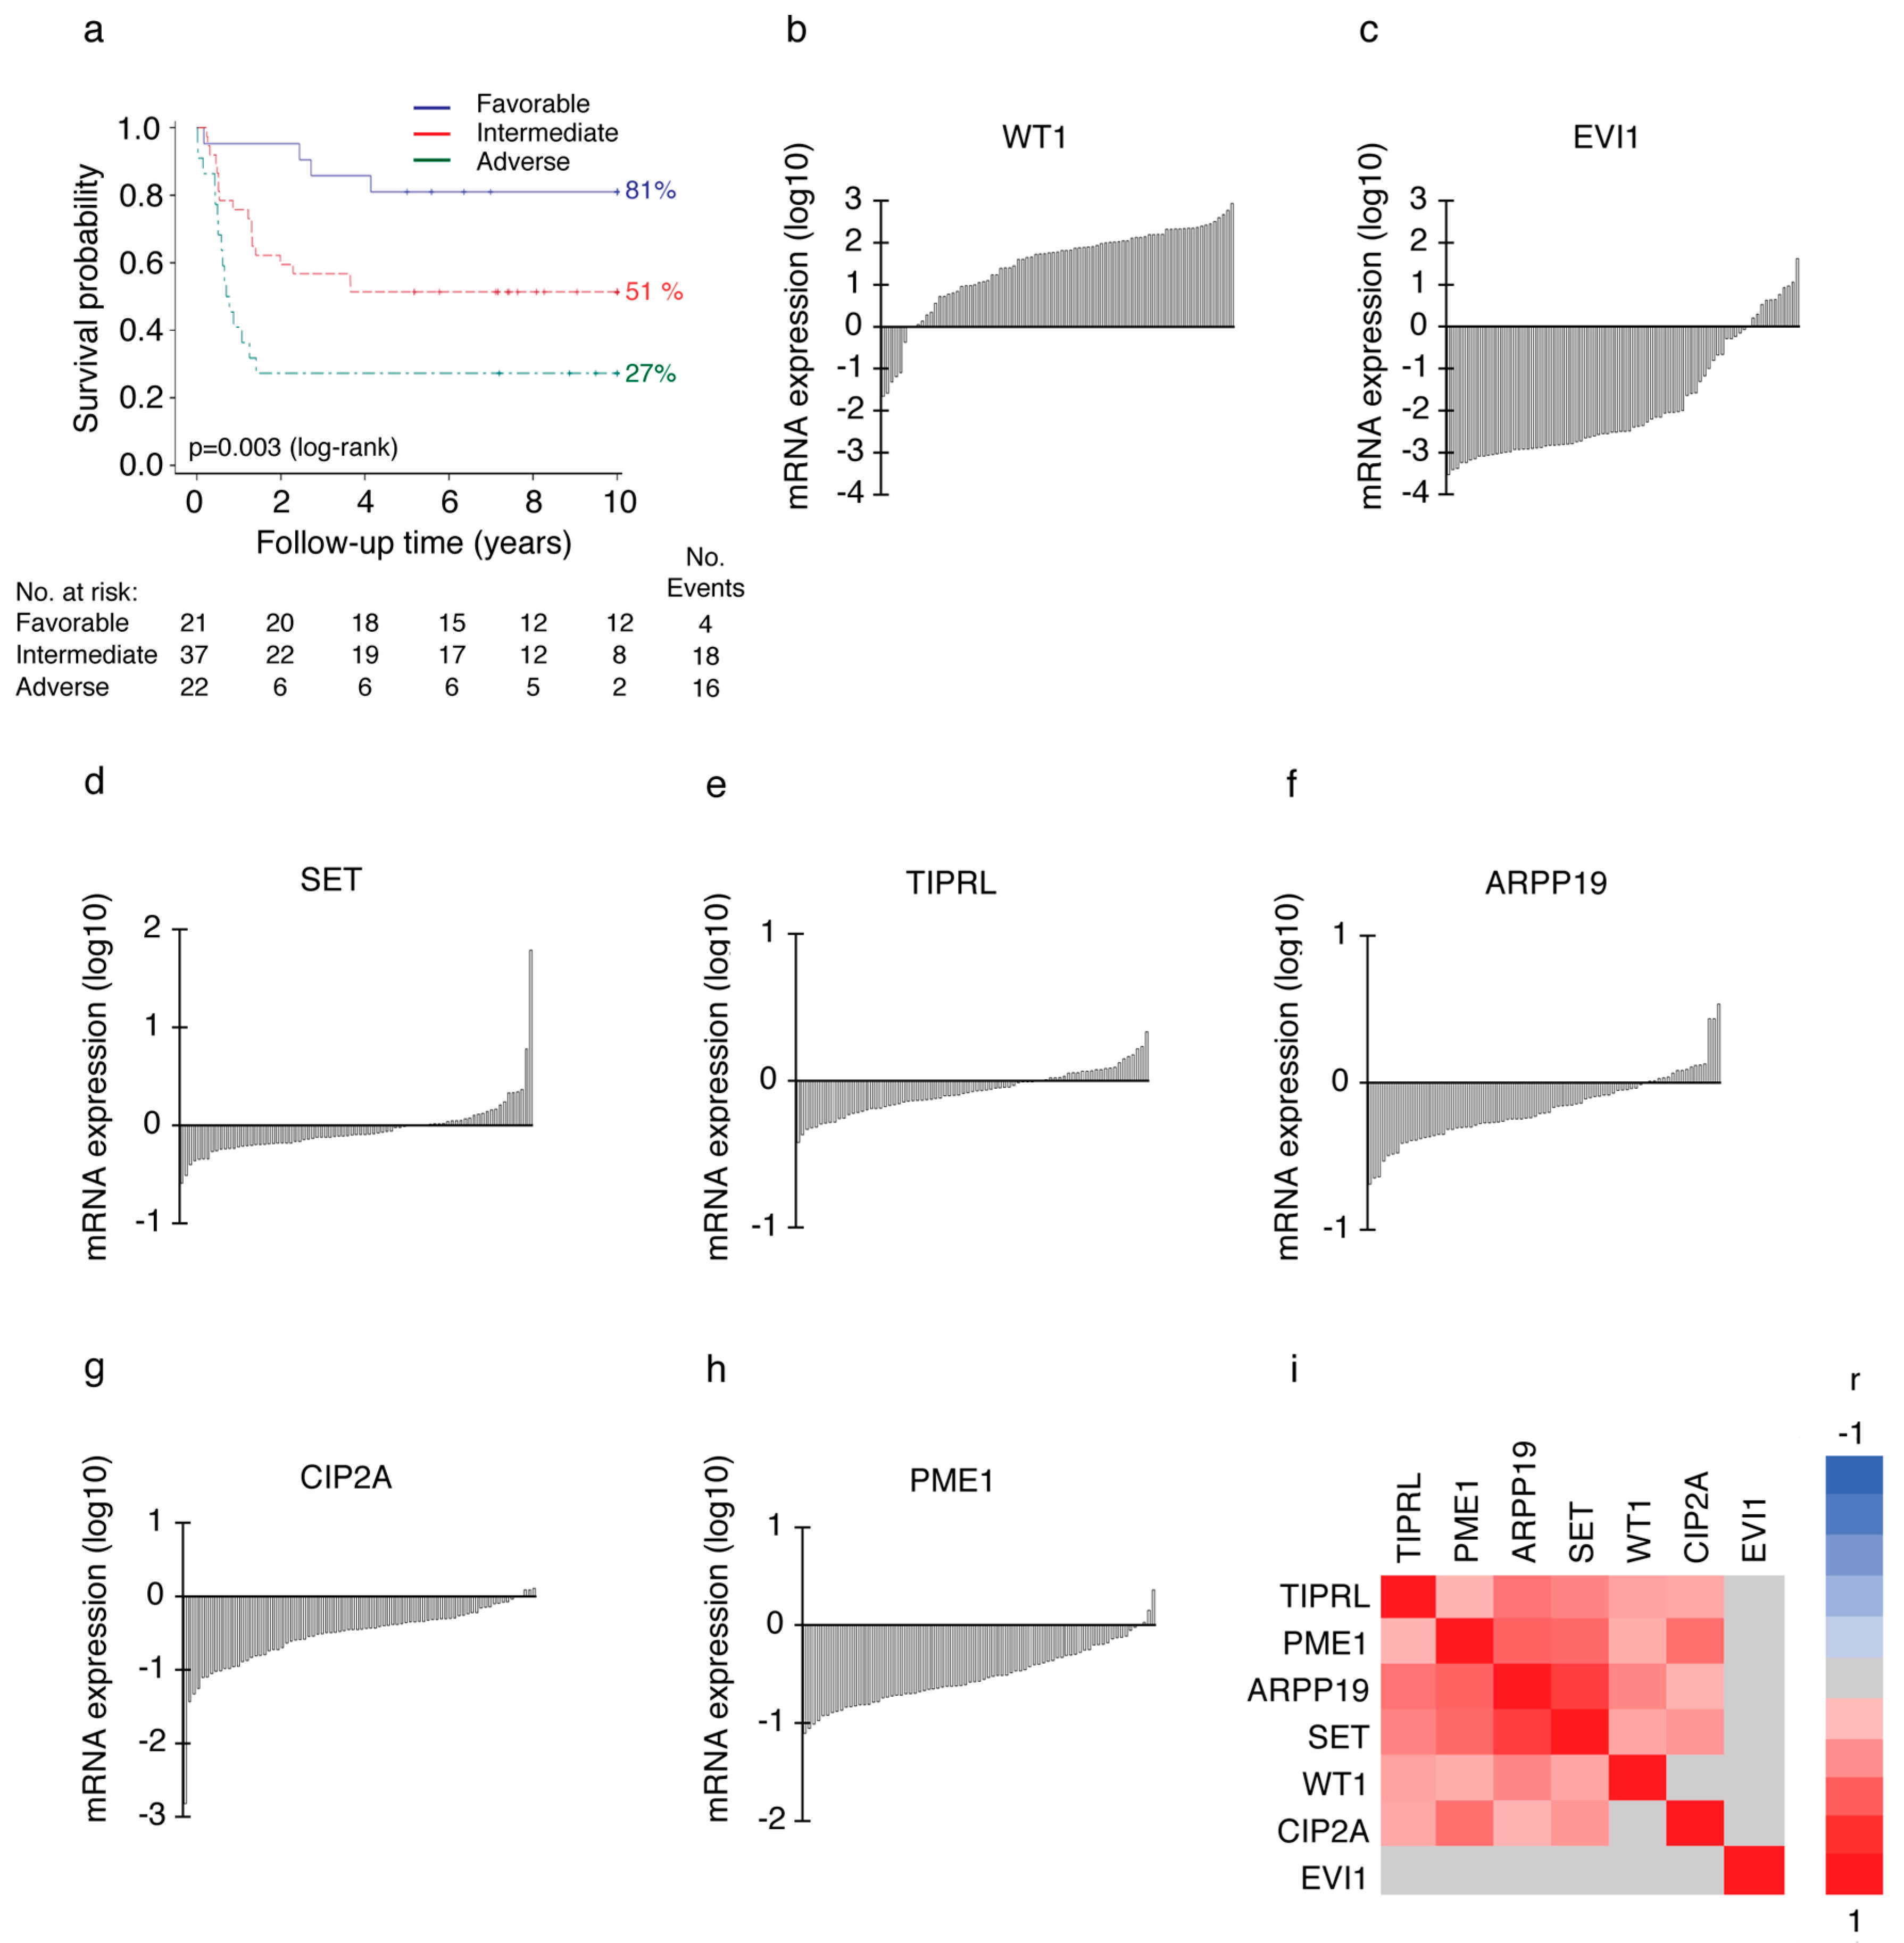
3.1. PP2A Inhibitor Protein mRNA Expression in AML Patient Cohort
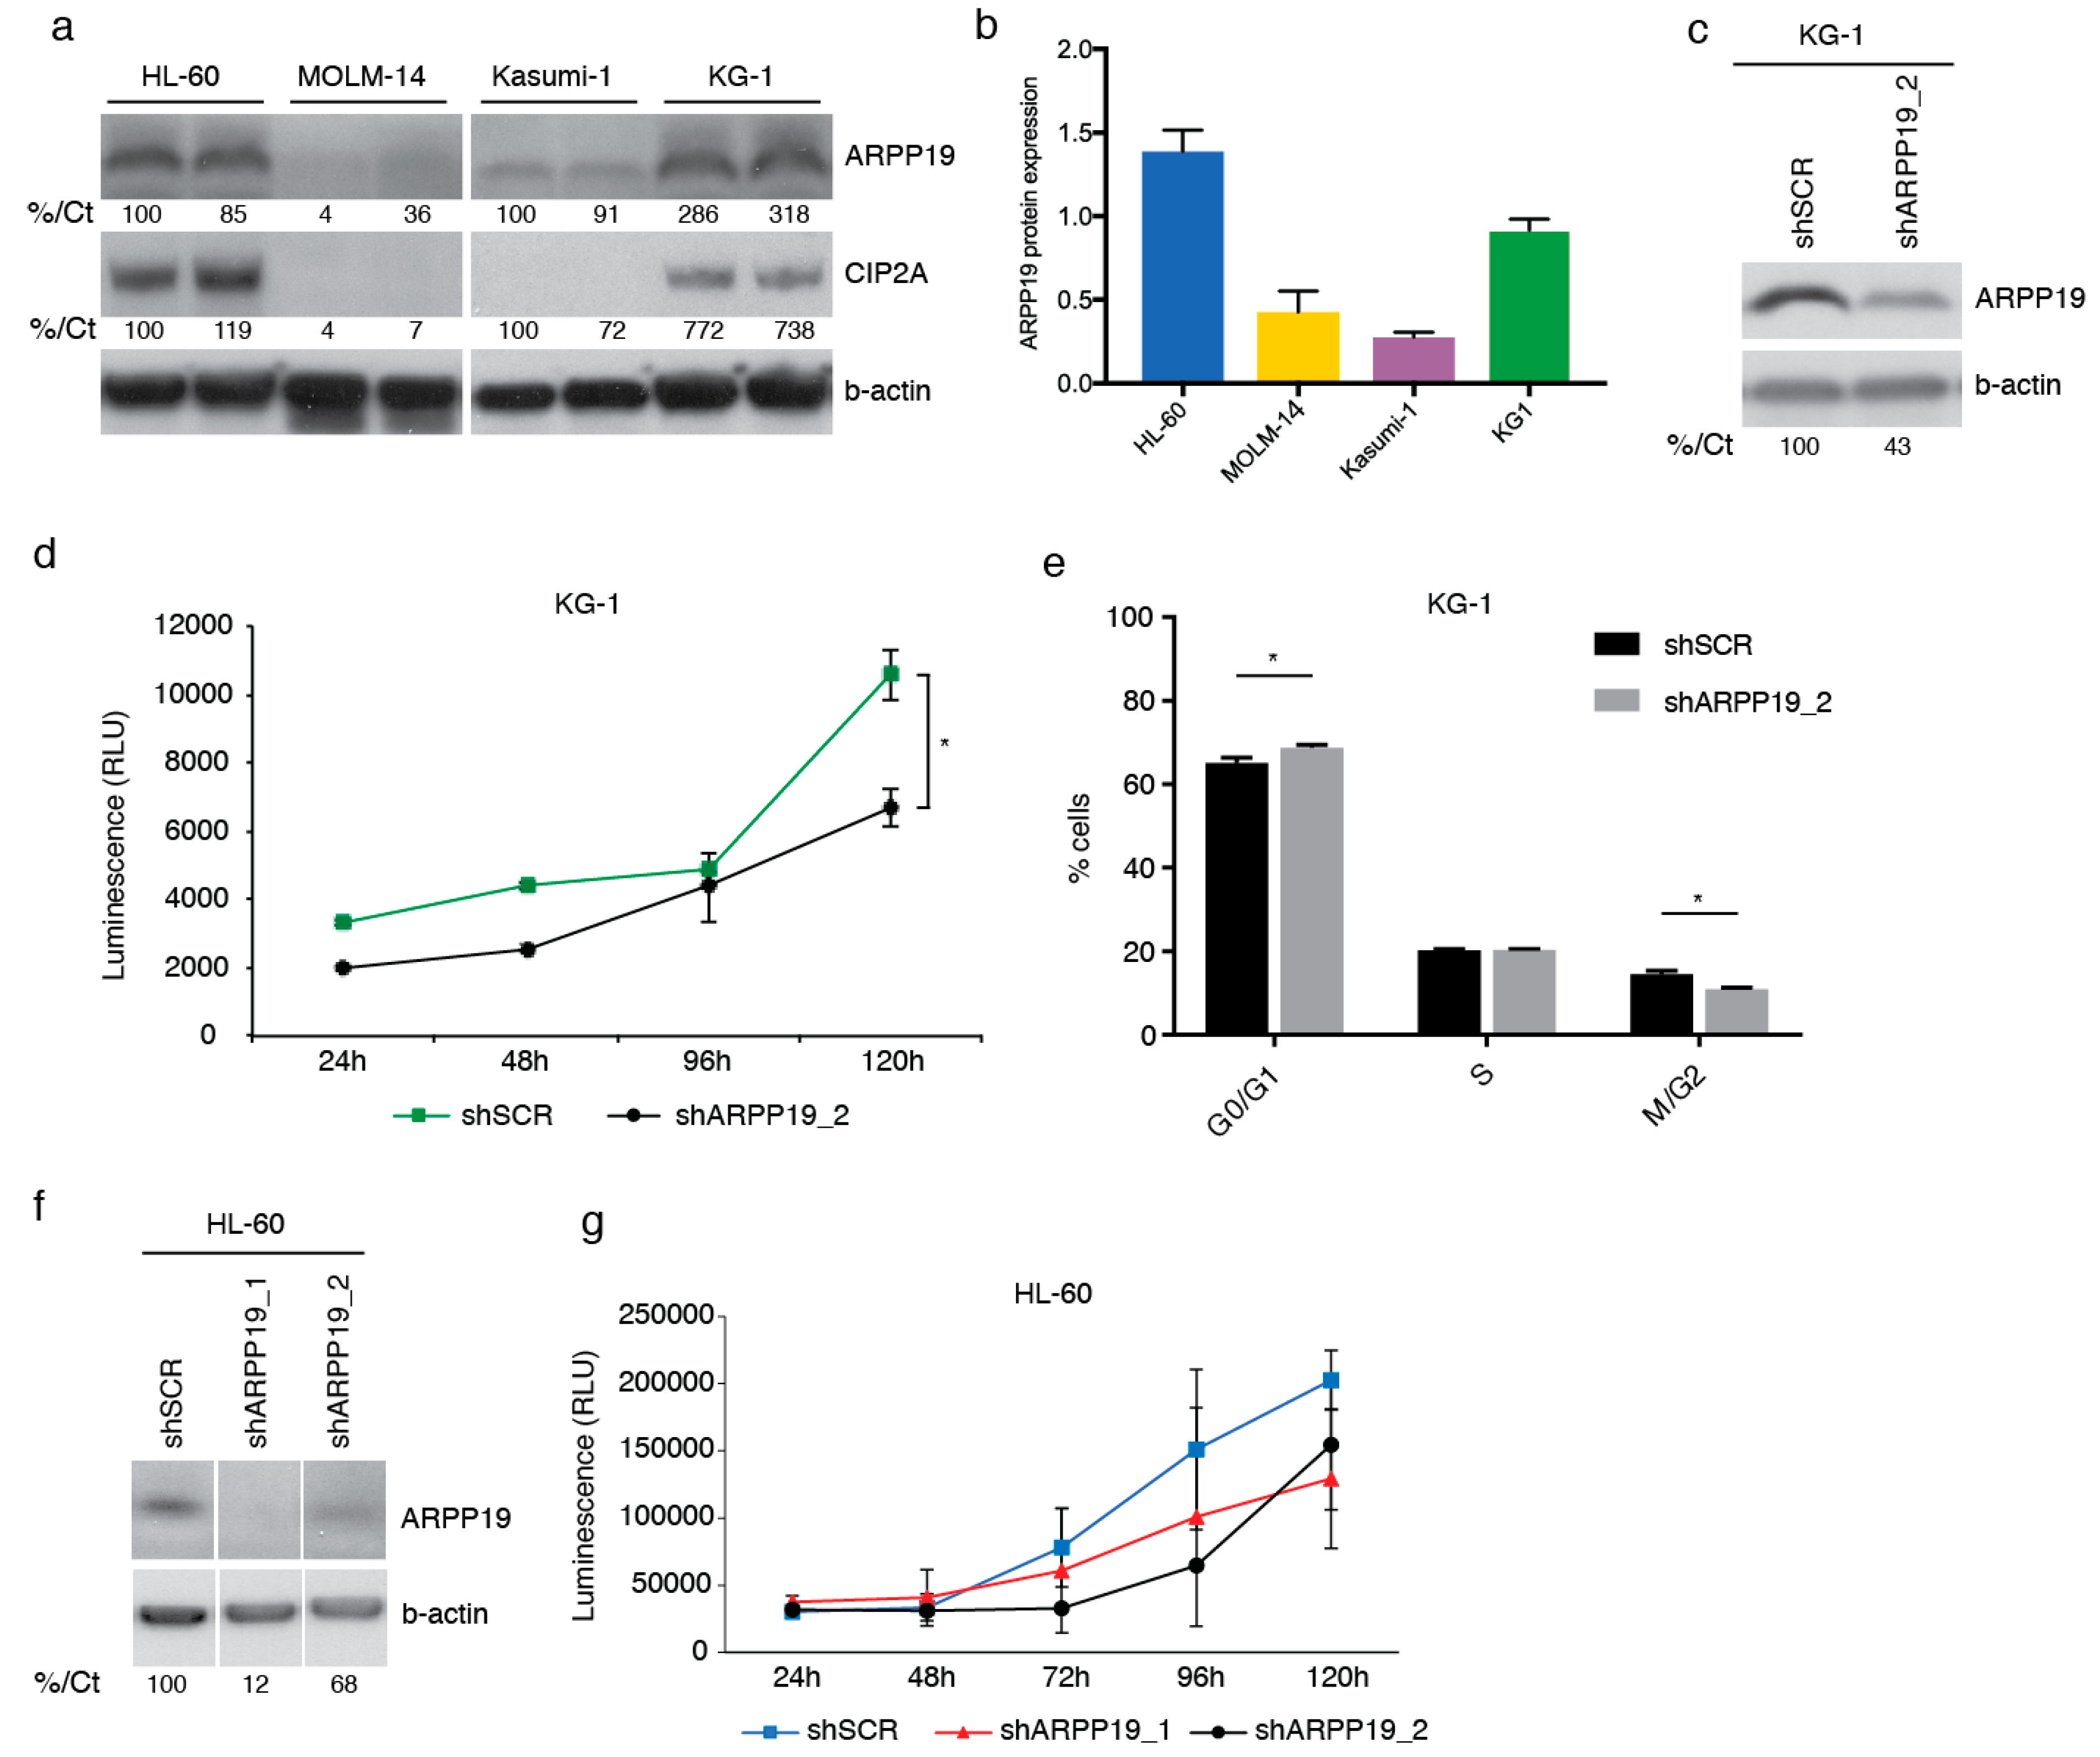
3.2. ARPP19 Expression Promotes AML Cell Survival
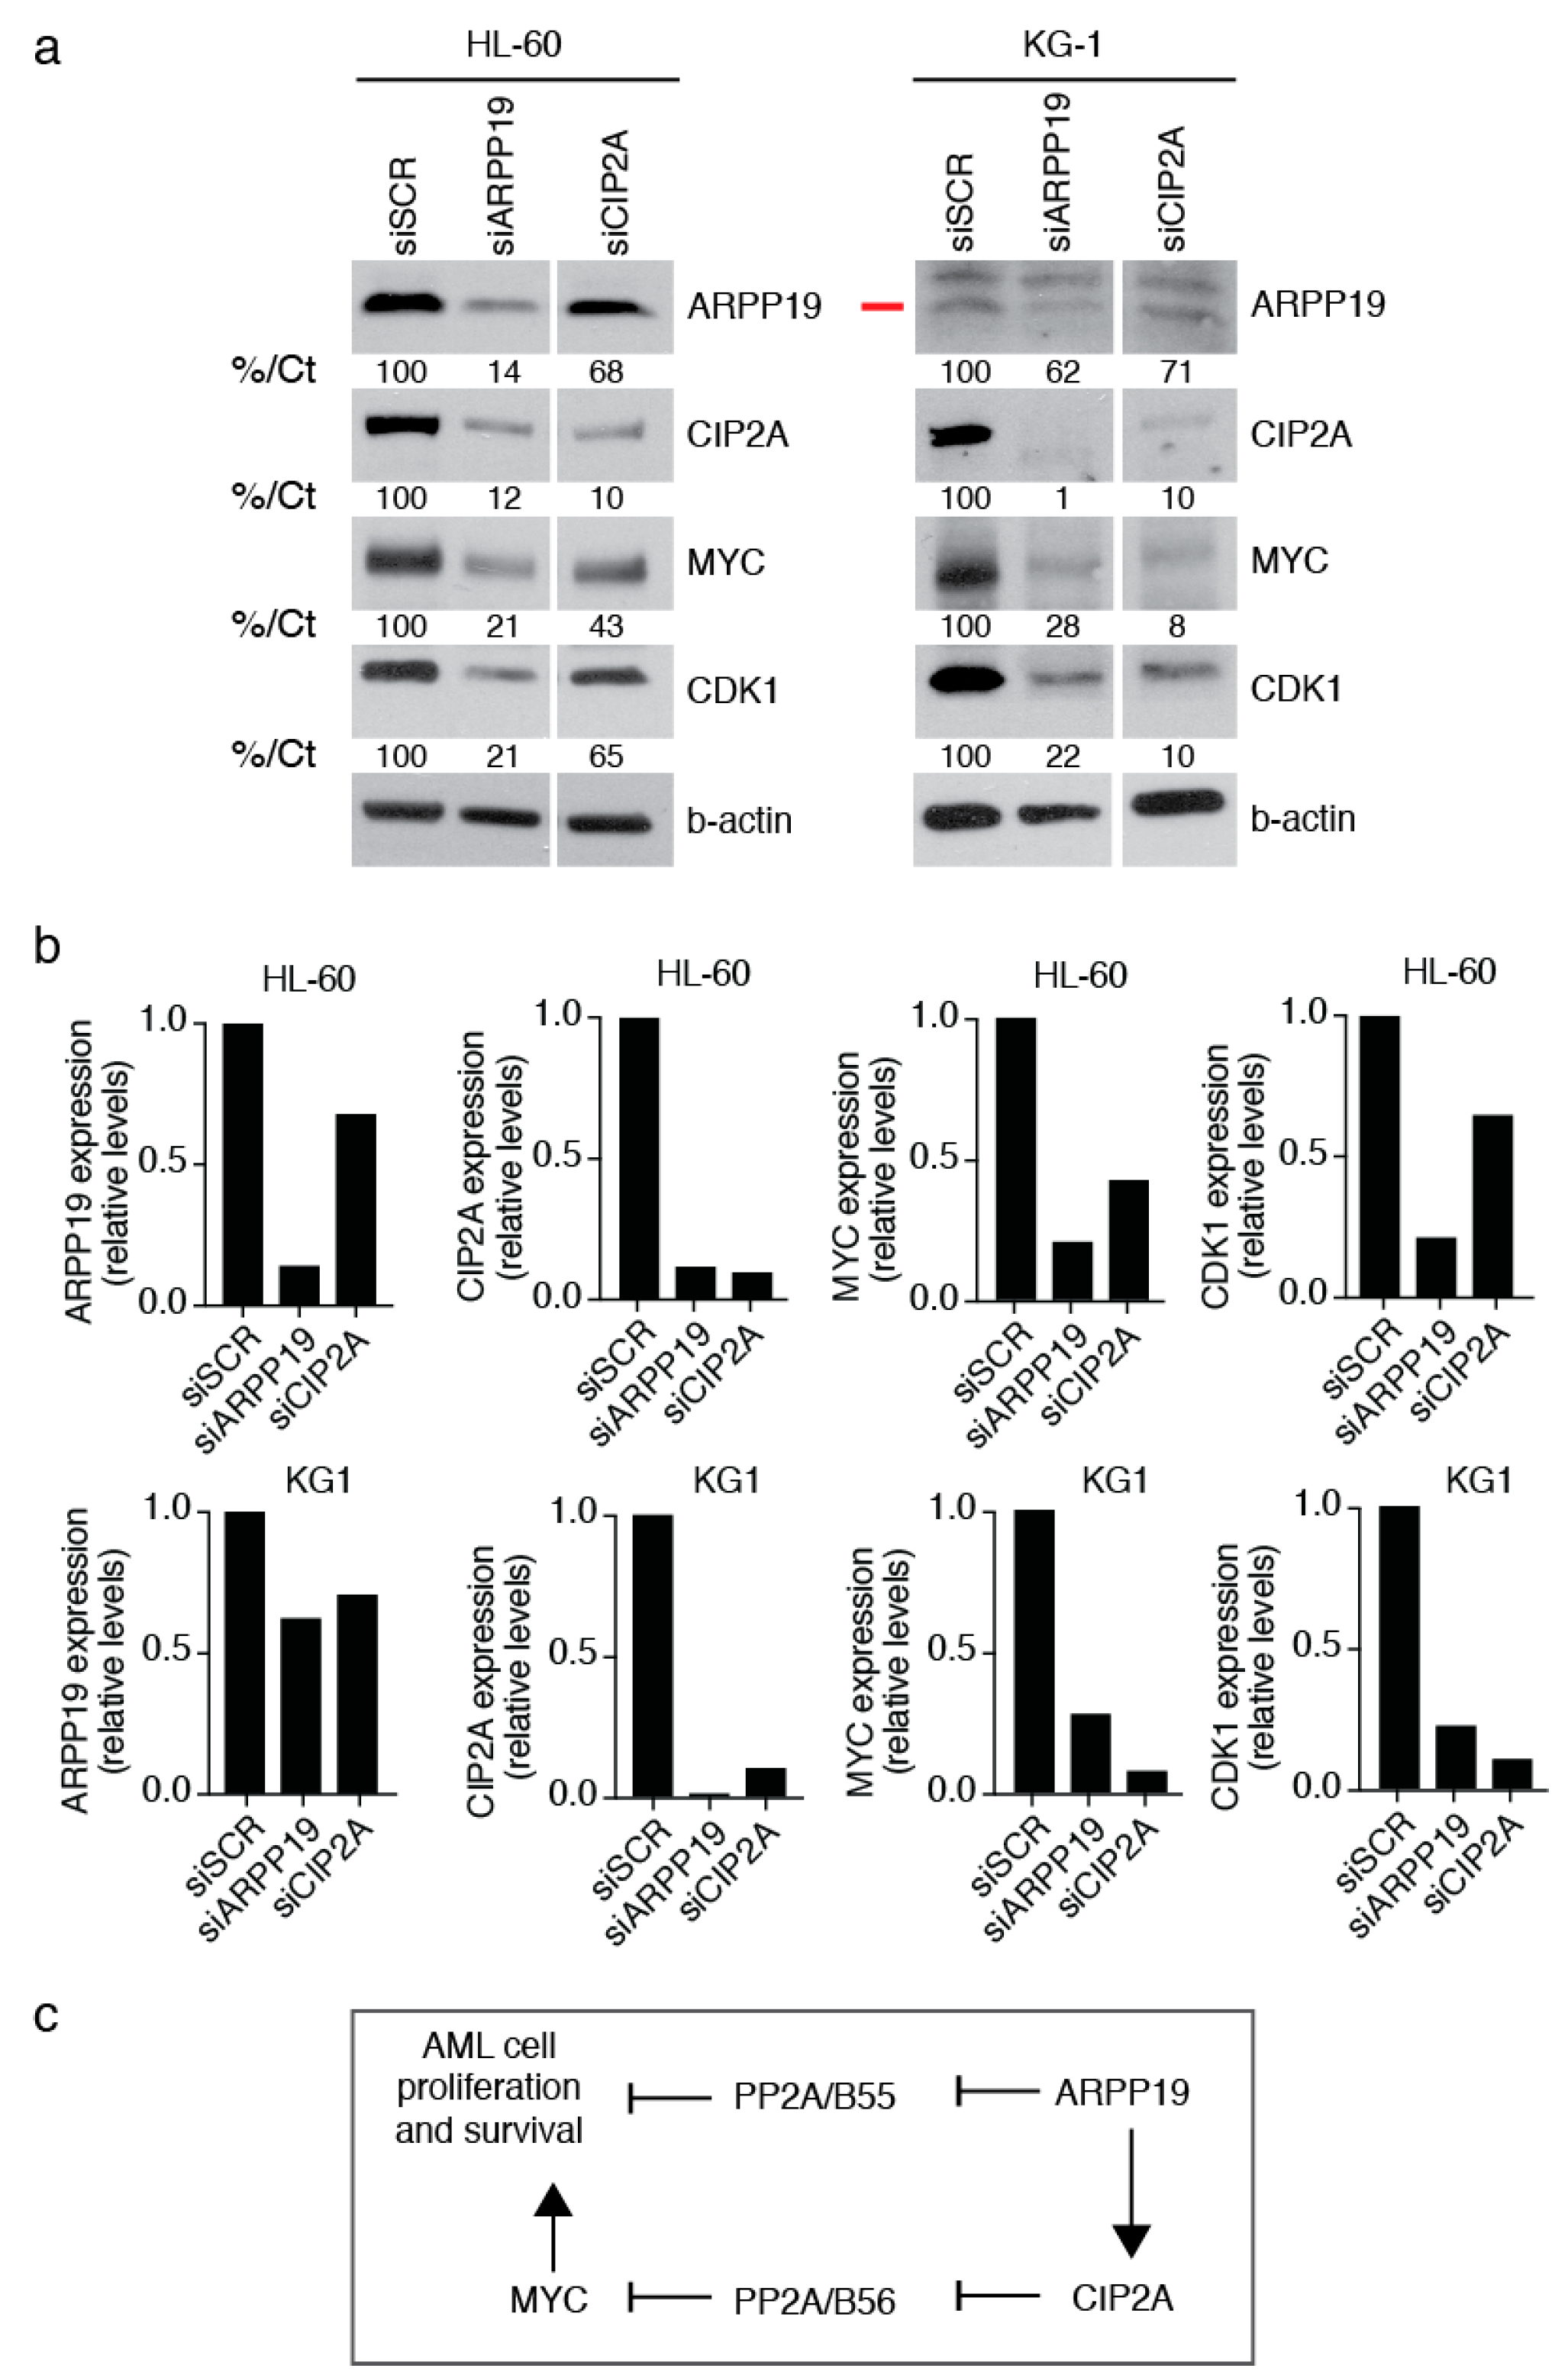
3.3. ARPP19 Promotes Expression of Oncogenic Drivers MYC, CDK1 and CIP2A in AML Cells
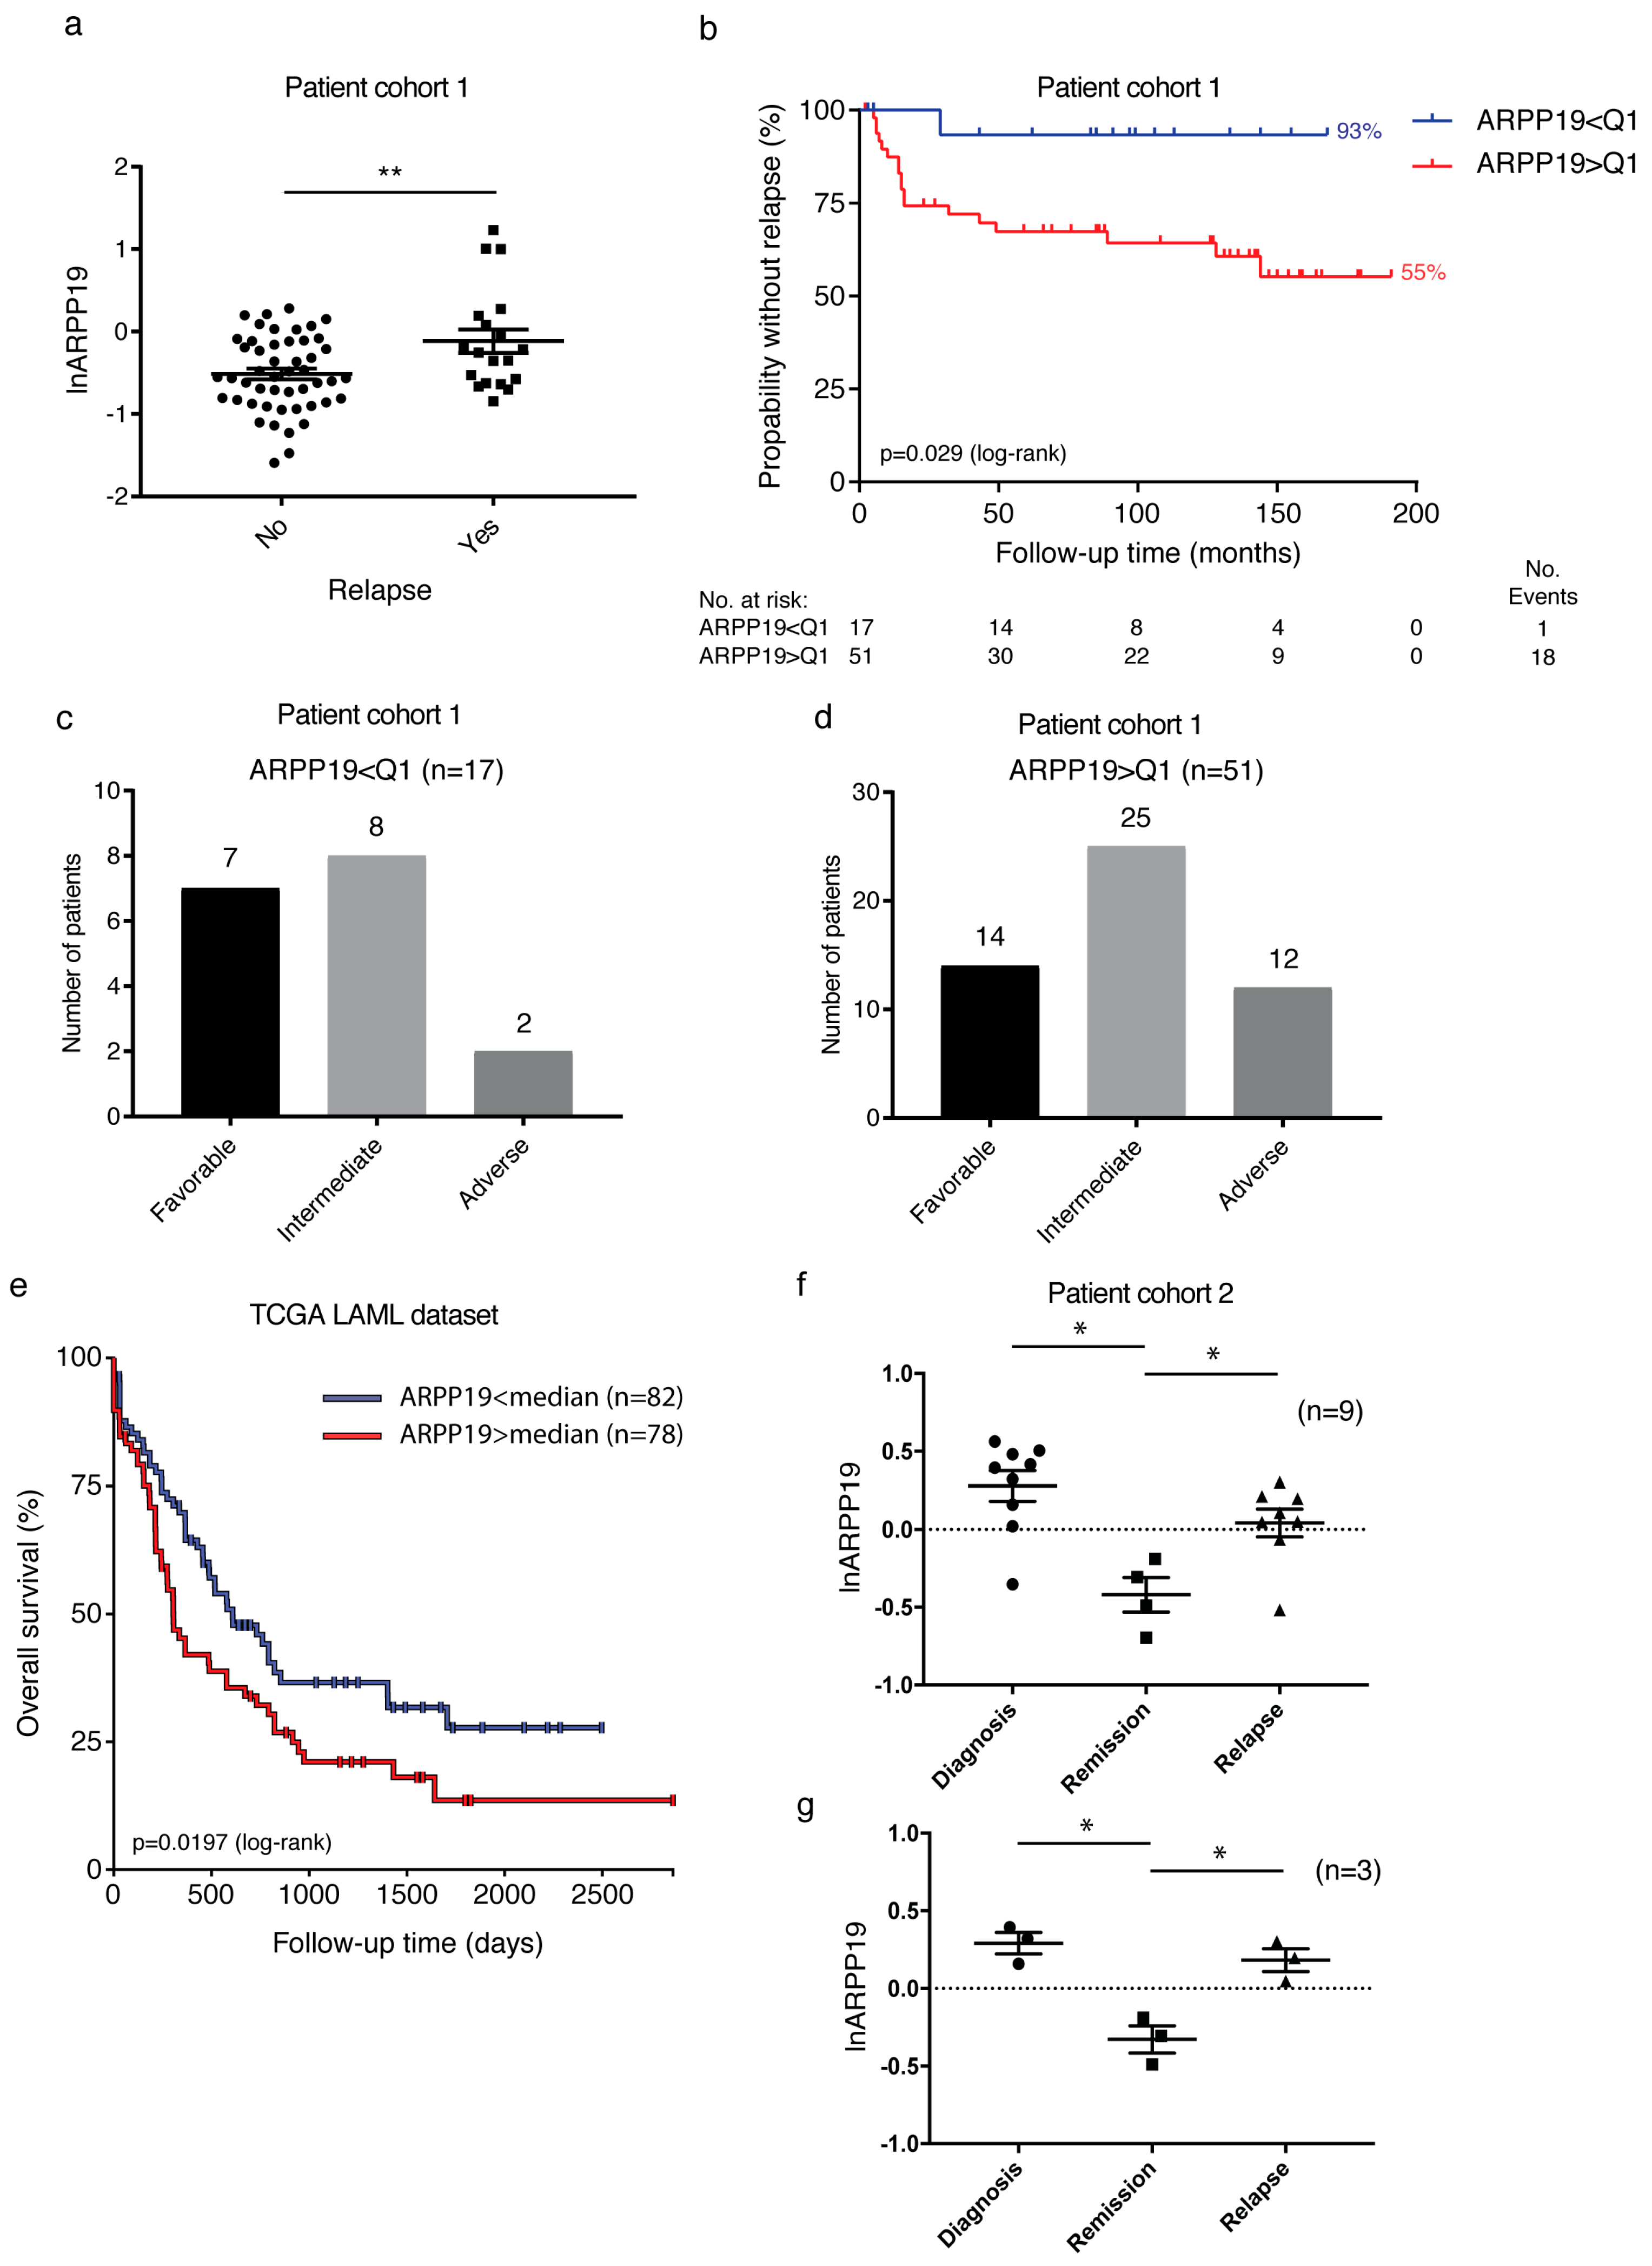
3.4. Low ARPP19 mRNA Expression is an Independent Predictive Relapse Marker
3.5. Uni- and Multivariable Analyses
3.6. Survival Analysis Based on PP2A Inhibitor Protein mRNA Expression in AML Patients
3.7. ARPP19 Expression Correlates with AML Disease Activity after Remission
4. Discussion
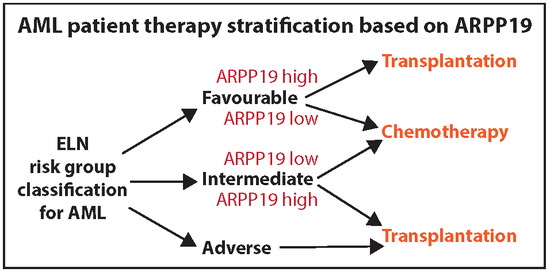
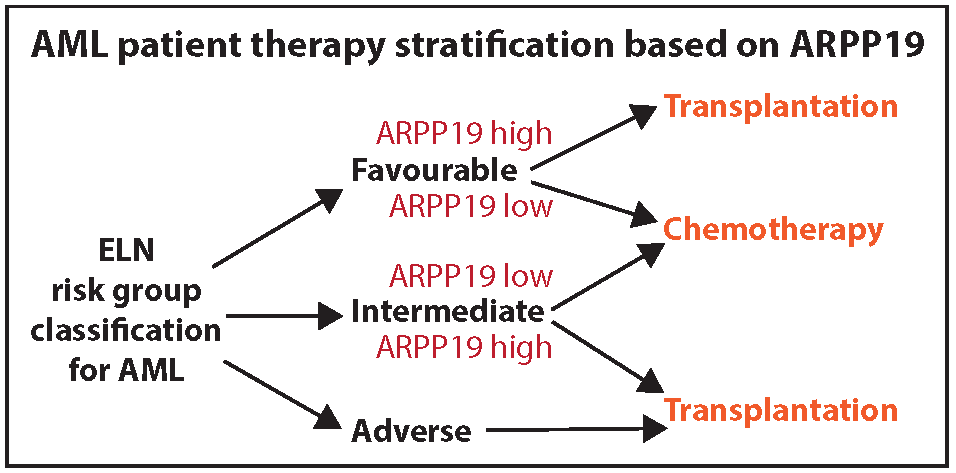
5. Conclusions
6. Patents
Supplementary Materials
Author Contributions
Funding
Acknowledgments
Conflicts of Interest
Abbreviations
| AML | acute myeloid leukemia |
| ARPP19 | cAMP-regulated phosphoprotein 19 |
| HSCT | hematopoietic stem cell transplantation |
| PAIP | PP2A inhibitor protein |
| PP2A | protein phosphatase 2A |
| RQ-PCR | real-time quantitative PCR |
References
- Döhner, H.; Weisdorf, D.J.; Bloomfield, C.D. Acute Myeloid Leukemia. N. Engl. J. Med. 2015, 373, 1136–1152. [Google Scholar] [CrossRef] [PubMed]
- Petersdorf, S.H.; Kopecky, K.J.; Slovak, M.; Willman, C.; Nevill, T.; Brandwein, J.; Larson, R.A.; Erba, H.P.; Stiff, P.J.; Stuart, R.K.; et al. A phase 3 study of gemtuzumab ozogamicin during induction and postconsolidation therapy in younger patients with acute myeloid leukemia. Blood 2013, 121, 4854–4860. [Google Scholar] [CrossRef] [PubMed]
- Papaemmanuil, E.; Gerstung, M.; Bullinger, L.; Gaidzik, V.I.; Paschka, P.; Roberts, N.D.; Potter, N.E.; Heuser, M.; Thol, F.; Bolli, N.; et al. Genomic Classification and Prognosis in Acute Myeloid Leukemia. NEJM 2016, 374, 2209–2221. [Google Scholar] [CrossRef] [PubMed]
- Walter, R.B.; Othus, M.; Burnett, A.K.; Löwenberg, B.; Kantarjian, H.M.; Ossenkoppele, G.J.; Hills, R.K.; Ravandi, F.; Pabst, T.; Evans, A.; et al. Resistance prediction in AML: Analysis of 4601 patients from MRC/NCRI, HOVON/SAKK, SWOG and MD Anderson Cancer Center. Leukemia 2015, 29, 312–320. [Google Scholar] [CrossRef] [PubMed]
- Parkin, B.; Ouillette, P.; Yildiz, M.; Saiya-Cork, K.; Shedden, K.; Malek, S.N. Integrated genomic profiling, therapy response, and survival in adult acute myelogenous leukemia. Clin. Cancer Res. 2015, 21, 2045–2056. [Google Scholar] [CrossRef] [PubMed]
- Dohner, H.; Estey, E.; Grimwade, D.; Amadori, S.; Appelbaum, F.R.; Buchner, T.; Dombret, H.; Ebert, B.L.; Fenaux, P.; Larson, R.A.; et al. Diagnosis and management of AML in adults: 2017 ELN recommendations from an international expert panel. Blood 2017, 129, 424–447. [Google Scholar] [CrossRef] [PubMed]
- Meeusen, B.; Janssens, V. Tumor suppressive protein phosphatases in human cancer: Emerging targets for therapeutic intervention and tumor stratification. Int. J. Biochem. Cell Biol. 2018, 96, 98–134. [Google Scholar] [CrossRef] [PubMed]
- Perrotti, D.; Neviani, P. Protein phosphatase 2A: A target for anticancer therapy. Lancet oncol. 2013, 14, e229–e238. [Google Scholar] [CrossRef]
- Kauko, O.; Westermarck, J. Non-genomic mechanisms of protein phosphatase 2A (PP2A) regulation in cancer. Int. J. Biochem. Cell Biol. 2018, 96, 157–164. [Google Scholar] [CrossRef] [PubMed]
- Arriazu, E.; Pippa, R.; Odero, M.D. Protein Phosphatase 2A as a Therapeutic Target in Acute Myeloid Leukemia. Front. Oncol. 2016, 6, 78. [Google Scholar] [CrossRef] [PubMed]
- Gharbi-Ayachi, A.; Labbe, J.C.; Burgess, A.; Vigneron, S.; Strub, J.M.; Brioudes, E.; Van-Dorsselaer, A.; Castro, A.; Lorca, T. The substrate of Greatwall kinase, Arpp19, controls mitosis by inhibiting protein phosphatase 2A. Science 2010, 330, 1673–1677. [Google Scholar] [CrossRef] [PubMed]
- Jiang, T.; Zhao, B.; Li, X.; Wan, J. ARPP-19 promotes proliferation and metastasis of human glioma. Neuroreport 2016, 27, 960–966. [Google Scholar] [CrossRef] [PubMed]
- Song, H.; Pan, J.; Liu, Y.; Wen, H.; Wang, L.; Cui, J.; Hu, B.; Yao, Z.; Ji, G. Increased ARPP-19 expression is associated with hepatocellular carcinoma. Int. J. Mol. Sci. 2014, 16, 178–192. [Google Scholar] [CrossRef] [PubMed]
- Ujj, Z.; Buglyó, G.; Udvardy, M.; Beyer, D.; Vargha, G.; Biró, S.; Rejtő, L. WT1 Expression in Adult Acute Myeloid Leukemia: Assessing its Presence, Magnitude and Temporal Changes as Prognostic Factors. Pathol. Oncol. Res. 2016, 22, 217–221. [Google Scholar] [CrossRef] [PubMed]
- Hinai, A.A.; Valk, P.J. Review: Aberrant EVI1 expression in acute myeloid leukaemia. Br. J. Haematol. 2016, 172, 870–878. [Google Scholar] [CrossRef] [PubMed]
- Cristóbal, I.; Garcia-Orti, L.; Cirauqui, C.; Cortes-Lavaud, X.; García-Sánchez, M.A.; Calasanz, M.J.; Odero, M.D. Overexpression of SET is a recurrent event associated with poor outcome and contributes to protein phosphatase 2A inhibition in acute myeloid leukemia. Haematologica 2012, 97, 543–550. [Google Scholar] [CrossRef] [PubMed]
- Agarwal, A.; MacKenzie, R.J.; Pippa, R.; Eide, C.A.; Oddo, J.; Tyner, J.W.; Sears, R.; Vitek, M.P.; Odero, M.D.; Christensen, D.J.; et al. Antagonism of SET using OP449 enhances the efficacy of tyrosine kinase inhibitors and overcomes drug resistance in myeloid leukemia. Clin. Cancer Res. 2014, 20, 2092–2103. [Google Scholar] [CrossRef] [PubMed]
- Li, M.; Makkinje, A.; Damuni, Z. The myeloid leukemia-associated protein SET is a potent inhibitor of protein phosphatase 2A. J. Biol. Chem. 1996, 271, 11059–11062. [Google Scholar] [CrossRef] [PubMed]
- Junttila, M.R.; Westermarck, J. Mechanisms of MYC stabilization in human malignancies. Cell Cycle 2008, 7, 592–596. [Google Scholar] [CrossRef] [PubMed]
- Khanna, A.; Pimanda, J.E.; Westermarck, J. Cancerous inhibitor of protein phosphatase 2A, an emerging human oncoprotein and a potential cancer therapy target. Cancer Res. 2013, 73, 6548–6553. [Google Scholar] [CrossRef] [PubMed]
- Wang, J.; Okkeri, J.; Pavic, K.; Wang, Z.; Kauko, O.; Halonen, T.; Sarek, G.; Ojala, P.M.; Rao, Z.; Xu, W.; et al. Oncoprotein CIP2A is stabilized via interaction with tumor suppressor PP2A/B56. Embo Rep. 2017, 18, 437–450. [Google Scholar] [CrossRef] [PubMed]
- Ley, T.J.; Miller, C.; Ding, L.; Raphael, B.J.; Mungall, A.J.; Robertson, A.; Hoadley, K.; Triche, T.J.; Laird, P.W.; Baty, J.D.; et al. Genomic and epigenomic landscapes of adult de novo acute myeloid leukemia. N. Engl. J. Med. 2013, 368, 2059–2074. [Google Scholar] [CrossRef] [PubMed]
- Goldman, M.; Craft, B.; Brooks, A.N.; Zhu, J.; Haussler, D. The UCSC Xena Platform for cancer genomics data visualization and interpretation. BioRxiv 2018. [Google Scholar] [CrossRef]
- Eppert, K.; Takenaka, K.; Lechman, E.R.; Waldron, L.; Nilsson, B.; van Galen, P.; Metzeler, K.H.; Poeppl, A.; Ling, V.; Beyene, J.; et al. Stem cell gene expression programs influence clinical outcome in human leukemia. Nat. Med. 2011, 17, 1086–1093. [Google Scholar] [CrossRef] [PubMed]
- Xiao, W.; Petrova-Drus, K.; Roshal, M. Optimal Measurable Residual Disease Testing for Acute Myeloid Leukemia. Surg. Pathol. Clin. 2019, 12, 671–686. [Google Scholar] [CrossRef] [PubMed]
- Voso, M.T.; Ottone, T.; Lavorgna, S.; Venditti, A.; Maurillo, L.; Lo-Coco, F.; Buccisano, F. MRD in AML: The Role of New Techniques. Front. Oncol. 2019, 9, 655. [Google Scholar] [CrossRef] [PubMed]
- Khanna, A.; Pimanda, J.E. Clinical significance of Cancerous Inhibitor of Protein Phosphatase 2A (CIP2A) in human cancers. Int. J. Cancer 2015. [Google Scholar] [CrossRef]
- Yang, Y.; Huang, Q.; Lu, Y.; Li, X.; Huang, S. Reactivating PP2A by FTY720 as a novel therapy for AML with C-KIT tyrosine kinase domain mutation. J. Cell Biochem. 2012, 113, 1314–1322. [Google Scholar] [CrossRef] [PubMed]
- Barragán, E.; Chillón, M.C.; Castelló-Cros, R.; Marcotegui, N.; Prieto, M.I.; Hoyos, M.; Pippa, R.; Llop, M.; Etxabe, A.; Cervera, J.; et al. CIP2A high expression is a poor prognostic factor in normal karyotype acute myeloid leukemia. Haematologica 2015, 100, e183–e185. [Google Scholar] [CrossRef] [PubMed]
- Lucas, C.M.; Harris, R.J.; Giannoudis, A.; Copland, M.; Slupsky, J.R.; Clark, R.E. Cancerous inhibitor of PP2A (CIP2A) at diagnosis of chronic myeloid leukemia is a critical determinant of disease progression. Blood 2011, 117, 6660–6668. [Google Scholar] [CrossRef] [PubMed]
- Lucas, C.M.; Harris, R.J.; Holcroft, A.K.; Scott, L.J.; Carmell, N.; McDonald, E.; Polydoros, F.; Clark, R.E. Second generation tyrosine kinase inhibitors prevent disease progression in high-risk (high CIP2A) chronic myeloid leukaemia patients. Leukemia 2015, 29, 1514–1523. [Google Scholar] [CrossRef] [PubMed]
- Lucas, C.M.; Scott, L.J.; Carmell, N.; Holcroft, A.K.; Hills, R.K.; Burnett, A.K.; Clark, R.E. CIP2A- and SETBP1-mediated PP2A inhibition reveals AKT S473 phosphorylation to be a new biomarker in AML. Blood Adv. 2018, 2, 964–968. [Google Scholar] [CrossRef] [PubMed]
- Hunt, T. On the regulation of protein phosphatase 2A and its role in controlling entry into and exit from mitosis. Adv. Biol. Regul. 2013, 53, 173–178. [Google Scholar] [CrossRef] [PubMed]


| Parameter | Time to Relapse | ||
|---|---|---|---|
| Hazard Ratio | 95% CI | p | |
| Riskgroup | 0.017 | ||
| EVI1 | 1.26 | 1.11 to 1.44 | 0.0005 |
| SET | 2.36 | 1.06 to 5.25 | 0.035 |
| ARPP19 | 2.87 | 1.33 to 6.22 | 0.007 |
| Parameter | Time to Relapse | Overall Survival | ||
|---|---|---|---|---|
| Hazard Ratio | p | Hazard Ratio | p | |
| Diagnosis age | 1.07 | 0.023 | 1.07 | 0.0004 |
| NPM1 mutation | 0.03 | 0.048 | 0.21 | 0.017 |
| EVI1 | 1.41 | 0.0005 | 1.14 | 0.026 |
| SET | 0.12 | 0.010 | ||
| ARPP19 | 58.77 | 0.0001 | 2.05 | 0.046 |
© 2019 by the authors. Licensee MDPI, Basel, Switzerland. This article is an open access article distributed under the terms and conditions of the Creative Commons Attribution (CC BY) license (http://creativecommons.org/licenses/by/4.0/).
Share and Cite
Mäkelä, E.; Löyttyniemi, E.; Salmenniemi, U.; Kauko, O.; Varila, T.; Kairisto, V.; Itälä-Remes, M.; Westermarck, J. Arpp19 Promotes Myc and Cip2a Expression and Associates with Patient Relapse in Acute Myeloid Leukemia. Cancers 2019, 11, 1774. https://0-doi-org.brum.beds.ac.uk/10.3390/cancers11111774
Mäkelä E, Löyttyniemi E, Salmenniemi U, Kauko O, Varila T, Kairisto V, Itälä-Remes M, Westermarck J. Arpp19 Promotes Myc and Cip2a Expression and Associates with Patient Relapse in Acute Myeloid Leukemia. Cancers. 2019; 11(11):1774. https://0-doi-org.brum.beds.ac.uk/10.3390/cancers11111774
Chicago/Turabian StyleMäkelä, Eleonora, Eliisa Löyttyniemi, Urpu Salmenniemi, Otto Kauko, Taru Varila, Veli Kairisto, Maija Itälä-Remes, and Jukka Westermarck. 2019. "Arpp19 Promotes Myc and Cip2a Expression and Associates with Patient Relapse in Acute Myeloid Leukemia" Cancers 11, no. 11: 1774. https://0-doi-org.brum.beds.ac.uk/10.3390/cancers11111774