Article

The Small Molecule Ephrin Receptor Inhibitor, GLPG1790, Reduces Renewal Capabilities of Cancer Stem Cells, Showing Anti-Tumour Efficacy on Preclinical Glioblastoma Models

1
Division of Radiation Oncology, Department of Biotechnological and Applied Clinical Sciences, University of L’Aquila, Via Vetoio (Coppito II), 67100 L’Aquila, Italy
2
Laboratory of Radiobiology, Department of Biotechnological and Applied Clinical Sciences, University of L’Aquila, Via Vetoio (Coppito II), 67100 L’Aquila, Italy
3
Laboratory of cellular pathology, Department of Biotechnological and Applied Clinical Sciences, University of L’Aquila, Via Vetoio 1 (Coppito II), 67100 L’Aquila, Italy
4
Laboratory of Human Anatomy; Department of Biotechnological and Applied Clinical Sciences, University of L’Aquila, Via Vetoio (Coppito II), 67100 L’Aquila, Italy
5
Laboratory of Neurophysiology, Department of Biotechnological and Applied Clinical Sciences, University of L’Aquila, Via Vetoio (Coppito II), 67100 L’Aquila, Italy
6
Department of Life, Health and Environmental Sciences, University of L’Aquila, Via Vetoio (Coppito II), 67100 L’Aquila, Italy
7
Laboratory of Experimental Medicine and Environmental Pathology, University Hub “Sabina Universitas”, 02100 Rieti, Italy
8
Department of Radiological, Oncological and Pathological Sciences, Sapienza University of Rome, 00161 Rome, Italy
9
Galapagos NV, Industriepark Mechelen Noord, General De Wittelaan L11 A3, 2880 Mechelen, Belgium
10
Galapagos SASU, 102 avenue Gaston Roussel, 93230 Romainville, France
*
Author to whom correspondence should be addressed.
Submission received: 8 January 2019 / Revised: 4 March 2019 / Accepted: 5 March 2019 / Published: 13 March 2019
(This article belongs to the Special Issue Glioblastoma: State of the Art and Future Perspectives)

Abstract

:
Therapies against glioblastoma (GBM) show a high percentage of failure associated with the survival of glioma stem cells (GSCs) that repopulate treated tumours. Forced differentiation of GSCs is a promising new approach in cancer treatment. Erythropoietin-producing hepatocellular (Eph) receptors drive tumourigenicity and stemness in GBM. We tested GLPG1790, a first small molecule with inhibition activity versus inhibitor of various Eph receptor kinases, in preclinical GBM models using in vitro and in vivo assays. GLPG1790 rapidly and persistently inhibited Ephrin-A1-mediated phosphorylation of Tyr588 and Ser897, completely blocking EphA2 receptor signalling. Similarly, this compound blocks the ephrin B2-mediated EphA3 and EphB4 tyrosine phosphorylation. This resulted in anti-glioma effects. GLPG1790 down-modulated the expression of mesenchymal markers CD44, Sox2, nestin, octamer-binding transcription factor 3/4 (Oct3/4), Nanog, CD90, and CD105, and up-regulated that of glial fibrillary acidic protein (GFAP) and pro-neural/neuronal markers, βIII tubulin, and neurofilaments. GLPG1790 reduced tumour growth in vivo. These effects were larger compared to radiation therapy (RT; U251 and T98G xenografts) and smaller than those of temozolomide (TMZ; U251 and U87MG cell models). By contrast, GLPG1790 showed effects that were higher than Radiotherapy (RT) and similar to Temozolomide (TMZ) in orthotopic U87MG and CSCs-5 models in terms of disease-free survival (DFS) and overall survival (OS). Further experiments were necessary to study possible interactions with radio- and chemotherapy. GLPG1790 demonstrated anti-tumor effects regulating both the differentiative status of Glioma Initiating Cells (GICs) and the quality of tumor microenvironment, translating into efficacy in aggressive GBM mouse models. Significant common molecular targets to radio and chemo therapy supported the combination use of GLPG1790 in ameliorative antiglioma therapy.

1. Introduction

Glioblastoma multiforme (GBM) is the most malignant human brain tumour [1]. This neoplasia is characterised by high cell heterogeneity and the presence of a complex tumour microenvironment [2]. Its aggressiveness is due to the high capacity of tumour cells to move and infiltrate healthy brain tissue [3] as well as to produce soluble factors capable of recruiting blood vessels and inflammatory cells [4,5]. This means that aggressive/infiltrating tumour cells are not eradicated with surgery or standard chemo and radio therapy [6]. Abnormal angiogenesis is also supported by vasculogenic mimicry [4,5,6,7]. Despite the abundant tumour-associated vasculogenesis, tumour necrosis is increased and this renders some tumour areas strongly hypoxic [8]. This is associated with the recruitment of precursors of endothelial cells/pericytes, bone marrow derived myeloid circulating cells and glioma stem cells (GSCs) [9,10,11]. Recruited cancer stem cells grow rapidly, they determine tumour recurrence [12] and are frequently resistant to chemotherapeutic agents [13]. The inflammatory state of gliomas is constantly maintained to support vasculogenesis and hypoxia [9,14]. Median overall survival (OS) for newly diagnosed GBM is 14.6 months [15]. Failure of standard chemo and radio therapy is attributed to multiple factors, such as microenvironment protection, -de novo and/or acquired tumour resistance, limitations in drug deliver, increased angiogenesis and/or vasculogenesis and GSCs.
Erythropoietin-producing hepatocellular (EPH) proteins are a large family of receptors with tyrosine kinases (TKs) moieties widely considered targets for glioblastoma [16]. These are grouped as Eph-A and Eph-B based on binding cell associated ligands, Ephrin-A and Ephrin-B, respectively. Binding of the ligand to the receptor starts a complex network of signals through “trans” and “cis” mechanisms [17] as a function of Eph and Ephrin expression in different cells or in the same cell, respectively. For the trans-modality, a “forward” activation, which is dependent on TK activity, propagates signals in the receptor-expressing cell, while the “reverse” signals are propagated in the Ephrin-expressing cell. “Forward” signaling includes the activation of Rho and Ras family GTPases and Akt/mTORC1, whereas “reverse” signaling involves Src family kinase activation [16,17]. The Eph/Ephrin network plays a key role in tissue remodeling during embryogenesis, cardiovascular and skeletal development, axon guidance, tissue patterning (for reviews, see Saha et al 2018 [18]). The major members of this receptor family involved in GBM progression and glial/neuronal differentiation are EphA2, EphA3 and EphB4 [19,20,21,22,23,24,25]. In particular, EphA3 is a protein frequently overexpressed in the most aggressive mesenchymal subtype [22]. Importantly, EphA3 is highly expressed on the tumor-initiating cell population in glioma, and appears critically involved in maintaining tumor cells in a less differentiated state by modulating mitogen-activated protein kinase signalling. EphA2 is co-expressed with EphA3 and promotes infiltrative invasion of Glioma Initiating Cells (GICs) in vivo through cross-talk with Akt and regulates stem cell properties [20]. Several processes correlated to tumour progression, such as neovascularization/angiogenesis, local invasion and metastatization are regulated by these receptors [23,24,25]. Many recent reports also indicate that the signals triggered by the EPH/Ephrin system modulate aspects of cancer stem cell self-renewal [20]. Different compounds targeting the Eph receptor are developed in cancer research [26,27,28]. GLPG1790 is one of these compounds. This compound is a small molecule with a pan-specific pharmacological compound with inhibition activity versus various Eph receptors kinases and with oral bioavailability [27,28]. This compound shows remarkable inhibition activity with nanomolar potency against EphB2, EphA2, EphB4, EphA4 and EphA1, but was not able to block EphA7 (if not in high doses). GLPG1790 was not previously tested for EpHA3 inhibition. Therefore, we are aware that different members of Eph receptors may be involved in tumor progression, stemness, differentiation of glioma stem like cells and angiogenesis [29].
It has also been demonstrated that GLPG1790 inhibits EphA2 receptor phosphorylation after a single oral administration of 30 and 100 mg/kg doses. Previously, we observed that pharmacological doses of GLPG1790 reduced tumour cell proliferation in rabdo-myosarcoma, modulating muscle cell differentiation [28]. Molecular action mechanisms are under investigation in tumour histotypes over-expressing Eph receptors. In this current study, the effectiveness of GLPG1790 was evaluated in GBM. For this purpose, we selected three cell lines (U87MG, U251 and T98G), which were subcutaneously xenografts in nude mice, and luciferase tagged U87MG and GSCs, which were orthotopically injected into the brains of female cd1 nude mice. We assessed changes in tumour growth, disease-free survival time (DSF) and OS after the GLPG1790 treatment, and compared these parameters with those collected by standard radio-, chemo- and chemo and radio therapies.

2. Material and Methods

2.1. Cell Lines and Cell Cultures

All the materials for the tissue culture were purchased from the Italian distributor of Euroclone (Euroclone S.p.A, Milan, Italy). Six human glioma cell lines (U251MG, A172, U87MG, SW1783, LN229 and T98G) were cultured at 37 °C in 5% CO2 in Dulbecco’s modified Eagle medium (DMEM, Euroclone) containing 10% (v/v) fetal bovine serum, 4 mM glutamine, 100 IU/mL penicillin, 100 μg/mL streptomycin and 1% nonessential amino acids (Thermo Fisher Scientific Inc., Carlsbad, CA, USA). The risk of working with misidentified and/or contaminated cell lines was minimised by using GBM cells at very low passages and periodic short tandem repeat (STR) DNA profiling. Luciferase-tagged U87MG cells were generated and provided by Jari E. Heikkila (Abo Akademi University, Turku, Finland). Five GBM patient-derived stem cell lines (BT12M, BT25M, BT48EF, BT50EF and BT53M), were provided by J. Gregory Cairncross, and Samuel Weiss (University of Calgary, Calgary, Canada) [30], and GSCs-5 and CSCs-7 were obtained from Marta Izquierdo (Universidad Autónoma de Madrid, Spain) [31]. These cells were maintained in neurosphere medium DMEM:F12 (1:1) supplemented with B-27, epidermal growth factor (EGF; 20 ng/mL) and basic fibroblast growth factor (bFGF; 10 ng/mL). Luciferase was inserted in the genome of GSCs-5 cells using the pGL4.13 vector (Promega, Milan, Italy) and the jetPEI DNA transfection method (Polyplus, Illkirch, France). Isolated neurospheres were assayed for stemness properties in terms of clonogenic capacity and positivity for stem cell markers.

2.2. Reagents and Enzymatic Activities

Antibodies against total Akt (Sc-377457), p-AktSer473 (sc-135651), total ERK 1/2 (H-72, sc-292838), p-ERK 1/2 (Thr 202/Tyr 204, sc-16982), p38α (clone C-20, sc-535), p-p38 (Tyr 182, sc-101759), EphA2 (clone C-20, sc-924), EphB4 (clone H-200, sc-5536), EphB2 (clone H-80, sc-28980), OCT3/4 (C-10, sc-5279), CA-IX (clone H11, sc-365900), anti-human CD31 (PECAM-1, clone M-20, sc-1506), nestin (clone 10c2, sc-23927), βIII tubulin (clone 3H3091, sc-69966), NFH (clone 2D2, sc-20014), GFAP (sc-6170) and SOX2 (clone A-5, sc-365964) were purchased from Santa Cruz Biotechnology (Santa Cruz, CA, USA). Antibodies against Phospho-EphA2 (Ser897, 6347) and Phospho-EphA2 (Tyr594, 3970) were purchased from Cell Signaling Technology Europe, B.V. (Leiden, The Netherland). Antibodies against Ki67 (Clone MIB-1, M7240) were purchased from Dako (Agilent Technologies Italia S.p.A., Cernusco sul Naviglio, Milan, Italy). Antibodies against CD44 (ab157107), Stro-1 (ab214086), murine CD31 (clone MEC 7.46, ab7388) and Ephrin A1 (ab199697) were purchased from Abcam (Cambridge, UK). Antibodies against CD105, conjugated with phycoerythrin (PE; MEM226) or un-conjugated (MEM-229), and CD90 (5E10) were purchased from Immunotools (Friesoythe, Germany). Antibodies against CXCR4 (A00995) and VEGF-A (251575) were purchased from GenScript (Piscataway, NJ, USA) and Abbiotec (San Diego, CA, USA), respectively. Cell-based enzyme-linked immunosorbent assays (ELISAs) for total and phosphorylated isoforms in Ser 897 and Tyr 588 EphA2 as well as total and p-Tyrosine779 EphA3 and total and p-Tyrosine987 EphB4 were used for detecting and quantifying target proteins in cultured cells following the “In-Cell ELISA protocol” on the Abcam website (http://www.abcam.com/protocols/in-cell-elisa-ice). Recombinant Human Ephrin-A1 (EFNA1-150H) and Recombinant Human Ephrin-B2 (EFNB2-480H) were purchased from Creative Biomart (Shirley, NY, USA).

2.3. Immunofluorescence Studies

BT48EF and BT50EF GSC cells were used for immuno-fluorescence analyses. Spheres were seeded at a density of 10,000 cells/cm2 on glass coverslips pretreated with 30 µg/mL poly-L lysine to promote adherence. The slides were then washed twice with phosphate-buffered saline (PBS) and fixed with 4% paraformaldehyde for 20 min at room temperature. To stain cytoplasmic markers, slides were permeabilized with 0.3% Triton-X-100 for 5 min at room temperature. Spheres were then incubated overnight at 4 °C with the following primary antibodies accordingly to their data sheets: anti-OCT3/4, Ki67, EphA2, nestin, βIII tubulin, NFH, GFAP, SOX2, Stro-1 and CD44. After washing with PBS, cells were incubated for 30 min at RT with AlexaFluor 488 anti-rabbit IgG, AlexaFluor 595 anti-goat IgG or AlexaFluor 633 anti-mouse IgG secondary antibody (1:2000; Molecular Probes, Invitrogen, Carlsbad, CA, USA). Controls were performed by omitting the primary antibody. Cell nuclei were stained with DAPI (0.5 μg/mL). Coverslips were mounted with Vectashield Mounting Medium and examined with a Leica TCS SP5 confocal microscope (Leica Microsystems Inc., Mannheim, Germany).

2.4. Fluorescence-Activated Cell Sorter (FACS) Analyses

Expression of surface antigens in BT48EF and BT12M cell lines, treated or untreated with 0.5 μM GLPG 1790, was quantified by flow cytometry. BT48EF and BT12M cells were fixed with 4% paraformaldehyde for 10 min at 4 °C and, after washing, cells were incubated for 1 h at room temperature with anti-CD44, anti-CD105 and anti-EphA2, followed by additional 30 min with CY5-conjugated anti-rabbit IgG H&L or PE-conjugated anti-mouse IgG purchased from Abcam (Cambridge, UK). Moreover, we quantified the expression of cytoplasmatic antigens by flow cytometry in the same cell lines treated as above. The cells were fixed with 4% paraformaldehyde for 10 min at 4 °C, and after washing, were permeabilized with 0.1% (v/v) Triton X-100 for 10 min at room temperature. The cells were washed in PBS and incubated for 1 h at RT with anti-NFH, anti-Nestin and anti-GFAP, followed by an additional 30 min with Cyanine dye 5 (CY5)-conjugated anti-rabbit IgG H&L or Phycoerythrin PE-conjugated anti-mouse IgG. All samples were analysed using a BD AccuriTM C6 Plus Flow cytometer (Becton Dickinson Italia SpA, Milan, Italy) equipped with a blue laser (488 nm) and a red laser (640 nm). At least 10,000 events were acquired. Negative controls were obtained by analysing samples treated without the primary antibody. Although Fluorescent-Activated Cell Sorter (FACS) should be made on live cells, especially for membrane associated antigens, we choose to use a fixation in 4% paraformaldehyde to avoid the internalisation and degradation of membrane markers as demonstrated for different membrane targets such as EphA2 [32] or CD44 [33].

2.5. Growth Assays

Twenty-four-well plates were seeded with 2 × 10⁴ cells/mL GBM cells. After cell adhesion and growth in 5% fetal calf serum (FCS) DMEM for 24 h, different concentrations of GLPG1790 were added in appropriate culture conditions. A Nikon Diaphot inverted phase-contrast photomicroscope (Nikon Corp., Tokyo, Japan) was used before cell trypsinization and counting. Cell counts were made with a NucleoCounter NC-100 (Chemotec, Gydevang, Denmark) as previously described [34]. IC50 values, the concentration of drug required for a 50% reduction in growth/viability, were calculated using the Dojindo Cell Counting Kit-8 (Dojindo EU GmbH, Munich, Germany). For neurosphere proliferation, we used two different modalities of study: (i) a direct count and sizing of neurospheres at 1 week of culture from pre-formed spheres, and (ii) the evaluation of the clonal capacity of cancer stem cells (CSCs) cultured as single cells after 14–30 days. For the analysis of sphere growth, pre-formed neurospheres were treated with different doses of GLPG1790 for 72 h. After treatment, spheres were photographed and counted at contrast phase microscopy. Spheres were recorded as either large colonies (>50 cells) or small colonies (<50 cells). Single cells were also manually counted per microscopic field at 100× magnification. For the clonogenic assay, glioma tumour-initiating cells (GICs) were seeded in 96-well plates as a single cell suspension at a density of 2 cells/mL (equivalent of 1 cell every 3 wells). Cells were maintained for 14–30 days in their culturing media and then the wells were visually scanned using light microscopy to identify and count the clones (spheres) produced.

2.6. Cell Viability and Apoptosis Assay

Apoptosis was evaluated using the Tali® Apoptosis Kit—Annexin V Alexa Fluor® 488 & Propidium Iodide-based (Life Technologies Italia, Monza, Italy), as well as caspase-specific chromogenic substrates at 450 nm in an ELISA plate reader. In addition, we used Ac-DEVD-pNA (caspase-3), Ac-IETD-pNA (caspase 8) and Ac-LEHD-pNA purchased from Kaneka Eurogentec SA (Seraing, Belgium). N-Succinyl-Leu-Tyr-7-amido-4-methylcoumarin (Sigma Aldrich, St. Louis, MO, USA) was used to test calpain I activity in cell extracts in order to evaluate necrosis.

2.7. Western Blot

Cell extracts were obtained from treated or untreated cultures washed with cold PBS and lysed with lysis buffer containing proteinase and phosphatase inhibitor cocktails. Proteins were subjected to 7% or 15% sodium dodecyl sulphate-polyacrylamide gel electrophoresis (SDS-PAGE), transferred to nitrocellulose and probed with appropriate antibodies based on the recommendations of the suppliers. Reactive bands were visualised with a chemiluminescent detection kit (Perbio Science, Tattenhall, UK) in a Bio-Rad Gel Doc system (Bio-Rad Laboratories S.r.l., Milan, Italy). Normalization of specific bands was performed using an anti β-actin antibody.

2.8. In Vivo Experiments: Xenograft Model

Six-week-old female CD1 nu/nu mice were purchased from Charles River Laboratories Italia, SRL (Calco, Italy) and maintained under European Community (EC) guidelines (2010/63/UE and DL 26/2014 for the use of laboratory animals). All mice received subcutaneous flank injections of 1 × 10⁶ U87MG, U251 or T98G cells. Tumour growth was assessed by measuring bi-weekly tumour diameters with Vernier calipers. Tumour volumes were calculated according to the formula: tumour volume (mm3) = 4/3π × R1 × R2 × R3, where R1, R2 and R3 were the three rays of the ellipsoid, as previously described [31] At about 20 days after the tumour injection, 60 mice with tumour volumes of 85–100 mm3 were randomised to receive the vehicle (methylcellulose 0.5% used to dissolve GLPG1790) or 30 mg/kg po qd GLPG1790, and for comparison with standard therapeutic procedures, RT, 4 Gy in a single administration), TMZ (16 mg/kg/5 consecutive days), or RT plus TMZ. The duration of treatments was 35 days or when control/untreated tumours reached critical volumes with regard to animal welfare laws. However, when an experiment was stopped, treated and control animals were sacrificed via carbon dioxide inhalation, and tumours were removed for biochemical (frozen tissue) and histological (paraffin fixed tissue) analyses. To compare different treatments, we considered as previously described [34]: (1) tumour volume, measured at different times; (2) tumour weight, measured at the end of experiment; (3) tumour progression (TP), defined as an increase >50% of tumour volume with respect to baseline; and (4) time to progression (TTP) which was the time necessary for TP.

2.9. Immunohistochemical Analyses

Indirect immunoperoxidase staining was performed on 4 μm paraffin-embedded tissue sections. A consensus judgment as indicated in our previous report [35] was adopted for immunohistochemical scoring of tumours based on the strength of positivity: negative (score 0), weak (score 1), moderated (score 2), or strong staining (score 3). In each category, the percentage of positive cells was assessed by scoring at least 1000 cells in the area with the highest density of antigen positive cells. Cytoplasmic/membrane staining intensity was graded as follow: 0 = negative; 1 ≤ 10% positive cells; 2 = positive cells in a range of 10–50%; and 3 ≥ 50% positive cells. Overall expression was defined by the staining index (SI) and ranged between 0 and 9, with an SI ≤ 4 indicating a low expression. Proliferation index (labeling index) was determined though the evaluation of the percentage of Ki67 positive cells by analysing 500 cells at 100× magnification. A TACS Blue Label kit (R&D Systems, Inc., Minneapolis, MN, USA) was used for in situ apoptosis determination and the percentage of terminal deoxynucleotidyl transferase dUTP nick end labeling (TUNEL) positive cells was determined in five random fields evaluated at 400× magnification. In order to count the number of CD31+ microvessels, five arbitrarily selected fields were analysed for each group at 100× magnification (tumour microvessels). Martius yellow-brilliant crystal scarlet blue stain was used to stain erythrocytes, and consequently, the presence of micro-thrombi and bleeding zones.

2.10. Orthotopic Intra-Brain Model

Nude mice were inoculated intra-cerebrally as previous described [36,37]. We injected 3 µL of cell suspension containing 3 × 10³ U87MG or CSCs-5 luciferase tagged cells directly into the brain; the injection rate was set to 1 µL/min. Therapeutic administrations were started 5 days after cell injection when no luciferase activity was detectable intracranially. At this time, animals were randomised to receive vehicle (methylcellulose 0.5%) or 30 mg/kg GLPG1790 (po qd), and for comparison with standard therapeutic procedures, radiotherapy (RT, 4 Gy in a single administration), temozolomide (TMZ, 32 mg/kg/5 consecutive days), or RT plus TMZ. Each experimental group was formed using 10 mice. Animals were tested weekly via bioluminescence assay. The time at which a visible bioluminescence lesion was observed defined the parameter called disease free survival (DFS). Repeated bioluminescence assays were performed in order to also have data on tumour progression. Bioluminescence imaging was performed using an Alliance Mini HD6 system (Uvitec Ltd., Cambridge, UK) after intra-peritoneal (i.p.) injection with 150 µg/g D-luciferin (Synchem UG & Co. Altenburg, Germany) in pre-anesthetized animals. Treatments were completed after 35 days when a period without drug administration was started. A similar therapeutic approach could mimic the progression of surgically treated tumours in which a small portion of cells remain in the surgical bed from which the tumour occurred. DSF was the first oncological outcome analysed and defined the time during which no bioluminescence evidence of the tumour was recorded. If progression was observed, this might be recorded during or after the discontinuation of treatment. Mice were euthanised when they displayed neurological signs, such as altered gait, tremors/seizures and lethargy, or weight loss of ≥20% of pre-surgical weight. A follow-up provided us with data on OS, defined as the time (days) prior to which an animal did not show the distress signs given above, and was equal to the time of euthanasia. Brains were collected, fixed with 4% paraformaldehyde and paraffin was embedded.

2.11. Statistical Details

Continuous variables were summarised as mean and standard deviation (SD) or as median and 95% confidence intervals (CI). For continuous variables that were not normally distributed, statistical comparisons between control and treated groups were established by carrying out the Kruskal–Wallis test and Dwass–Steel–Chritchlow–Fligner method. For continuous variables that were normally distributed, statistical comparisons between control and treated groups were established by carrying out an analysis of variance (ANOVA) test or by Student t-test for unpaired data (for two comparisons). When the ANOVA test revealed a statistical difference, pair-wise comparisons were made using Tukey’s honestly significant difference (HSD) test. TTP was analysed using Kaplan–Meier curves and Gehan’s generalized Wilcoxon test. When more than two survival curves were compared, the logrank test for trend was used. This tested the probability that there was a trend in survival scores across the groups. All tests were two-sided and were determined using Monte Carlo significance. Statistical significance occurred when p-values were at least < 0.05. MedCalc (MedCalc Software, Ostend, Belgium) was used as a complete statistical program. We analysed the Kaplan–Meyer curves [36] in terms of hazard ratios (HR), an expression of the ratio of the chance of an event occurring in the treatment arm compared to it occurring in the control arm. For comparisons, HRs are displayed with forest plot graphs.

3. Results

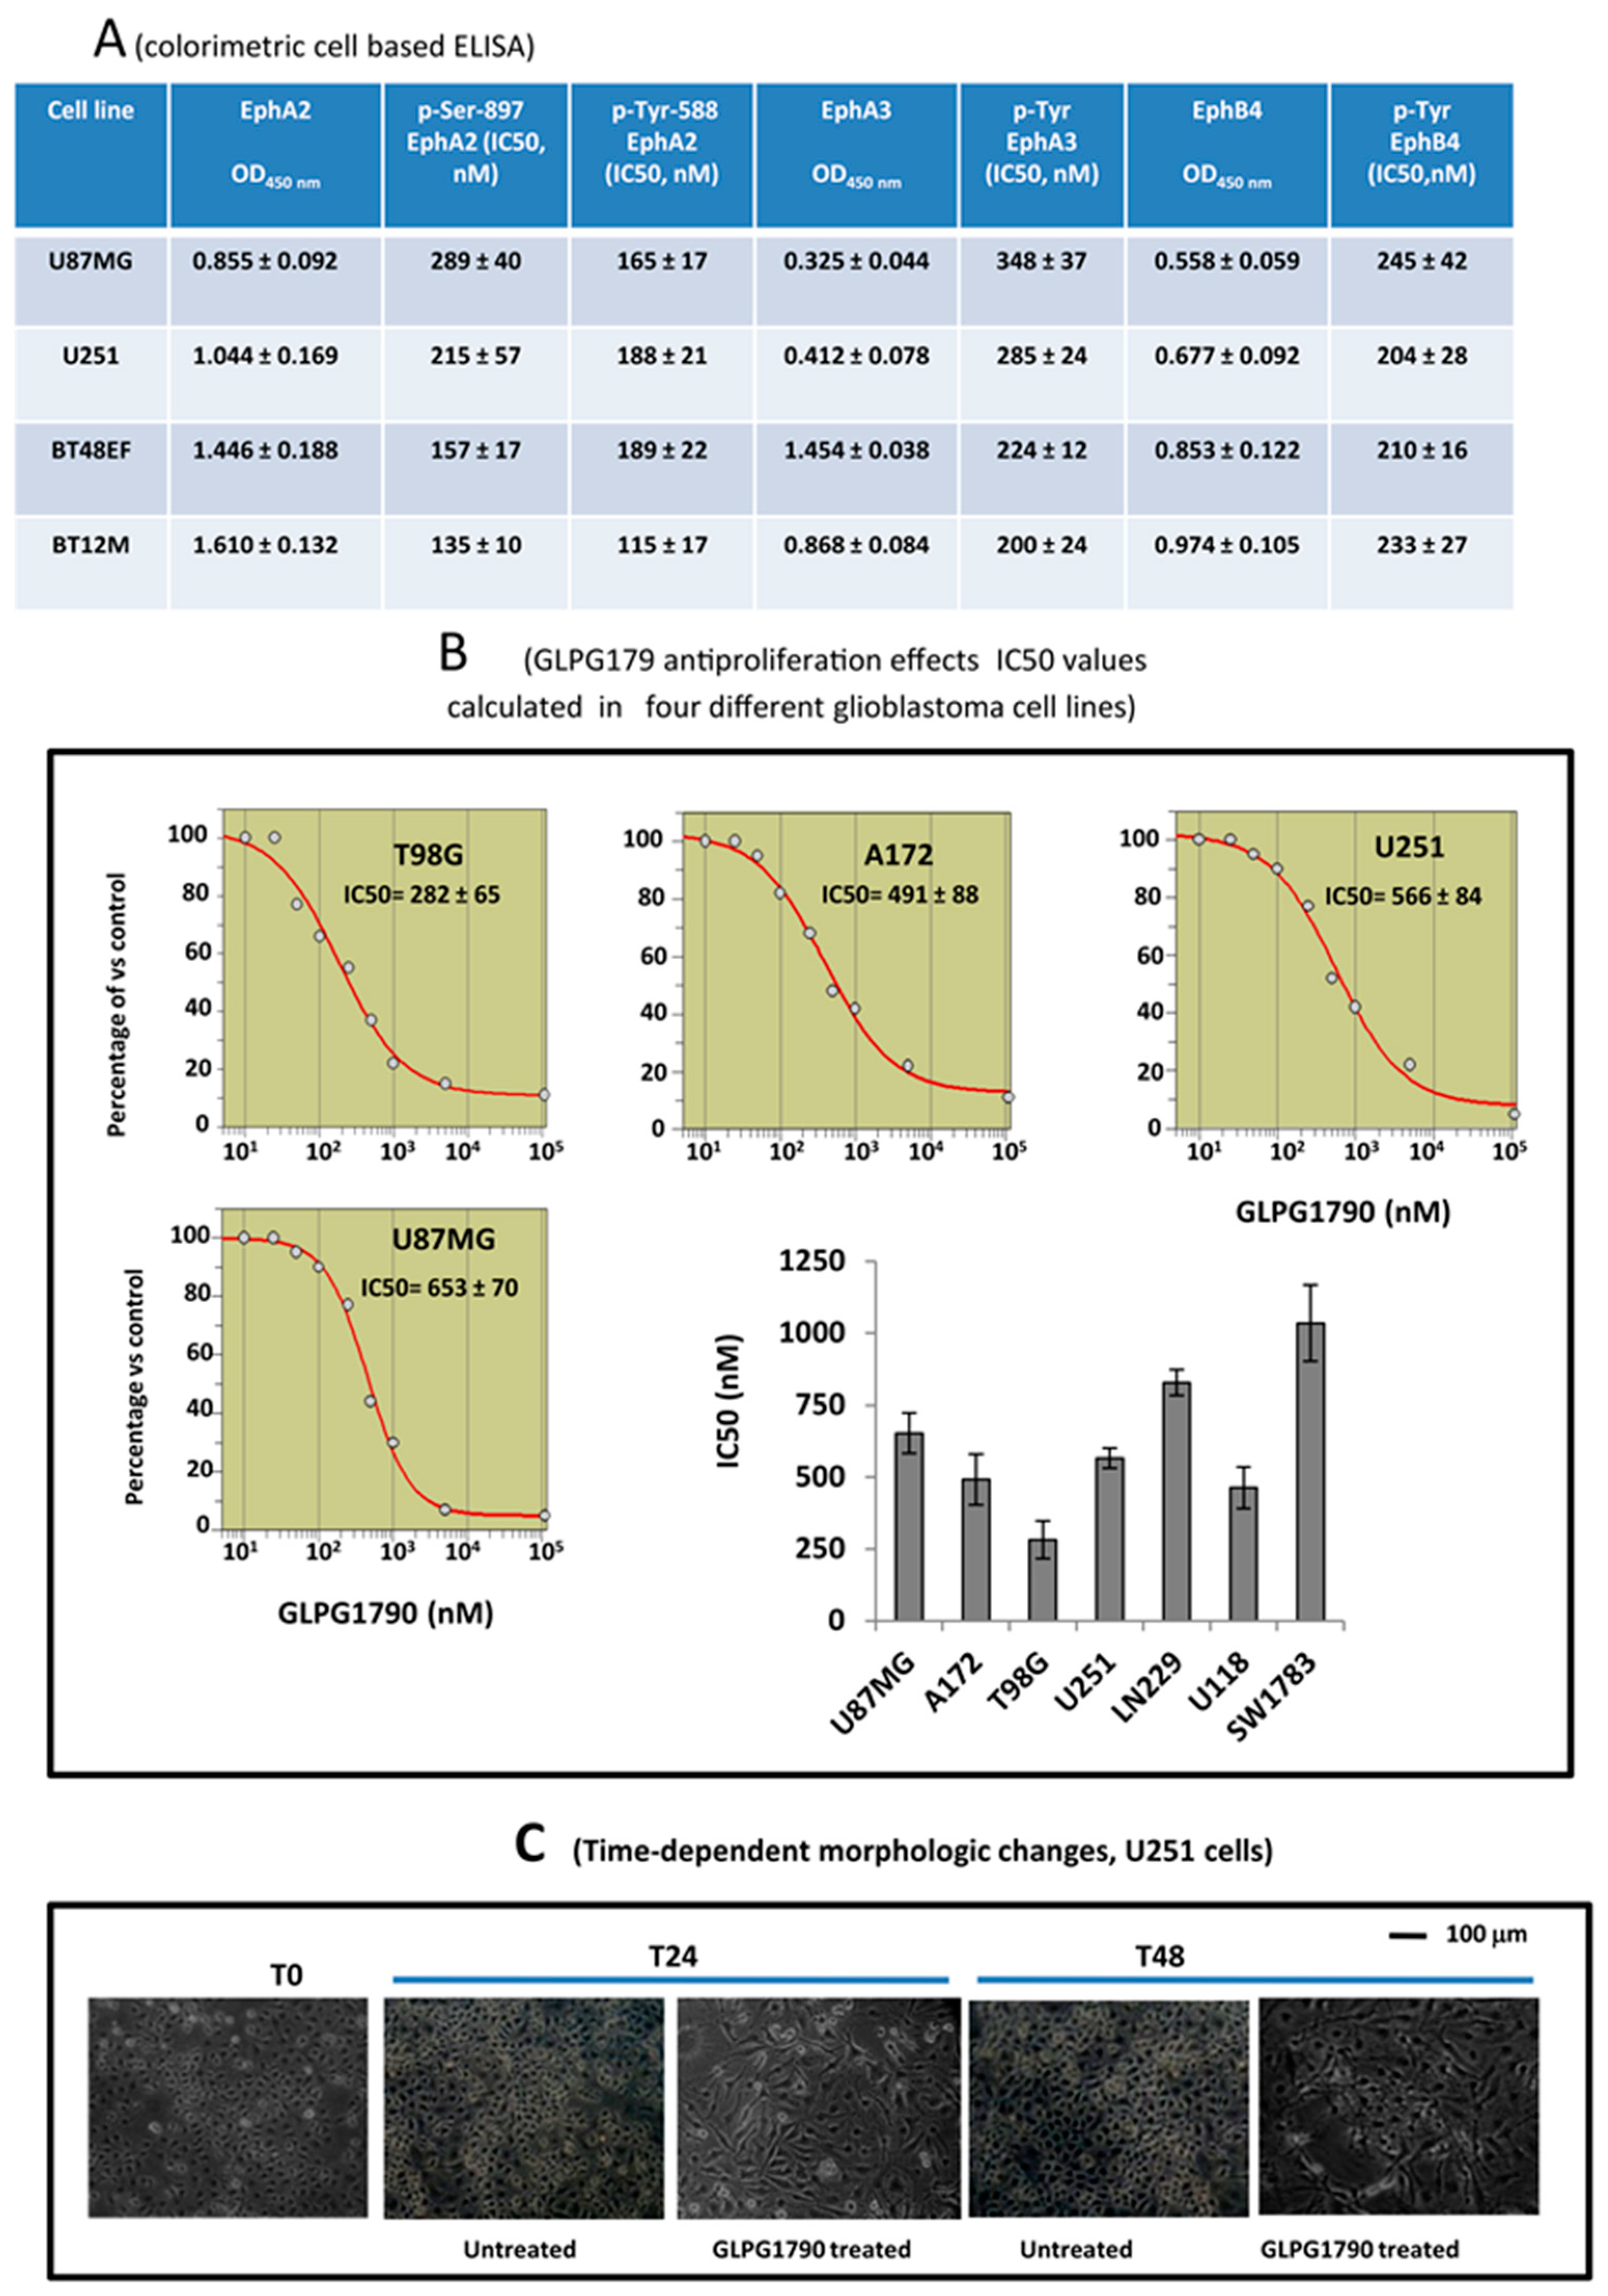
3.1. GLPG1790 Inhibits Phosphorylation of Both Tyrosine and Serine in U87MG Cells

Semi-quantitative determinations for basal expression of EphA2, EphA3 and EphB4 were obtained using cell-based ELISAs, whereas the affinities of GLPG1790 for EphA2, EphA3 and EphB4 were calculated by treating 80% sub-confluent GBM cultures with different doses of GLPG1790 that were administered 5 min before the addition of 0.25 μg/mL Ephrin-A1 (ligand of EphA2), and Ephrin-b2 (ligand for both EphA3 and EphB4). IC50 determinations were calculated 1 h after GLPG1790 administration. We verified the IC50 values for p-Tyrosine588 and p-Serine897 of EphA2, p-Tyrosine779 of EphA3 and p-Tyrosine987 of EphB4 (Figure 1A). We observed that the values of OD450 nm (and then the amount of proteins) for EphA2, EphA3 and EphB4 were higher in GICs versus GBM cells. Similarly, the expression levels of EphA2 were higher when compared to those observed for EphA3 and EphB4 in the same cells. The growth of GBM cells lines was markedly reduced by GLPG1790 administration with an IC50 that ranged between 491 nM (A172) and 653 nM (U87MG; Figure 1B). IC50 values calculated for GBM cell lines considered in our study are summarised in this panel. We also showed that GLPG1790 increased the neuron-like cell differentiation in the mixed neuron-like/glial (epithelioid cells) U251 cell line (Figure 1C). Next, we tested the effects of GLPG1790 on seven patient-derived and proliferating GSC lines. Figure 2A shows the growth of BT12M cells. These cells were highly sensitive to GLPG1790 administration. This compound induced cell detachment from the spheres with a reduction of both the number and size of BT12M spheres. IC50 values were calculated for CSCs ranged between 109 nM (BT12M) and 420 nM (BT53M), as summarized in Figure 2B for single cultures. GLPG1790 was also able to reduce dose-dependent sphere generation from single cells in a clonogenic assay (Figure 2C). This indicated that GLPG1790, inhibiting the spheres formation, might reduce the self-renewal potential of CSCs, which in turn, could cause a reduction in tumour recurrence capacity, when these data are extrapolated to an in vivo situation. In order to have further information regarding the cell proliferation and differentiation status of GSC cultures, we performed an immuno-fluorescent analysis using a double immunostaining with Sox2 and Ki67. In BT12M cells, GLPG1790 reduced the percentage of Ki67 (proliferating antigen) positive cells (Figure 2D). These results were also quantified in other GSCs (Figure 2D). Confocal analysis also showed that double positivity for Sox2 and Ki67 cells was basally distributed to the peripheral layers of spheres, whereas lower expression of Ki67 was demonstrated in the innermost cells of the sphere that are positive for Sox-2. The nuclear Ki67 localisation was demonstrated to be cell cycle-dependent [38] and linked to rRNA transcription [39]. Quiescent cells blocked in the G0/G1 phase of the cell cycle were negative or exhibited very faint Ki67 nucleoplasm staining. Late G1 and early S-phase patterns were very similar with intense dot-like, Ki67-stained cells (Figure 2D). In the G2 phase, the nuclear staining intensity was reduced and accompanied by well-defined and bright nucleoli; four cells with this appearance were also observed in the control group (Figure 2D). GLPG1790 treated spheres were smaller when compared to untreated cultures (Figure 2D,E). The percentage of cells with an intense nuclear background (mid and late S-phase) was significantly reduced in a dose-dependent manner, whereas the percentage of cells with no Ki67 expression (negative) or exhibiting very faint Ki-67 nucleoplasm staining was increased. Spheres were compacted in untreated cultures, whereas spheres derived from GLPG1790-treated cultures showed less adhesive cells. As indicated in Figure 2A, GLPG1790 could induce cell detachment from the outer/peripheral cell layers of spheres; therefore, the proliferating cells from spheres could be lost after the GLPG1790 treatment. Next, we analysed the expression of Sox2/Ki67 in single cells or in very small cell aggregates from treated and untreated cultures. As shown in Figure 2F, some cells from this population were proliferating (Ki67 positive). GLPG1790 was also able to reduce the percentage of Ki67 expressing cells suggesting that this compound might influence cell proliferation, also through detached cells. Taken together, these data suggested that GLPG1790 reduced both the recruitment and induction of cell proliferation (commitment) of CSCs.

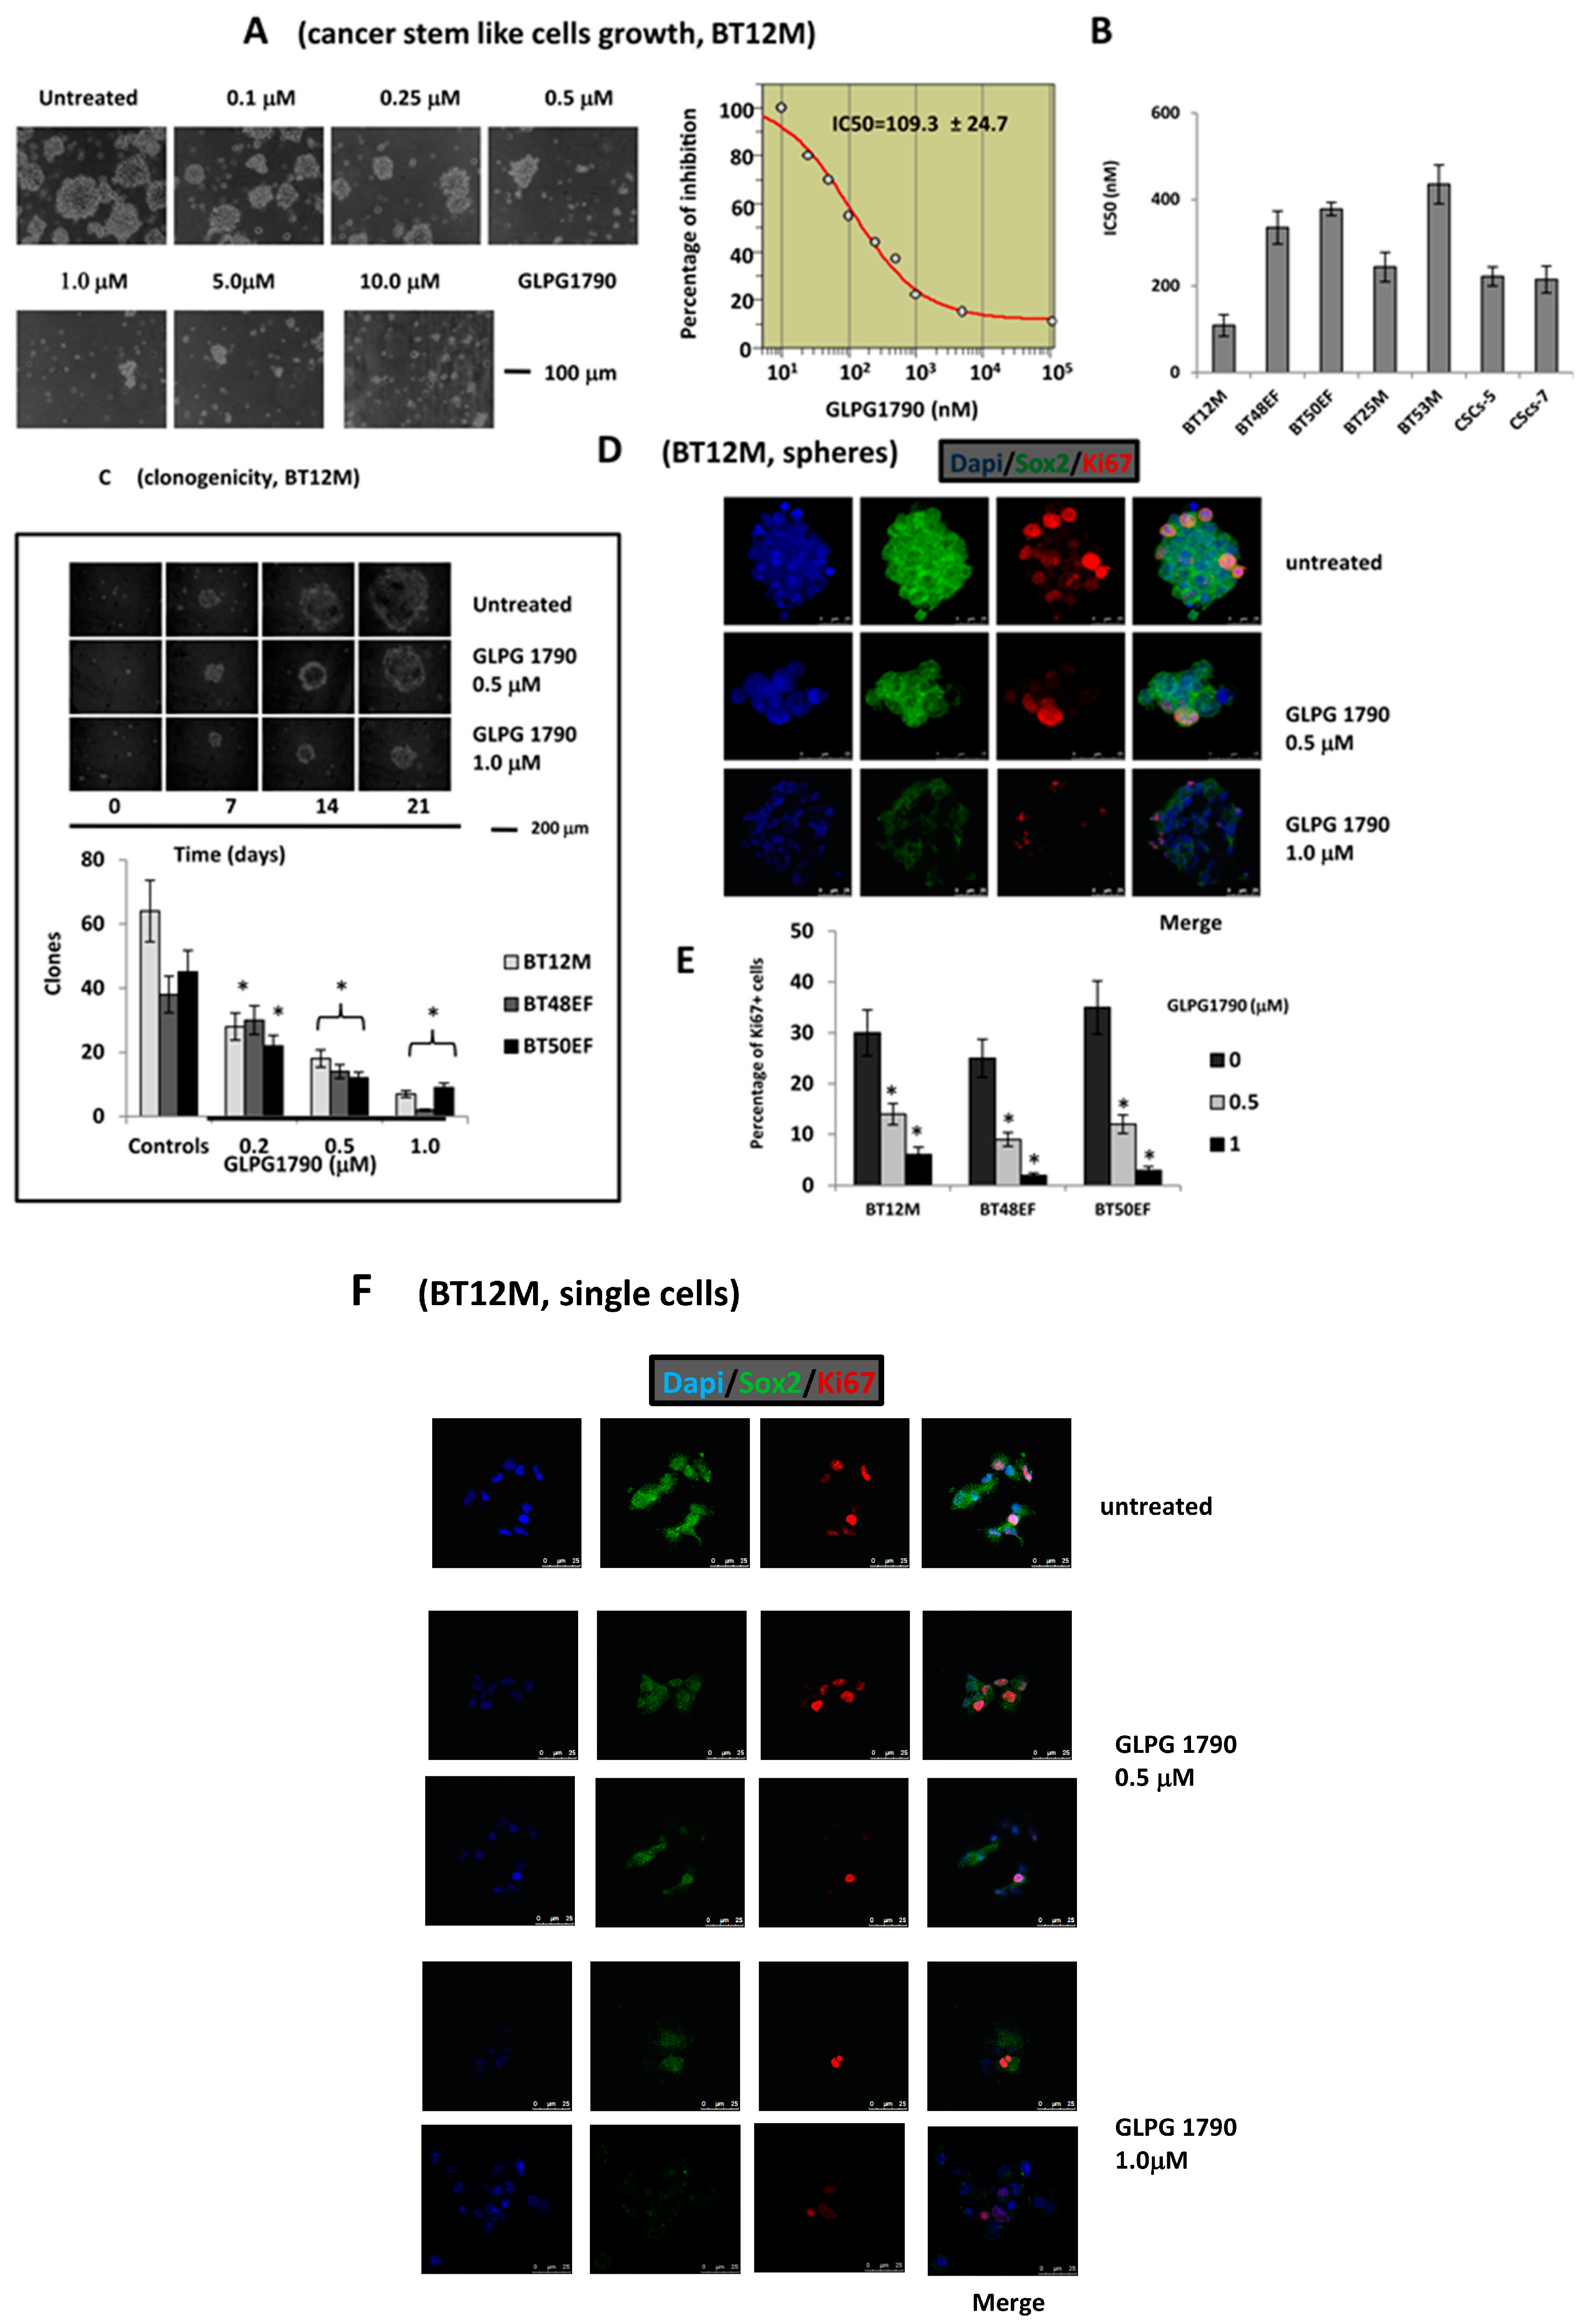
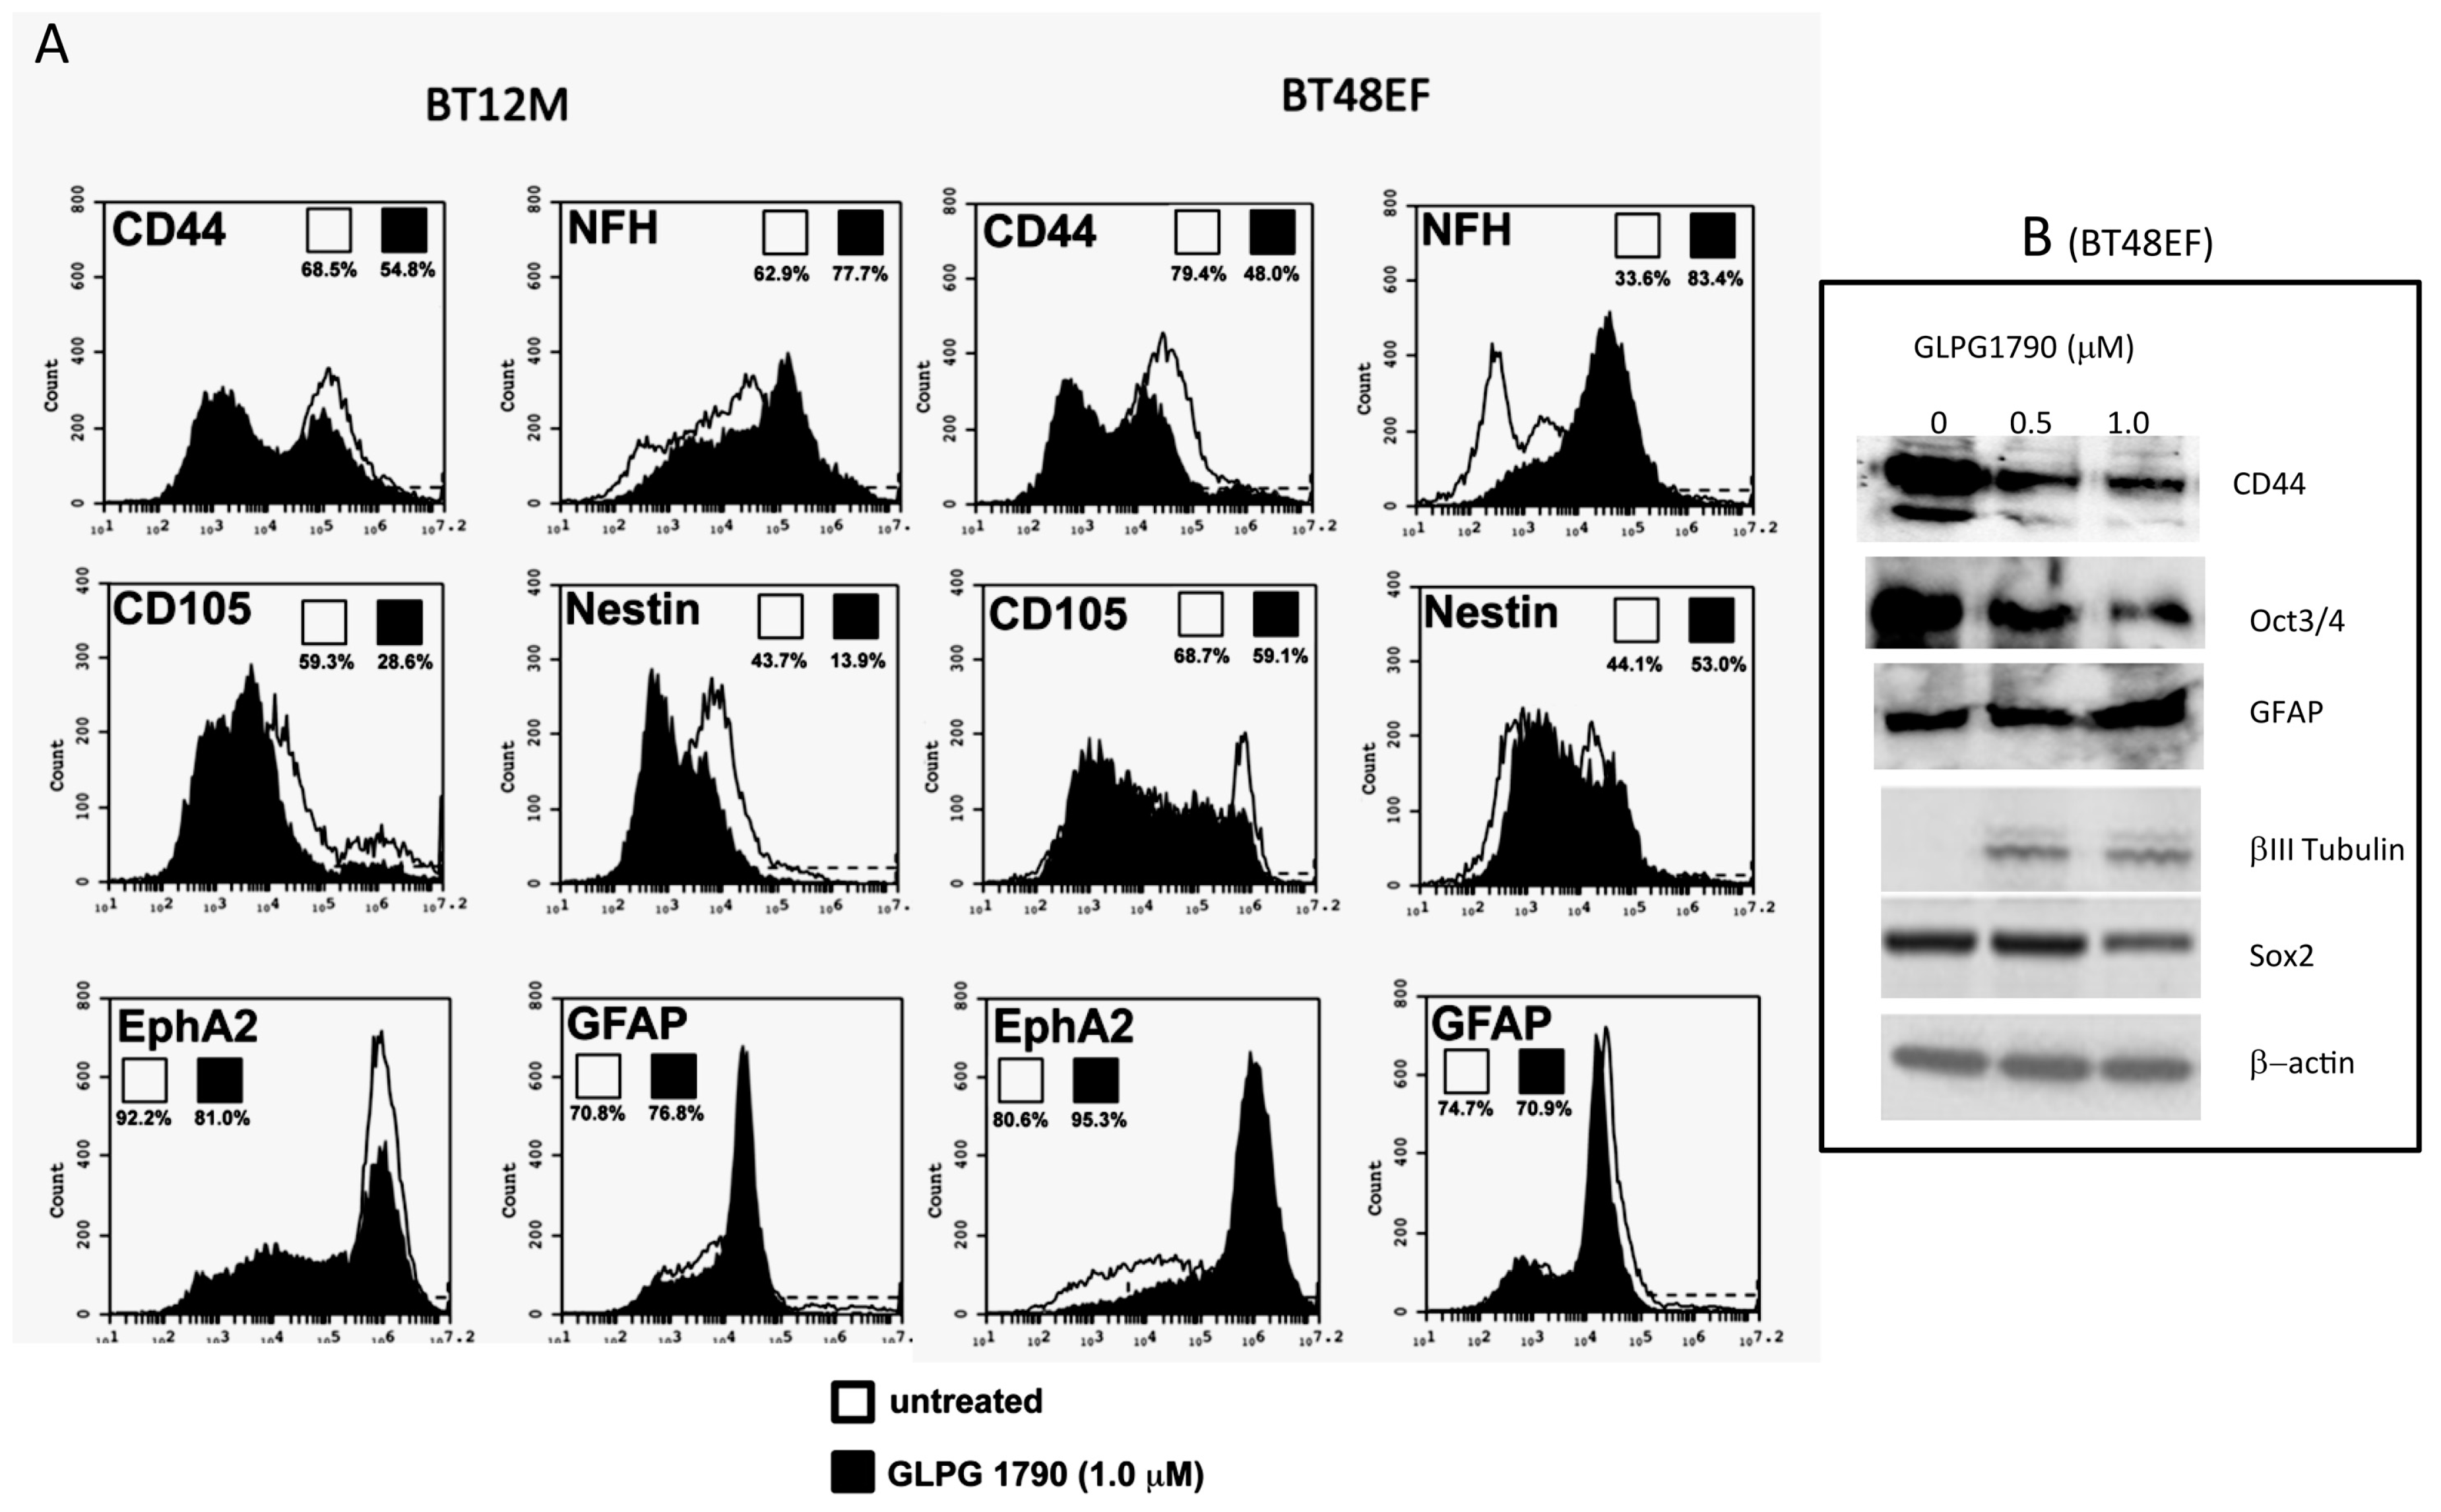
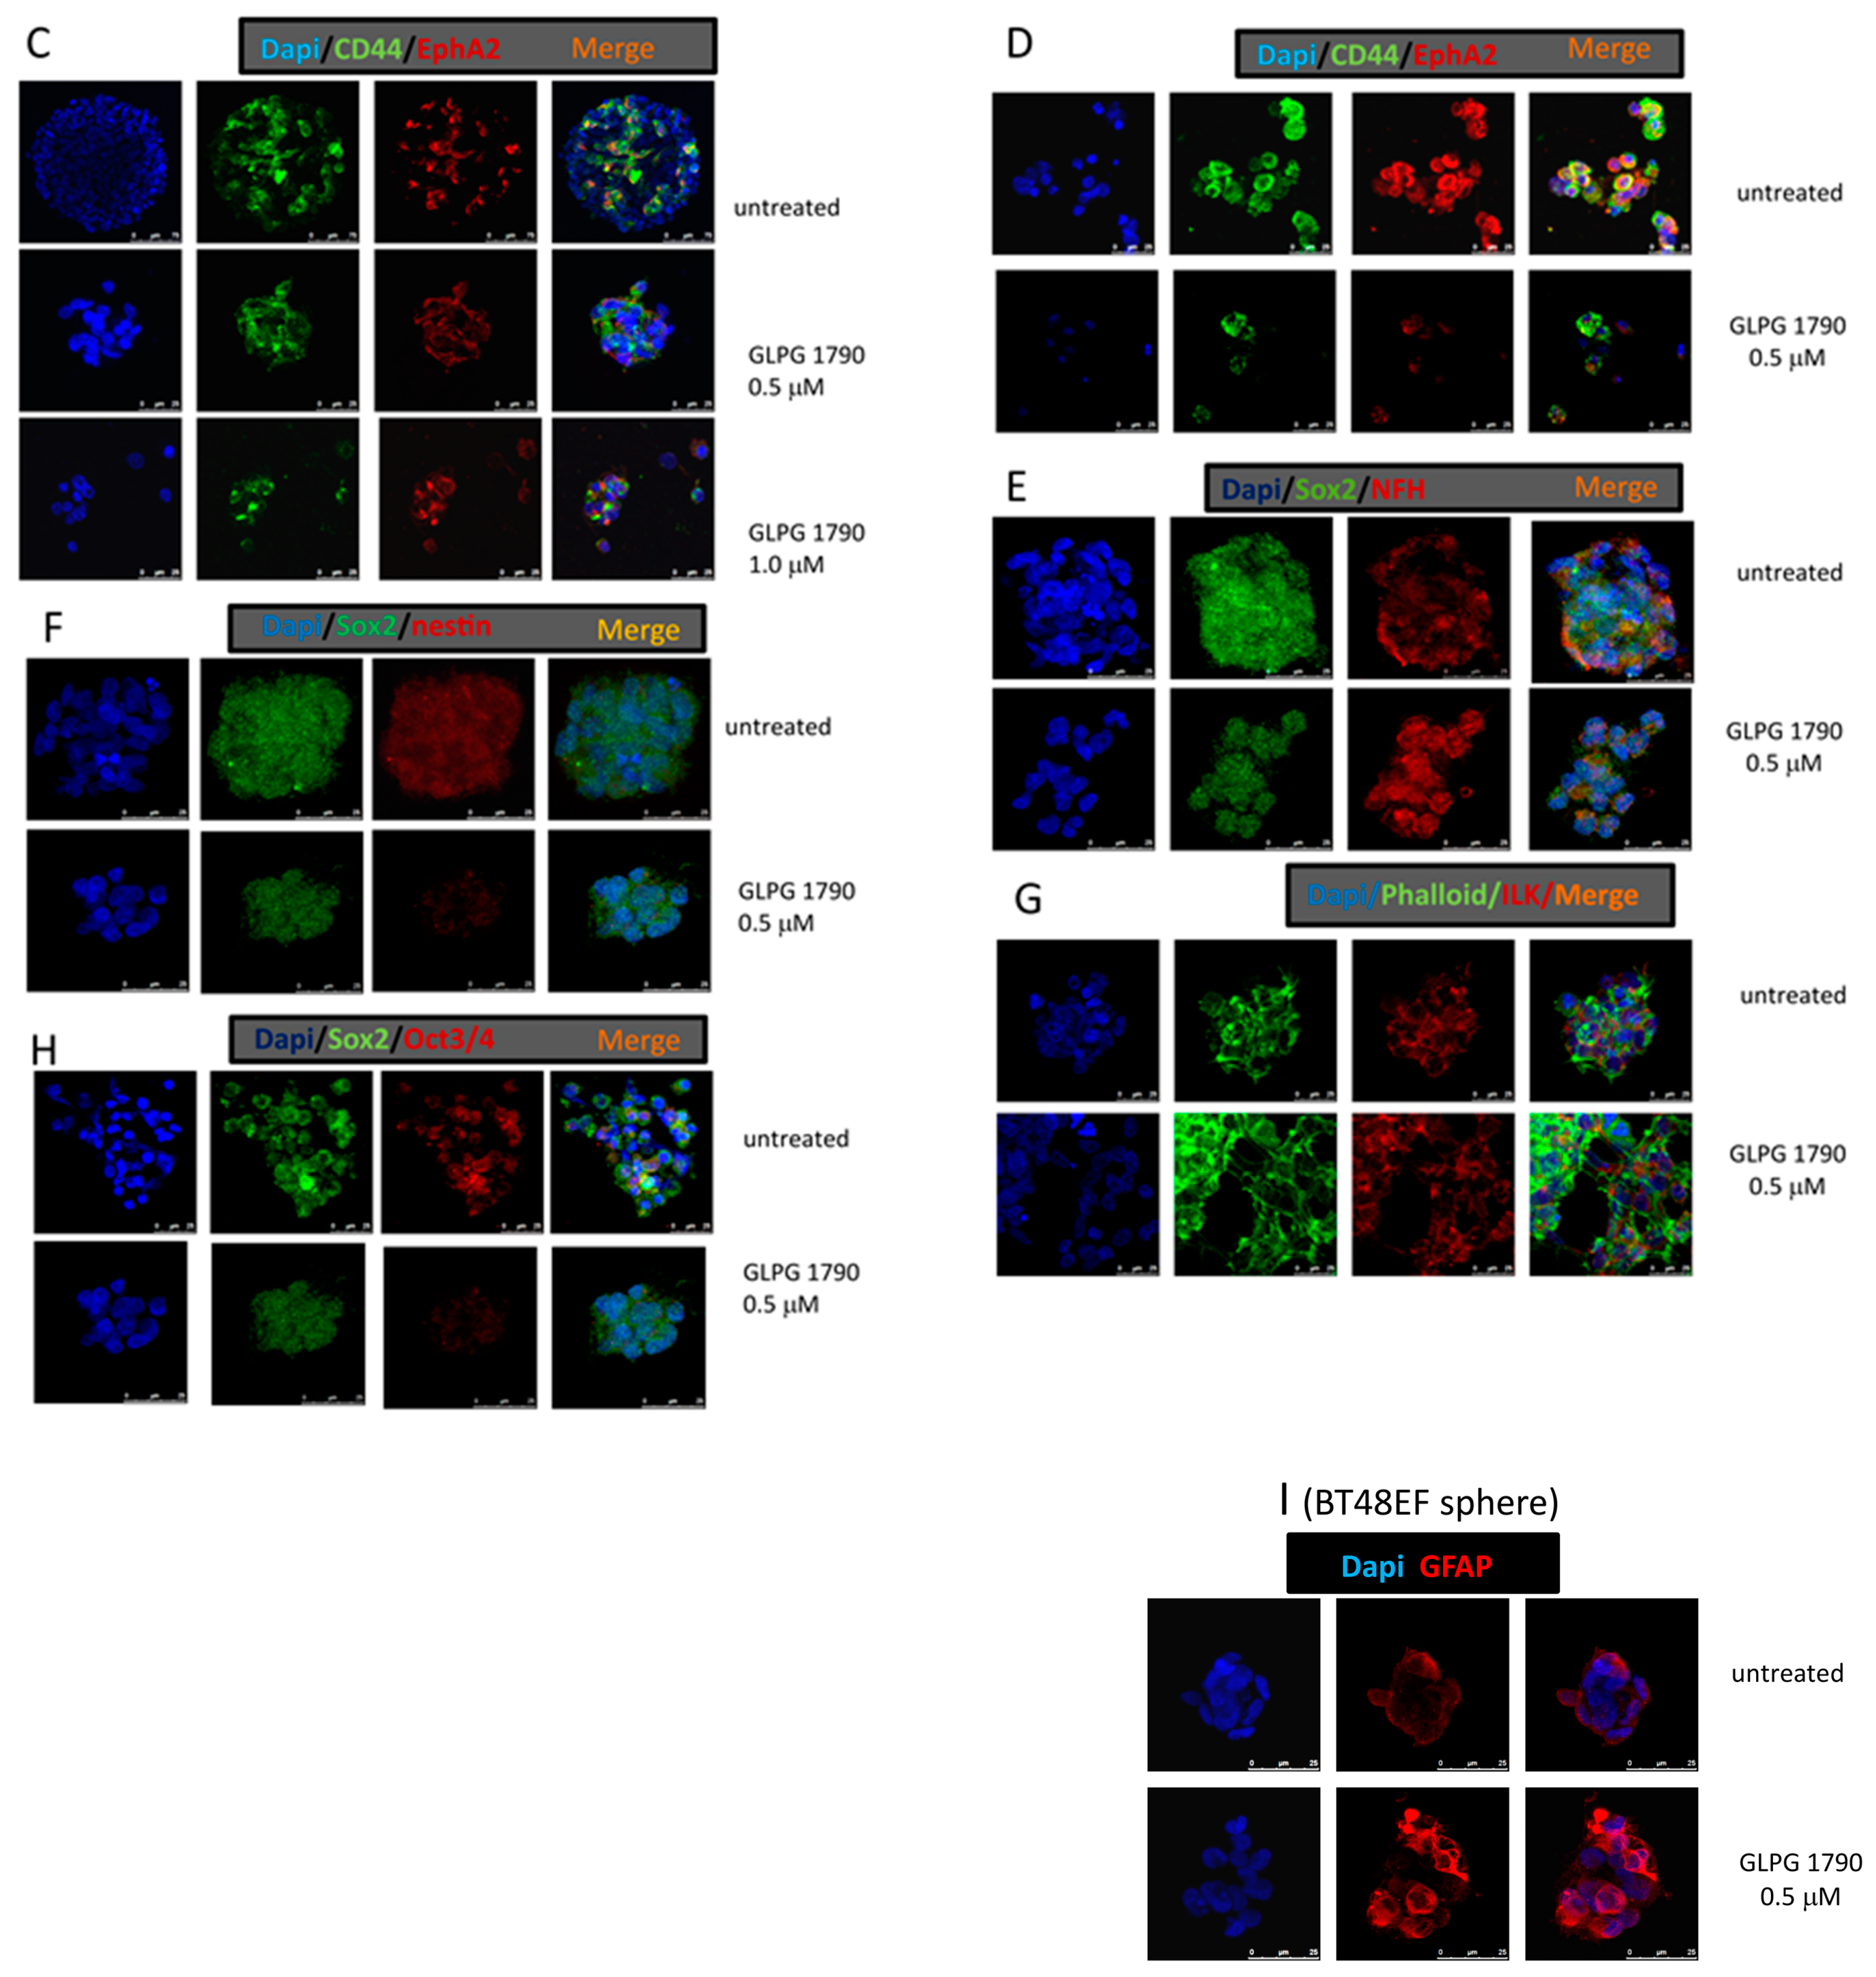
3.2. GLPG1790 Reduces Mesenchymal/Stem Cell Marker Expression in GICs

Of all the cancer stem cell markers identified to date, our attention was focused on CD44, CD90, CD105, Nestin, Sox2, Oct3/4, GFAP, βIII tubulin and neuro-filaments (NFH/Tuj1). In Figure 3A,B the representative cyto-fluorimetric analyses (BT48EF and BT12M cells) and western blots (BT48EF alone) are shown. Confocal immuno-fluorescence analyses (Figure 3C–I) were also performed to verify possible changes in expression and localisation of CD44 (Figure 3C,D), Sox2 (Figure 3E,F), NFH (Figure 3E), Oct3/4 (Figure 3H), GFAP (Figure 3I), Nestin (Figure 3F) and EphA2 (Figure 3C,D). Figure 3H shows the co-expression of actins and integrin-linked kinase (ILK) in the semi-adherent cultures. Notably, the CD44-positive cell percentage was reduced by approximately 40% (79.4 ± 2.5 vs. 48.0 ± 3.7 in untreated and GLPG1790 treated cultures, respectively) in BT12M cells and by 20% (68.5 ± 3.9 vs. 54.8 ± 4.2 in untreated and GLPG1790 treated cultures, respectively) in BT48EF. GLPG1790 administration reduced the expression of the CD44 standard isoform (CD44s) as indicated via western blot; however, as the difference observed between 0.5 and 1.0 μM treatments were minimal, it suggested this effect was not dose-dependent. CD44 positive cells were also EphA2-positive as suggested by the confocal data. The percentage of EphA2 positive cells was very high in both control GSC cultures. EphA2 was immuno-detected in 83.0 ± 7.0% of BT48EF cells and 92.5 ± 2.4% of BT12M cells.
GLPG1790 administration induced a significant decrease in EphA2 expression in BT12M cells (81.3 ± 3.4%, p = 0.0016, with a reduction of 12%), whereas no significant variation was observed in BT48EF lines (92.7 ± 5.2%, p = 0 0670). However, confocal immuno-fluorescence analysis showed a reduction of the EphA2 signal in BT48EF treated cells suggesting that GLPG1790 might reduce EphA2 expression in single cells. As GLPG1790 might induce cell detachment from outer/peripheral layers of cells from spheres, we also analysed EphA2 expression in this GIC population. Co-expression of CD44 and EphA2 was reduced after the GLPG1790 administration (Figure 3D), and significant changes were observed for CD105 expression. This antigen was basally detected in 68.7 ± 2.8% and 59.3 ± 2.7% of cells in BT48EF and BT12M cultures, respectively. The percentage of CD105 positive cells was significantly reduced after GLPG1790 administration, being detected in 52.2 ± 3.2% (reduction of 24%, p < 0.005) in BT48EF cells and 28.6 ± 2.5 (reduction of 51.8%, p < 0.0001) in BT12M cells. The percentage of CD90 expressing cells was not modified by GLPG1790 administration in BT48EF cells (65.9 ± 3.5% vs. 64.8 ± 2.7%), whereas it was statistically reduced in BT12M cells (77.1 ± 4.2% vs. 61.7 ± 3.6%, p < 0.005 with a reduction of 20%). Similarly, nestin was significantly reduced in BT12M cells (43.7 ± 2.8% vs. 13.9 ± 2.7%, p < 0.001 with a reduction of 68.2%), whereas the expression of this antigen was not statistically modified in BT48EF cells via the GLPG1790 treatment (45.5 ± 3.8% vs. 52.2 ± 5.3%, p = 0.0947). Nevertheless, confocal immuno-fluorescence analysis showed a reduction of the nestin signal in BT48EF-treated cells suggesting that GLPG1790 induced a reduced expression rather than a modification in the percentage of positive cells. This reduced signal was also confirmed by confocal immuno-fluorescence analyses performed in BT50EF cells. Next, we analysed the variation of differentiating marker after GLPG1790 administration and found that the expression of the neuronal marker NFH/Tuj1 was strongly increased in BT48EF cells (33.6 ± 2.4% vs. 83.4 ± 6.5%, p < 0.0001 with an increase of 2.48-fold), and was moderately increased in BT12M cells (62.9 ± 4.2% vs. 91.3 ± 6.4%, p < 0.0001 with an increment of 1.45-fold). These effects were particularly evident in the confocal immunofluorescence analysis in which NFH positive cells were strongly increased, as well as the signal that was increased after GLPG1790 administration (Figure 3C). The astrocyte marker GFAP was increased by 1.22-fold (70.0 ± 4.3% vs. 77.5 ± 3.4%, p = 0.0345) in BT12M cells but was not modified in BT48EF cells (74.7 ± 3.7% vs. 71.5 ± 4.3%). However, from western blots, the levels of GFAP seemed to be increased in extracts from BT48EF cells treated with higher doses of GLPG1790. For other stem cell markers, including Oct3/4, the signal on confocal immuno-fluorescence was dose-dependent and significantly reduced after GLPG1790 administration (Figure 3C). Western blot analysis confirmed the decrease in CD44, Oct3/4 and Sox2, as well as the increase of GFAP and βIII tubulin.

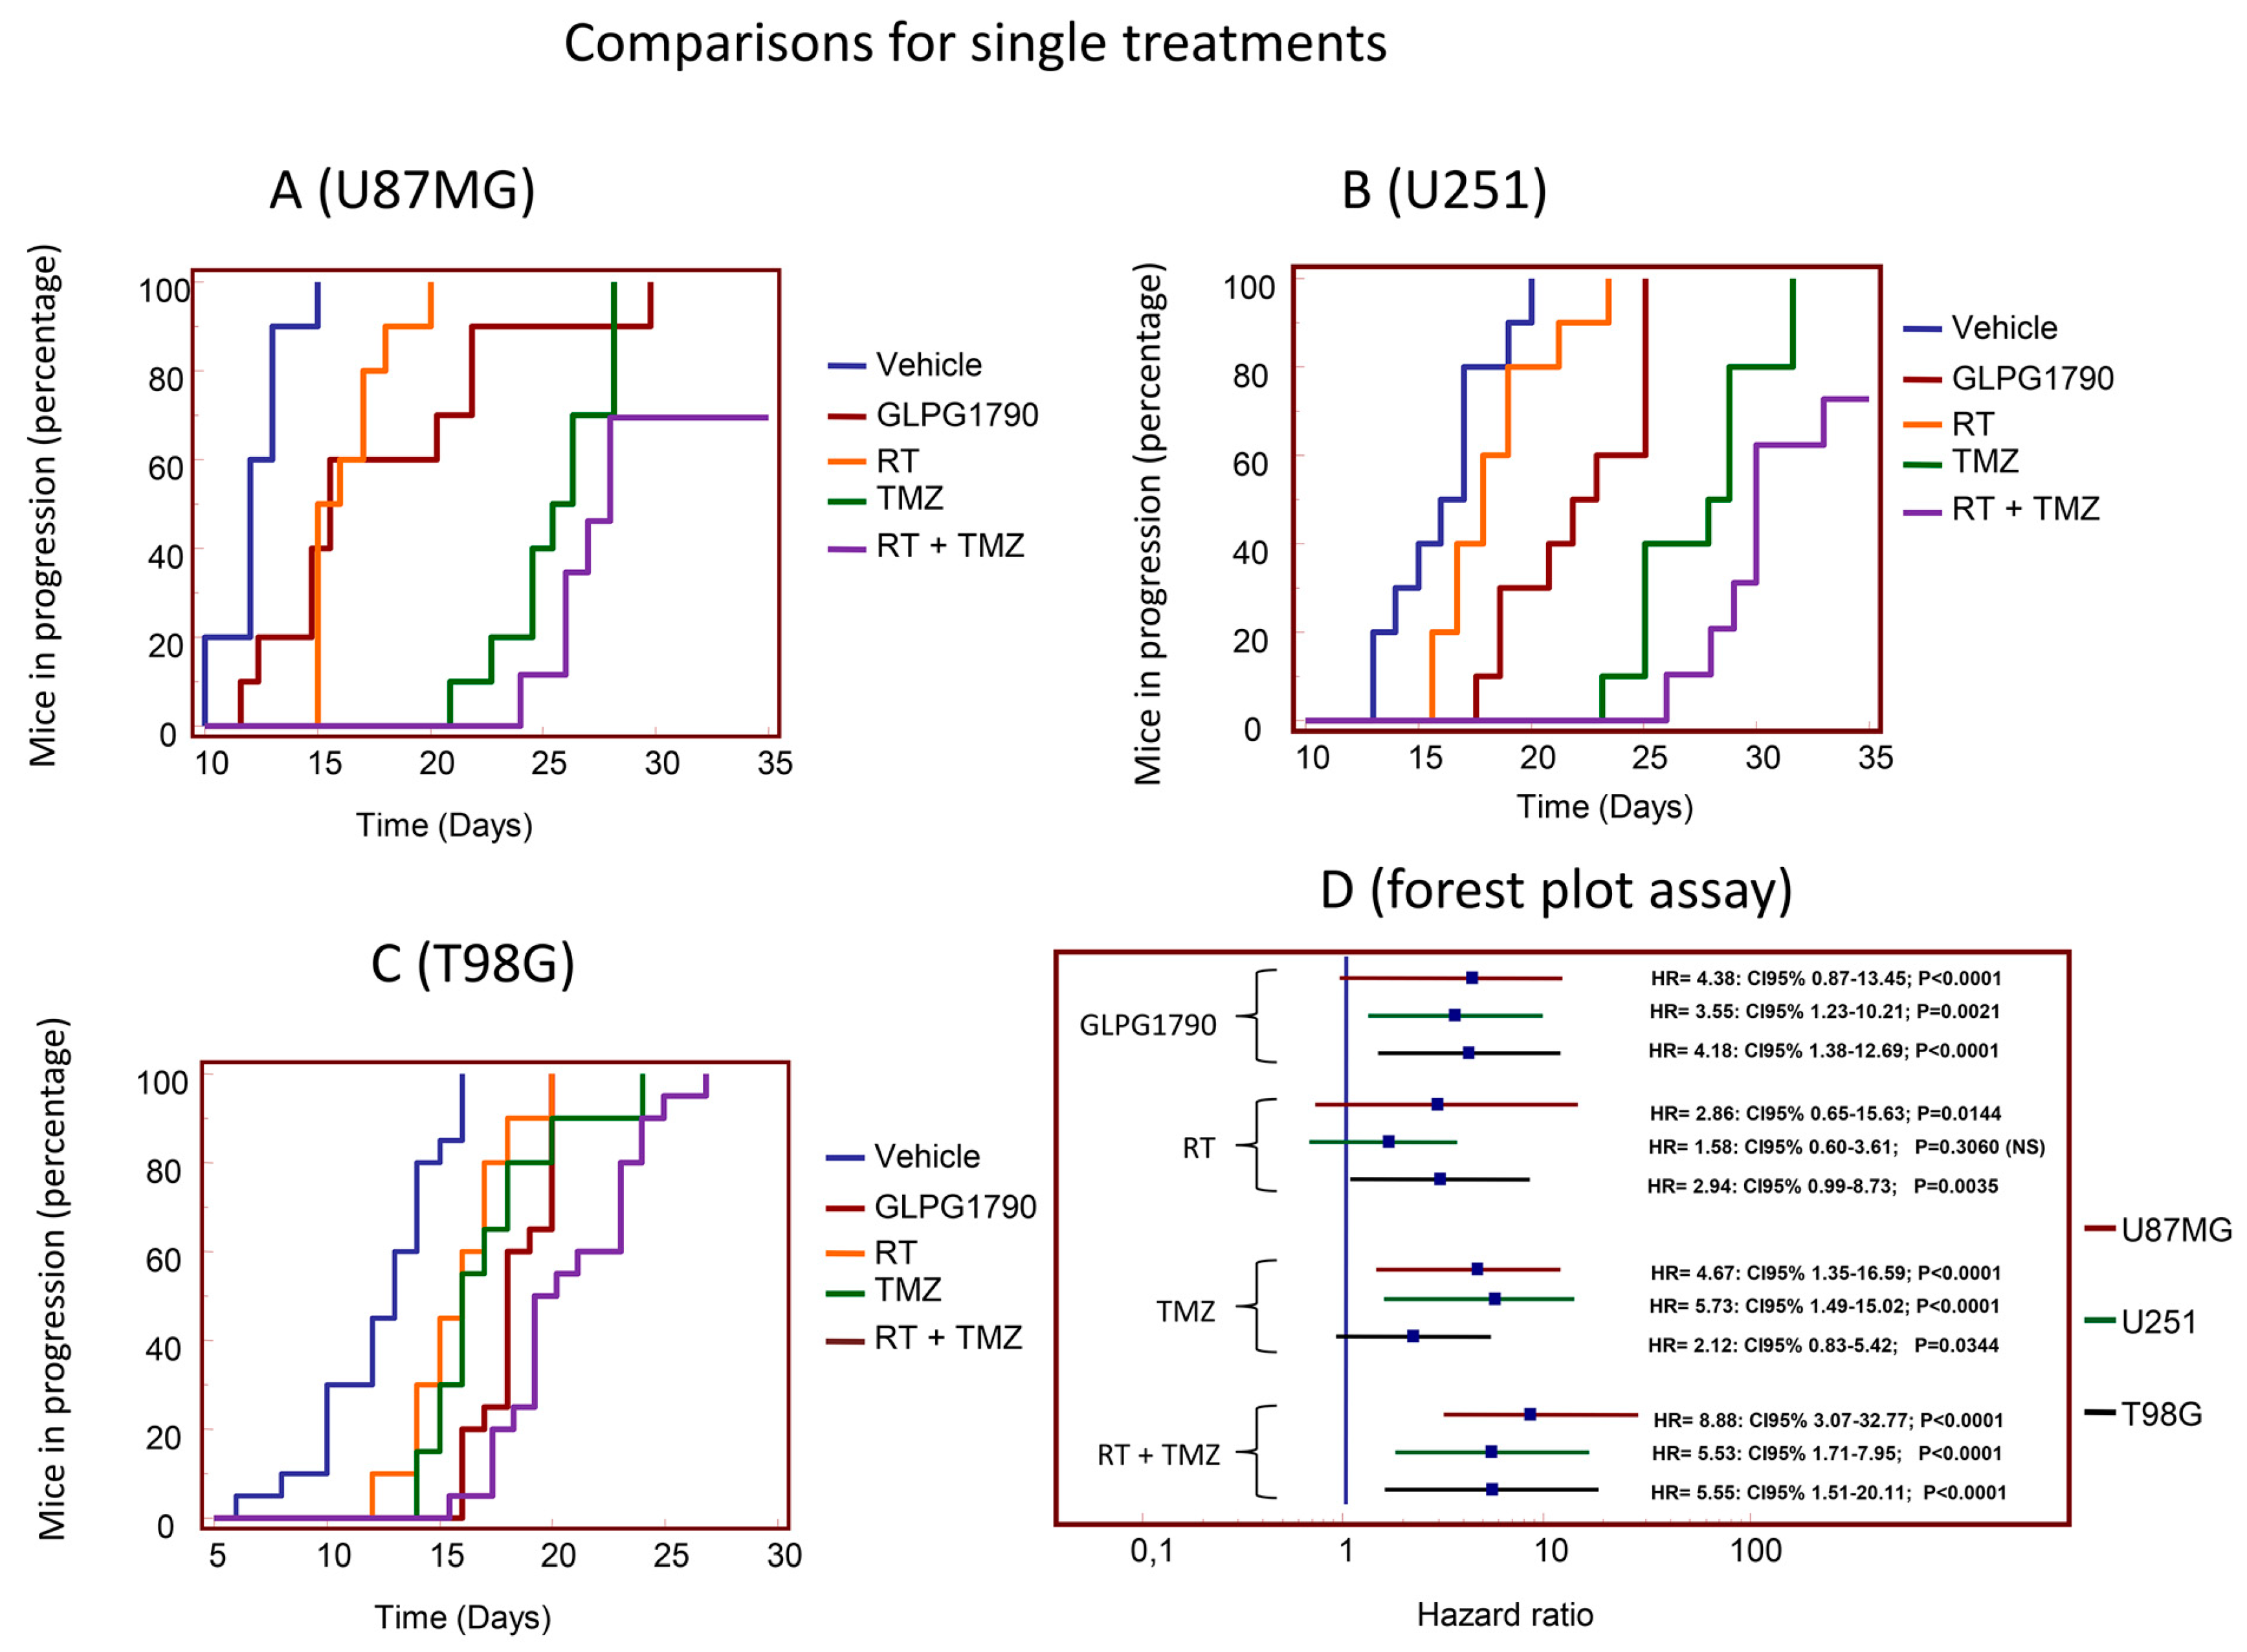
3.3. GLPG1790 Modifies Tumour Growth of GBM Cells Subcutaneously Injected in Female nu/nu Mice (Xenograft Model)

The efficacy of GLPG1790 as a single therapy was verified in comparison with standard therapeutic approaches (RT, TMZ or RT+TMZ) in Cd1 nu/nu mice with experimental brain tumours by using subcutaneous xenograft models of U87MG, U251 and T98G cells. Luciferase transfected U87MG and patient derived glioma stem-like CSCs-5 cells were injected in the striatum for the orthotopic models. For the first evaluation, we verified the in vivo efficacy of single doses of 30 mg/Kg/day GLPG1790 in mice by using three human models of high-grade glioma cells (U87MG, U251 and T98G) grown as subcutaneous xenografts and showing different levels of EphA2. GLPG1790 efficacy was compared with standard radio (RT, 1 doses of 4 Gy), chemo (temozolomide, TMZ, 16 mg/kg for 5 consecutive days) and chemo and radio (4 Gy + 16 mg/Kg TMZ) therapy. Figure 4A–D shows the percentage of mice in progression plotted with time of progression using Kaplan–Meyer analysis. In U87MG and U251 xenografts (Figure 4A,B), the anti-tumour effect of GLPG1790 was intermediate between that of RT and temozolomide single therapies, whereas the effects of GLPG1790 were similar to TMZ in T98G cells (Figure 4C).
GLPG1790 effects were not significantly different to RT in U87MG (Figure 4A), whereas this agent was more active than RT in U251 (HR = 2.87, p < 0.005; Figure 4B) and T98G (HR = 2.23, p < 0.05; Figure 4C). GLPG1790 effects were lower in U87MG (HR = 2.10, p < 0.05; Figure 4A) and U251 (HR = 2.88, p < 0.005; Figure 4B), and similar in T98G (HR = 1.49, p > 0.05; Figure 4C). GLPG1790 effects were significantly lower in comparison with standard chemo and radio therapy (RT+TMZ) in all cell systems (Figure 4A–C). In Table S1, we summarised the statistical analysis of xenograft experiments.

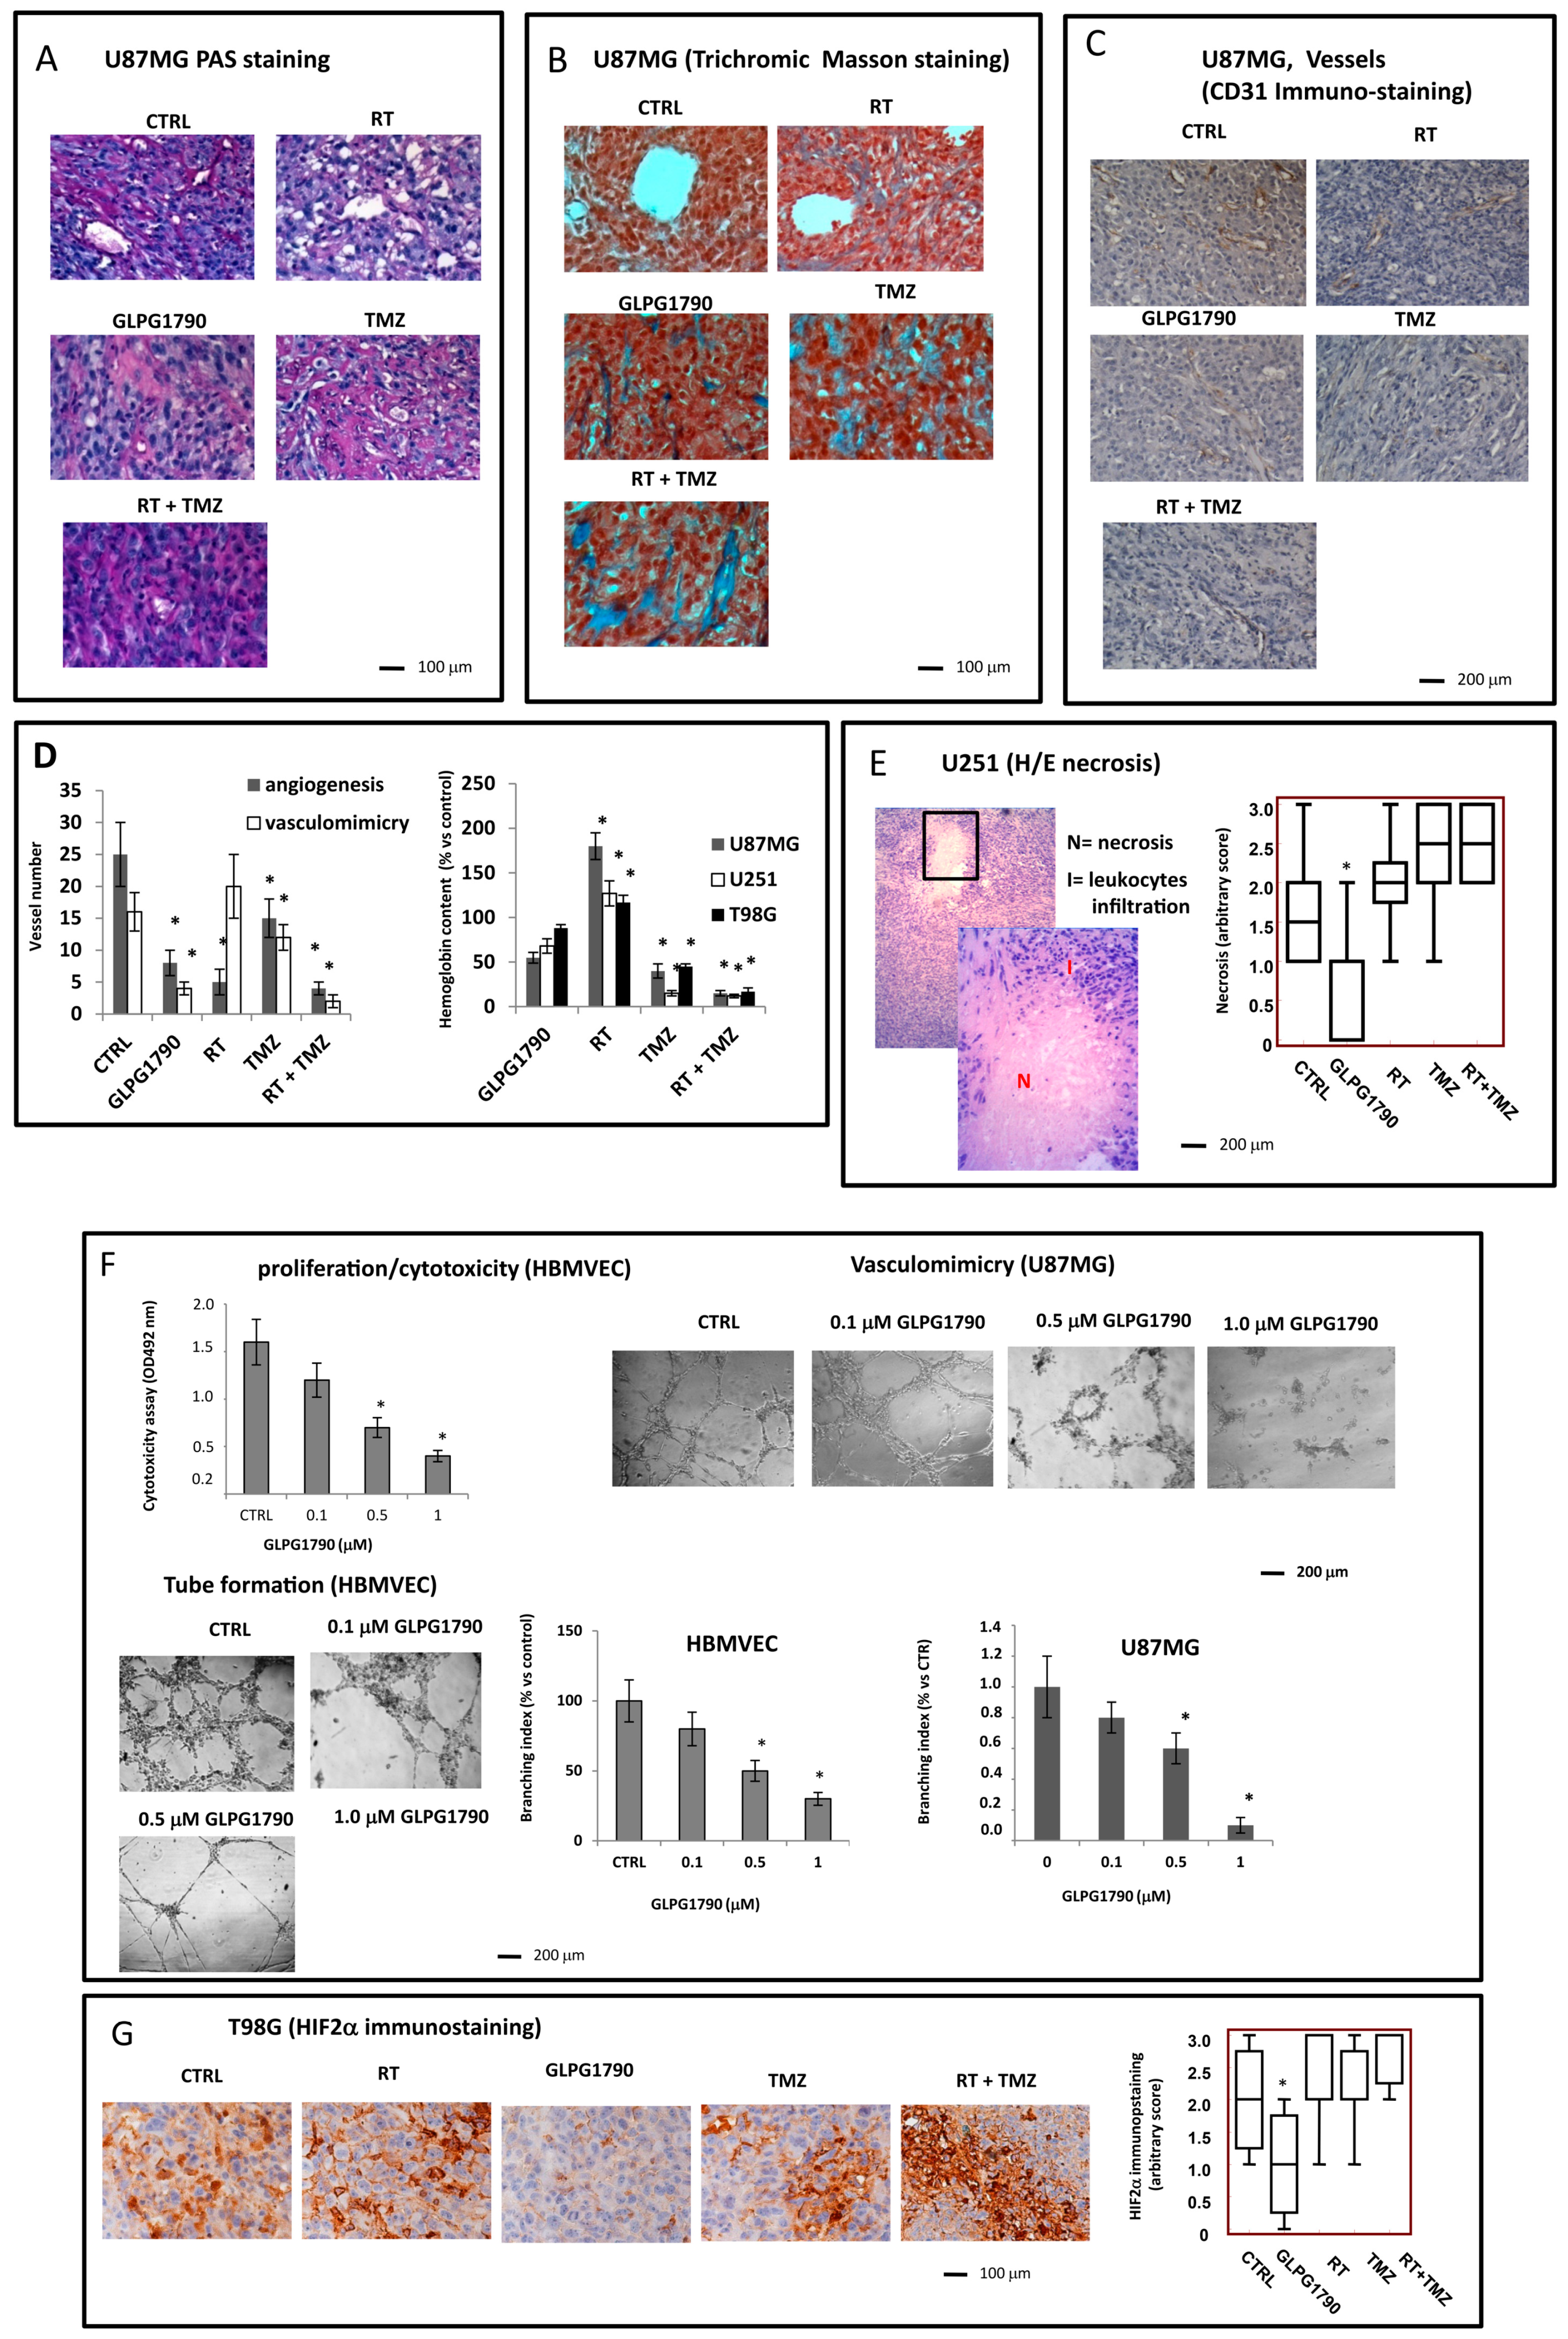
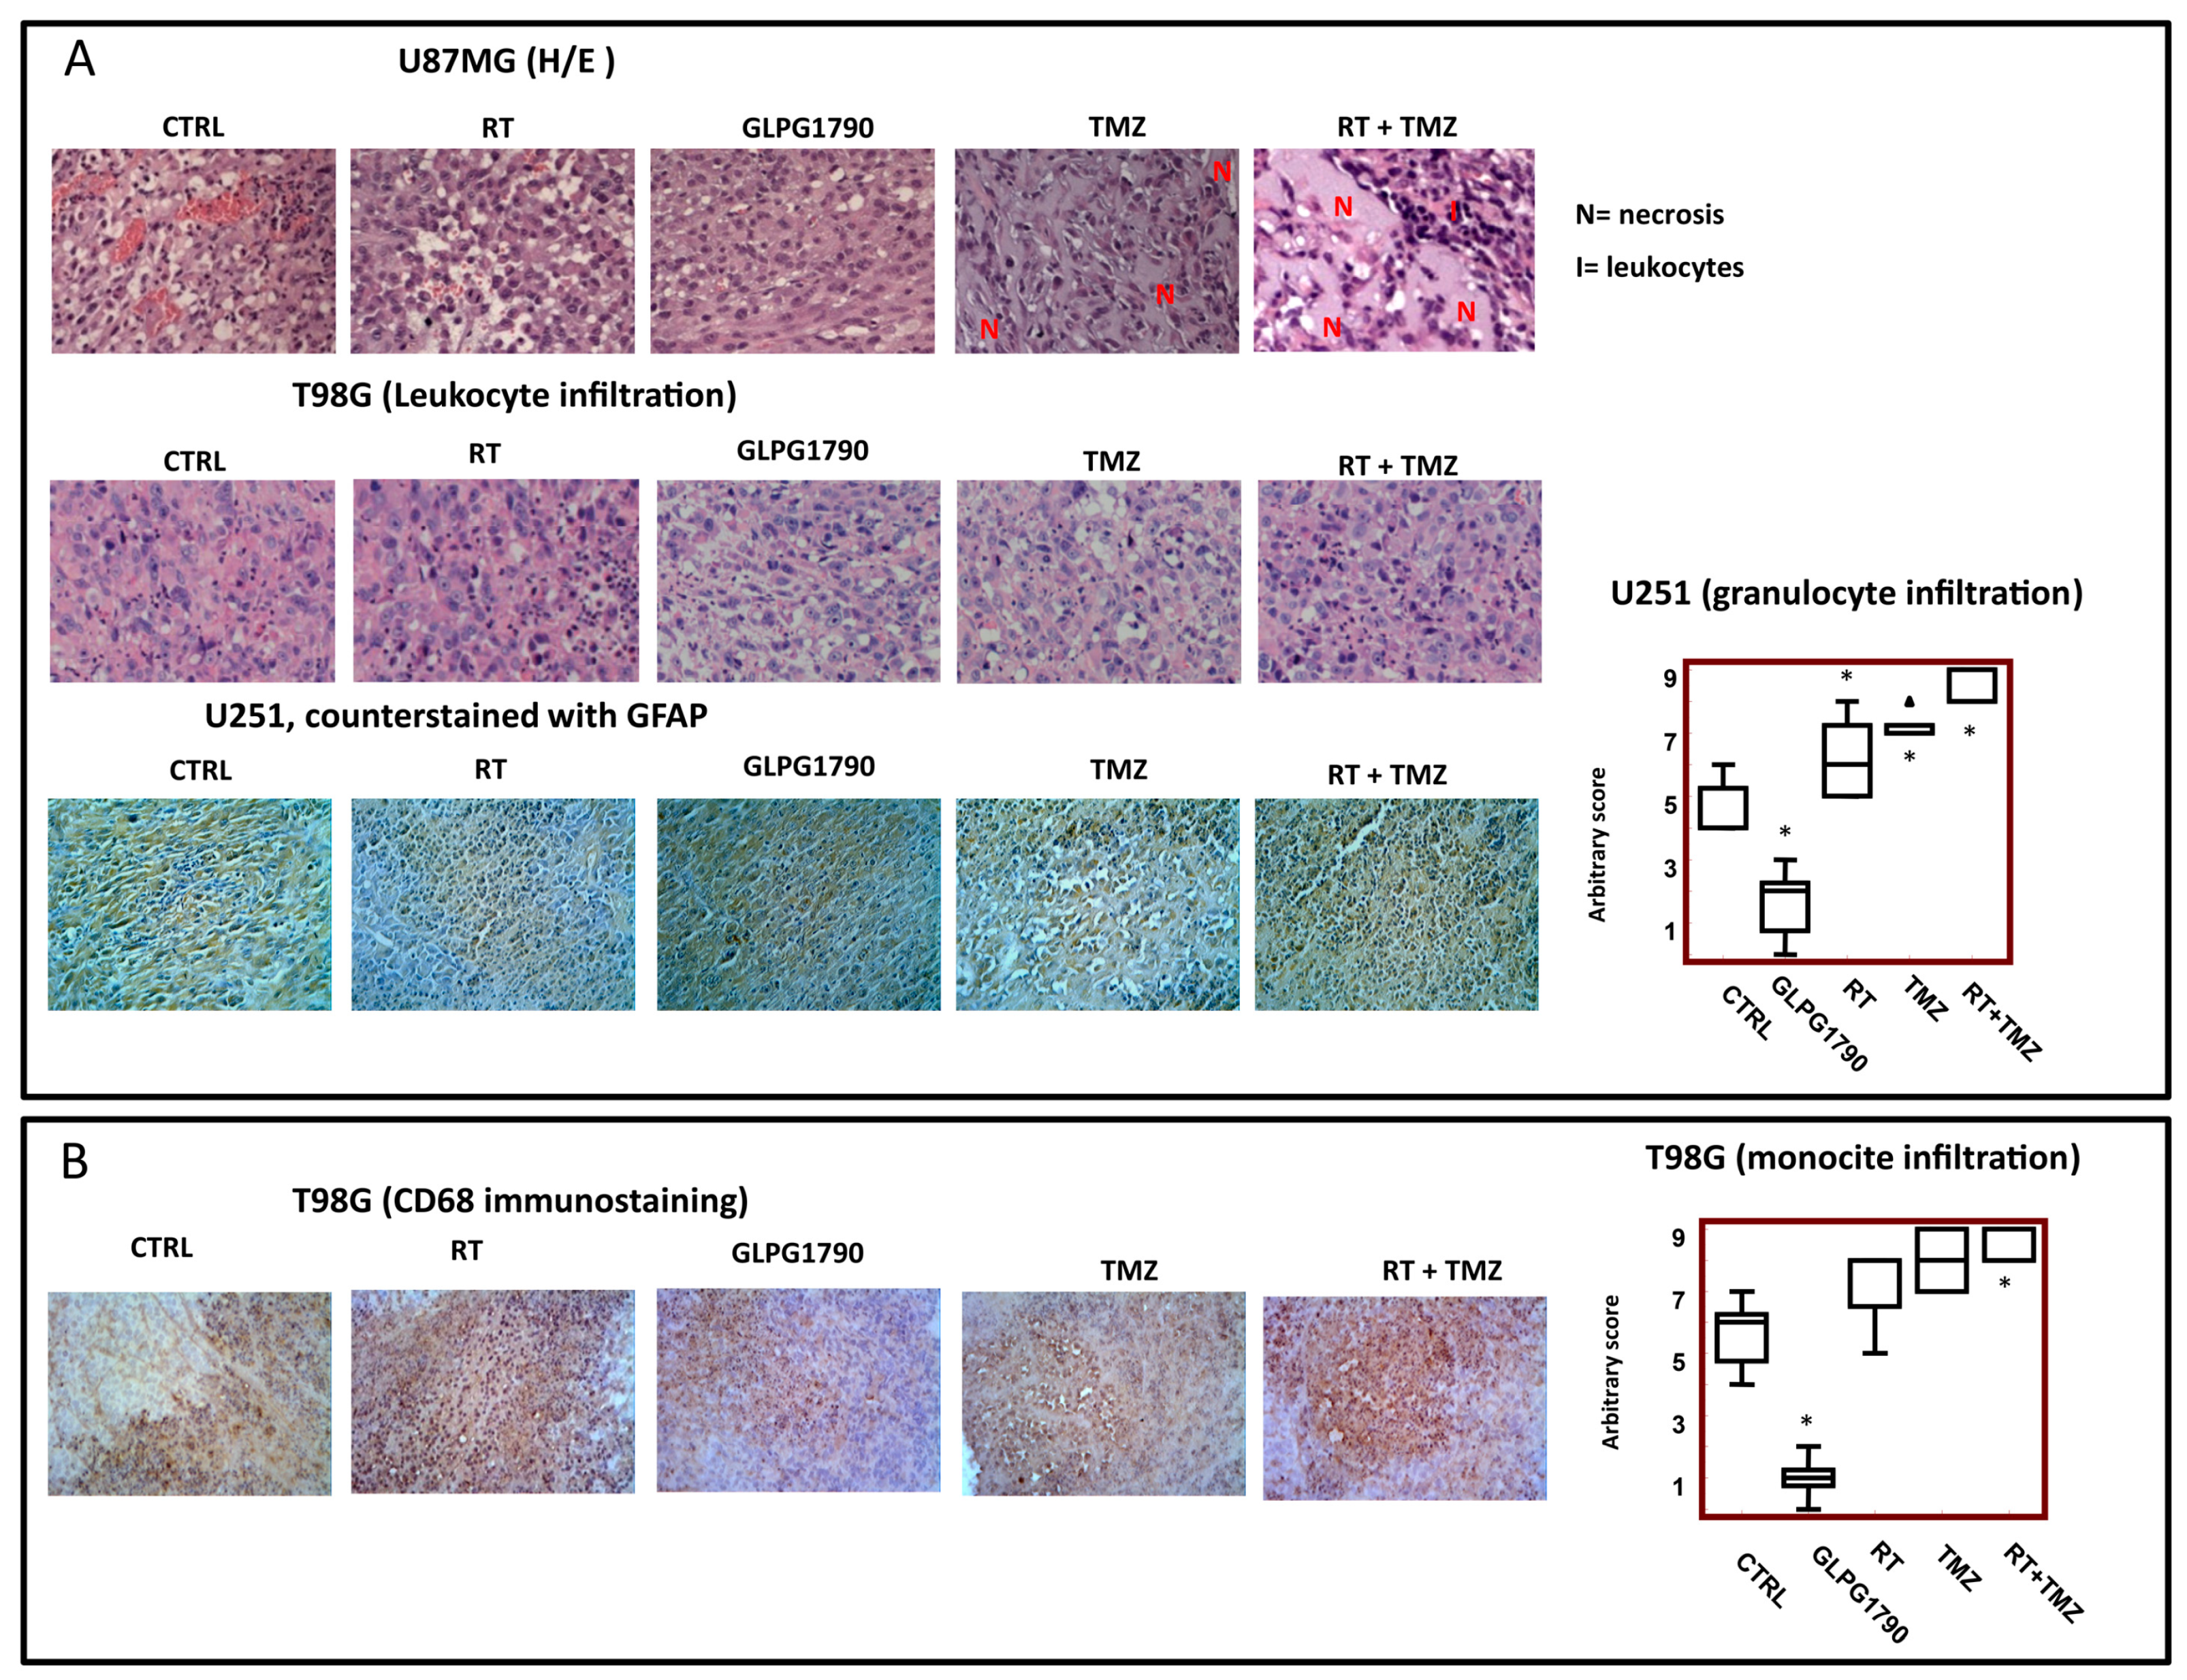
3.4. Histological Evaluation of GLPG1790 Treated Xenografts: Involvement of Tumour Microenvironment in the GLPG1790-Mediated Anti-Tumour Effects

Previously, we observed that different experimental xenograft models including GBMs were characterised by the presence of heterogeneous populations of tumour and inflammatory cells [40,41,42,43]. In addition, GBM xenografts contained giant cells, multinucleated cells and polygonal or spindle-shaped cells with abundant and intensely eosinophilic cytoplasm and hypochromatic nuclei. Tumour cells in rapid growth were dispersed on a fibrillar collagen background that enveloped abundant vasculature. From a morphological point of view, glioma xenografts did not undergo noticeable cellular changes after the administration of GLPG1790. Instead, we observed deep changes in the quality of the tumour microenvironment as modifications of: (i) angiogenesis and vasculomimicry (Figure 5A–D); (ii) necrosis (Figure 5E) and hypoxia-inducible factor 2α (HIF2α) immunostaining (Figure 5F); as well as (iii) tumour infiltration by leukocytes (Figure 5G). In particular, GLPG1790 administration reduced angiogenesis and vasculomimicry as demonstrated by periodic acid-Schiff (PAS) staining (Figure 5A), Masson’s trichrome staining (Figure 5B) and CD31 immuno-localization (Figure 5C), when compared to controls. Next, we used PAS staining to analyse angiogenesis and vasculogenic mimicry. We showed that vessels were equally distributed in control xenografts. By contrast, RT caused a switch from angiogenesis to vasculogenic mimicry. This event started with single medium-sized vessels and resulted in a significant reduction of overall vessel number (Figure 5C,D), as recently also observed in bevacizumab treated tumours [35]. This could be associated with endothelial cell damage in different portions of the vessel wall producing endothelial cell discontinuity. In this case, tumour cells oriented themselves towards the lumen of the vessel (intra-vascular mimicry, Figure 5A,B). Therefore, tumour cells were trying to give hardness to the vascular structure, which was straightened by a dense PAS-positive connective matrix. Small endothelial cell-free vascular lacunae were also present. GLPG1790 administration significantly reduced the number of medium/large-sized vessels as well as vascular lacunae distributed in PAS-positive regions. The vascular pattern was significantly reduced after GLPG1790 administration when compared to those observed for RT or TMZ; whereas, the number of vessels (Figure 5D) was lower with respect to tissues treated with RT+TMZ. These morphological results were related to hemoglobin content (Figure 5D). Table S2 summarises these angiogenetic and vasculomimicry differences. Tumour tissues from experimental GBM xenografts also showed areas of necrosis dispersed in the tumour parenchyma (Figure 5E), both in the central and peripheral portions. This appearance was not completely comparable to human gliomas since evident palisating necrosis was absent in experimental gliomas. This necrosis showed elevated leukocyte infiltration (Figure 5E). We also observed that GLPG1790 administration reduced the necrosis percentage, as indicated in Table S3. This seemed to be due to reduced tumour masses. RT, TMZ and RT+TMZ administration, being much more cytotoxic therapeutic procedures, showed higher necrosis due to increased tissue damage. The anti-vascular properties of GLPG1790 were tested in vitro by evaluating the vasculomimicry (VM) of U87MG cells and tubule formation of human brain derived endothelial cells (HBMVECs), as shown in Figure 5F. GLPG1790 reduced both phenomena in a dose-dependent manner. It had been widely demonstrated that necrosis was associated with increased hypoxia and here we showed high HIF2α immunostaining in peri-necrotic areas (Figure 5G), suggesting an involvement of hypoxia. In Table S4, we summarised immunostaining scores of both necrosis and HIF2α. Further molecular evaluations were in progress. One area of this study was to elucidate the association of GLPG1790 administration and the control of hypoxia in stem cell recruitment and recurrence. Temozolomide-treated tumours showed a lower level of leukocyte infiltration but higher necrosis and fibrosis compared to those treated with RT and GLPG1790. Infiltration of granulocytes (both neutrophils and eosinophils) and mono-nucleated blood cells (mainly monocytes) participated in the establishment and maintenance of local inflammation.
Leukocyte infiltration was concentrated both along the front of tumour cell growth, as well as dispersed among the tumour cell sheets (Figure 6A,B). The grade of this infiltration is shown in Table S4. Further molecular evaluations are in progress looking specifically at elucidating the association of GLPG1790 administration and the control of inflammation in stem cell recruitment and recurrence.

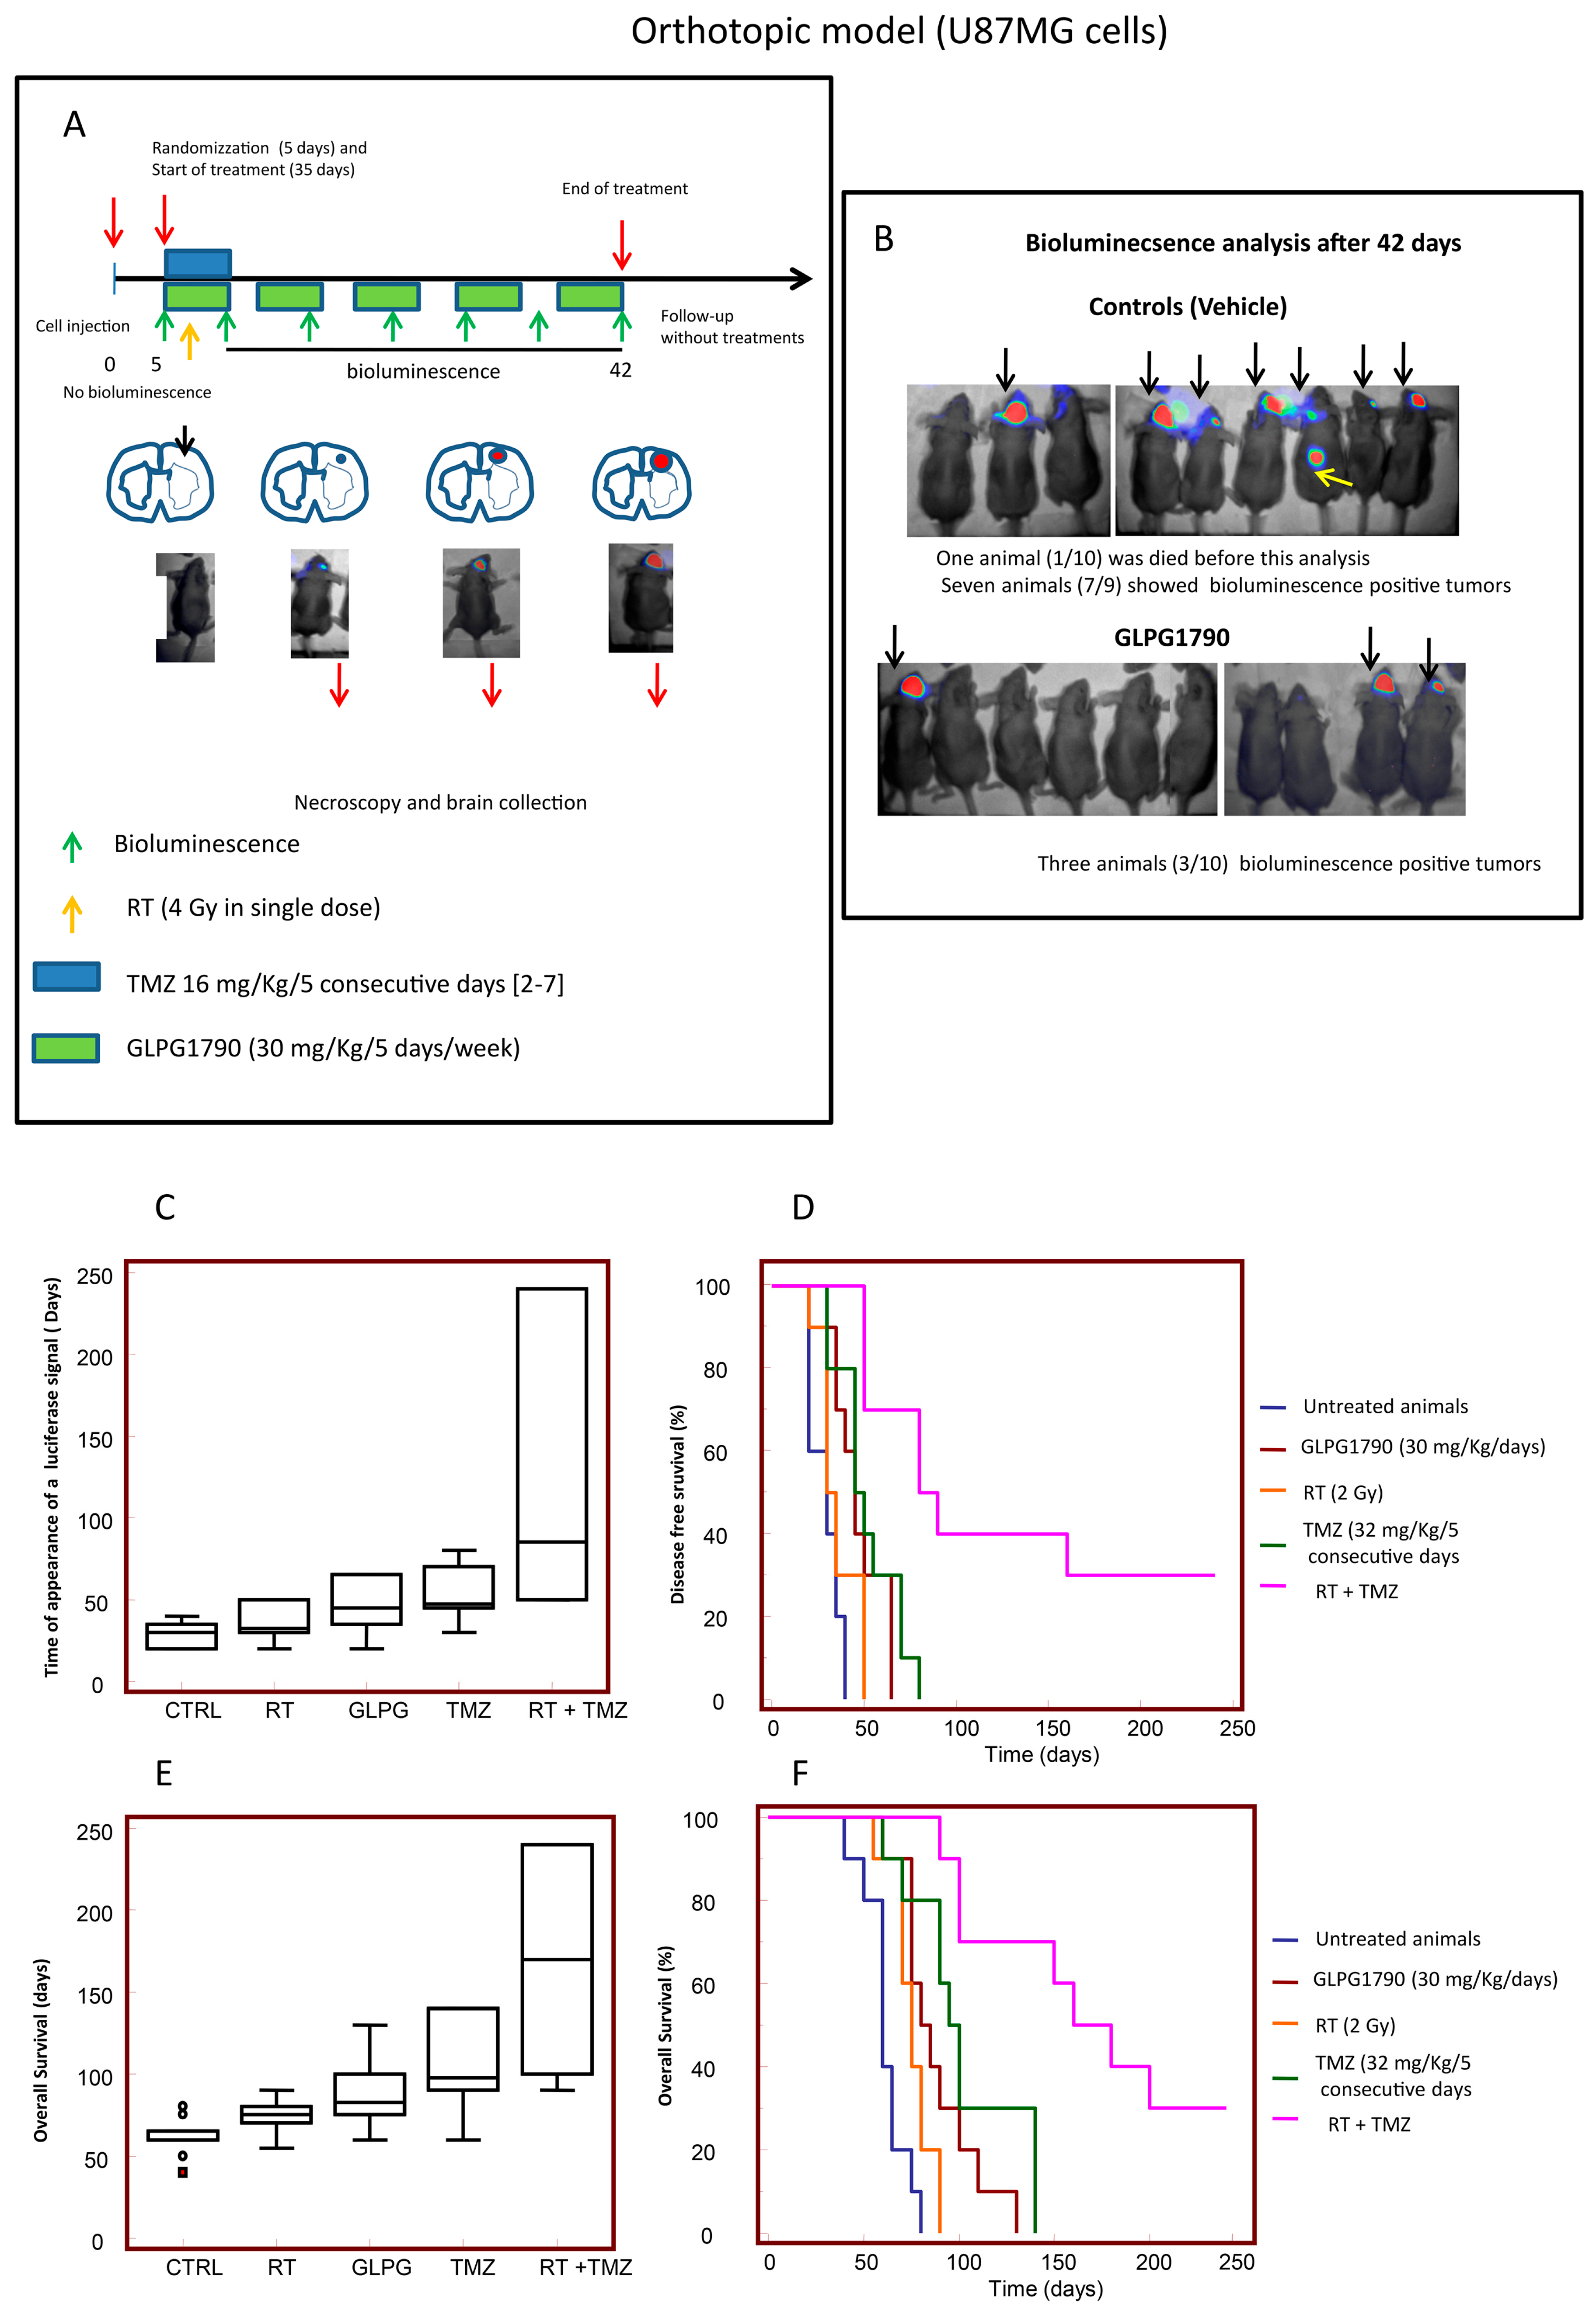
3.5. GLPG1790 Increased Disease-Free and Overall Survival in Orthotopic Intra-Brain Tumours as Determined by Using Differentiated U87MG Cells

The efficacy of GLPG1790 was investigated in mice with experimental brain tumours. We wanted to inoculate a small number of cells (3 × 10³) into the brain to simulate chemo and radio therapy treatment made after surgery. In such a case, a few tumour cells might remain in the operating bed. These cells would be able to re-grow and recur. We administered treatments after 5 days when no bioluminescence could be detected intracranially. Next, we treat animals for 35 days, with a maximum of 200 days of follow-up without drug administration (total 240 days).
In Figure 7A, we show a schedule of treatments with the animals having different amounts of bioluminescent signal. Bioluminescence was associated with low, intermediate and large intra-brain tumors at necroscopy. In Figure 7B, we show the signals obtained by using Alliance Mini HD6 system (Uvitec Ltd., Cambridge, UK), issued at 42 days from intra-brain cell inoculation in 7/9 mice (one animal had just died) of control and 3/10 of mice treated with GLPG1790. Parameters pertinent to our analyses were recorded, including: (i) tumour growth delay (the time at which a luciferase activity was intracranially detectable), indicating the recurrence time and equivalent to human parameter DFS; (ii) tumour progression through the analysis of bioluminescence imaging (BLI) photon counts and tumour volumes (calculated by magnetic resonance imaging, MRI); and (iii) the survival time (equivalent to human parameter OS) as indicated above. In Figure 7C we analyzed the time of appearance of luciferase signal equivalent of the Disease Free Survival (DFS) in mice injected with luciferase transfected U87MG. In particular control mice developed a bioluminescent lesion after 20–50 days with a mean of 29.0 ± 2.53 days and a median of 30.0 days (20.0–35.0 days, 95% CI); whereas, in GLPG1790-treated animals, the bioluminescence appeared after 20–65 days with a mean of 46.5 ± 4.53 (p = 0.0050 vs. the control) and a median of 45.0 days (35–65 days, 95% CI). RT showed a bioluminescent lesion from 20 to 50 days with a mean of 36.0 ± 3.15 (p = 0.1174 vs. the control and p = 0.0877 vs. GLPG1790) and a median of 32.5 days (30–50 days, 95% CI). The animals treated with TMZ showed recurrent tumours from 30 to 80 days with a mean of 52 ± 5.06 days (p = 0.0012 vs. control, p = 0.0202 vs. RT and p = 0.4523 vs. GLPG1790) and a median of 47.5 (45.0–70.0 days, 95% CI). Standard RT plus TMZ administration significantly delayed the insurgence of recurrent tumours from 50 to 240 days with a mean of 128 ± 25.1 (p = 0.0016 vs. control, p = 0.0028 vs. RT, p = 0.0114 vs. TMZ and p = 0.0072 vs. GLPG1790) and a median of 90 days (50.0–160.0 days, 95% CI). Next, we generated Kaplan–Meier curves (Figure 7D) and calculated the HRs for each experimental group. RT treatment showed a non-significant increase in terms of DFS with an HR = 1.67 (p = 0.1379) compared to untreated animals, whereas GLPG1790 (HR = 2.85, p = 0.0022), TMZ (HR = 3.38, p = 0.0003) and RT+TMZ (HR = 5.21, p < 0.0001) treatments significantly reduced the percentage of animals in progression. Although 30% of GLPG1790-treated animals showed bioluminescence during the course of treatment compared to 70% of RT-treated animals, Kaplan–Meyer curves indicated that the effects of GLPG1790 and RT were not significant different (Table S5). Similarly, no statistically significant differences were observed in the comparison between GLPG1790 and TMZ, where 10% of animals showed progression during the cycle of pharmacological treatment. By contrast, the combination RT+TMZ produced no animals in progression during the cycle of treatments, being statistically more active when compared with other single treatments, including GLPG1790. These results could indicate that: (i) the tumour growth rate in each tumour was not different between RT, TMZ or GLPG1790; and (ii) if the administration time had been repeated with further therapy cycles, the differences between these individual administrations could have become significant. Next, we assessed Overall Survival (OS) values (Figure 7E). Control mice were euthanised from 40 to 80 days with a mean of 61.5 ± 3.4 days and a median of 60.0 (60–65 days, 95% CI). GLPG1790-treated animals survived from 66 to 130 days with a mean of 88.0 ± 6.1 (p = 0.0021 vs. control) and a median of 82.5 days (75–100 days, 95% CI). RT-treated mice were euthanised from 55 to 90 days with a mean of 75.5 ± 3.1 (p = 0.0099 vs. control and p = 0.1019 vs. GLPG1790) and a median of 75 days (70–80 days, 95% CI). TMZ showed a significantly increased survival of animals from 60 to 140 days with a mean of 102.5 ± 8.64 days (p = 0.0005 vs. control, p = 0.0121 vs. RT and p = 0.2105 vs. GLPG1790) and a median of 100 days (90–140 days, 95% CI). RT plus TMZ administration showed increased survival of animals from 90 to 200 days with a mean of 170.0 ± 18.0 (p < 0.0001 vs. control and RT, p = 0.0049 vs. TMZ and p = 0.0007 vs. GLPG1790) and a median of 180 days (100–200 days, 95% CI). The analysis performed on Kaplan–Meier curves (Figure 7F) showed that a HR = 2.44 (p = 0.0147) for RT administration in the comparison with controls. Similarly, the efficacy of GLPG1790 (HR = 3.38; p = 0.0010), TMZ (HR = 3.65; p < 0.0001) and RT+TMZ (5.35; p < 0.0001) were significantly increased in term of OS versus controls. When GLPG1790 was compared with standard therapies, we found no significant differences. The combination therapy RT+TMZ was statistically more active when compared with the other single treatments, including GLPG1790. Once again, this suggested an advantage in using GLPG1790 in combination with RT or TMZ. Table S5 summarises the statistical analyses of orthotopic results with U87MG cells.

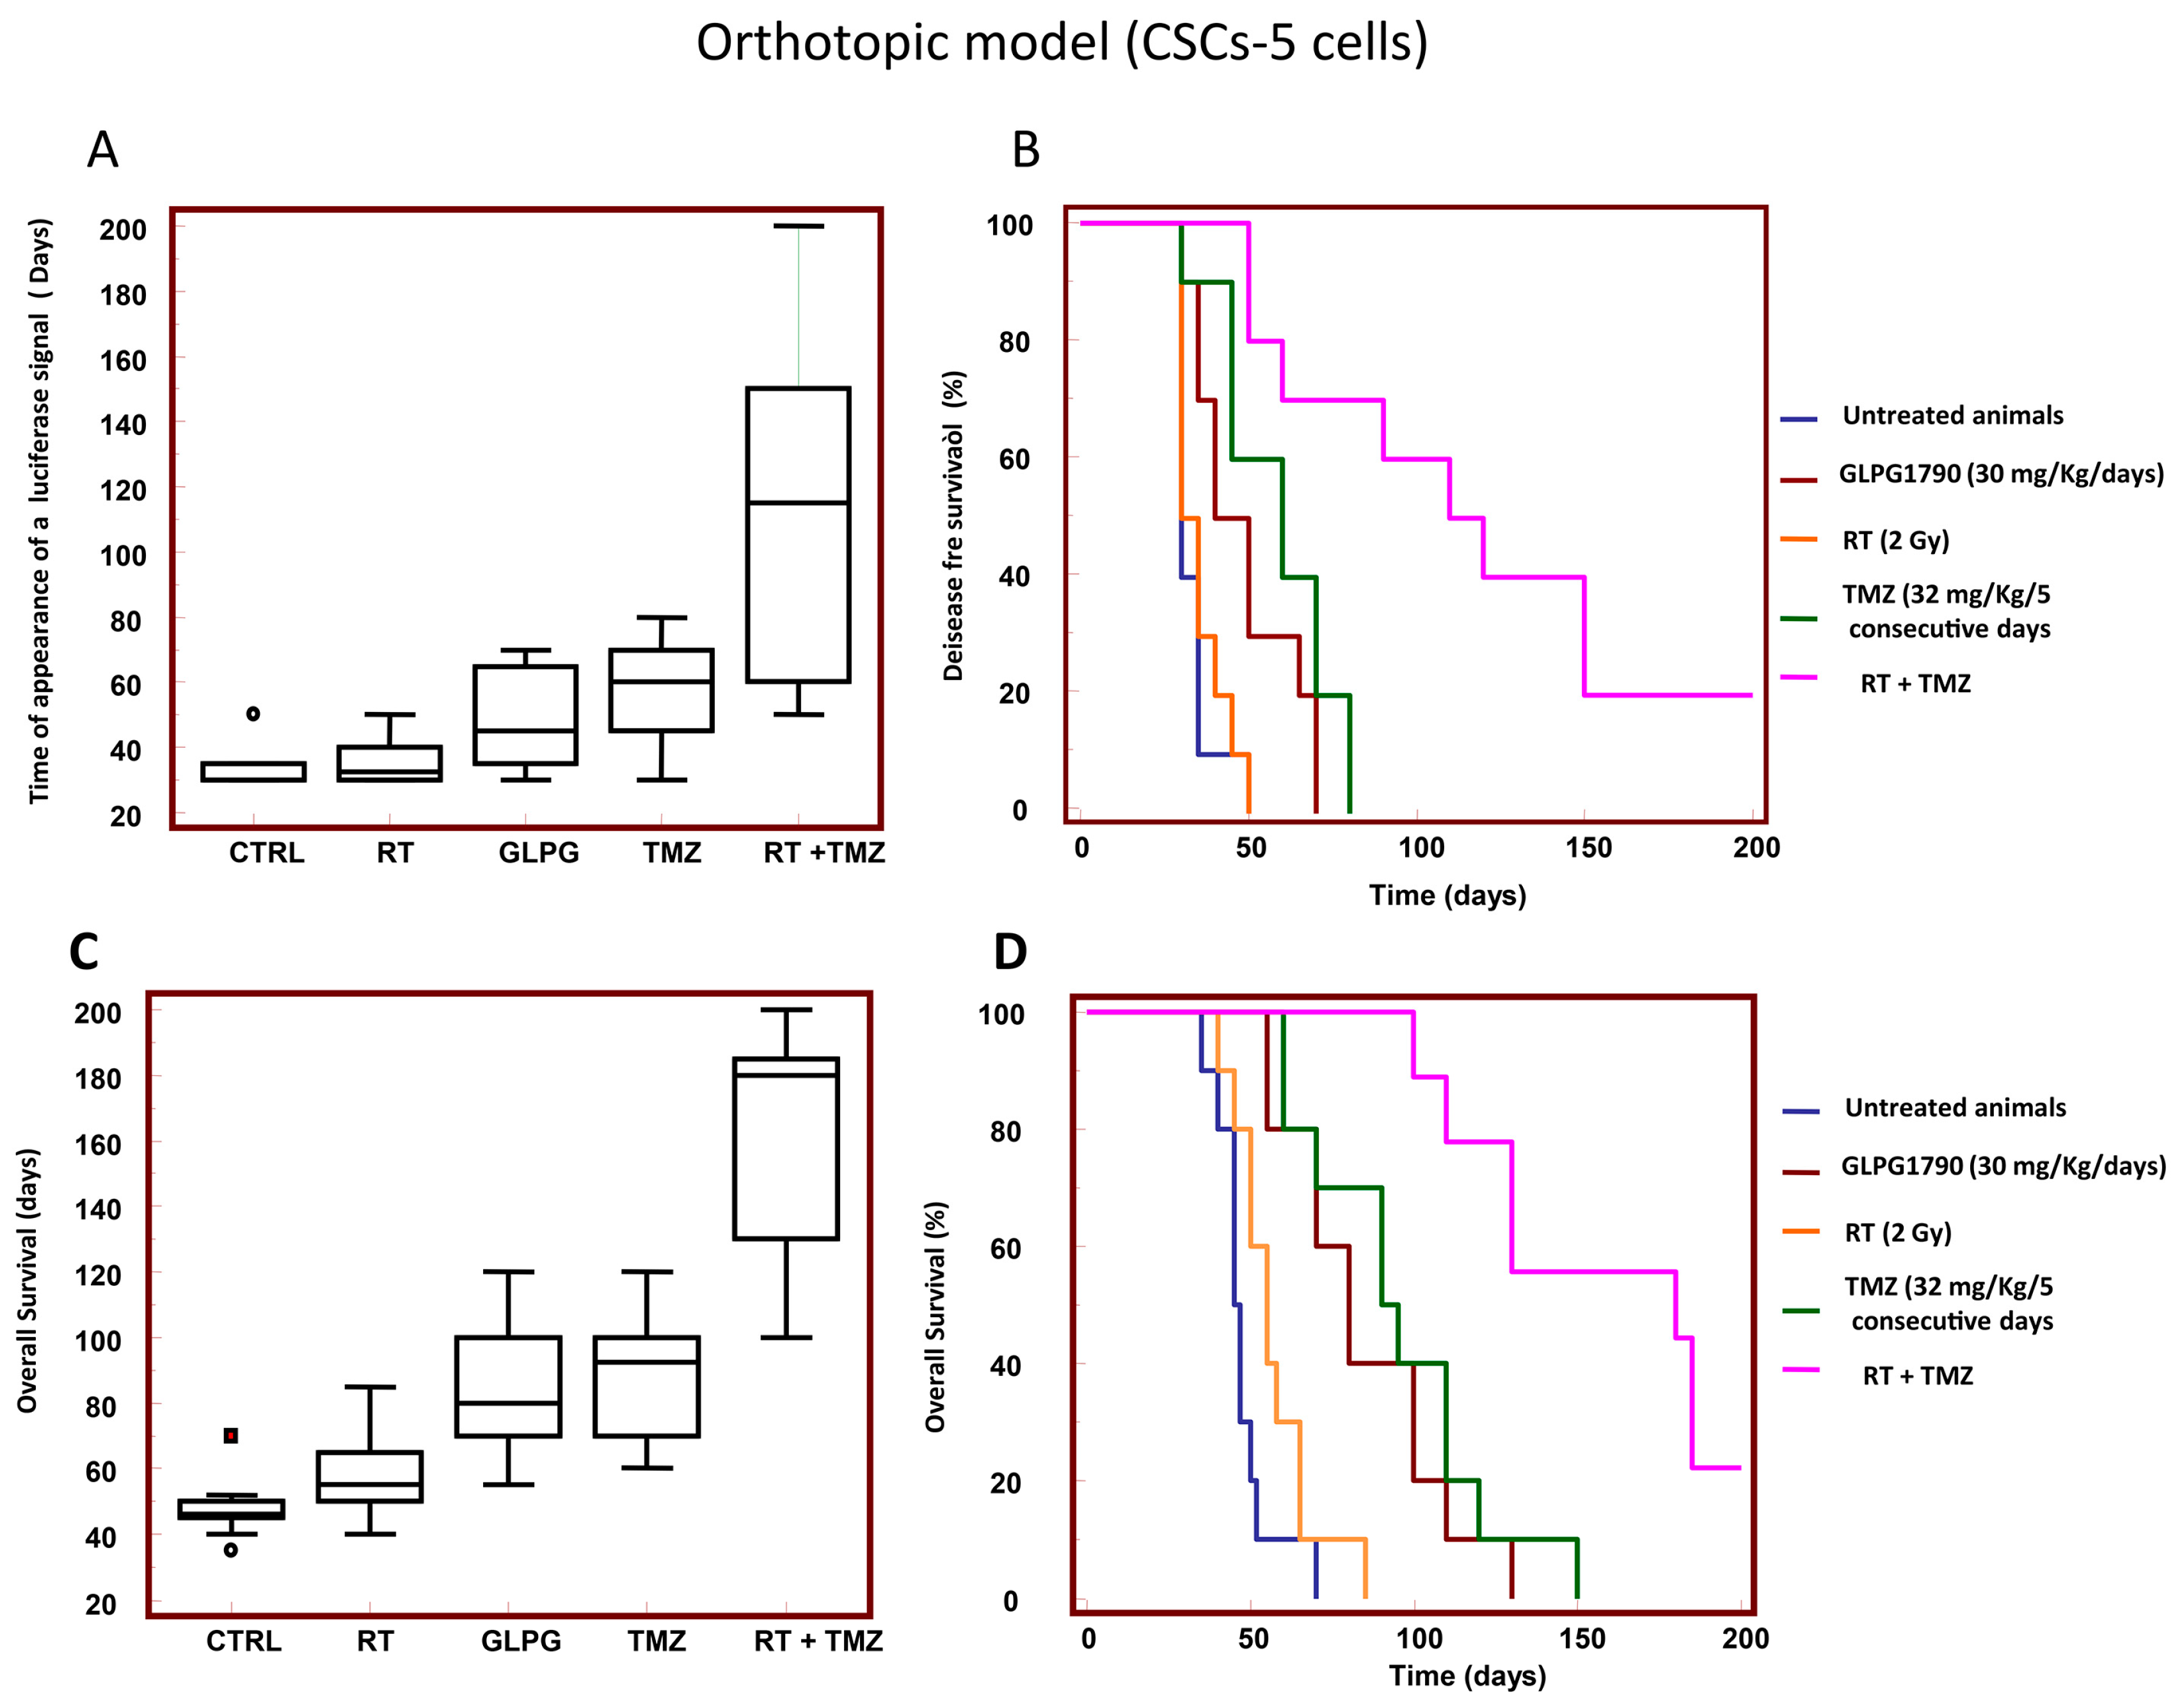
3.6. GLPG1790 Increased DFS and OS in Orthotopic Intra-Brain Tumours Generated from Patient Derived Stem-Like GSCs-5 Cells

We first evaluated the DFS in GCS-5 brain tumours. Controls developed a bioluminescent lesion from 30 to 50 days with a mean of 33.5 ± 1.9 days and a median of 30 days (30–35 days, 95% CI; Figure 8A,B). GLPG1790-treated animals developed a visible lesion between 30 and 70 days with a mean of 48.5 ± 4.5 days (p = 0.0324 vs. control) and a median of 45 days (35–65 days, 95% CI). RT showed a bioluminescent lesion from 30 to 50 days with a mean of 35.5 ± 2.2 days (p = 0.5172 vs. control and p = 0.0818 vs. GLPG1790) and a median of 32.5 days (30–40 days, 95% CI). TMZ showed a significant increase in the insurgency of recurrent tumours from 30 and 80 days with a mean of 58.5 ± 5.1 days (p = 0.0123 vs. control, p = 0.0290 vs. RT and p = 0.5140 vs. GLPG1790) and a median of 60 days (45–75 days, 95% CI).
RT plus TMZ administration increased the insurgency of recurrent tumours from 50 and 200 days with a mean of 118 ± 17.0 (p = 0.0002 vs. control and RT, p = 0.0016 vs. TMZ and p = 0.0009 vs. GLPG1790). Kaplan–Meier curves (Figure 8B) were generated and HR values were calculated. We observed that the RT treatment showed a non-significant increase in terms of DFS with an HR = 1.45 (p = 0.6491) compared to untreated animals, whereas GLPG1790 (HR = 2.45, p = 0.0060), TMZ (HR = 3.11, p = 0.0006) and RT+TMZ (HR = 4.20, p < 0.0001) significantly reduced the percentage of animals in progression. When GLPG1790 was compared with RT, we found that 30% of GLPG1790-treated animals showed a bioluminescence signal during the course of the treatment compared to 80% of RT-treated animals, and Kaplan–Meyer curves indicated the GLPG1790 effects (HR = 2.27, p = 0.0192) were significantly different to RT (Table S2). TMZ showed significantly higher effects in the comparison with RT treated animals (HR = 3.14, p = 0.0006), but not in comparison with GLPG1790 treated animals (HR = 1.75, p = 0.1421). The combination RT+TMZ showed no animals in progression during the cycle of treatments and this resulted in it being statistically much more active than any other single treatment, including GLPG1790. Figure 8C,D shows the OS of animals treated with single treatments. Controls were euthanised from 35 and 70 days with a mean of 47.6 ± 9.2 days and a median of 46 days (45–50 days, 95% CI). GLPG1790-treated animals survived from 55 to 130 days with a mean of 85.0 ± 7.3 (p = 0.0002 vs. control) and a median of 80 days (70–100 days, 95% CI). RT-treated mice were euthanised from 40 to 85 days with a mean of 56.8 ± 12.7 (p = 0.0802 vs. control and p = 0.0038 vs. GLPG1790) and a median of 55 days (50–65 days, 95% CI). TMZ showed a significant increase in survival of animals from 60 and 130 days with a mean of 95.5 ± 8.5 days (p < 0.0001 vs. control, p = 0.0004 vs. RT and p = 0.3742 vs. GLPG1790) and a median of 92.5 days, 95% CI). RT plus TMZ administration increased survival of animals to 90–240 days with a mean of 160.0 ± 12.1 (p < 0.0001 vs. control, RT, TMZ and GLPG1790) and a median of 180 days (130–185 days, 95% CI) Next, Kaplan–Meier curves were generated and HR values were calculated (Figure 8D). We observed that the RT treatment increased the OS with a HR = 2.00 (p = 0.0733) compared to untreated animals. Similarly, the efficacy of GLPG1790 (HR = 4.15; p < 0.0001), TMZ (HR = 4.30; p < 0.0001) and RT+TMZ (5.25; p < 0.0001) were significantly increased in term of OS. OS observed for GLPG1790 was significantly higher when compared to RT (HR = 3.04, p = 0.0027); however, it was similar when compared to TMZ (HR = 1.40, p = 0.4006) and lower when compared with RT plus TMZ administration (HR = 4.11, p = 0.0002).
A comparison of HRs showed that: (i) HR values for DFS were low and not significantly different (1.67 and 1.45, respectively), both in RT-treated patient-derived glioma, stem-like cells and differentiated U87MG cells; (ii) HR values for OS were slightly higher but not significant higher (2.44 and 2.00, respectively) in the same groups; (iii) GLPG1790 effects were higher, in terms of DFS (HR of 2.85 and 2.45, respectively) or OS (3.38 and 4.15, respectively), when compared to RT, in patient-derived glioma stem-like cells and differentiated U87MG cells; and (iv) TMZ showed higher HR values, though not significantly higher than GLPG1790, mainly in patient-derived, stem-like cells. Table S6 data summarises statistical analyses of orthotopic results with CSCs-5 cells. In addition, results on the effects of GLPG1790 obtained in combination with RT or temozolomide are collected for a further report that is in preparation.

4. Discussion

Recent studies indicate that GBMs initiate from a small population of GSCs that are committed to proliferate, namely GICs. This population maintains the stem cell’s ability of self-renewal, as well as the ability to modulate, through stem cell signal transduction pathways, different aspects of the malignancy, such as tumourigenicity, local invasion/metastasis and resistance to anticancer drugs [26,27]. Conventional therapies mainly induce death of the differentiated cancer cells. Therefore, a forced differentiation of GICs could increase the percentage of cells that can be targeted by these therapies. This is an interesting and new approach for cancer treatment today. As such, the reactivation of endogenous differentiation programs tends to eliminate stem-like cell phenotypes in a tumour mass, reducing resistance to therapy and tumour recurrence. In addition, differentiation agents show less toxicity than conventional cancer treatments, though their pharmacological efficacy seems to be limited. However, novel compounds targeting cancer stem cells are in preclinical and clinical trials. It has been demonstrated that EphA2 [21], EphA3 [22] and EphB4 [23] are associated with GBM progression, and modulate glial and neuronal differentiation. In addition, overexpression of EphA2 promotes glioma cell migration and local invasion [44], and coincides with cancer stem cell renewal [28,44,45]. Small molecule inhibitors [46,47], monoclonal antibodies [48] or antagonists [49,50] of these receptors have been developed and they have shown encouraging results.
In a previous report, we described the anti-tumour effects of a pan Eph receptor antagonist, UniPr1331 [35], which is able to block both the reverse and forward signaling. In this current study, we studied GLPG1790, a novel small molecule targeting the intracellular kinase domain, as a forced differentiation agent in GBM preclinical models. GLPG1790 shows a pan Eph receptor activity with a range of 1 (EphB2) to 77 (EphA1) nM for affinities on isolated proteins [29] and a good oral bio-availability, being able to cross the blood brain barrier. GLPG1790 was not previously tested for EpHA3 inhibition, whereas it shows an affinity for EphB4 of 22 nM and for EphA2 of 11 nM [39]. Nevertheless, here we analysed the basal expression of EphA3, EphA2 and EphB4 in two different GIC cultures corresponding to mesenchymal phenotype (BT48EF and BT12M), as well as in two glioma cell models (U87MG and U251). Next, we also analysed the inhibition activity versus phosphotyrosines on whole cells treated with different doses of GLPG1790 and 0.25 μg/mL of ephrin-A1 (ligand of EphA2) and ephrin-B2 (ligand of both EphA3 and EphB4) with IC50 values ranged between 200 nM (BT12M) and 348 nM (U87MG) while EphA2 (p-Tyr) activity was inhibited with IC50 values that ranged between 115 nM (BT12M) and 189 nM (BT48EF) in the same assays.
Previously, this compound was shown to reduce the proliferation of human rabdo-myosarcoma [28]. where it induces muscle cell differentiation. Here, we hypothesized that GLPG1790 would be able to revert GICs towards a less aggressive and easier to treat tumour phenotype. Therefore, we analysed the expression of stem and differentiation markers in patient-derived glioma stem-like cells after the administration of GLPG1790. We observed that GLPG1790 was able to reduce stem cell renewal and the growth of glioma spheres. GLPG1790 also induced cell detachment from sphere cultures. The number of single cells was increased in a dose-dependent manner, and maximally between 1.0 and 5.0 μM. A cohort of stem cell markers (CD44, Sox2, Oct3/4, Nestin, Stro-1, CD90 and CD105) was down-modulated using GLPG1790 at low doses (0.5 and 1.0 μM). By contrast, differentiation markers (βIII Tubulin/Tuj1, neurofilaments and GFAP) were increased. In particular, CD44 expression was reduced as assessed using western blotting and the percentage of cells was reduced as determined by FACS. Several data present in the literature indicate that CD44 is essential for both cell stemness and the proliferation of GICs [51,52]. CD44 signaling, which is obtained via ligation of different substrates including osteopontin (OPN) and αvβ3 and αvβ5 integrins, has recently been implicated in the stem cell phenotype associated with a lower expression of differentiation marker (GFAP and/or βIII tubulin/Tuj1) and a higher level of sphere formation and expression of stem cell markers (CD133, nestin and Oct4). Therefore, CD44 might be considered a true stem cell marker since reduction of its expression reduced self-renewal and induced cell proliferation and differentiation of committed cells. In addition, CD44 ligation increases DNA repair and impacts GBM radio-sensitivity [53].
A reduction of stemness is also associated with a reduction of CD90 (Thy1). This marker is responsible for cell pluripotency and exhibits key properties of cancer initiating cells (CICs), such as proliferation, differentiation, spheroid formation and tumourigenicity in immuno-deficient mice. CD90 expression is high in high-grade gliomas, whereas it is extremely low in low-grade gliomas or normal brains [54]. CD90 expression is reduced during cell differentiation. In GBM, CD90 positive cells cluster proximally to the tumour vasculature. In addition, this marker is associated with therapy-resistant, quiescent and pluripotent cell populations. CD90 may be considered as a potential prognostic marker mainly because it resides within an endothelial niche where it may play critical roles in vasculature maintenance via VM or differentiation into endothelial cells. Here, we observed that the expression of different stem cell markers was reduced after GLPG1790 administration, including SOX-2, a marker necessary for the maintenance of stem cell features [55], and Oct3/4, another self-renewal regulator in stem cells in GBM [56,57], which up regulates focal adhesion kinase (FAK) and c-Src expression. Nestin characterises immature neural stem cells and promotes tumour cell proliferation, migration, and invasion of GBM, correlating with histological grade and poor survival [58]. We observed that after GLPG1790 treatment, nestin expression was significantly reduced in BT12M cells, whereas the changes were minimal in BT48EF cells. The expression of CD105 [59] (endoglin) is often associated to increased VM. This marker is overexpressed in the endothelial niche. We observed that GLPG1790-induced variations in CD105 expression were significantly related to reduced VM. Next, we found that expression of β-tubulin III/Tuj1 and neuro-filaments, as well as GFAP, was significantly increased after GLPG1790 administration. Although these markers are considered to be associated to neuronal and astrocyte differentiation, respectively, some reports indicated that Tuj1 correlates with malignancy, high proliferative rates and poor prognosis of GBM [60]. In addition, consistent with other reports, GBM neurospheres express high levels of GFAP [61].
In vivo experiments indicated that GLPG1790 reduced tumour growth of three different GBM xenografts. The comparison with standard radio-, chemo- or radio and chemo therapy shows that GLPG1790 effectiveness was higher than that observed for RT, lower with respect to temozolomide in U87M and U251, and higher compared to TMZ in O6-methylguanine-DNA methyltransferase (MGMT)-positive T98G cells. In addition, GLPG1790 increased DFS and OS in orthotopic intra-brain tumours generated from patient-derived luciferase tagged stem-like GSCs-5 cells. In comparison with RT, GLPG1790 effectiveness in the intra-brain model was much more elevated compared to that observed in xenografts. Compared with TMZ, GLPG1790 administration showed similar efficacy. Nevertheless, the effectiveness of GLPG1790 was lower to that observed for the RT plus TMZ administration. This difference between the treatments was more reduced in the cerebral model when compared to the subcutaneous model. In addition, immunohistochemical analyses indicated that GLPG1790 affected the quality of the tumour microenvironment, which showed to also have a tumour-supportive character. Tumours with necrotic regions had an inadequate blood supply, promoting a local increase in vasculogenesis. This was also associated with impaired blood vessels that had elevated vascular blending, hemorrhage and thrombosis. Although EphrinB2/EphB4 pathway is important in the regulation of postnatal angiogenesis showing a potential therapeutic target for ischemic cardiovascular disease [62], vasculogenic processes including the vascular mimicry are process in which the major role is played by EphA2. In aggressive solid tumors including GBM, it has been demonstrated that vasculogenic mimicry is dependent on the VE-cadherin/EphA2/MMP9/MMP2 axis [63], as well as being mediated by the activity of the EphA2/focal adhesion kinase/paxillin signaling pathway [64].
As a result, these effects amplify GBM tissue damage contributing to inflammation and ischemia. It is widely considered that human GBM trigger strong pro-immunogenic effects with elevated recruitment of granulocytes. Neutrophils are the first cells recruited to inflammatory sites, constituting an important component of the tumour stroma and where they may have both anti-tumoral and pro-tumoral activities. The imbalance of these activities modulates the appearance of drug resistance to anti-angiogenic therapies [40,41,42,43]. Similarly, eosinophils are able to produce neuro-mediators, pro-inflammatory cytokines and pro-fibrotic and angiogenic factors involved in tissue remodeling and repair. Resident macrophages and circulating monocytes may also infiltrate the surrounding necrotic areas, continuing to release inflammatory cytokines and sustaining inflammation.
Previous reports indicate that the Eph/ephrin system is involved in the regulation of inflammation [65,66]. Indeed, EphA2 expression is associated in atherosclerotic plaque formation [67]. Ephrin-A1 is upregulated in inflammatory vasculature and EphA2/ephrin-A1, regulates transendothelial migration/tissue infiltration of monocytes/macrophages. Therefore, EphA2 inhibition might reduce chronic inflammation [66]. In our experience, GLPG1790 reduced angiogenesis, necrosis and inflammation. By contrast, RT and TMZ-based chemotherapy, being much more cytotoxic procedures, increased tissue damage of vascular structures, tumour mass and healthy tissue. As such, this resulted in the establishment and maintenance of local inflammation, which in turn, sustained further necrosis and hypoxia, recruiting GSCs glioma stem cells and may have participated in tumour recurrence. Further molecular evaluations aim to elucidate the association of GLPG1790 administration with the control of hypoxia in stem cell recruitment as well as with the control of inflammation in tumour recurrence. No specific experiments to record toxicology data were performed. However, in the experiments presented here, we found no differences in weight wasting. The animals with intracranial tumors treated with GLPG showed a better quality of life linked to the reduced cachecsia associated with reduced tumor growth and brain edema. However, when tumors reached critical values, the quality of life parameters dropped and animals were euthanatised.

5. Conclusions

Our data suggested that GLPG1790 possessed satisfactory anti-tumour effects, regulating both the differentiation status of GICs and the quality of the tumour microenvironment. Of particular importance was its ability to reduce tissue damage that was the main cause of the maintenance of local inflammation, recruitment of cancer stem cells and tumour recurrence. Lower local inflammation may have also been important for the reduction of edema, which is the cause of the main symptoms of GBM. In addition, GLPG1790 administration showed low toxic side effects. Altogether, these data support the use of GLPG1790 for clinical trials in GBM patients. Further experimentation is needed to study possible interactions with radio- and chemotherapy, and preliminary results from our studies indicate that GLPG1790 showed sensitizing effects with RT and temozolomide.

Supplementary Materials

The following are available online at https://0-www-mdpi-com.brum.beds.ac.uk/2072-6694/11/3/359/s1, Table S1: Hazard ratios for the single therapies (subcutanous xenografts), Table S2: GLPG1790 reduced vasculogenesis, Table S3: GLPG1790 reduced hypoxic areas, Table S4: GLPG1790 reduced leuocytes infiltration, Table S5: Hazard ratios for the single therapies (subcutanous xenografts), Table S6: Hazard ratios for the single therapies (CSCs5 cell orthotopic model).

Author Contributions

C.F.: Conceptualisation, formal analysis, investigation, performed the experiments, data evidence collection, provided resources, data care, writing, review and editing, visualisation, supervision, project administration and funding acquisition. G.L.G.: Conceptualisation, formal analysis, data evidence collection, provided resources, data care, writing, review and editing, visualisation, supervision and funding acquisition. A.M.: formal analysis, investigation (animal manipulation and drug administration, data evidence collection and data care). A.C.: cell cultures, biochemical analyses and immunohistochemical evaluations. S.D.M.: angiogenetic assays and analyses of data. F.V.: Investigation (orthotopic cell injection). S.M.: FACS analyses and Data care. L.C.: confocal analyses and Data care. F.M.: formal analysis and data care. V.M.: Resources, writing, review and editing and funding acquisition. F.B.: Investigation and data evidence collection. P.P.: Investigation and data evidence collection. L.S.: Conceptualisation, data evidence collection, data care, writing, review and editing. G.L.: Resources, writing, review and editing. E.v.d.A.: Conceptualisation, writing, review and editing.

Funding

This work was partially supported by a research contract with Galapagos Sasu and by the ALCLI “Giorgio e Silvia” Non-profit Association.

Acknowledgments

We are grateful to the Umberto Veronesi Foundation for awarding a post-doctoral fellowship to Francesco Marampon.

Conflicts of Interest

Filip Berincx, Philippe Pujuguet, Laurent Saniere, Ellen Vab der AAR and Giocondo Lorenzon are employers of Galapagos Sasu.

References

  1. Gittleman, H.; Boscia, A.; Ostrom, Q.T.; Truitt, G.; Fritz, Y.; Kruchko, C.; Barnholtz-Sloan, J.S. Survivorship in Adults with Malignant Brain and other Central Nervous System Tumor from 2000–2014. Neuro Oncol. 2018. [Google Scholar] [CrossRef] [PubMed]
  2. Chen, Z.; Hambardzumyan, D. Immune Microenvironment in Glioblastoma Subtypes. Front. Immunol. 2018, 9, 1004. [Google Scholar] [CrossRef] [PubMed]
  3. Bougnaud, S.; Golebiewska, A.; Oudin, A.; Keunen, O.; Harter, P.N.; Mäder, L.; Azuaje, F.; Fritah, S.; Stieber, D.; Kaoma, T.; et al. Molecular crosstalk between tumour and brain parenchyma instructs histopathological features in glioblastoma. Oncotarget 2016, 7, 31955–31971. [Google Scholar] [CrossRef] [PubMed] [Green Version]
  4. Huang, Y.; Rajappa, P.; Hu, W.; Hoffman, C.; Cisse, B.; Kim, J.H.; Gorge, E.; Yanowitch, R.; Cope, W.; Vartanian, E.; et al. A proangiogenic signaling axis in myeloid cells promotes malignant progression of glioma. J. Clin. Investig. 2017, 127, 1826–1838. [Google Scholar] [CrossRef]
  5. Zanotto-Filho, A.; Gonçalves, R.M.; Klafke, K.; de Souza, P.O.; Dillenburg, F.C.; Carro, L.; Gelain, D.P.; Moreira, J.C. Inflammatory landscape of human brain tumors reveals an NFκB dependent cytokine pathway associated with mesenchymal glioblastoma. Cancer Lett. 2017, 390, 176–187. [Google Scholar] [CrossRef] [PubMed]
  6. Li, M.; Song, X.; Zhu, J.; Fu, A.; Li, J.; Chen, T. The interventional effect of new drugs combined with the Stupp protocol on glioblastoma: A network meta-analysis. Clin. Neurol. Neurosurg. 2017, 159, 6–12. [Google Scholar] [CrossRef] [PubMed]
  7. Guo, X.; Xu, S.; Gao, X.; Wang, J.; Xue, H.; Chen, Z.; Zhang, J.; Guo, X.; Qian, M.; Qiu, W.; et al. Macrophage migration inhibitory factor promotes vasculogenic mimicry formation induced by hypoxia via CXCR4/AKT/EMT pathway in human glioblastoma cells. Oncotarget 2017, 8, 80358–80372. [Google Scholar] [CrossRef] [Green Version]
  8. Huang, W.J.; Chen, W.W.; Zhang, X. Glioblastoma multiforme: Effect of hypoxia and hypoxia inducible factors on therapeutic approaches. Oncol. Lett. 2016, 12, 2283–2288. [Google Scholar] [CrossRef] [PubMed] [Green Version]
  9. Du, R.; Lu, K.V.; Petritsch, C.; Liu, P.; Ganss, R.; Passegué, E.; Song, H.; Vandenberg, S.; Johnson, R.S.; Werb, Z.; et al. HIF1alpha induces the recruitment of bone marrow-derived vascular modulatory cells to regulate tumor angiogenesis and invasion. Cancer Cell 2018, 13, 206–220. [Google Scholar] [CrossRef]
  10. Holohan, C.; Van Schaeybroeck, S.; Longley, D.B.; Johnston, P.G. Cancer drug resistance: An evolving paradigm. Nat. Rev. Cancer. 2013, 13, 714–726. [Google Scholar] [CrossRef]
  11. Lim, E.J.; Suh, Y.; Yoo, K.C.; Lee, J.H.; Kim, I.G.; Kim, M.J.; Chang, J.H.; Kang, S.G.; Lee, S.J. Tumor-associated mesenchymal stem-like cells provide extracellular signaling cue for invasiveness of glioblastoma cells. Oncotarget 2017, 8, 1438–1448. [Google Scholar] [CrossRef] [PubMed]
  12. Kioi, M.; Vogel, H.; Schultz, G.; Hoffman, R.M.; Harsh, G.R.; Brown, J.M. Inhibition of vasculogenesis, but not angiogenesis, prevents the recurrence of glioblastoma after irradiation in mice. J. Clin. Investig. 2010, 120, 694–705. [Google Scholar] [CrossRef] [PubMed] [Green Version]
  13. Sattiraju, A.; Sai, K.K.S.; Mintz, A. Glioblastoma Stem Cells and Their Microenvironment. Adv. Exp. Med. Biol. 2017, 1041, 119–140. [Google Scholar] [PubMed]
  14. Wang, P.; Lan, C.; Xiong, S.; Zhao, X.; Shan, Y.; Hu, R.; Wan, W.; Yu, S.; Liao, B.; Li, G.; et al. HIF1α regulates single differentiated glioma cell dedifferentiation to stem-like cell phenotypes with high tumorigenic potential under hypoxia. Oncotarget 2017, 8, 28074–28092. [Google Scholar] [PubMed] [Green Version]
  15. Gauden, A.J.; Hunn, A.; Erasmus, A.; Waites, P.; Dubey, A.; Gauden, S.J. Combined modality treatment of newly diagnosed glioblastoma multiforme in a regional neurosurgical centre. J. Clin. Neurosci. 2009, 16, 1174–1179. [Google Scholar] [CrossRef] [PubMed]
  16. Day, B.W.; Stringer, B.W.; Boyd, A.W. Eph receptors as therapeutic targets in glioblastoma. Br. J. Cancer 2014, 111, 1255–1261. [Google Scholar] [CrossRef] [PubMed]
  17. Yin, Y.; Yamashita, Y.; Noda, H.; Okafuji, T.; Go, M.J.; Tanaka, H. EphA receptor tyrosine kinases interact with co-expressed ephrin—A ligands in cis. Neurosci. Res. 2004, 48, 285–296. [Google Scholar] [CrossRef] [PubMed]
  18. Saha, N.; Robev, D.; Mason, E.O.; Himanen, J.P.; Nikolov, D.B. Therapeutic potential of targeting the Eph/ephrin signaling complex. Int. J. Biochem. Cell Biol. 2018, 105, 123–133. [Google Scholar] [CrossRef]
  19. Tognolini, M.; Incerti, M.; Pala, D.; Russo, S.; Castelli, R.; Hassan-Mohamed, I.; Giorgio, C.; Lodola, A. Target hopping as a useful tool for the identification of novel EphA2 protein-protein antagonists. ChemMedChem 2014, 9, 67–72. [Google Scholar] [CrossRef]
  20. Day, B.W.; Stringer, B.W.; Al-Ejeh, F.; Ting, M.J.; Wilson, J.; Ensbey, K.S.; Jamieson, P.R.; Bruce, Z.C.; Lim, Y.C.; Offenhäuser, C.; et al. EphA3 maintains tumorigenicity and is a therapeutic target in glioblastoma multiforme. Cancer Cell 2013, 23, 238–248. [Google Scholar] [CrossRef]
  21. Tu, Y.; He, S.; Fu, J.; Li, G.; Xu, R.; Lu, H.; Deng, J. Expression of EphrinB2 and EphB4 in glioma tissues correlated to the progression of glioma and the prognosis of glioblastoma patients. Clin. Transl. Oncol. 2012, 14, 214–220. [Google Scholar] [CrossRef] [PubMed]
  22. Chen, J.; Song, W.; Amato, K. Eph receptor tyrosine kinases in cancer stem cells. Cytokine Growth Factor Rev. 2015, 26, 1–6. [Google Scholar] [CrossRef] [PubMed]
  23. Lodola, A.; Giorgio, C.; Incerti, M.; Zanotti, I.; Tognolini, M. Targeting Eph/ephrin system in cancer therapy. Eur. J. Med. Chem. 2017, 142, 152–162. [Google Scholar] [CrossRef] [PubMed]
  24. Miao, H.; Gale, N.W.; Guo, H.; Qian, J.; Petty, A.; Kaspar, J.; Murphy, A.J.; Valenzuela, D.M.; Yancopoulos, G.; Hambardzumyan, D.; et al. EphA2 promotes infiltrative invasion of glioma stem cells in vivo through cross-talk with Akt and regulates stem cell properties. Oncogene 2015, 34, 558–567. [Google Scholar] [CrossRef] [PubMed]
  25. Ferluga, S.; Tomé, C.M.; Herpai, D.M.; D’Agostino, R.; Debinski, W. Simultaneous targeting of Eph receptors in glioblastoma. Oncotarget 2016, 7, 59860–59876. [Google Scholar] [CrossRef] [PubMed] [Green Version]
  26. Hassan-Mohamed, I.; Giorgio, C.; Incerti, M.; Russo, S.; Pala, D.; Pasquale, E.B.; Zanotti, I.; Vicini, P.; Barocelli, E.; Rivara, S.; et al. UniPR129 is a competitive small molecule Eph-ephrin antagonist blocking in vitro angiogenesis at low micromolar concentrations. Br. J. Pharmacol. 2014, 171, 5195–5208. [Google Scholar] [CrossRef] [PubMed] [Green Version]
  27. Pujuguet, P.; Beirinckx, F.; Delachaume, C.; Shenton, D.D.; Huck, J.; van der Aar, E.; Brys, R.; van Rompaey, L.; Wigerinck, P.; Saniere, L. Abstract 1753: GLPG1790: The first ephrin (EPH) receptor tyrosine kinase inhibitor for the treatment of triple negative breast cancer. In Proceedings of the Annual Meeting Cancer Research, San Diego, CA, USA, 5–9 April 2014. [Google Scholar]
  28. Megiorni, F.; Gravina, G.L.; Camero, S.; Ceccarelli, S.; Del Fattore, A.; Desiderio, V.; Papaccio, F.; McDowell, H.P.; Shukla, R.; Pizzuti, A.; et al. Pharmacological targeting of the ephrin receptor kinase signalling by GLPG1790 in vitro and in vivo reverts oncophenotype, induces myogenic differentiation and radiosensitizes embryonal rhabdomyosarcoma cells. J. Hematol. Oncol. 2017, 10, 161. [Google Scholar] [CrossRef] [PubMed]
  29. Krusche, B.; Ottone, C.; Clements, M.P.; Johnstone, E.R.; Goetsch, K.; Lieven, H.; Mota, S.G.; Singh, P.; Khadayate, S.; Ashraf, A.; et al. EphrinB2 drives perivascular invasion and proliferation of glioblastoma stem-like cells. eLife 2016, 5, e14845. [Google Scholar] [CrossRef]
  30. Luchman, H.A.; Stechishin, O.D.; Dang, N.H.; Blough, M.D.; Chesnelong, C.; Kelly, J.J.; Nguyen, S.A.; Chan, J.A.; Weljie, A.M.; Cairncross, J.G.; et al. An in vivo patient-derived model of endogenous IDH1-mutant glioma. Neuro Oncol. 2012, 14, 184–191. [Google Scholar] [CrossRef]
  31. Mendiburu-Eliçabe, M.; Gil-Ranedo, J.; Izquierdo, M. Efficacy of rapamycin against glioblastoma cancer stem cells. Clin. Transl. Oncol. 2014, 16, 495–502. [Google Scholar] [CrossRef] [PubMed]
  32. Bruckheimer, E.M.; Fazenbaker, C.A.; Gallagher, S.; Mulgrew, K.; Fuhrmann, S.; Coffman, K.T.; Walsh, W.; Ready, S.; Cook, K.; Damschroder, M.; et al. Antibody-dependent cell-mediated cytotoxicity effector-enhanced EphA2 agonist monoclonal antibody demonstrates potent activity against human tumors. Neoplasia 2009, 11, 509–517. [Google Scholar] [CrossRef] [PubMed]
  33. Masuko, K.; Okazaki, S.; Satoh, M.; Tanaka, G.; Ikeda, T.; Torii, R.; Ueda, E.; Nakano, T.; Danbayashi, M.; Tsuruoka, T.; et al. Anti-tumor effect against human cancer xenografts by a fully human monoclonal antibody to a variant 8-epitope of CD44R1 expressed on cancer stem cells. PLoS ONE 2012, 7, e29728. [Google Scholar] [CrossRef]
  34. Gravina, G.L.; Mancini, A.; Marampon, F.; Colapietro, A.; Delle Monache, S.; Sferra, R.; Vitale, F.; Richardson, P.J.; Patient, L.; Burbidge, S.; et al. The brain-penetrating CXCR4 antagonist, PRX177561, increases the antitumor effects of bevacizumab and sunitinib in preclinical models of human glioblastoma. J. Hematol. Oncol. 2017, 10, 5. [Google Scholar] [CrossRef] [PubMed]
  35. Festuccia, C.; Gravina, G.L.; Giorgio, C.; Mancini, A.; Pellegrini, C.; Colapietro, A.; Delle Monache, S.; Maturo, M.G.; Sferra, R.; Chiodelli, P.; et al. UniPR1331, a small molecule targeting Eph/ephrin interaction, prolongs survival in glioblastoma and potentiates the effect of antiangiogenic therapy in mice. Oncotarget 2018, 9, 24347–24363. [Google Scholar] [CrossRef] [PubMed] [Green Version]
  36. Gravina, G.L.; Mancini, A.; Mattei, C.; Vitale, F.; Marampon, F.; Colapietro, A.; Rossi, G.; Ventura, L.; Vetuschi, A.; Di Cesare, E.; et al. Enhancement of radiosensitivity by the novel anticancer quinolone derivative vosaroxin in preclinical glioblastoma models. Oncotarget 2017, 8, 29865–29886. [Google Scholar] [CrossRef] [PubMed] [Green Version]
  37. Gravina, G.L.; Tortoreto, M.; Mancini, A.; Addis, A.; Di Cesare, E.; Lenzi, A.; Landesman, Y.; McCauley, D.; Kauffman, M.; Shacham, S.; et al. XPO1/CRM1-selective inhibitors of nuclear export (SINE) reduce tumor spreading and improve overall survival in preclinical models of prostate cancer (PCa). J. Hematol. Oncol. 2014, 7, 46. [Google Scholar] [CrossRef]
  38. Yuan, J.P.; Wang, L.W.; Qu, A.P.; Chen, J.M.; Xiang, Q.M.; Chen, C.; Sun, S.; Pang, D.; Liu, J.; Li, J. Quantum Dots-Based Quantitative and In Situ Multiple Imaging on Ki67 and Cytokeratin to Improve Ki67 Assessment in Breast Cancer. PLoS ONE 2015, 10, e0122734. [Google Scholar] [CrossRef] [PubMed]
  39. Sysel, A.M.; Valli, V.E.; Bauer, J.A. Immunohistochemical quantification of the cobalamin transport protein, cell surface receptor and Ki-67 in naturally occurring canine and feline malignant tumors and in adjacent normal tissues. Oncotarget 2015, 6, 2331–2348. [Google Scholar] [CrossRef] [PubMed]
  40. Mason, M.; Maurice, C.; McNamara, M.G.; Tieu, M.T.; Lwin, Z.; Millar, B.A.; Menard, C.; Laperriere, N.; Milosevic, M.; Atenafu, E.G.; et al. Neutrophil-lymphocyte ratio dynamics during concurrent chemo-radiotherapy for glioblastoma is an independent predictor for overall survival. J. Neurooncol. 2017, 132, 463–471. [Google Scholar] [CrossRef] [PubMed]
  41. Lopes, M.; Carvalho, B.; Vaz, R.; Linhares, P. Influence of neutrophil-lymphocyte ratio in prognosis of glioblastoma multiforme. J. Neurooncol. 2018, 136, 173–180. [Google Scholar] [CrossRef]
  42. Saito, T.; Sugiyama, K.; Hama, S.; Yamasaki, F.; Takayasu, T.; Nosaka, R.; Muragaki, Y.; Kawamata, T.; Kurisu, K. Prognostic importance of temozolomide-induced neutropenia in glioblastoma, IDH-wildtype patients. Neurosurg. Rev. 2018, 41, 621–628. [Google Scholar] [CrossRef] [PubMed]
  43. Curran, C.S.; Bertics, P.J. Eosinophils in glioblastoma biology. J. Neuroinflamm. 2012, 9, 11. [Google Scholar] [CrossRef] [PubMed] [Green Version]
  44. Hamaoka, Y.; Negishi, M.; Katoh, H. Tyrosine kinase activity of EphA2 promotes its S897 phosphorylation and glioblastoma cell proliferation. Biochem. Biophys. Res. Commun. 2018, 499, 920–926. [Google Scholar] [CrossRef] [PubMed]
  45. Binda, E.; Visioli, A.; Giani, F.; Lamorte, G.; Copetti, M.; Pitter, K.L.; Huse, J.T.; Cajola, L.; Zanetti, N.; DiMeco, F.; et al. The EphA2 receptor drives self-renewal and tumorigenicity in stem-like tumor-propagating cells from human glioblastomas. Cancer Cell 2012, 22, 765–780. [Google Scholar] [CrossRef]
  46. El-Khoueiry, A.; Gitlitz, B.; Cole, S.; Tsao-Wei, D.; Goldkorn, A.; Quinn, D.; Lenz, H.J.; Nieva, J.; Dorff, T.; Oswald, M.; et al. A first-in-human phase I study of sEphB4-HSA in patients with advanced solid tumors with expansion at the maximum tolerated dose (MTD) or recommended phase II dose (RP2D). Eur. J. Cancer 2016, 69, S11. [Google Scholar] [CrossRef]
  47. Swords, R.T.; Greenberg, P.L.; Wei, A.H.; Durrant, S.; Advani, A.S.; Hertzberg, M.S.; Lewis, I.D.; Rivera, G.; Gratzinger, D.; Fan, A.C.; et al. KB004, a first in class monoclonal antibody targeting the receptor tyrosine kinase EphA3, in patients with advanced hematologic malignancies: Results from a phase 1 study. Leuk Res. 2016, 50, 123–131. [Google Scholar] [CrossRef]
  48. Incerti, M.; Tognolini, M.; Russo, S.; Pala, D.; Giorgio, C.; Hassan-Mohamed, I.; Noberini, R.; Pasquale, E.B.; Vicini, P.; Piersanti, S.; et al. Amino Acid Conjugates of Lithocholic Acid As Antagonists of the EphA2 Receptor. J. Med. Chem. 2013, 56, 2936–2947. [Google Scholar] [CrossRef]
  49. Castelli, R.; Tognolini, M.; Vacondio, F.; Incerti, M.; Pala, D.; Callegari, D.; Bertoni, S.; Giorgio, C.; Hassan-Mohamed, I.; Zanotti, I.; et al. Δ(5)-Cholenoyl-amino acids as selective and orally available antagonists of the Eph-ephrin system. Eur. J. Med. Chem. 2015, 103, 312–324. [Google Scholar] [CrossRef]
  50. Lamour, V.; Henry, A.; Kroonen, J.; Nokin, M.J.; von Marschall, Z.; Fisher, L.W.; Chau, T.L.; Chariot, A.; Sanson, M.; Delattre, J.Y.; et al. Targeting osteopontin suppresses glioblastoma stem-like cell character and tumorigenicity in vivo. Int. J. Cancer 2015, 137, 1047–1057. [Google Scholar] [CrossRef] [Green Version]
  51. Tanaka, S.; Nakada, M.; Yamada, D.; Nakano, I.; Todo, T.; Ino, Y.; Hoshii, T.; Tadokoro, Y.; Ohta, K.; Ali, M.A.; et al. Strong therapeutic potential of γ-secretase inhibitor MRK003 for CD44-high and CD133-low glioblastoma initiating cells. J. Neurooncol. 2015, 121, 239–250. [Google Scholar] [CrossRef]
  52. Shankar, A.; Kumar, S.; Iskander, A.S.; Varma, N.R.; Janic, B.; deCarvalho, A.; Mikkelsen, T.; Frank, J.A.; Ali, M.M.; Knight, R.A.; et al. Subcurative radiation significantly increases cell proliferation, invasion, and migration of primary glioblastoma multiforme in vivo. Chin. J. Cancer 2014, 33, 148–158. [Google Scholar] [CrossRef] [Green Version]
  53. He, J.; Liu, Y.; Zhu, T.; Zhu, J.; Dimeco, F.; Vescovi, A.L.; Heth, J.A.; Muraszko, K.M.; Fan, X.; Lubman, D.M. CD90 is identified as a candidate marker for cancer stem cells in primary high-grade gliomas using tissue microarrays. Mol. Cell. Proteom. 2012, 11, M111.010744. [Google Scholar] [CrossRef] [PubMed]
  54. Song, W.S.; Yang, Y.P.; Huang, C.S.; Lu, K.H.; Liu, W.H.; Wu, W.W.; Lee, Y.Y.; Lo, W.L.; Lee, S.D.; Chen, Y.W.; et al. Sox2, a stemness gene, regulates tumor-initiating and drug-resistant properties in CD133-positive glioblastoma stem cells. J. Chin. Med. Assoc. 2016, 79, 538–545. [Google Scholar] [CrossRef] [PubMed] [Green Version]
  55. Bhagat, M.; Palanichamy, J.K.; Ramalingam, P.; Mudassir, M.; Irshad, K.; Chosdol, K.; Sarkar, C.; Seth, P.; Goswami, S.; Sinha, S.; et al. HIF-2α mediates a marked increase in migration and stemness characteristics in a subset of glioma cells under hypoxia by activating an Oct-4/Sox-2-Mena (INV) axis. Int. J. Biochem. Cell Biol. 2016, 74, 60–71. [Google Scholar] [CrossRef]
  56. Karmakar, S.; Seshacharyulu, P.; Lakshmanan, I.; Vaz, A.P.; Chugh, S.; Sheinin, Y.M.; Mahapatra, S.; Batra, S.K.; Ponnusamy, M.P. hPaf1/PD2 interacts with OCT3/4 to promote self-renewal of ovarian cancer stem cells. Oncotarget 2017, 8, 14806–14820. [Google Scholar] [CrossRef] [PubMed] [Green Version]
  57. Matsuda, Y.; Ishiwata, T.; Yoshimura, H.; Hagio, M.; Arai, T. Inhibition of nestin suppresses stem cell phenotype of glioblastomas through the alteration of post-translational modification of heat shock protein HSPA8/HSC71. Cancer Lett. 2015, 357, 602–611. [Google Scholar] [CrossRef] [PubMed]
  58. Smith, S.J.; Tilly, H.; Ward, J.H.; Macarthur, D.C.; Lowe, J.; Coyle, B.; Grundy, R.G. CD105 (Endoglin) exerts prognostic effects via its role in the microvascular niche of paediatric high grade glioma. Acta Neuropathol. 2012, 124, 99–110. [Google Scholar] [CrossRef] [PubMed] [Green Version]
  59. Kawamura, Y.; Takouda, J.; Yoshimoto, K.; Nakashima, K. New aspects of glioblastoma multiforme revealed by similarities between neural and glioblastoma stem cells. Cell Biol. Toxicol. 2018. [Google Scholar] [CrossRef] [PubMed]
  60. Gállego Pérez-Larraya, J.; Paris, S.; Idbaih, A.; Dehais, C.; Laigle-Donadey, F.; Navarro, S.; Capelle, L.; Mokhtari, K.; Marie, Y.; Sanson, M.; et al. Diagnostic and prognostic value of preoperative combined GFAP, IGFBP-2, and YKL-40 plasma levels in patients with glioblastoma. Cancer 2014, 120, 3972–3980. [Google Scholar] [CrossRef] [PubMed] [Green Version]
  61. Yang, D.; Jin, C.; Ma, H.; Huang, M.; Shi, G.P.; Wang, J.; Xiang, M. EphrinB2/EphB4 pathway in postnatal angiogenesis: A potential therapeutic target for ischemic cardiovascular disease. Angiogenesis 2016, 19, 297–309. [Google Scholar] [CrossRef]
  62. Guo, J.Q.; Zheng, Q.H.; Chen, H.; Chen, L.; Xu, J.B.; Chen, M.Y.; Lu, D.; Wang, Z.H.; Tong, H.F.; Lin, S. Ginsenoside Rg3 inhibition of vasculogenic mimicry in pancreatic cancer through downregulation of VE-cadherin/EphA2/MMP9/MMP2 expression. Int. J. Oncol. 2014, 45, 1065–1072. [Google Scholar] [CrossRef] [PubMed]
  63. Wang, H.; Sun, W.; Zhang, W.Z.; Ge, C.Y.; Zhang, J.T.; Liu, Z.Y.; Fan, Y.Z. Inhibition of tumor vasculogenic mimicry and prolongation of host survival in highly aggressive gallbladder cancers by norcantharidin via blocking the ephrin type a receptor 2/focal adhesion kinase/paxillin signaling pathway. PLoS ONE 2014, 9, e96982. [Google Scholar] [CrossRef] [PubMed]
  64. Shiuan, E.; Chen, J. Eph Receptor Tyrosine Kinases in Tumor Immunity. Cancer Res. 2016, 76, 6452–6457. [Google Scholar] [CrossRef] [PubMed]
  65. Nguyen, T.M.; Arthur, A.; Hayball, J.D.; Gronthos, S. EphB and Ephrin-B interactions mediate human mesenchymal stem cell suppression of activated T-cells. Stem Cells Dev. 2013, 22, 2751–2764. [Google Scholar] [CrossRef] [PubMed]
  66. Ende, G.; Poitz, D.M.; Strasser, R.H.; Jellinghaus, S. The role of the Eph/ephrin-system in atherosclerotic plaque development: A complex puzzle. Cardiovasc. Pathol. 2014, 23, 251. [Google Scholar] [CrossRef] [PubMed]
  67. Konda, N.; Saeki, N.; Nishino, S.; Ogawa, K. Truncated EphA2 likely potentiates cell adhesion via integrins as well as infiltration and/or lodgment of a monocyte/macrophage cell line in the red pulp and marginal zone of the mouse spleen, where ephrin-A1 is prominently expressed in the vasculature. Histochem. Cell Biol. 2017, 147, 317–339. [Google Scholar] [CrossRef]
Figure 1. Biochemical and cellular effects of different doses of GLPG1790. (A) Colorimetric cell-based ELISA determinations for total and phosphorylated Tyr588 and Ser897 EphA2, total and phosphorylated Tyr779 EphA3 and total and phosphorylated Tyr987 EphB4 in GLPG1790-treated U87MG cells. Data show also the IC50 values calculated for the inhibition of phosphorylation for EphA2, EphA3 and EphB4 isoforms. (B) Growth curves and IC50 determination for GLPG1790-treated A172, U251, T98G and U87MG and GBM cell lines as well as in BT48EF and BT12M GICs. (B) antiproliferative effects and IC50 values calculated for GBM cell lines. (C) Morphology of GLPG1790-treated U251 cells.
Cancers 11 00359 g001
Figure 2. Proliferation of glioma stem cells cultured with different doses of GLPG1790. (A) Growth changes of BT12M CSCs; GLPG1790 reduced the number and size of BT12M cells. (B) IC50 values calculated for singles GIC cultures. (C) GLPG1790 reduced the sphere generation dose-dependently in clonogenic assays in BT12M, BT48EF and BT50EF cells. (D) Reduced Ki67 expression after the GLPG1790 treatment, both as a protein amount and percentage of positive cells; the reduction was dose-dependent in the BT48EF culture. Scale bar: 25 µm. (E) Dual Sox2 and Ki67 determination in single cells or in very small cell aggregates from treated and untreated cultures. (F) Dual Sox2/ki67 determination in single cells. Scale bar: 25 µm. Data are representative of three similar results performed in triplicate. Confocal images were collected and shown as maximal projection of about 20 analysed spheres observed with 0.29-μm size serial sections. * p < 0.05.
Cancers 11 00359 g002
Figure 3. Phenotypic modifications in GLPG1790-treated GICs: changes in mesenchymal/stem cell marker expression. (A) FACS analysis performed in controls and GLPG1790-treated BT12 and BT48EF cultures. Data are representative of three separated experiments performed in triplicate and values are expressed as a percentage of positive cells present in the analyzed cell suspension. (B) Western blot determinations performed in control or treated BT48EF cultures. Data are representative of three different gels/experiments and lanes were charged with 40 μg of proteins. (CI) Confocal immuno-fluorescence analyses performed in BT48EF: dual CD44/EphA2 expression in cell spheres (C) and in single or small cell aggregates (D), dual Sox2/NFH expression in cell sphere cultures (E), dual Sox2/nestin expression in cell sphere cultures (F), dual phalloidin/FAK expression in adherent cells (G), dual Sox2/Oct 3/4 expression in cell sphere cultures (H), and GFAP expression in BT48EF spheres (I). Confocal images were collected and shown as a maximal projection of about 20 analysed spheres observed with 0.29-μm size serial sections. Scale bar: 25 µm.
Cancers 11 00359 g003aCancers 11 00359 g003b
Figure 4. In vivo experiments: GLPG1790-modified tumour growth of GBM cells subcutaneously injected in female nu/nu mice (xenograft model). In vivo efficacy of single dose (30 mg/Kg/day) of GLPG1790 compared with standard RT (1 dose of 4 Gy), chemo (TMZ, 16 mg/kg for 5 consecutive days) and chemo and radio (4 Gy + 16 mg/kg TMZ) therapy. (A) Percentage of mice in progression plotted for the time by using Kaplan–Meyer analysis for U87MG cell model. (B) Percentage of mice in progression plotted for the time by using Kaplan–Meyer analysis for U251 cell model. (C) Percentage of mice in progression plotted for the time by using Kaplan–Meyer analysis for T98G cell model. (D) Forrest plot analysis. In Table S1, we summarised the statistical analysis of xenograft experiments.
Cancers 11 00359 g004
Figure 5. Histological evaluation of GLPG1790-treated xenografts: involvement of tumour microenvironment in the GLPG1790-mediated anti-tumour events. GBM xenografts contained giant cells, multinucleated cells and polygonal or spindle-shaped cells with abundant and intensely eosinophilic cytoplasm and hypochromatic nuclei. Areas with elevated tumour cell proliferation show a fibrillar collagen background that envelopes abundant vasculature and tumour cells. Deep changes in the quality of tumour microenvironment as modifications on: angiogenesis and vasculomimicry: (A) PAS staining; (B) trichromic Masson staining; (C) CD31 immunostaining; (D) vessel counts and hemoglobin content. (E) Necrosis, which is functionally associated to (F) increased in vitro cytotoxicity of HBMVEC, reduced in vitro vasculomimicry of U87MG cells and tubule formation of HBMVEC cells, as well as HIF2α-immunostaining (G). * p < 0.05.
Cancers 11 00359 g005
Figure 6. Tumour infiltration of inflammatory cells. (A) Infiltration of granulocyte (neutrophils and eosinophils) and (B) mono-nucleated blood cells (monocytes). Leukocyte infiltration was concentrated both along the front of tumour cell growth, as well as dispersed among the tumour cell sheets. * p < 0.05 vs. CTRL. Scale bar: 1 cm = 100 μm.
Cancers 11 00359 g006
Figure 7. GLPG1790 increased Disease Free Survival (DFS) and Overall Survival (OS) in orthotopic intra-brain tumours using differentiated U87MG cells: a comparison with standard therapies. A small number of cells (3 × 10³) were inoculated into the brain to simulate a chemo and radio therapy treatment made with tumours in recurrent phase after surgery. Such a low number of cells remaining in the operatory bed could re-grow and give rise to a recurrence. Five days after cell injection, when no luciferase activity was detectable intracranially, treatments were started for a maximum of 35 days with 200 days of follow-up without drug administration (total 240 days). Ten animals per group were considered. DFS and OS were recorded as indicated in the Materials and Methods section. (A) Graphical methodological approach regarding protocols and type of analyses. (B) Representative images for bioluminescence analysis performed after 42 days from tumor injection and showing the number and different sizes of positive (bioluminescent) animals for controls (vehicle treated animals) and GLPG1790. (C) DFS: comparison of GLPG1790 administration with standard therapies. (D) Percentage of animals in progression analysed using Kaplan–Meyer curves. (E) OS (the time of animal’s death). (F) Percentage of dead animals analysed using Kaplan–Meyer curves.
Cancers 11 00359 g007
Figure 8. GLPG1790 increases DFS and OS in orthotopic intra-brain tumours using differentiated patient derived GICs (GSCs-5). GICs were inoculated into the brain and treated as indicated in Figure 7. (A) DFS: comparison of GLPG1790 administration with standard therapies. (B) Percentage of animals in progression analysed using Kaplan–Meyer curves. (C) OS (the time of animal’s death). (D) Percentage of dead animals analysed using Kaplan–Meyer curves.
Cancers 11 00359 g008

