Mutant p53, Stabilized by Its Interplay with HSP90, Activates a Positive Feed-Back Loop Between NRF2 and p62 that Induces Chemo-Resistance to Apigenin in Pancreatic Cancer Cells

 , , , and
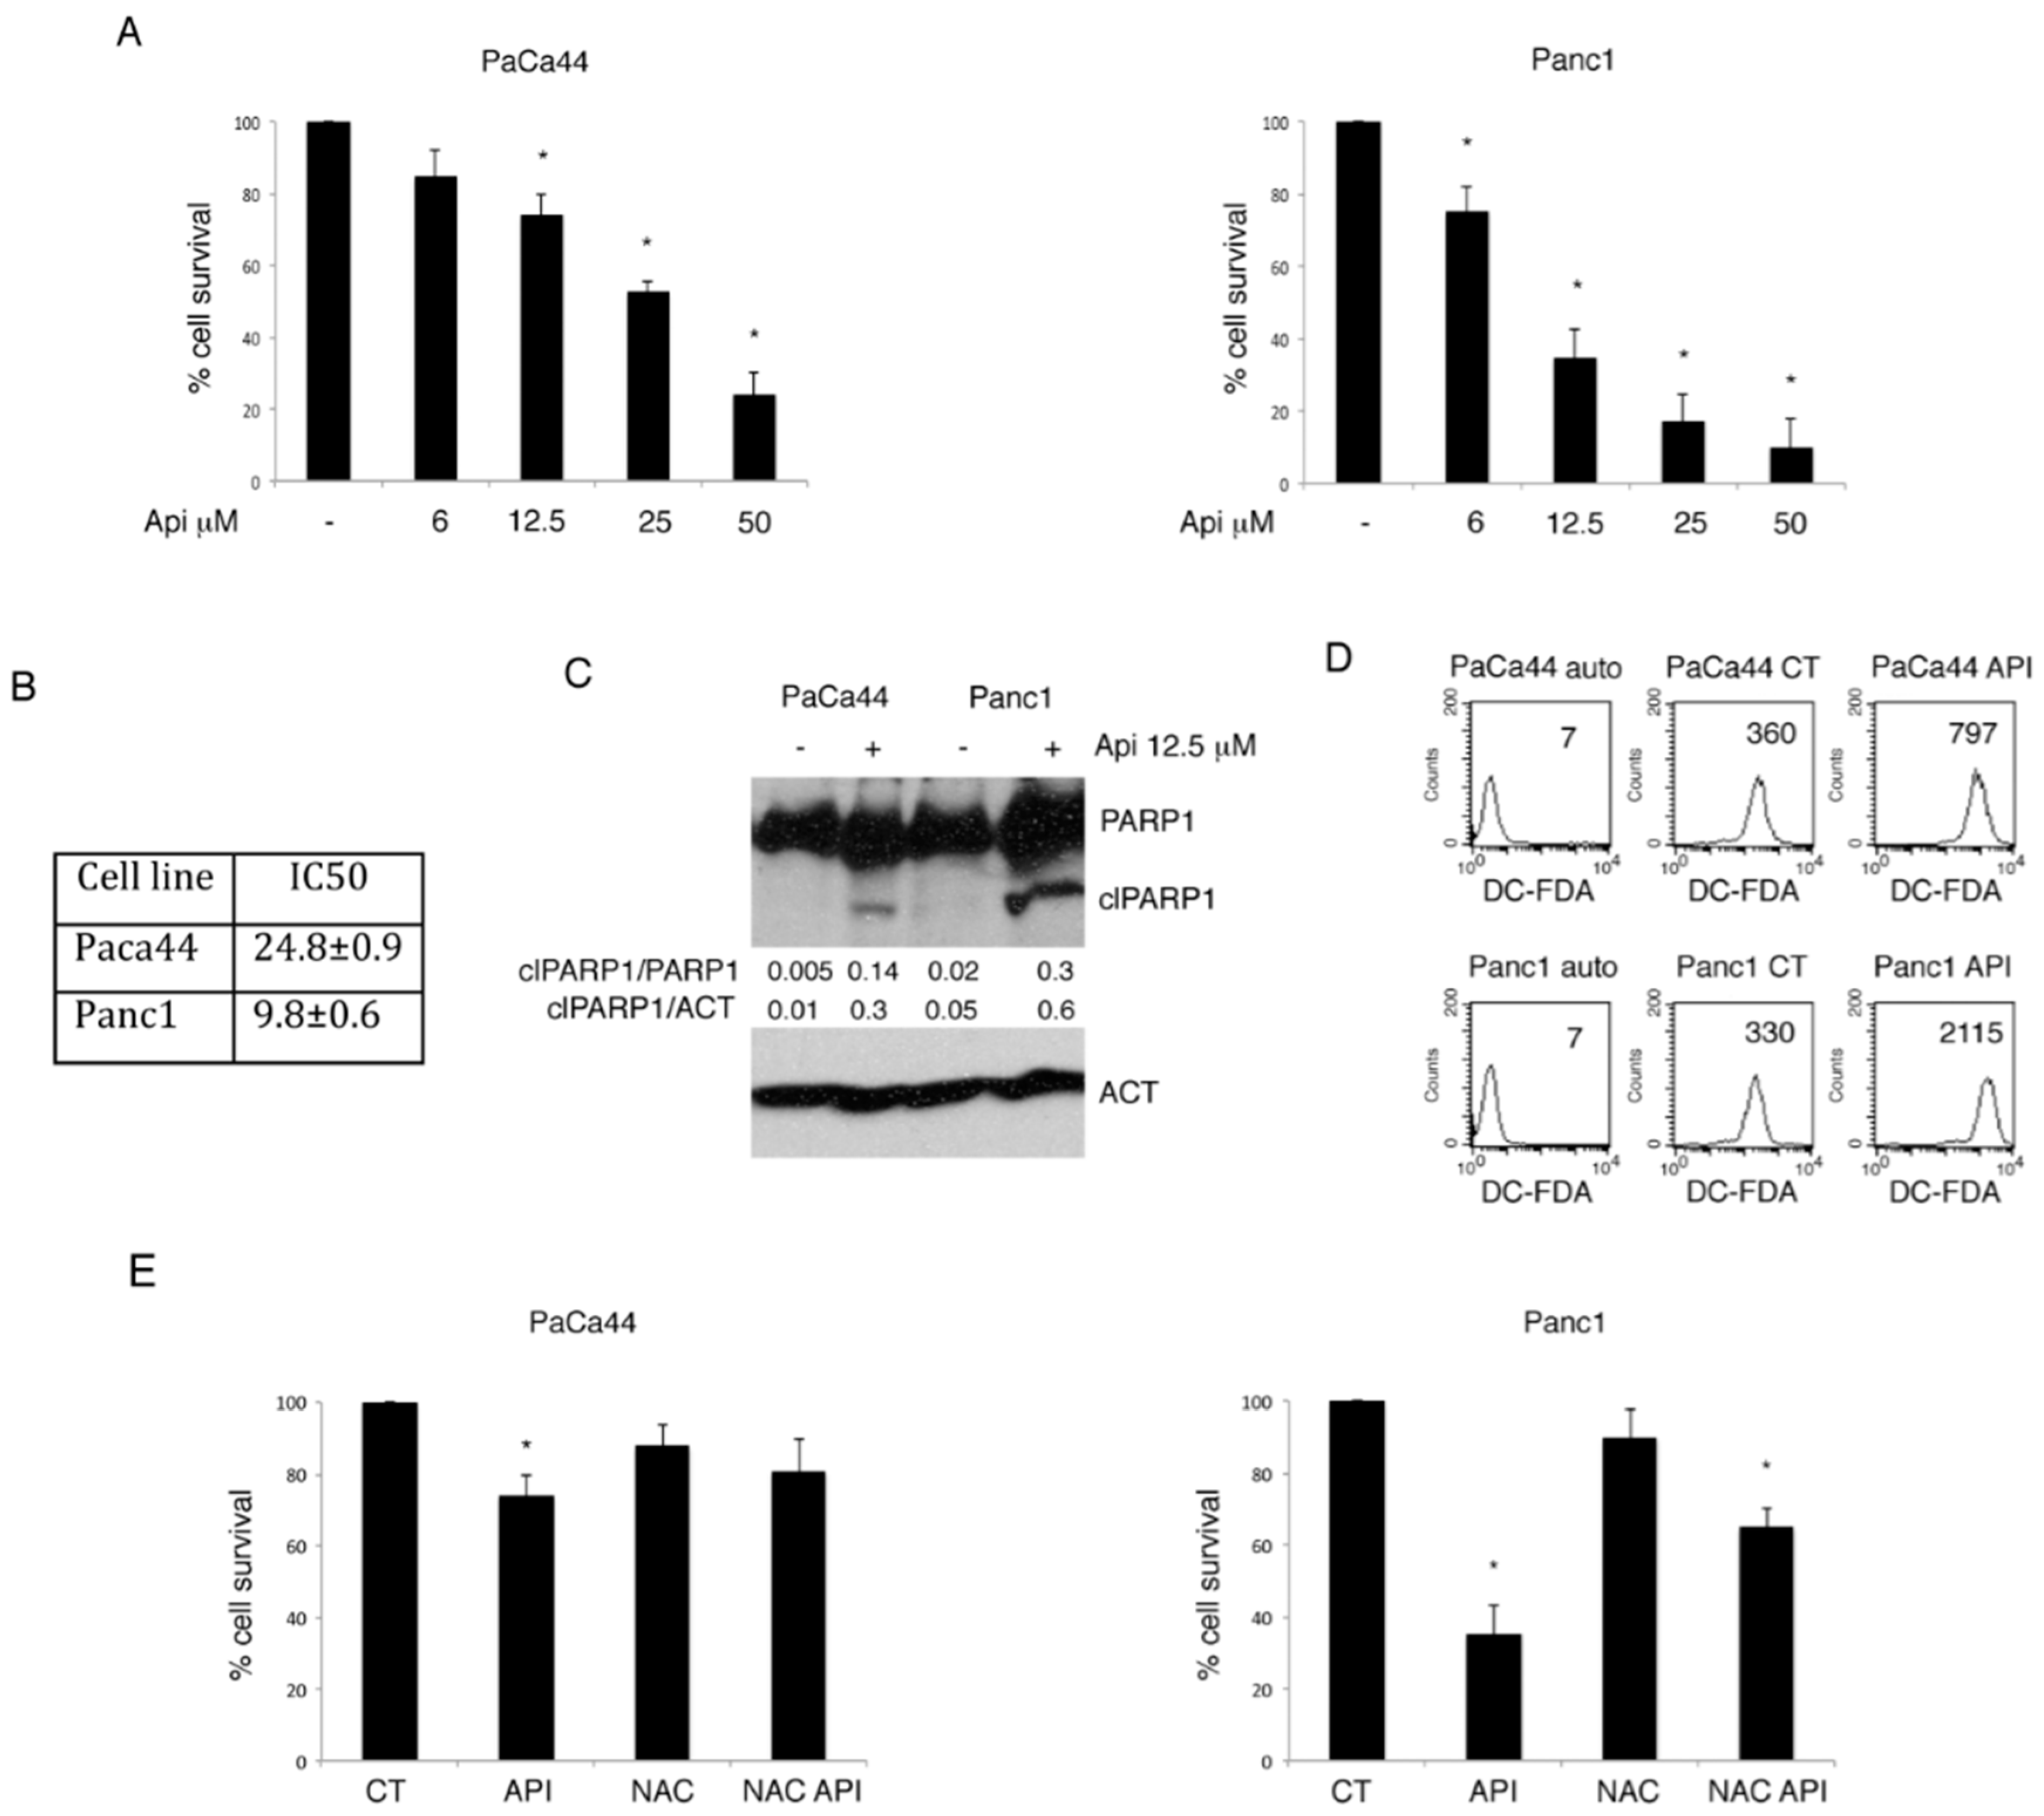
Abstract
:1. Introduction
2. Results
2.1. Apigenin-Induced Cytotoxicity Correlates with ROS Increase in Panc1 and PaCa44 Pancreatic Cell Lines
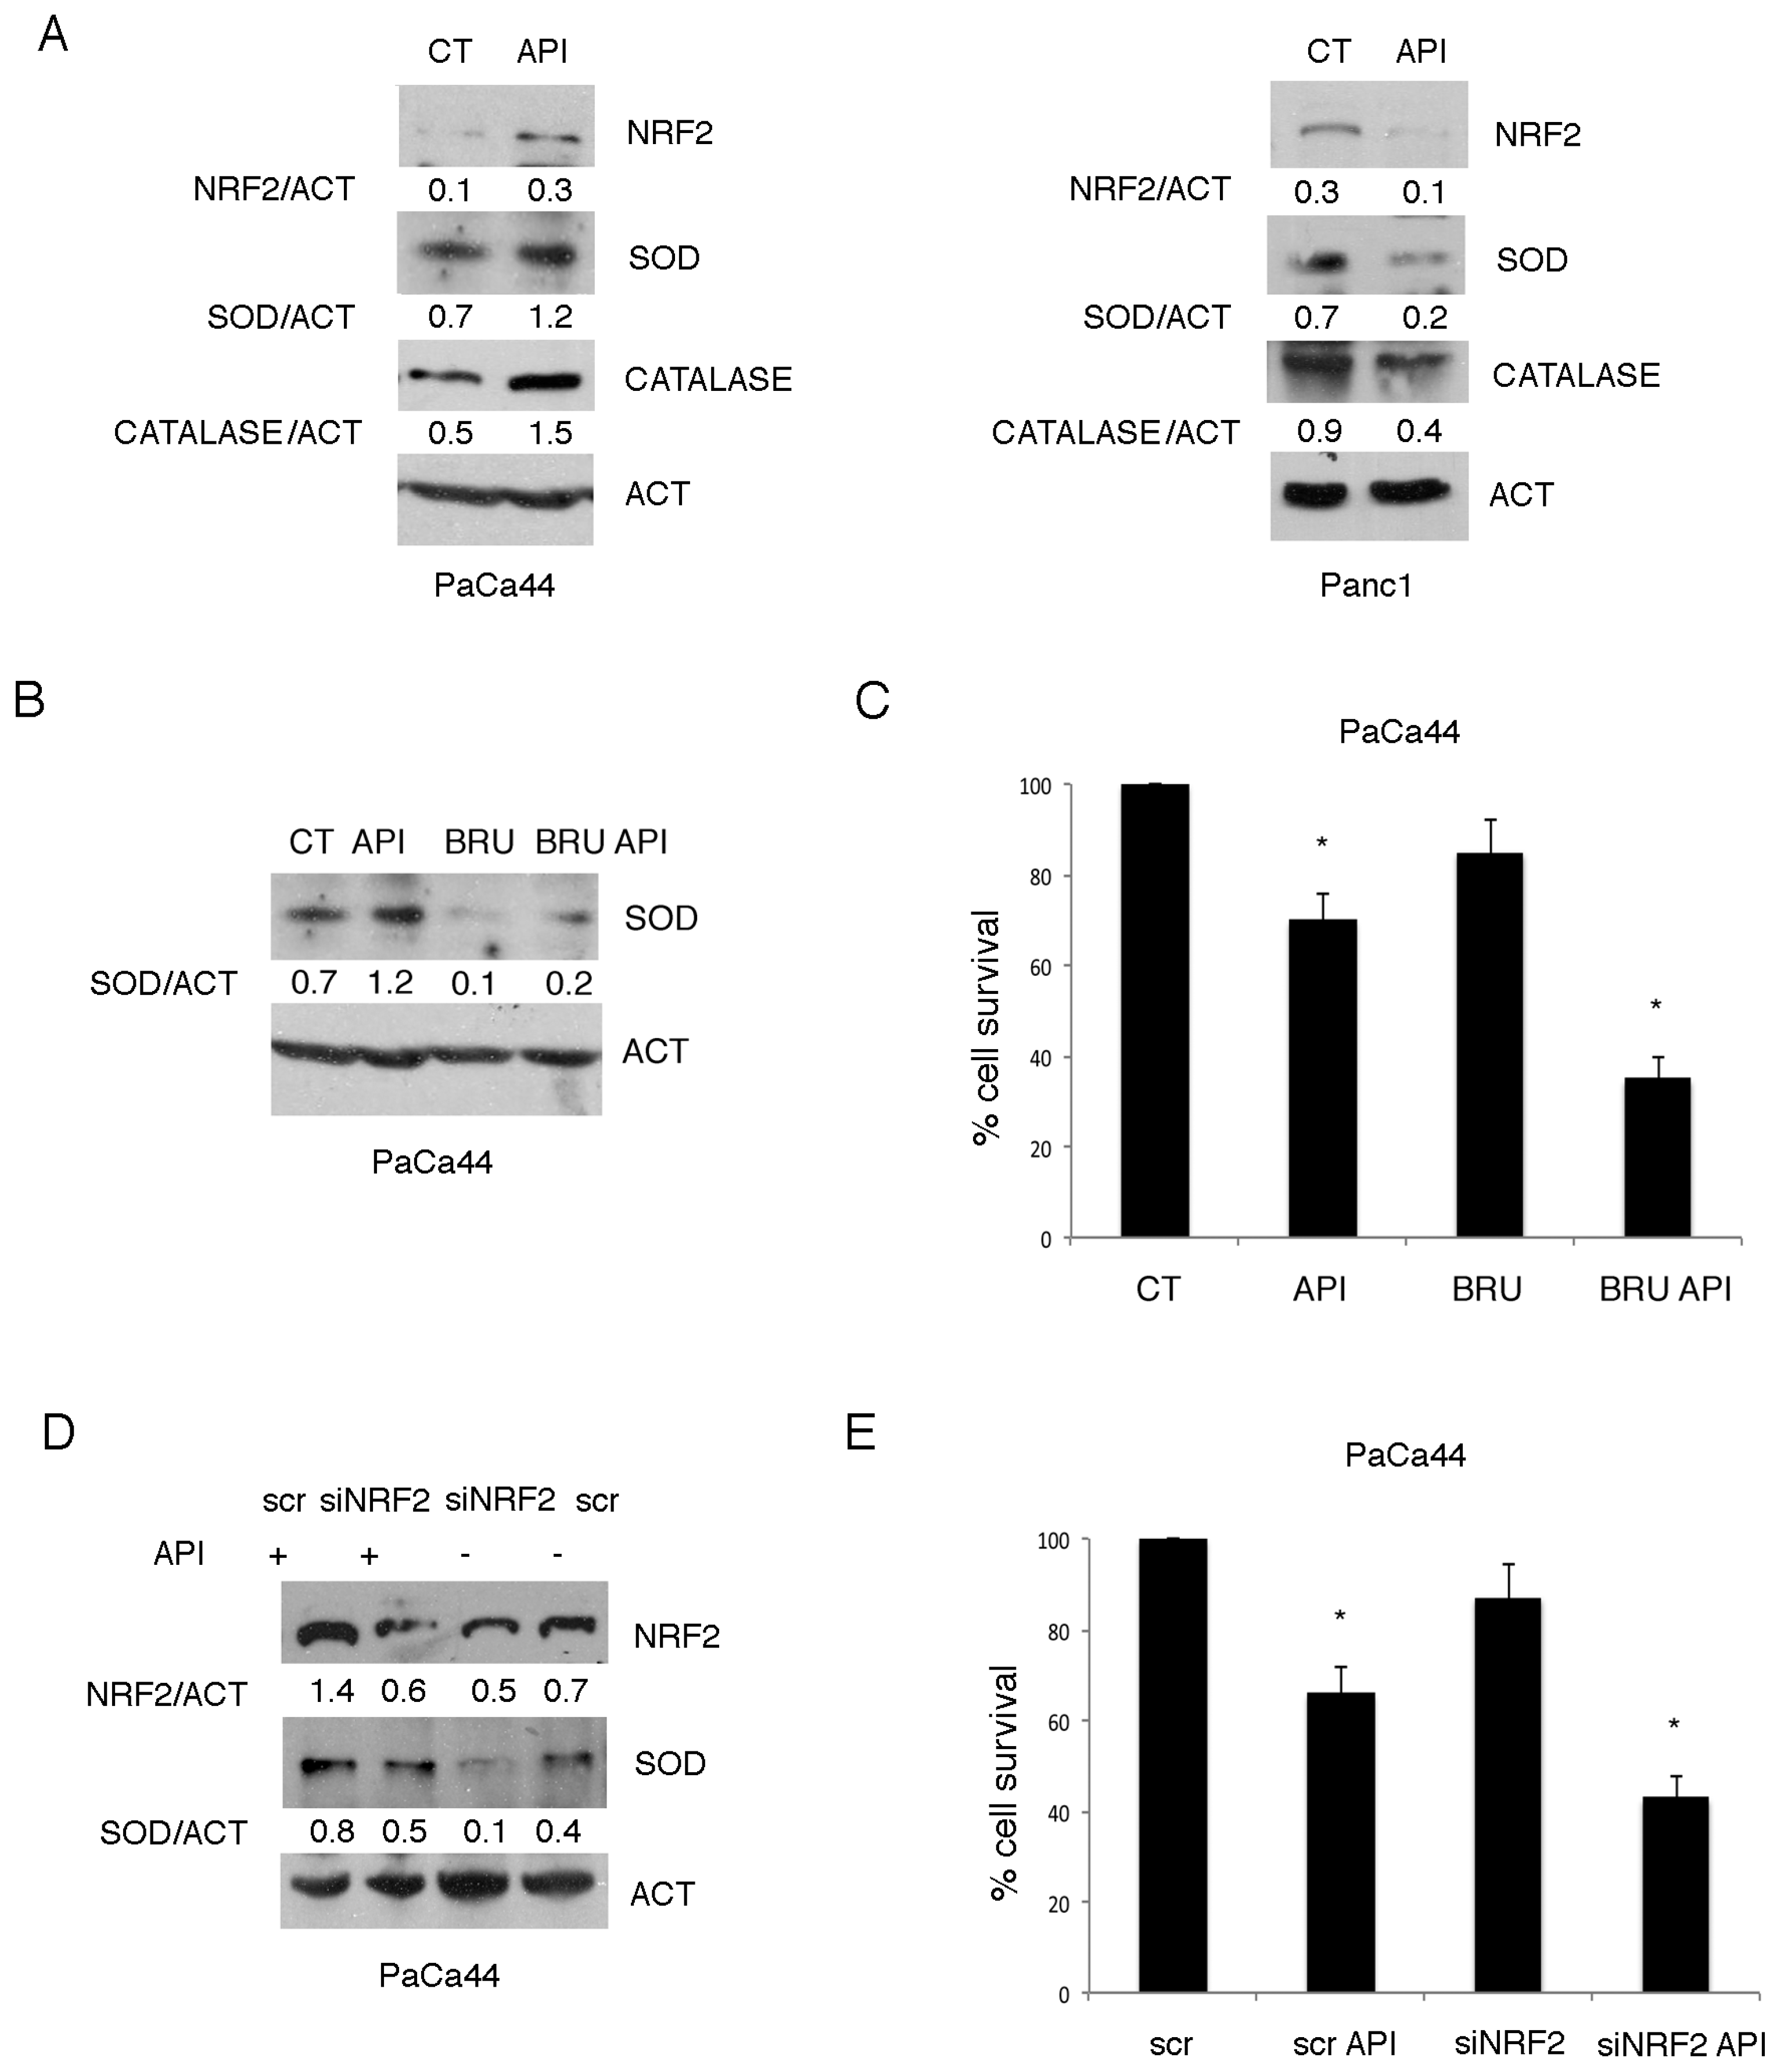
2.2. The Activation of NRF2-Mediated Antioxidant Response Was Responsible for the Reduced Susceptibility of PaCa44 Cells to Apigenin
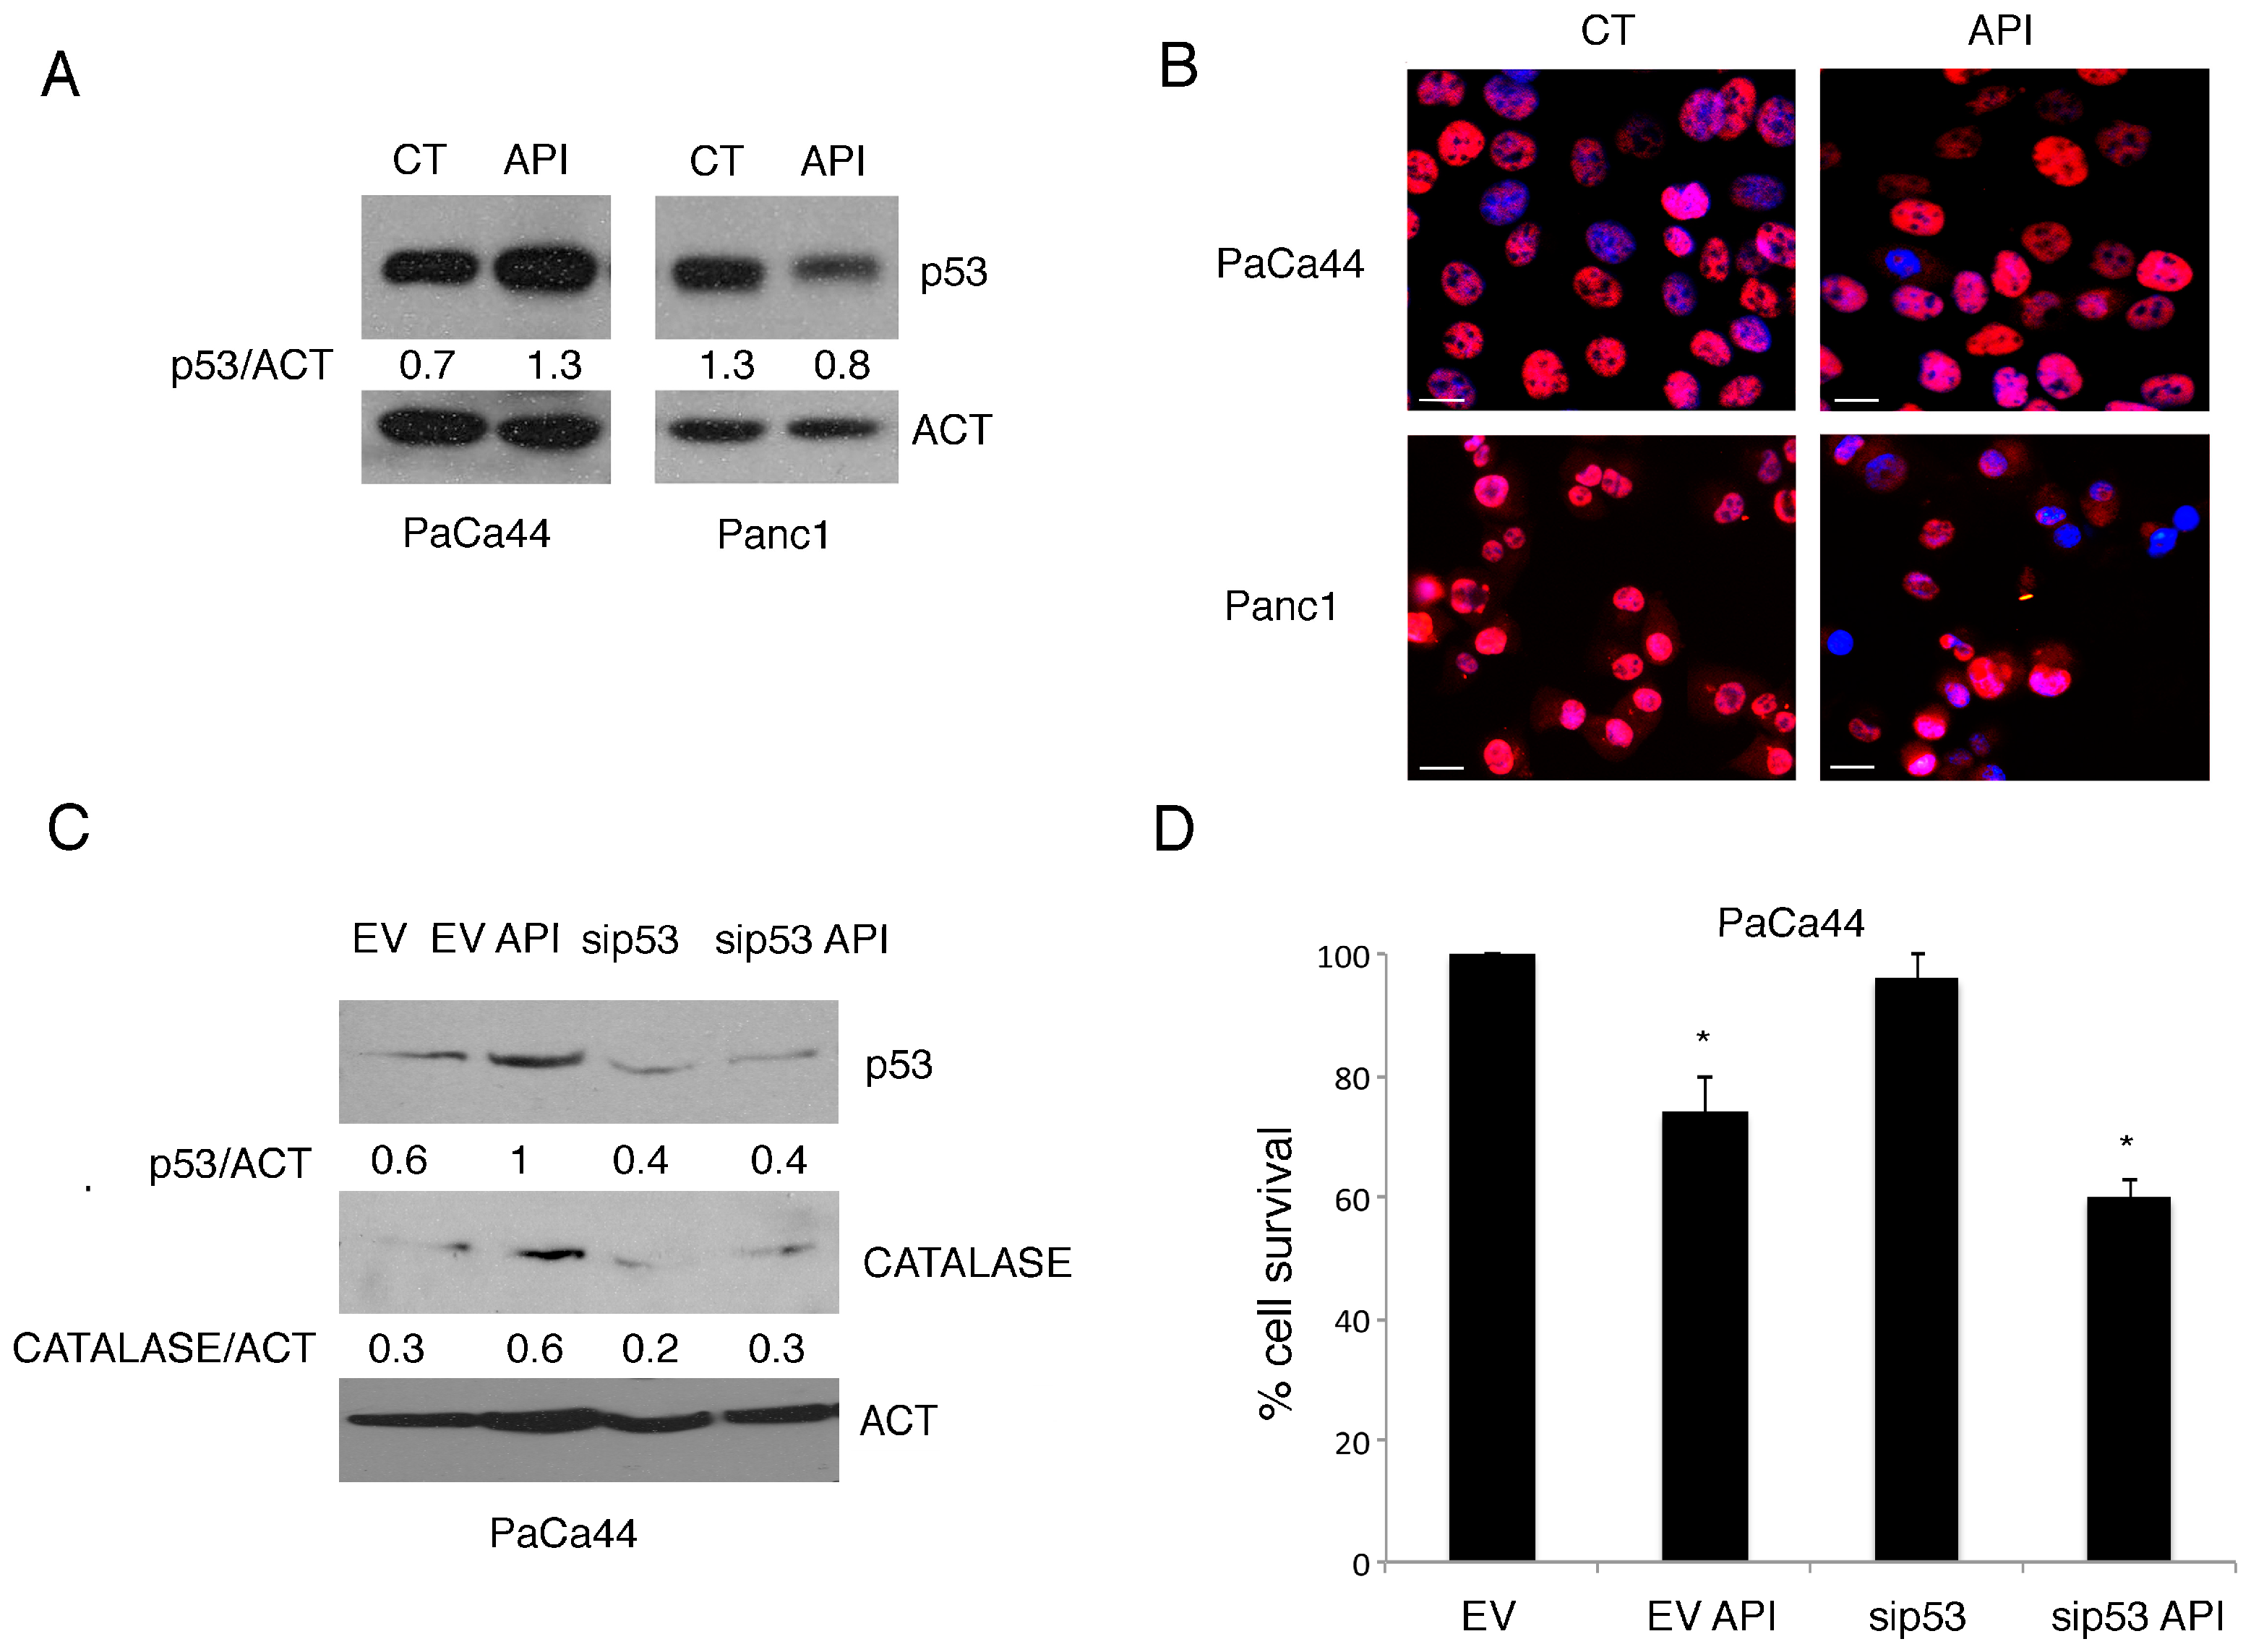
2.3. Mutp53 Expression Correlates with NRF2 Activation in Pancreatic Cancer Cells Undergoing Apigenin Treatment
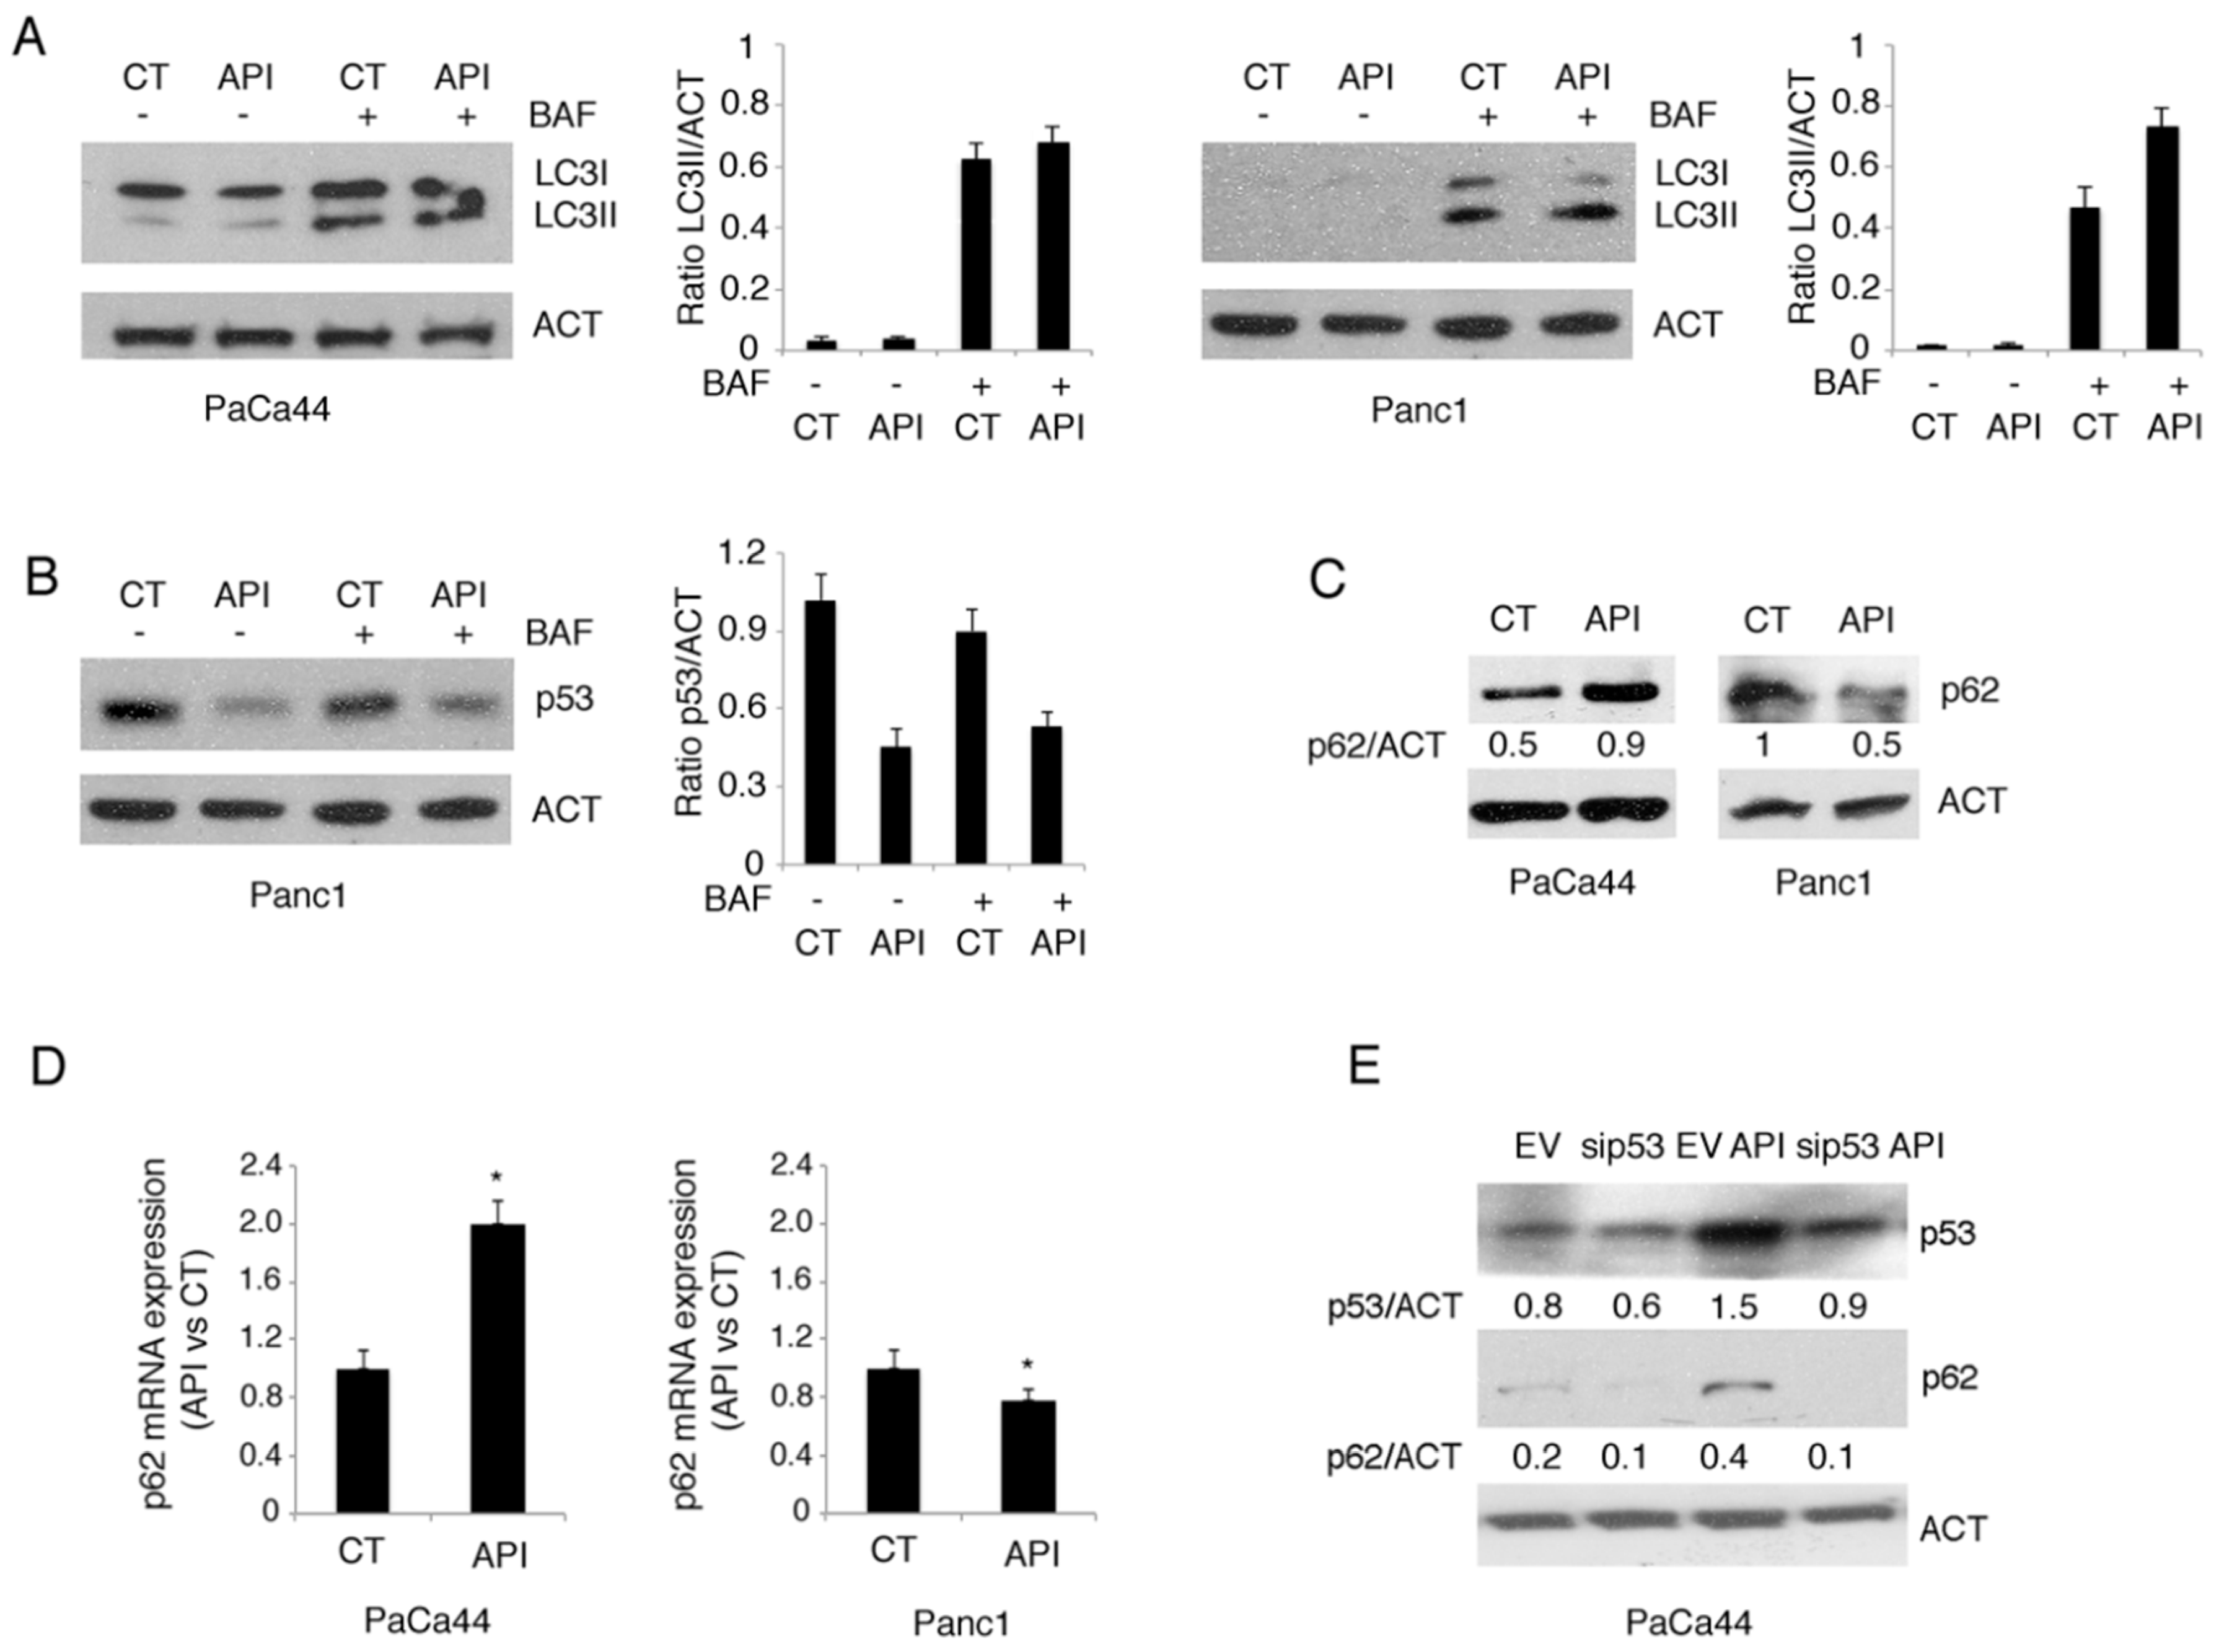
2.4. Autophagy Was Slightly Affected by Apigenin in Pancreatic Cancer Cells
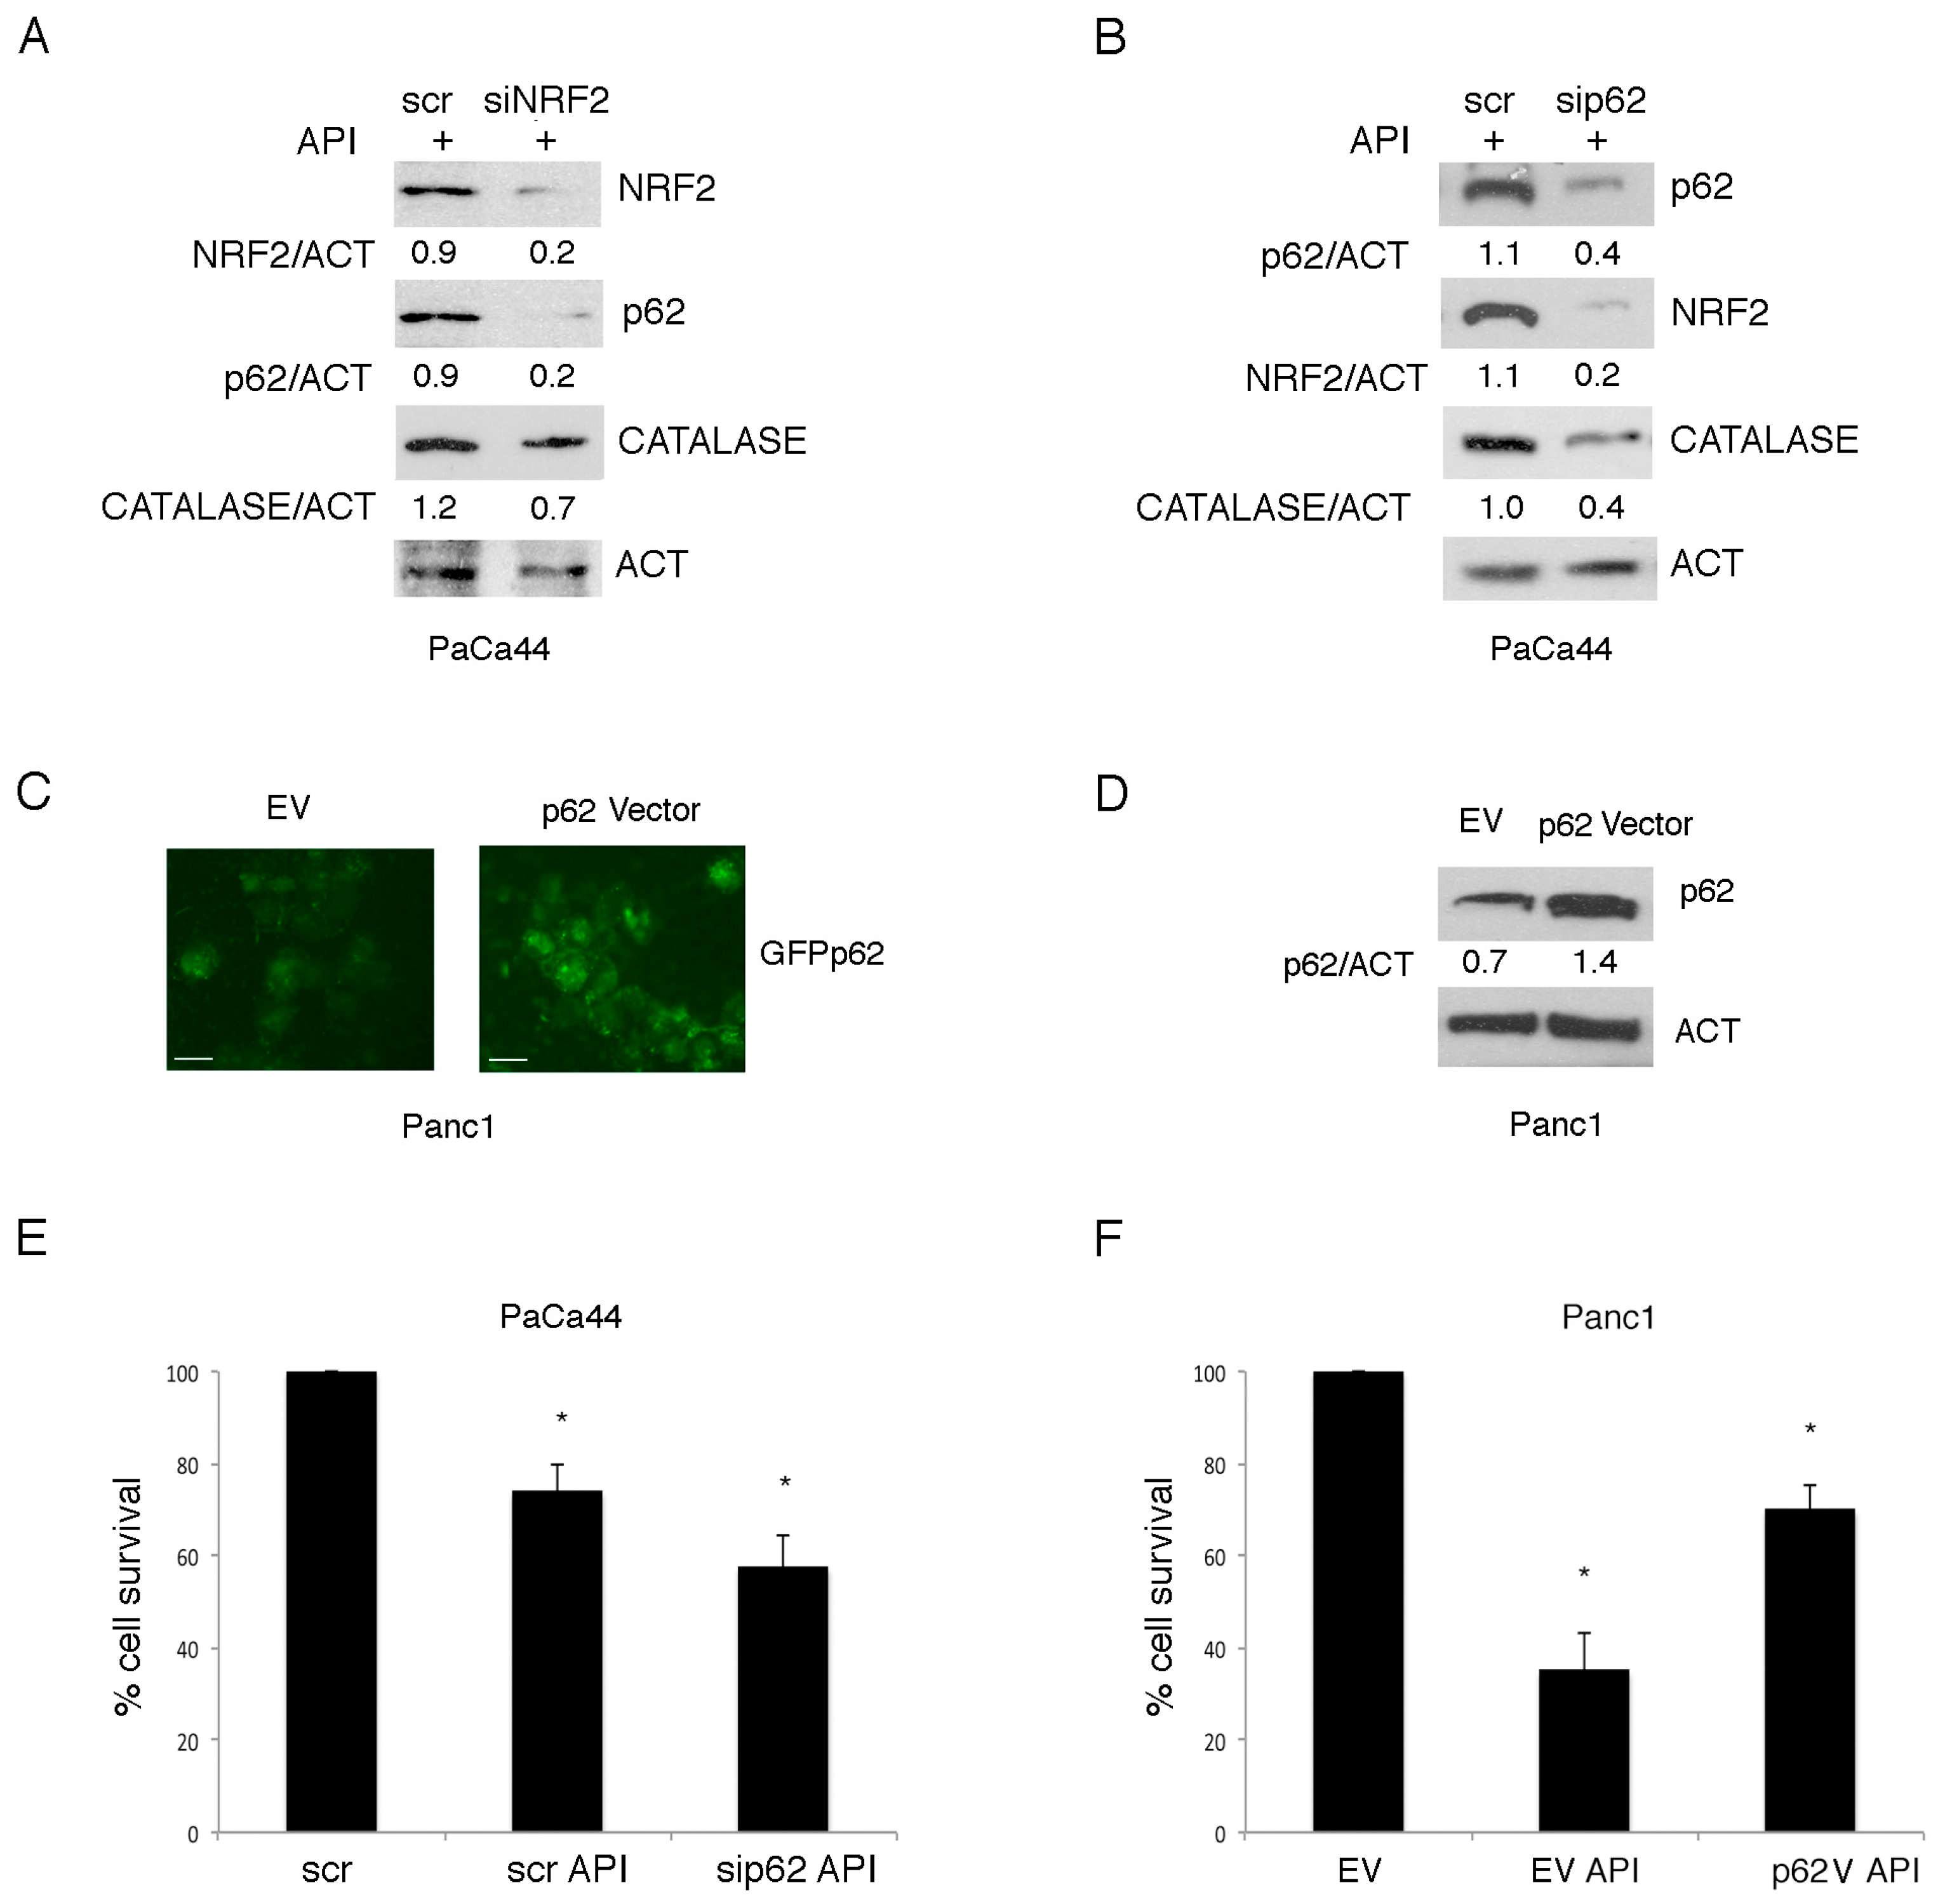
2.5. Mutp53 Activated NRF2 to Up-Regulate p62 that in Turn Contributes to NRF2 Activation
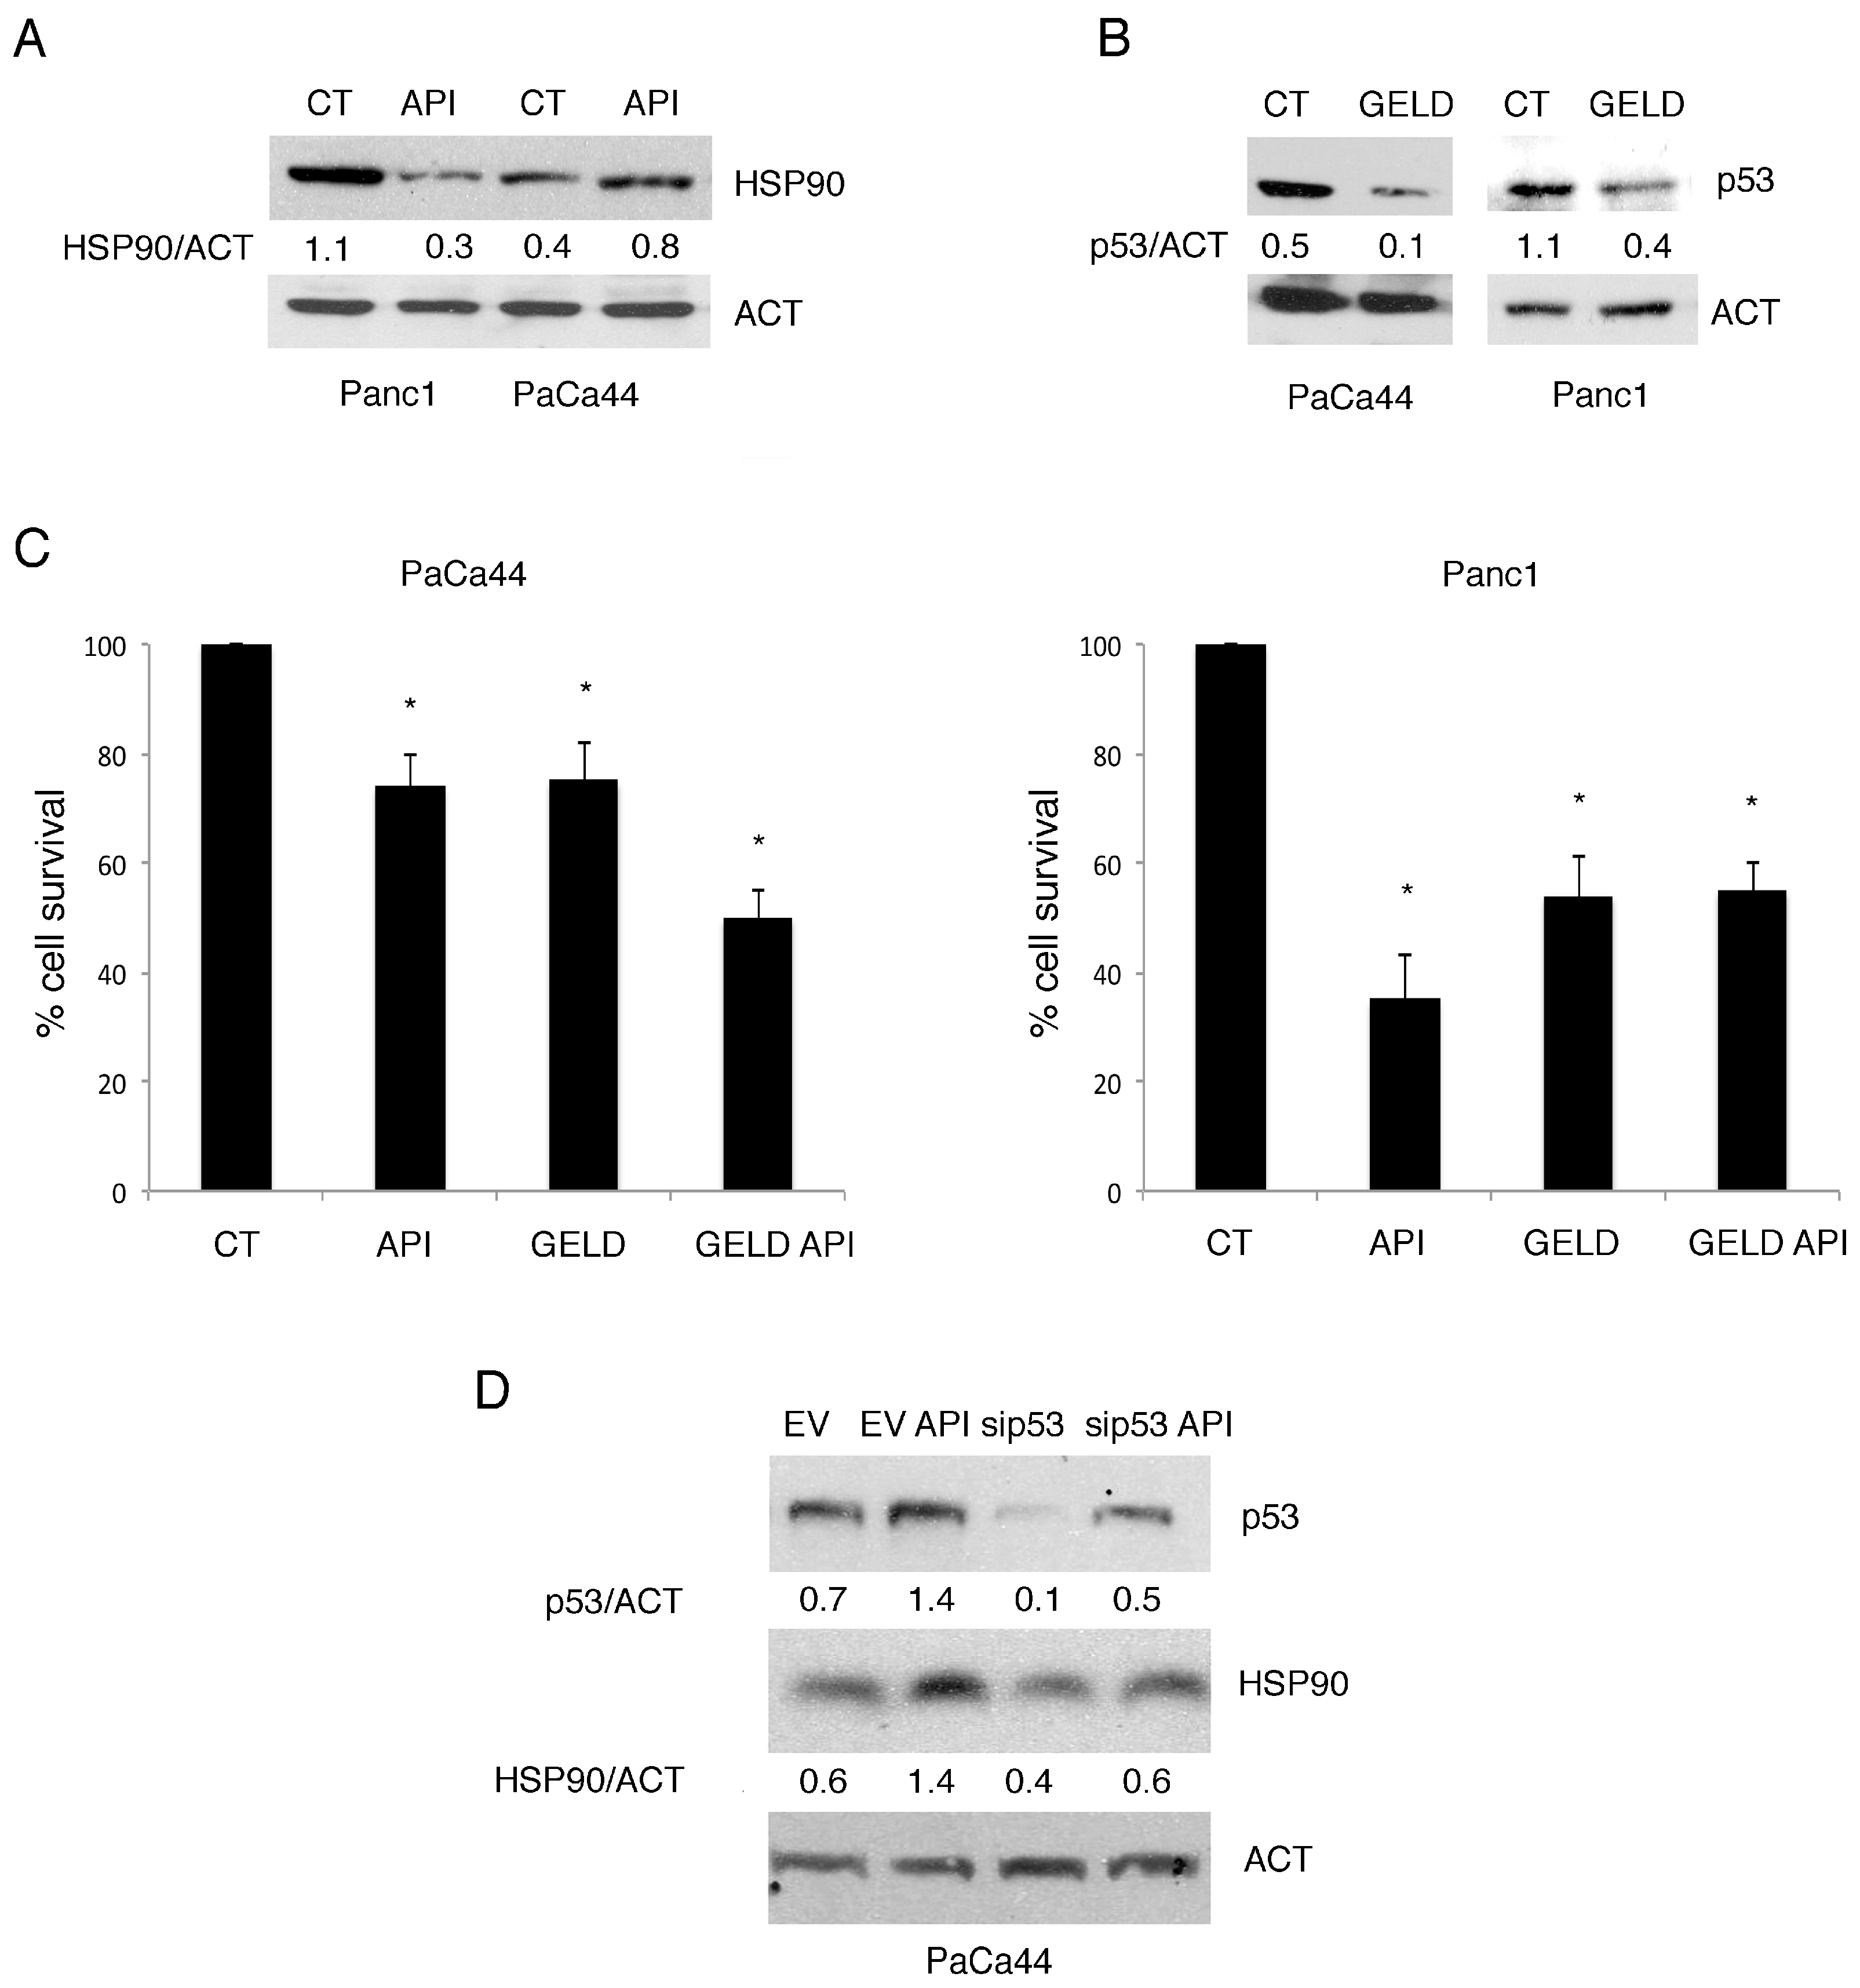
2.6. The Expression of mutp53 Was Dependent on HSP90 Expression and Correlated with mTORC1 Activation in Pancreatic Cancer Cell Lines
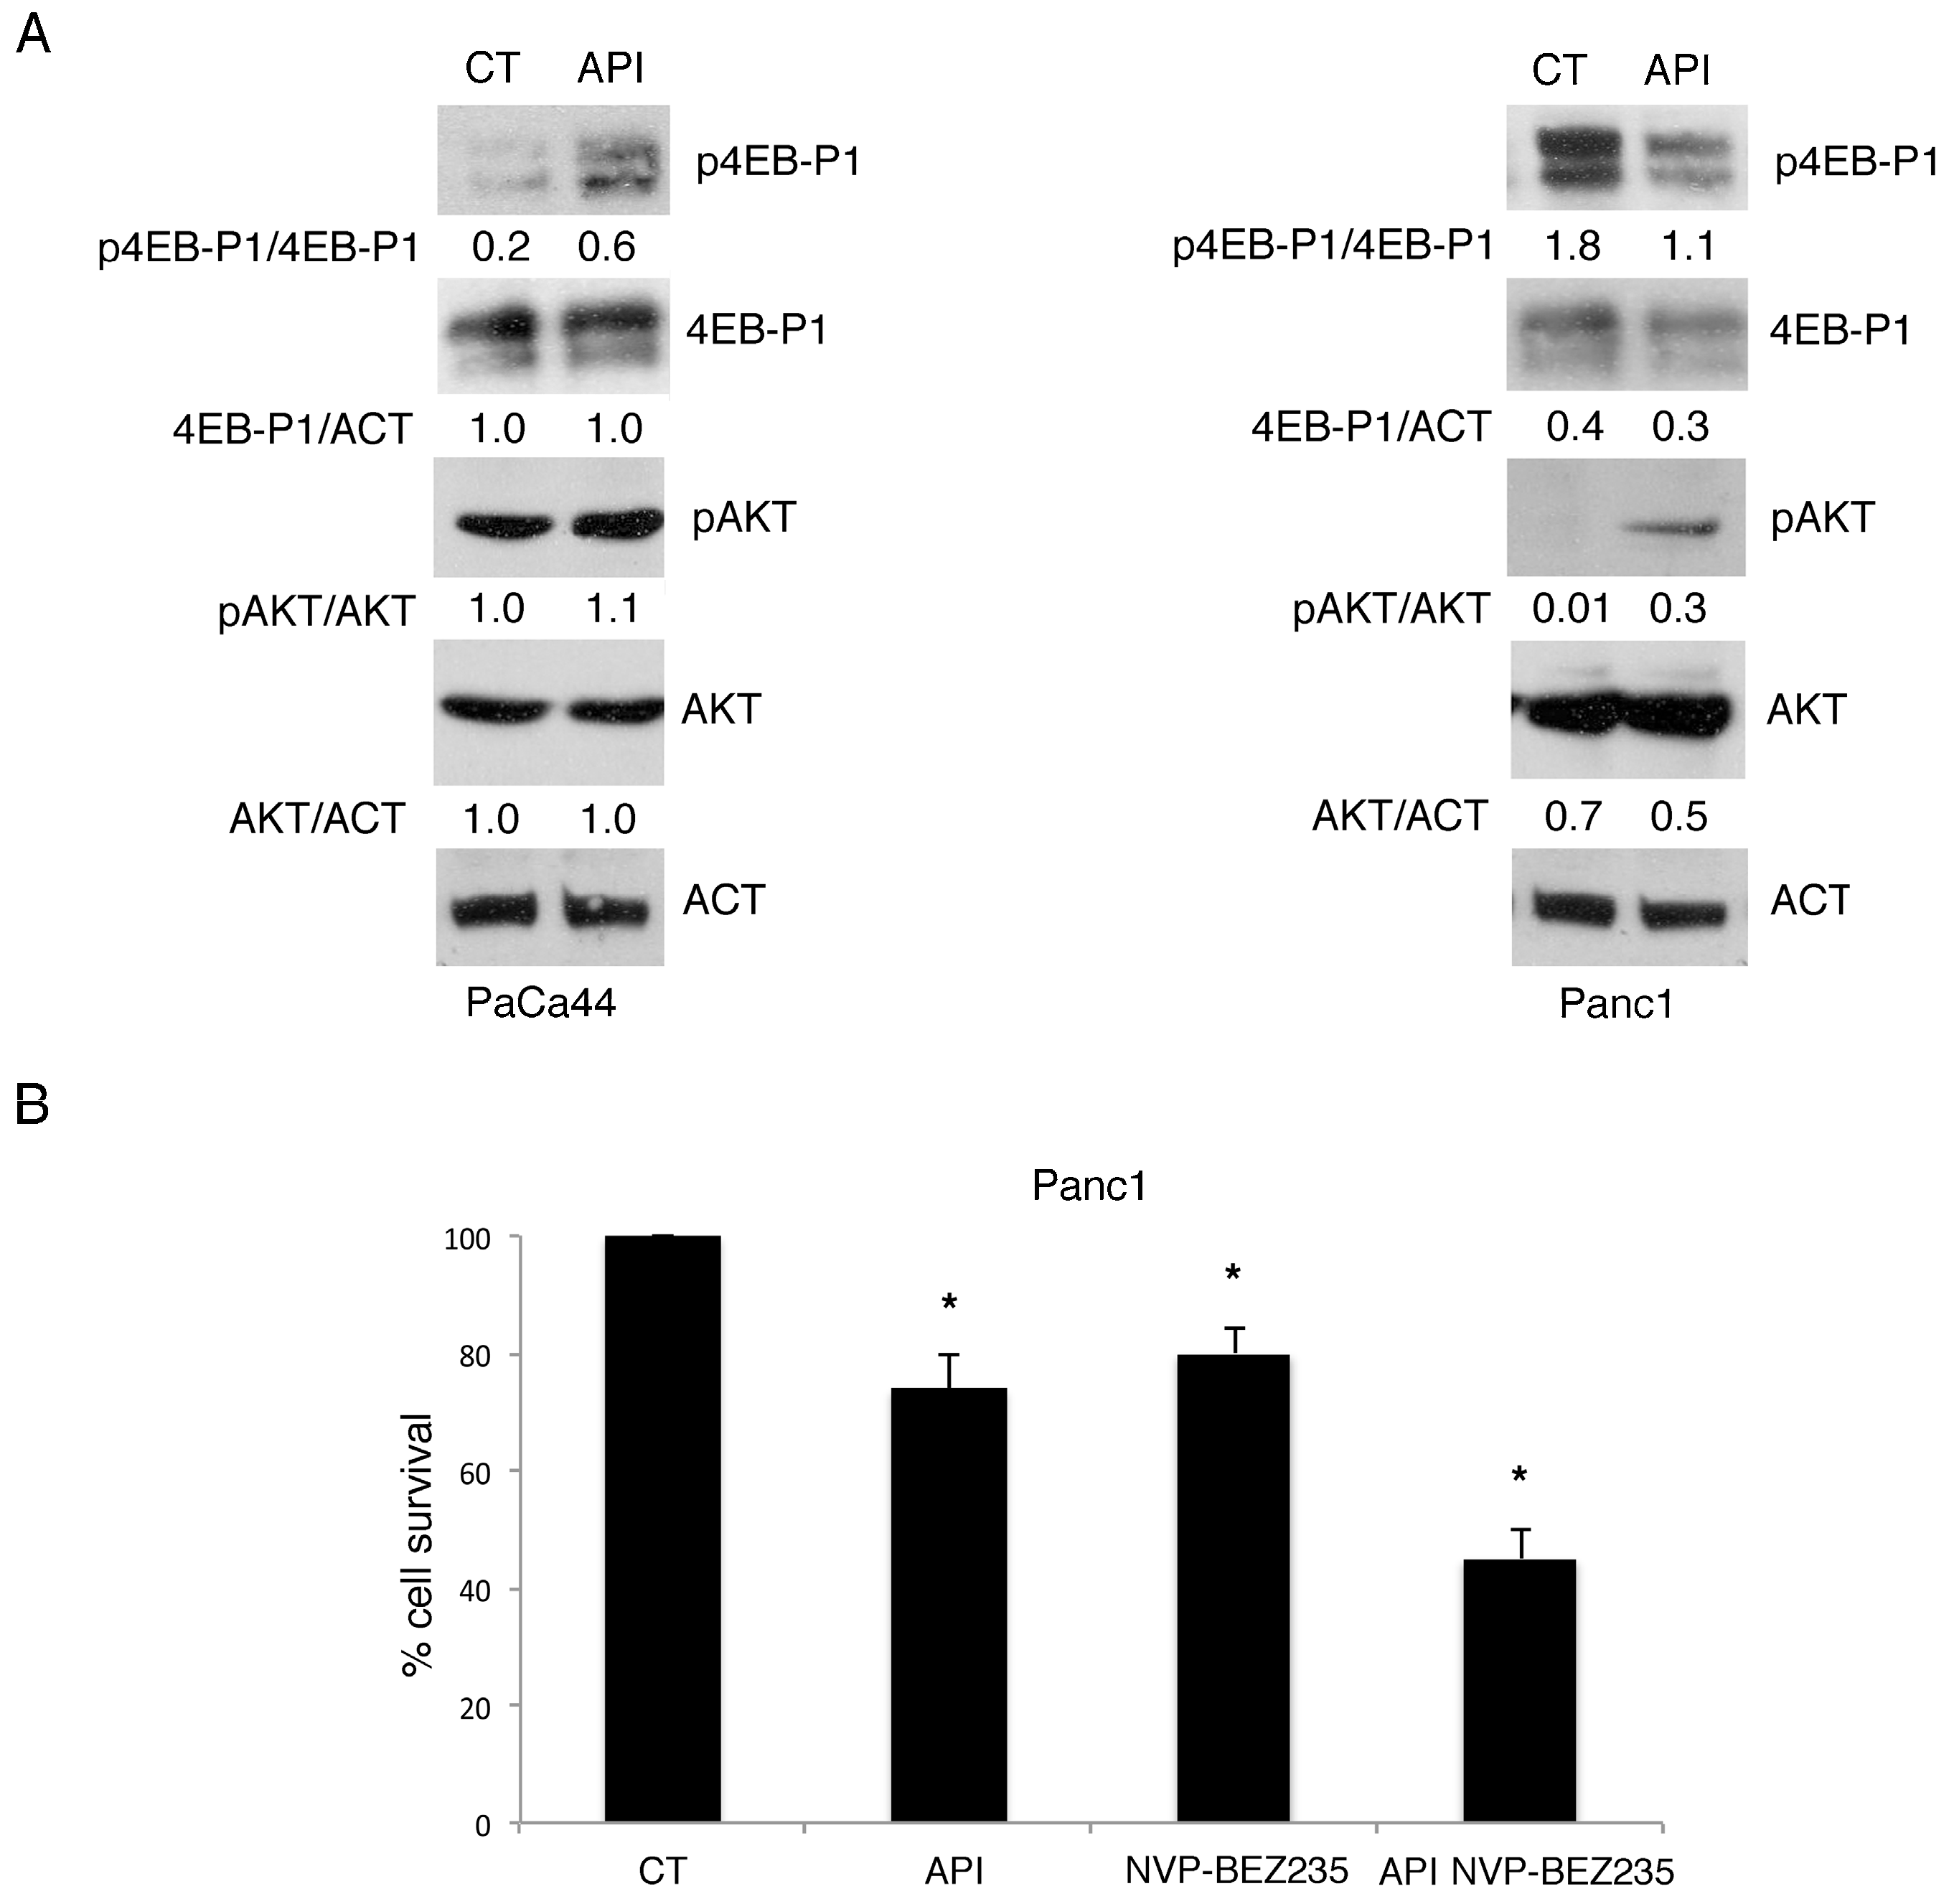
2.7. mTORC1 Activation Regulates Chemoresistance to Apigenin in PaCa44
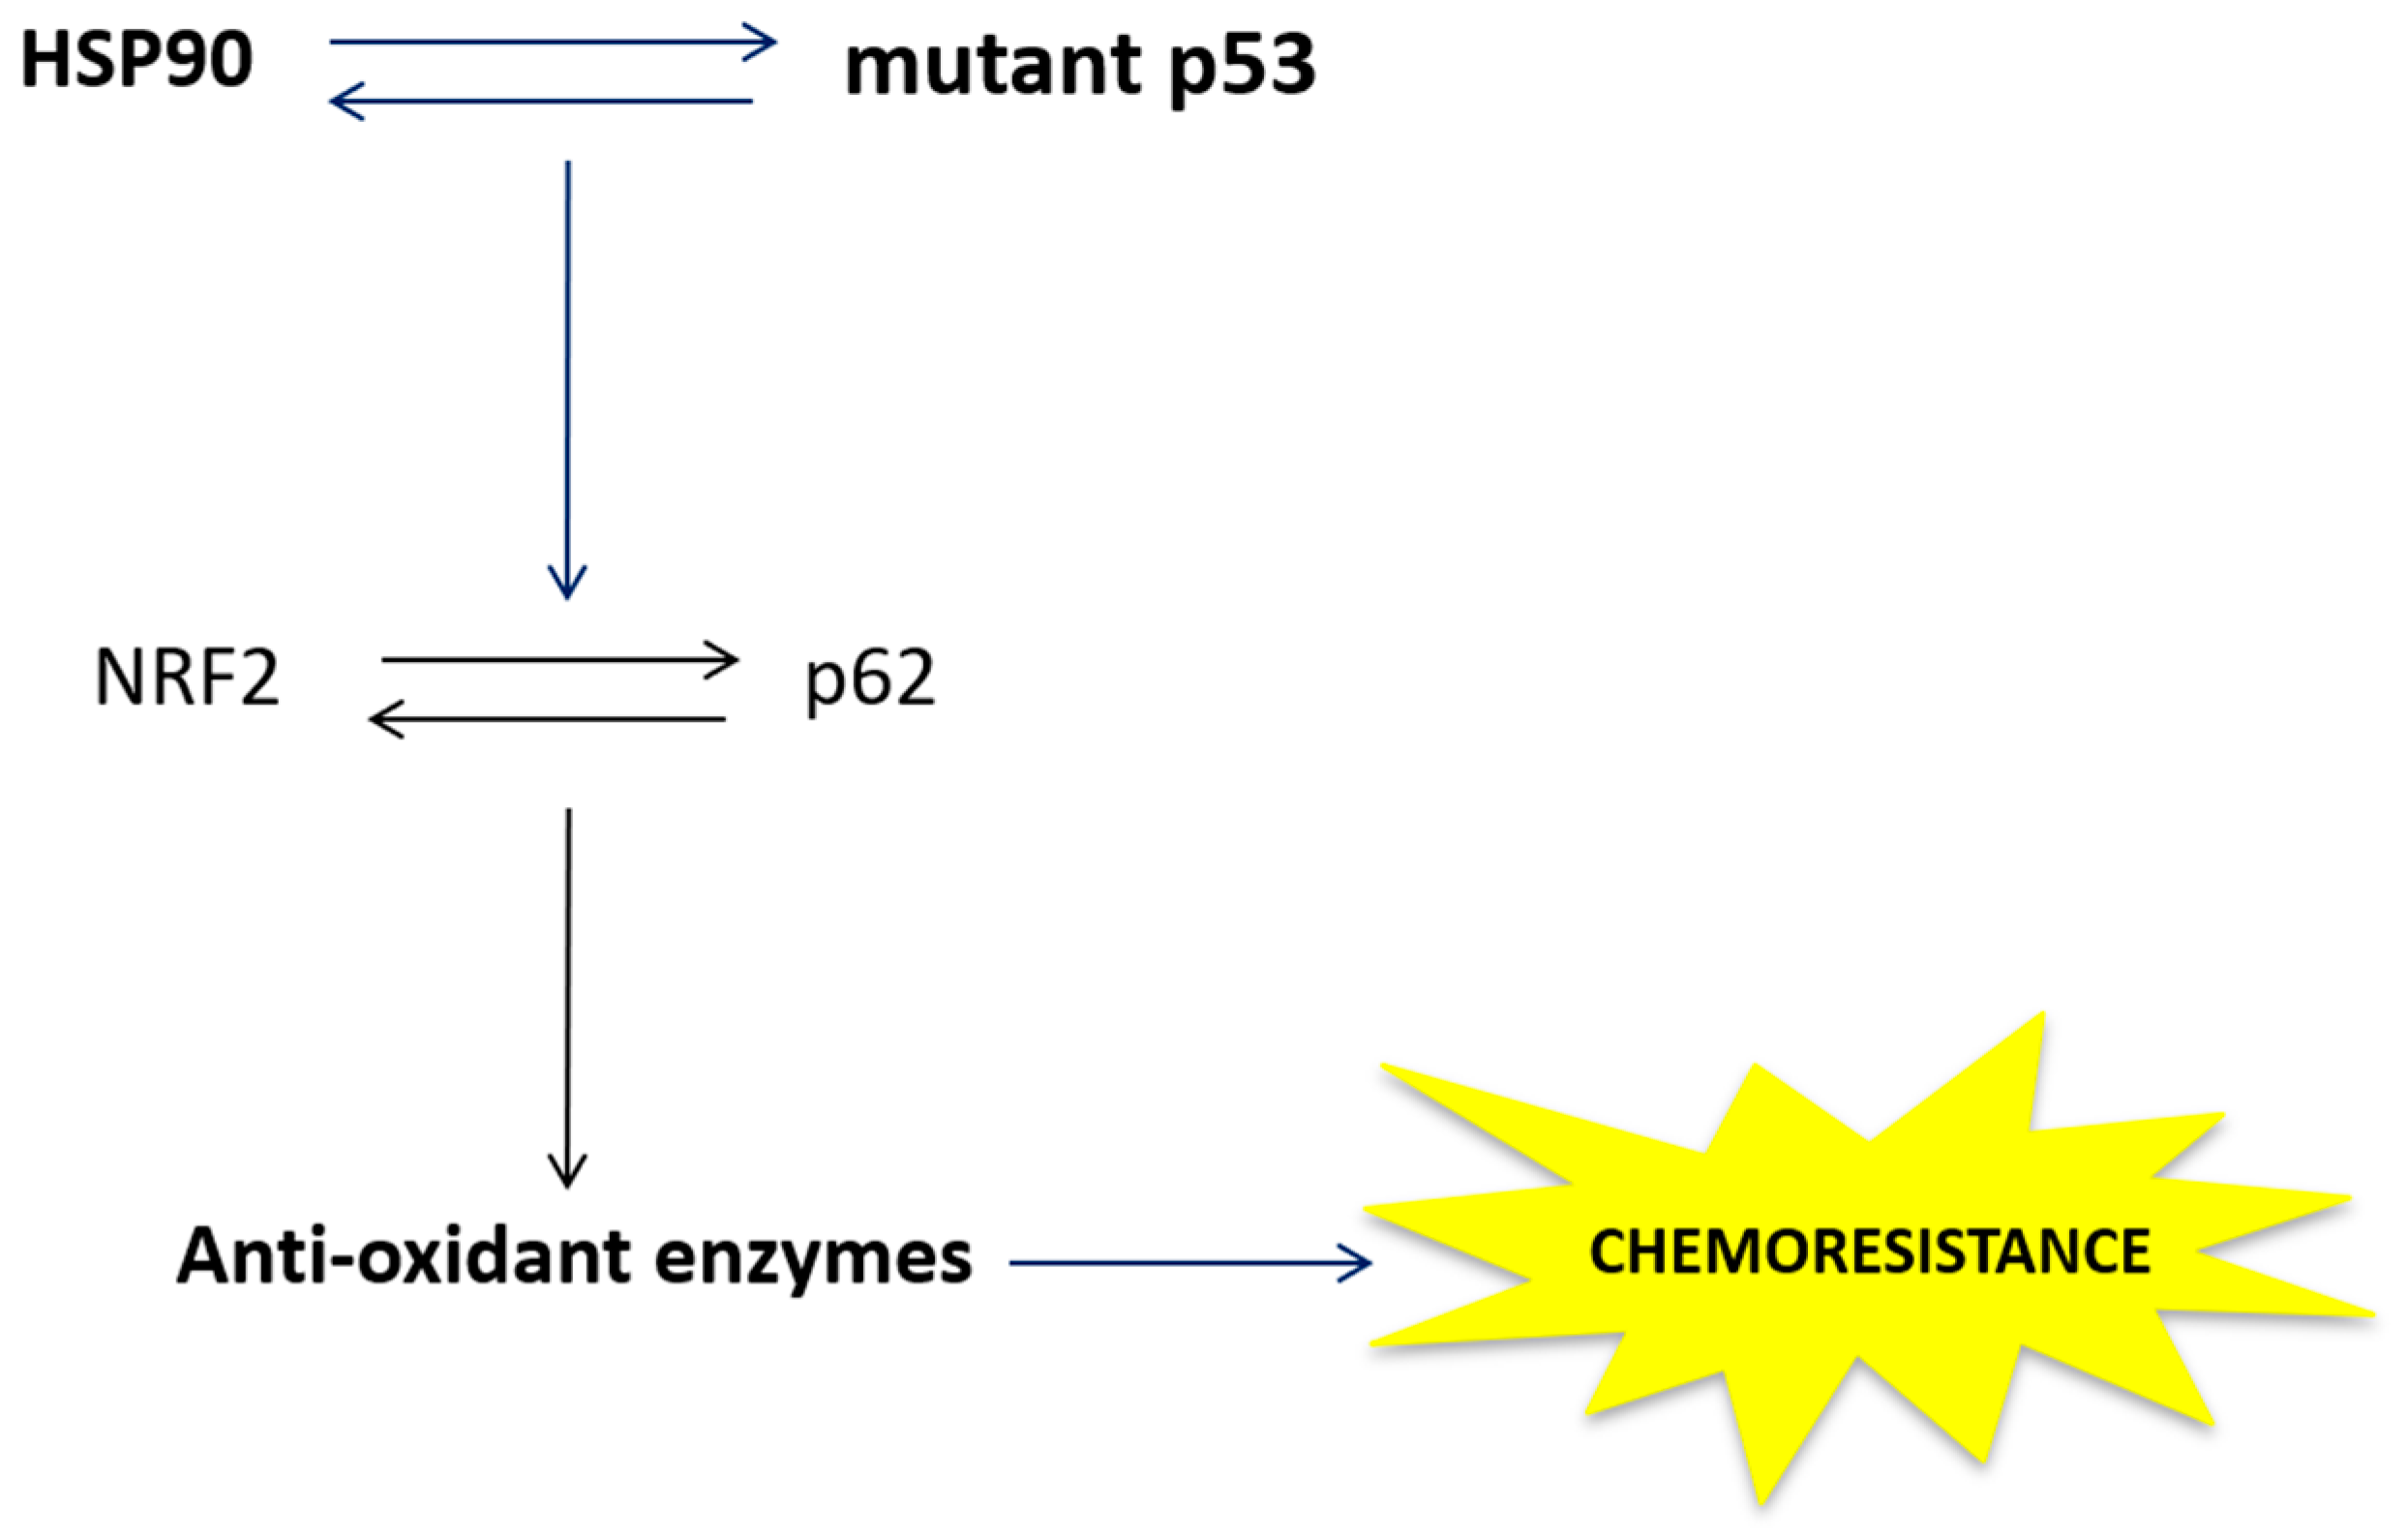
3. Discussion
4. Materials and Methods
4.1. Cell Culture and Reagents
4.2. Cell Viability
4.3. Western Blot Analysis
4.4. Measurement of Intracellular Reactive Oxygen Species Production
4.5. Indirect Immunofluorescence Assay (IFA)
4.6. p53, p62 and NRF2 Silencing and p62 Overexpression
4.7. RNA Extraction
4.8. Reverse-Transcription and Quantitative PCR (qRT-PCR)
4.9. Densitometric Analysis
4.10. Statistical Analysis
5. Conclusions
Author Contributions
Funding
Acknowledgments
Conflicts of Interest
References
- Adamska, A.; Domenichini, A.; Falasca, M. Pancreatic Ductal Adenocarcinoma: Current and Evolving Therapies. Int. J. Mol. Sci. 2017, 18, 1338. [Google Scholar] [CrossRef]
- Ali, F.; Rahul; Naz, F.; Jyoti, S.; Siddique, Y.H. Health functionality of apigenin: A review. Int. J. Food Prop. 2017, 20, 1197–1238. [Google Scholar] [CrossRef]
- Granato, M.; Montani, M.S.; Santarelli, R.; D’Orazi, G.; Faggioni, A.; Cirone, M. Apigenin, by activating p53 and inhibiting STAT3, modulates the balance between pro-apoptotic and pro-survival pathways to induce PEL cell death. J. Exp. Clin. Cancer Res. 2017, 36, 167. [Google Scholar] [CrossRef] [Green Version]
- Shukla, S.; Gupta, S. Apigenin-induced prostate cancer cell death is initiated by reactive oxygen species and p53 activation. Free Radic. Biol. Med. 2008, 44, 1833–1845. [Google Scholar] [CrossRef] [PubMed] [Green Version]
- Yang, H.; Villani, R.M.; Wang, H.; Simpson, M.J.; Roberts, M.S.; Tang, M.; Liang, X. The role of cellular reactive oxygen species in cancer chemotherapy. J. Exp. Clin. Cancer Res. 2018, 37, 266. [Google Scholar] [CrossRef] [PubMed]
- Kumari, S.; Badana, A.K.; Malla, R. Reactive Oxygen Species: A Key Constituent in Cancer Survival. Biomark. Insights 2018, 13, 1177271918755391. [Google Scholar] [CrossRef] [PubMed]
- Liu, Y.; Li, Q.; Zhou, L.; Xie, N.; Nice, E.C.; Zhang, H.; Huang, C.; Lei, Y. Cancer drug resistance: Redox resetting renders a way. Oncotarget 2016, 7, 42740–42761. [Google Scholar] [CrossRef] [PubMed]
- Chatterjee, M.; Andrulis, M.; Stuhmer, T.; Muller, E.; Hofmann, C.; Steinbrunn, T.; Heimberger, T.; Schraud, H.; Kressmann, S.; Einsele, H.; et al. The PI3K/Akt signaling pathway regulates the expression of Hsp70, which critically contributes to Hsp90-chaperone function and tumor cell survival in multiple myeloma. Haematologica 2013, 98, 1132–1141. [Google Scholar] [CrossRef] [PubMed]
- De La Rojo Vega, M.; Chapman, E.; Zhang, D.D. NRF2 and the Hallmarks of Cancer. Cancer Cell 2018, 34, 21–43. [Google Scholar] [CrossRef]
- Mantovani, F.; Collavin, L.; Del Sal, G. Mutant p53 as a guardian of the cancer cell. Cell Death Differ. 2019, 26, 199–212. [Google Scholar] [CrossRef]
- Bellazzo, A.; Sicari, D.; Valentino, E.; Del Sal, G.; Collavin, L. Complexes formed by mutant p53 and their roles in breast cancer. Breast Cancer 2018, 10, 101–112. [Google Scholar] [CrossRef]
- Muller, P.A.; Vousden, K.H. Mutant p53 in cancer: New functions and therapeutic opportunities. Cancer Cell 2014, 25, 304–317. [Google Scholar] [CrossRef] [PubMed]
- Du, Y.; Liu, Z.; You, L.; Hou, P.; Ren, X.; Jiao, T.; Zhao, W.; Li, Z.; Shu, H.; Liu, C.; et al. Pancreatic Cancer Progression Relies upon Mutant p53-Induced Oncogenic Signaling Mediated by NOP14. Cancer Res. 2017, 77, 2661–2673. [Google Scholar] [CrossRef] [Green Version]
- Alexandrova, E.M.; Yallowitz, A.R.; Li, D.; Xu, S.; Schulz, R.; Proia, D.A.; Lozano, G.; Dobbelstein, M.; Moll, U.M. Improving survival by exploiting tumour dependence on stabilized mutant p53 for treatment. Nature 2015, 523, 352–356. [Google Scholar] [CrossRef] [PubMed] [Green Version]
- Solarova, Z.; Mojzis, J.; Solar, P. Hsp90 inhibitor as a sensitizer of cancer cells to different therapies (review). Int. J. Oncol. 2015, 46, 907–926. [Google Scholar] [CrossRef] [PubMed]
- Li, D.; Yallowitz, A.; Ozog, L.; Marchenko, N. A gain-of-function mutant p53-HSF1 feed forward circuit governs adaptation of cancer cells to proteotoxic stress. Cell Death Dis. 2014, 5, e1194. [Google Scholar] [CrossRef] [PubMed]
- Naidu, S.D.; Kostov, R.V.; Dinkova-Kostova, A.T. Transcription factors Hsf1 and Nrf2 engage in crosstalk for cytoprotection. Trends Pharmacol. Sci. 2015, 36, 6–14. [Google Scholar] [CrossRef] [PubMed]
- Lisek, K.; Campaner, E.; Ciani, Y.; Walerych, D.; Del Sal, G. Mutant p53 tunes the NRF2-dependent antioxidant response to support survival of cancer cells. Oncotarget 2018, 9, 20508–20523. [Google Scholar] [CrossRef] [PubMed]
- Hamada, S.; Taguchi, K.; Masamune, A.; Yamamoto, M.; Shimosegawa, T. Nrf2 promotes mutant K-ras/p53-driven pancreatic carcinogenesis. Carcinogenesis 2017, 38, 661–670. [Google Scholar] [CrossRef]
- Schulz-Heddergott, R.; Moll, U.M. Gain-of-Function (GOF) Mutant p53 as Actionable Therapeutic Target. Cancers 2018, 10, 188. [Google Scholar] [CrossRef]
- Garufi, A.; Pucci, D.; D’Orazi, V.; Cirone, M.; Bossi, G.; Avantaggiati, M.L.; D’Orazi, G. Degradation of mutant p53H175 protein by Zn(II) through autophagy. Cell Death Dis. 2014, 5, e1271. [Google Scholar] [CrossRef] [PubMed]
- Garufi, A.; D’Orazi, V.; Crispini, A.; D’Orazi, G. Zn(II)-curc targets p53 in thyroid cancer cells. Int. J. Oncol. 2015, 47, 1241–1248. [Google Scholar] [CrossRef] [PubMed]
- Puca, R.; Nardinocchi, L.; Porru, M.; Simon, A.J.; Rechavi, G.; Leonetti, C.; Givol, D.; D’Orazi, G. Restoring p53 active conformation by zinc increases the response of mutant p53 tumor cells to anticancer drugs. Cell Cycle 2011, 10, 1679–1689. [Google Scholar] [CrossRef] [PubMed]
- Garufi, A.; Trisciuoglio, D.; Porru, M.; Leonetti, C.; Stoppacciaro, A.; D’Orazi, V.; Avantaggiati, M.; Crispini, A.; Pucci, D.; D’Orazi, G. A fluorescent curcumin-based Zn(II)-complex reactivates mutant (R175H and R273H) p53 in cancer cells. J. Exp. Clin. Cancer Res. 2013, 32, 72. [Google Scholar] [CrossRef]
- Garufi, A.; Pistritto, G.; Cirone, M.; D’Orazi, G. Reactivation of mutant p53 by capsaicin, the major constituent of peppers. J. Exp. Clin. Cancer Res. 2016, 35, 136. [Google Scholar] [CrossRef] [PubMed]
- Cordani, M.; Oppici, E.; Dando, I.; Butturini, E.; Dalla Pozza, E.; Nadal-Serrano, M.; Oliver, J.; Roca, P.; Mariotto, S.; Cellini, B.; et al. Mutant p53 proteins counteract autophagic mechanism sensitizing cancer cells to mTOR inhibition. Mol. Oncol. 2016, 10, 1008–1029. [Google Scholar] [CrossRef] [PubMed] [Green Version]
- Moore, P.S.; Sipos, B.; Orlandini, S.; Sorio, C.; Real, F.X.; Lemoine, N.R.; Gress, T.; Bassi, C.; Kloppel, G.; Kalthoff, H.; et al. Genetic profile of 22 pancreatic carcinoma cell lines. Analysis of K-ras, p53, p16 and DPC4/Smad4. Virchows Arch. 2001, 439, 798–802. [Google Scholar] [CrossRef] [PubMed]
- Walerych, D.; Lisek, K.; Sommaggio, R.; Piazza, S.; Ciani, Y.; Dalla, E.; Rajkowska, K.; Gaweda-Walerych, K.; Ingallina, E.; Tonelli, C.; et al. Proteasome machinery is instrumental in a common gain-of-function program of the p53 missense mutants in cancer. Nat. Cell Biol. 2016, 18, 897–909. [Google Scholar] [CrossRef] [PubMed]
- Kalo, E.; Kogan-Sakin, I.; Solomon, H.; Bar-Nathan, E.; Shay, M.; Shetzer, Y.; Dekel, E.; Goldfinger, N.; Buganim, Y.; Stambolsky, P.; et al. Mutant p53R273H attenuates the expression of phase 2 detoxifying enzymes and promotes the survival of cells with high levels of reactive oxygen species. J. Cell Sci. 2012, 125, 5578–5586. [Google Scholar] [CrossRef]
- Klionsky, D.J.; Abdelmohsen, K.; Abe, A.; Abedin, M.J.; Abeliovich, H.; Acevedo Arozena, A.; Adachi, H.; Adams, C.M.; Adams, P.D.; Adeli, K.; et al. Guidelines for the use and interpretation of assays for monitoring autophagy (3rd edition). Autophagy 2016. [Google Scholar] [CrossRef]
- Jain, A.; Lamark, T.; Sjottem, E.; Larsen, K.B.; Awuh, J.A.; Overvatn, A.; McMahon, M.; Hayes, J.D.; Johansen, T. p62/SQSTM1 is a target gene for transcription factor NRF2 and creates a positive feedback loop by inducing antioxidant response element-driven gene transcription. J. Biol. Chem. 2010, 285, 22576–22591. [Google Scholar] [CrossRef]
- Gilardini Montani, M.S.; Santarelli, R.; Granato, M.; Gonnella, R.; Torrisi, M.R.; Faggioni, A.; Cirone, M. EBV reduces autophagy, intracellular ROS and mitochondria to impair monocyte survival and differentiation. Autophagy 2019, 15, 652–667. [Google Scholar] [CrossRef]
- Jiang, T.; Harder, B.; de la Rojo Vega, M.; Wong, P.K.; Chapman, E.; Zhang, D.D. p62 links autophagy and Nrf2 signaling. Free Radic. Biol. Med. 2015, 88, 199–204. [Google Scholar] [CrossRef] [Green Version]
- Muller, P.; Hrstka, R.; Coomber, D.; Lane, D.P.; Vojtesek, B. Chaperone-dependent stabilization and degradation of p53 mutants. Oncogene 2008, 27, 3371–3383. [Google Scholar] [CrossRef] [Green Version]
- Zhao, M.; Ma, J.; Zhu, H.Y.; Zhang, X.H.; Du, Z.Y.; Xu, Y.J.; Yu, X.D. Apigenin inhibits proliferation and induces apoptosis in human multiple myeloma cells through targeting the trinity of CK2, Cdc37 and Hsp90. Mol. Cancer 2011, 10, 104. [Google Scholar] [CrossRef]
- Mansoori, B.; Mohammadi, A.; Davudian, S.; Shirjang, S.; Baradaran, B. The Different Mechanisms of Cancer Drug Resistance: A Brief Review. Adv. Pharm. Bull. 2017, 7, 339–348. [Google Scholar] [CrossRef] [PubMed]
- McGuigan, A.; Kelly, P.; Turkington, R.C.; Jones, C.; Coleman, H.G.; McCain, R.S. Pancreatic cancer: A review of clinical diagnosis, epidemiology, treatment and outcomes. World J. Gastroenterol. 2018, 24, 4846–4861. [Google Scholar] [CrossRef]
- Aung, T.N.; Qu, Z.; Kortschak, R.D.; Adelson, D.L. Understanding the Effectiveness of Natural Compound Mixtures in Cancer through Their Molecular Mode of Action. Int. J. Mol. Sci. 2017, 18, 656. [Google Scholar] [CrossRef] [PubMed]
- Thomford, N.E.; Senthebane, D.A.; Rowe, A.; Munro, D.; Seele, P.; Maroyi, A.; Dzobo, K. Natural Products for Drug Discovery in the 21st Century: Innovations for Novel Drug Discovery. Int. J. Mol. Sci. 2018, 19, 1578. [Google Scholar] [CrossRef]
- Yan, X.; Qi, M.; Li, P.; Zhan, Y.; Shao, H. Apigenin in cancer therapy: Anti-cancer effects and mechanisms of action. Cell Biosci. 2017, 7, 50. [Google Scholar] [CrossRef] [PubMed]
- King, J.C.; Lu, Q.Y.; Li, G.; Moro, A.; Takahashi, H.; Chen, M.; Go, V.L.; Reber, H.A.; Eibl, G.; Hines, O.J. Evidence for activation of mutated p53 by apigenin in human pancreatic cancer. Biochim. Biophys. Acta 2012, 1823, 593–604. [Google Scholar] [CrossRef] [PubMed] [Green Version]
- No, J.H.; Kim, Y.B.; Song, Y.S. Targeting nrf2 signaling to combat chemoresistance. J. Cancer Prev. 2014, 19, 111–117. [Google Scholar] [CrossRef] [PubMed]
- Tasdemir, E.; Chiara Maiuri, M.; Morselli, E.; Criollo, A.; D’Amelio, M.; Djavaheri-Mergny, M.; Cecconi, F.; Tavernarakis, N.; Kroemer, G. A dual role of p53 in the control of autophagy. Autophagy 2008, 4, 810–814. [Google Scholar] [CrossRef] [PubMed] [Green Version]
- Gilardini Montani, M.S.; Granato, M.; Santoni, C.; Del Porto, P.; Merendino, N.; D’Orazi, G.; Faggioni, A.; Cirone, M. Histone deacetylase inhibitors VPA and TSA induce apoptosis and autophagy in pancreatic cancer cells. Cell Oncol. 2017, 40, 167–180. [Google Scholar] [CrossRef]
- Bjorkoy, G.; Lamark, T.; Brech, A.; Outzen, H.; Perander, M.; Overvatn, A.; Stenmark, H.; Johansen, T. p62/SQSTM1 forms protein aggregates degraded by autophagy and has a protective effect on huntingtin-induced cell death. J. Cell Biol. 2005, 171, 603–614. [Google Scholar] [CrossRef] [PubMed] [Green Version]


© 2019 by the authors. Licensee MDPI, Basel, Switzerland. This article is an open access article distributed under the terms and conditions of the Creative Commons Attribution (CC BY) license (http://creativecommons.org/licenses/by/4.0/).
Share and Cite
Gilardini Montani, M.S.; Cecere, N.; Granato, M.; Romeo, M.A.; Falcinelli, L.; Ciciarelli, U.; D’Orazi, G.; Faggioni, A.; Cirone, M. Mutant p53, Stabilized by Its Interplay with HSP90, Activates a Positive Feed-Back Loop Between NRF2 and p62 that Induces Chemo-Resistance to Apigenin in Pancreatic Cancer Cells. Cancers 2019, 11, 703. https://0-doi-org.brum.beds.ac.uk/10.3390/cancers11050703
Gilardini Montani MS, Cecere N, Granato M, Romeo MA, Falcinelli L, Ciciarelli U, D’Orazi G, Faggioni A, Cirone M. Mutant p53, Stabilized by Its Interplay with HSP90, Activates a Positive Feed-Back Loop Between NRF2 and p62 that Induces Chemo-Resistance to Apigenin in Pancreatic Cancer Cells. Cancers. 2019; 11(5):703. https://0-doi-org.brum.beds.ac.uk/10.3390/cancers11050703
Chicago/Turabian StyleGilardini Montani, Maria Saveria, Nives Cecere, Marisa Granato, Maria Anele Romeo, Luca Falcinelli, Umberto Ciciarelli, Gabriella D’Orazi, Alberto Faggioni, and Mara Cirone. 2019. "Mutant p53, Stabilized by Its Interplay with HSP90, Activates a Positive Feed-Back Loop Between NRF2 and p62 that Induces Chemo-Resistance to Apigenin in Pancreatic Cancer Cells" Cancers 11, no. 5: 703. https://0-doi-org.brum.beds.ac.uk/10.3390/cancers11050703