Epigenome Mapping Identifies Tumor-Specific Gene Expression in Primary Rectal Cancer

 and
and 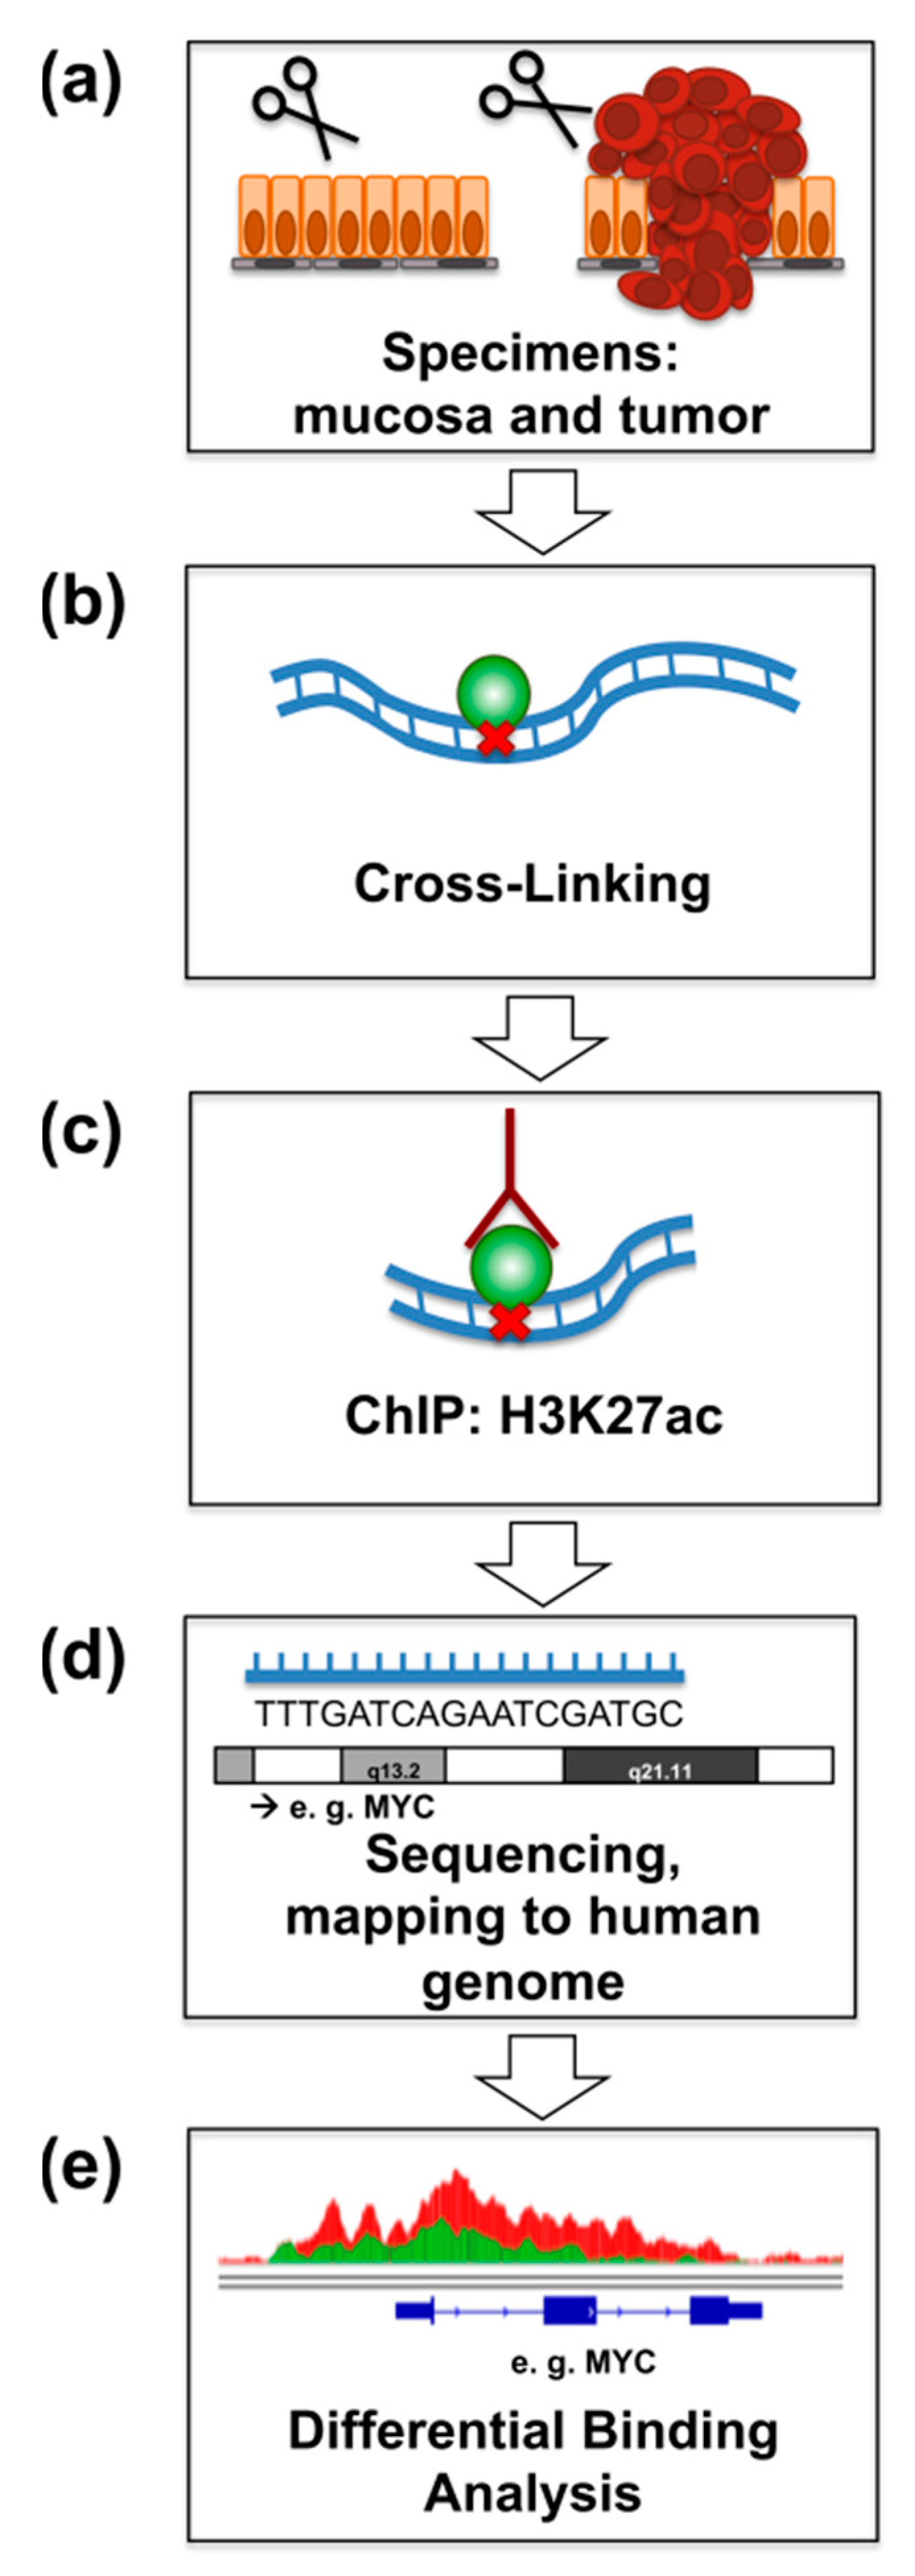
Abstract
:1. Introduction
2. Results
2.1. ChIP-Seq for H3K27ac from Primary Rectal Cancer and Adjacent Mucosa
2.2. Identification of Differentially H3K27ac-Enriched TSS in Tumor and Mucosa
2.3. Genes with Increased TSS-Proximal H3K27ac Are Differentially Expressed
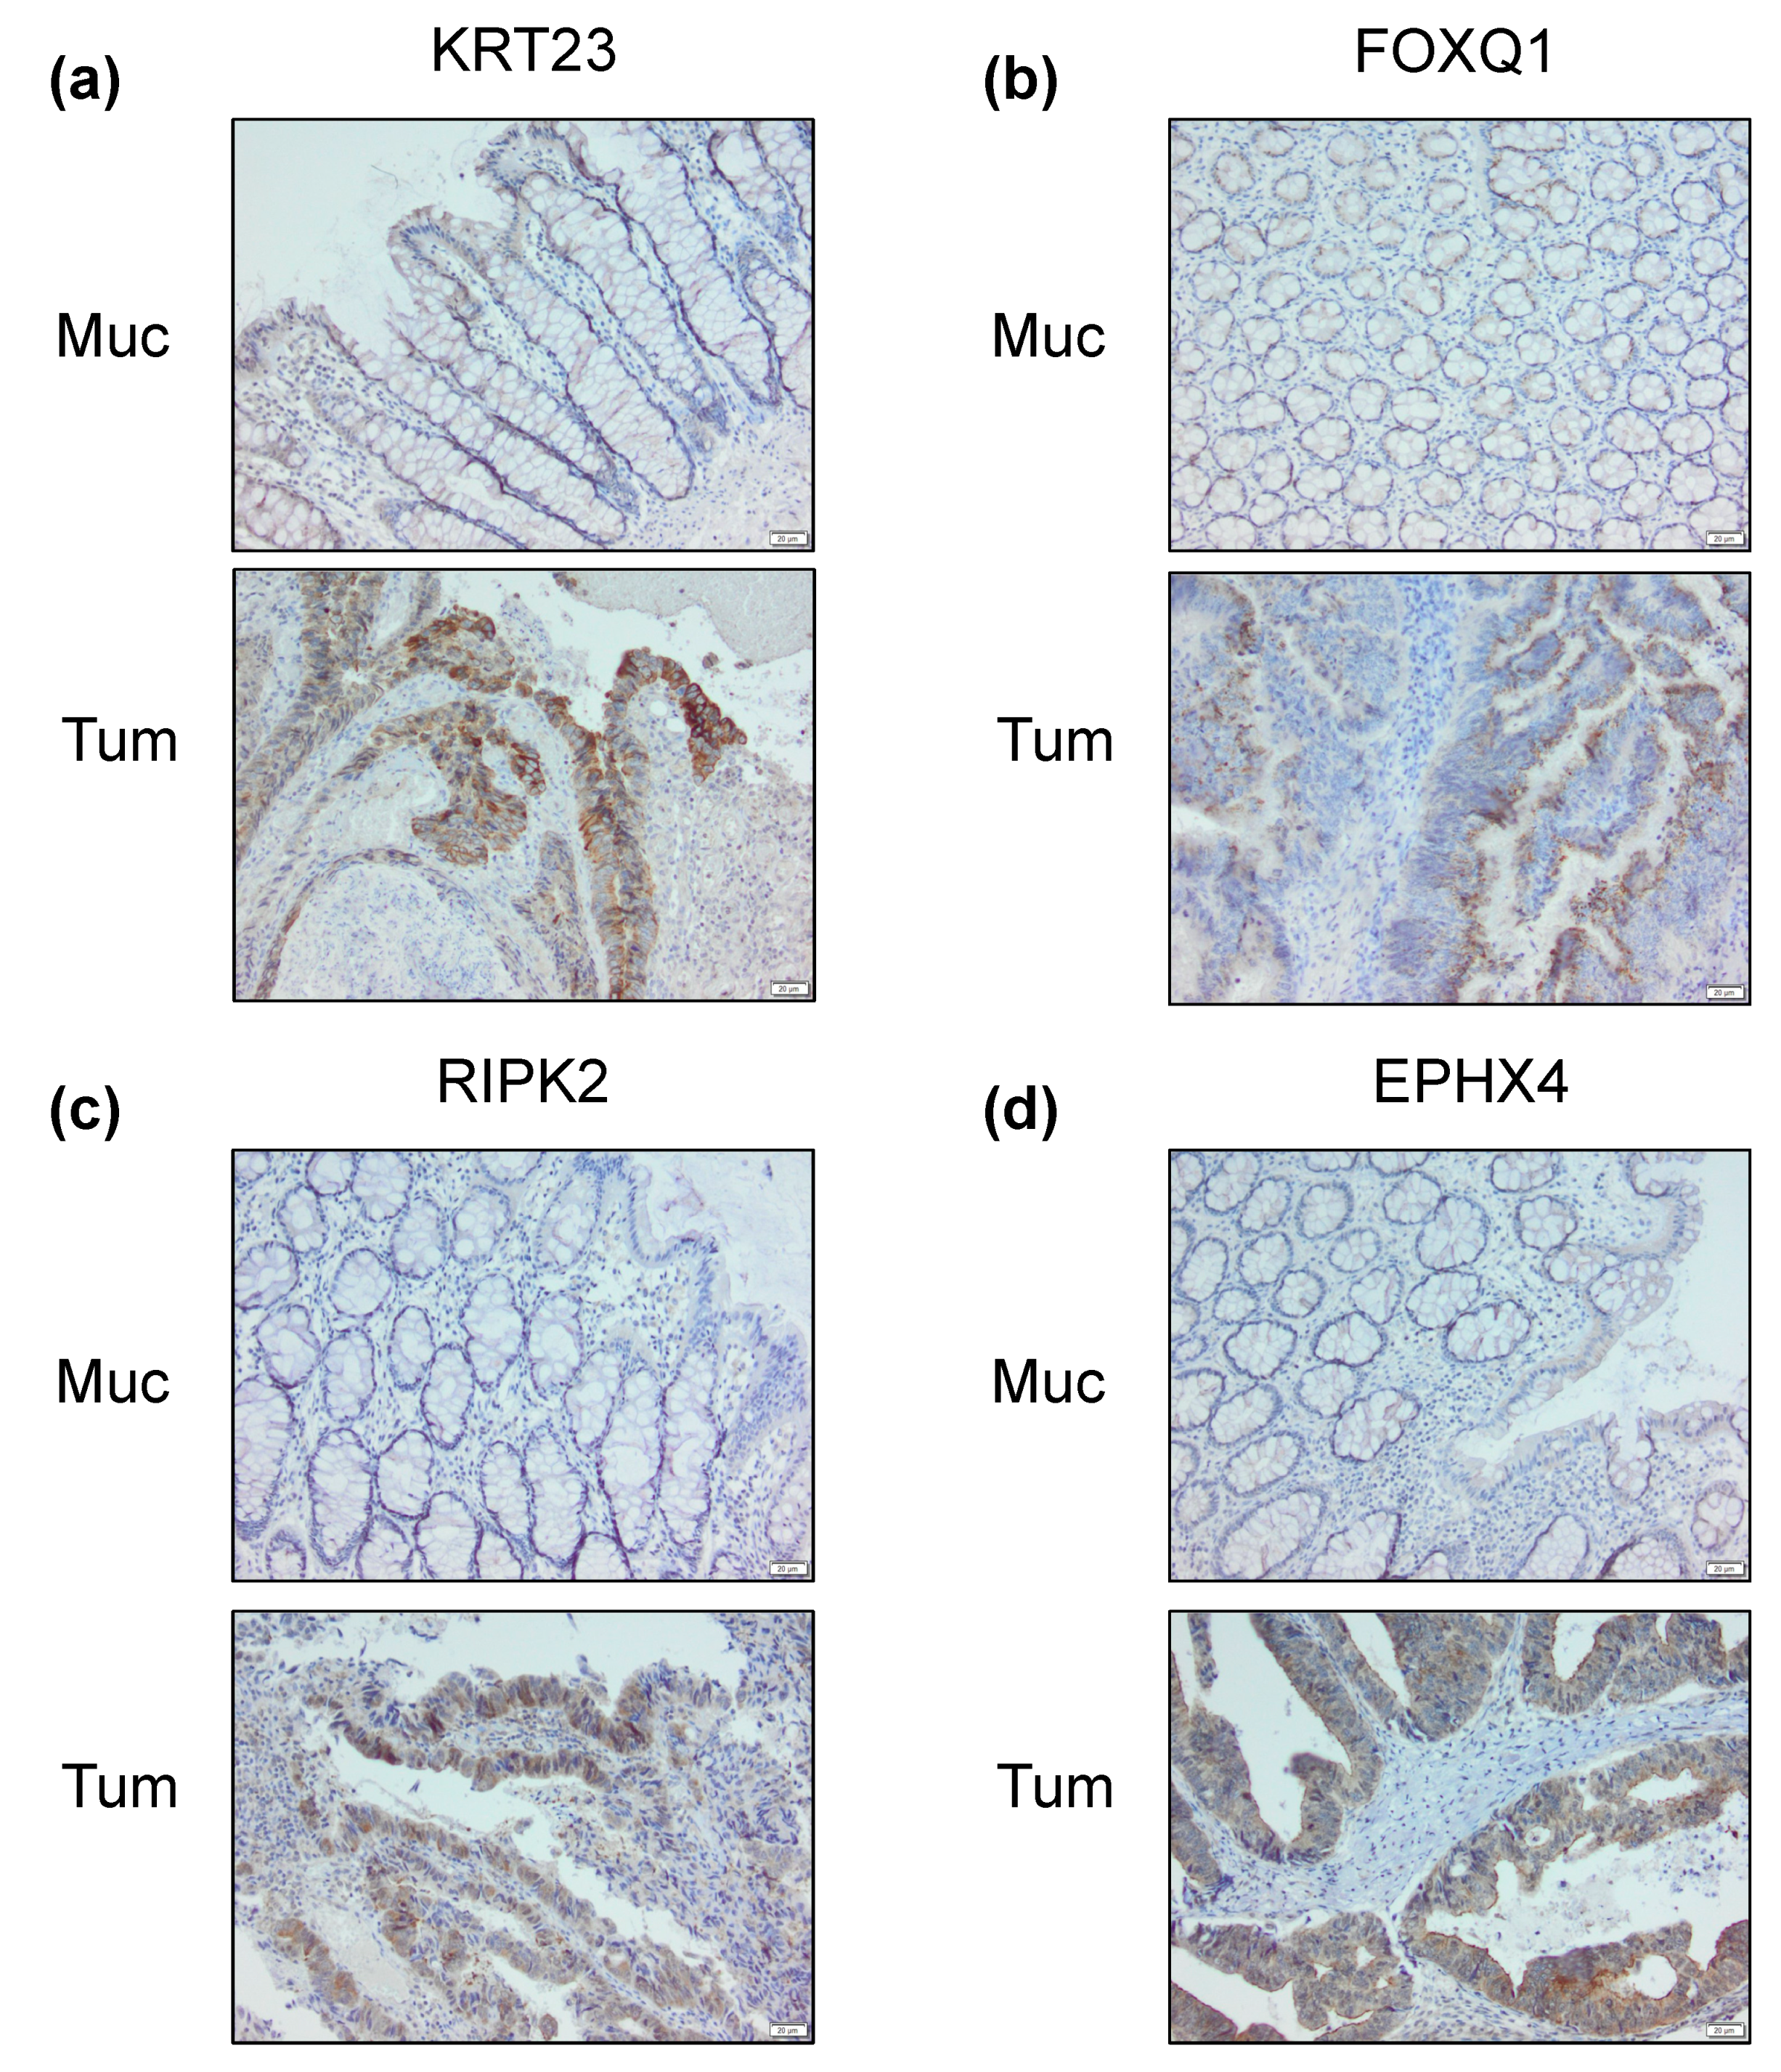
2.4. Differential Cancer-Specific H3K27ac Occupancy Correlates with Tumor-Specific Changes in Protein Expression
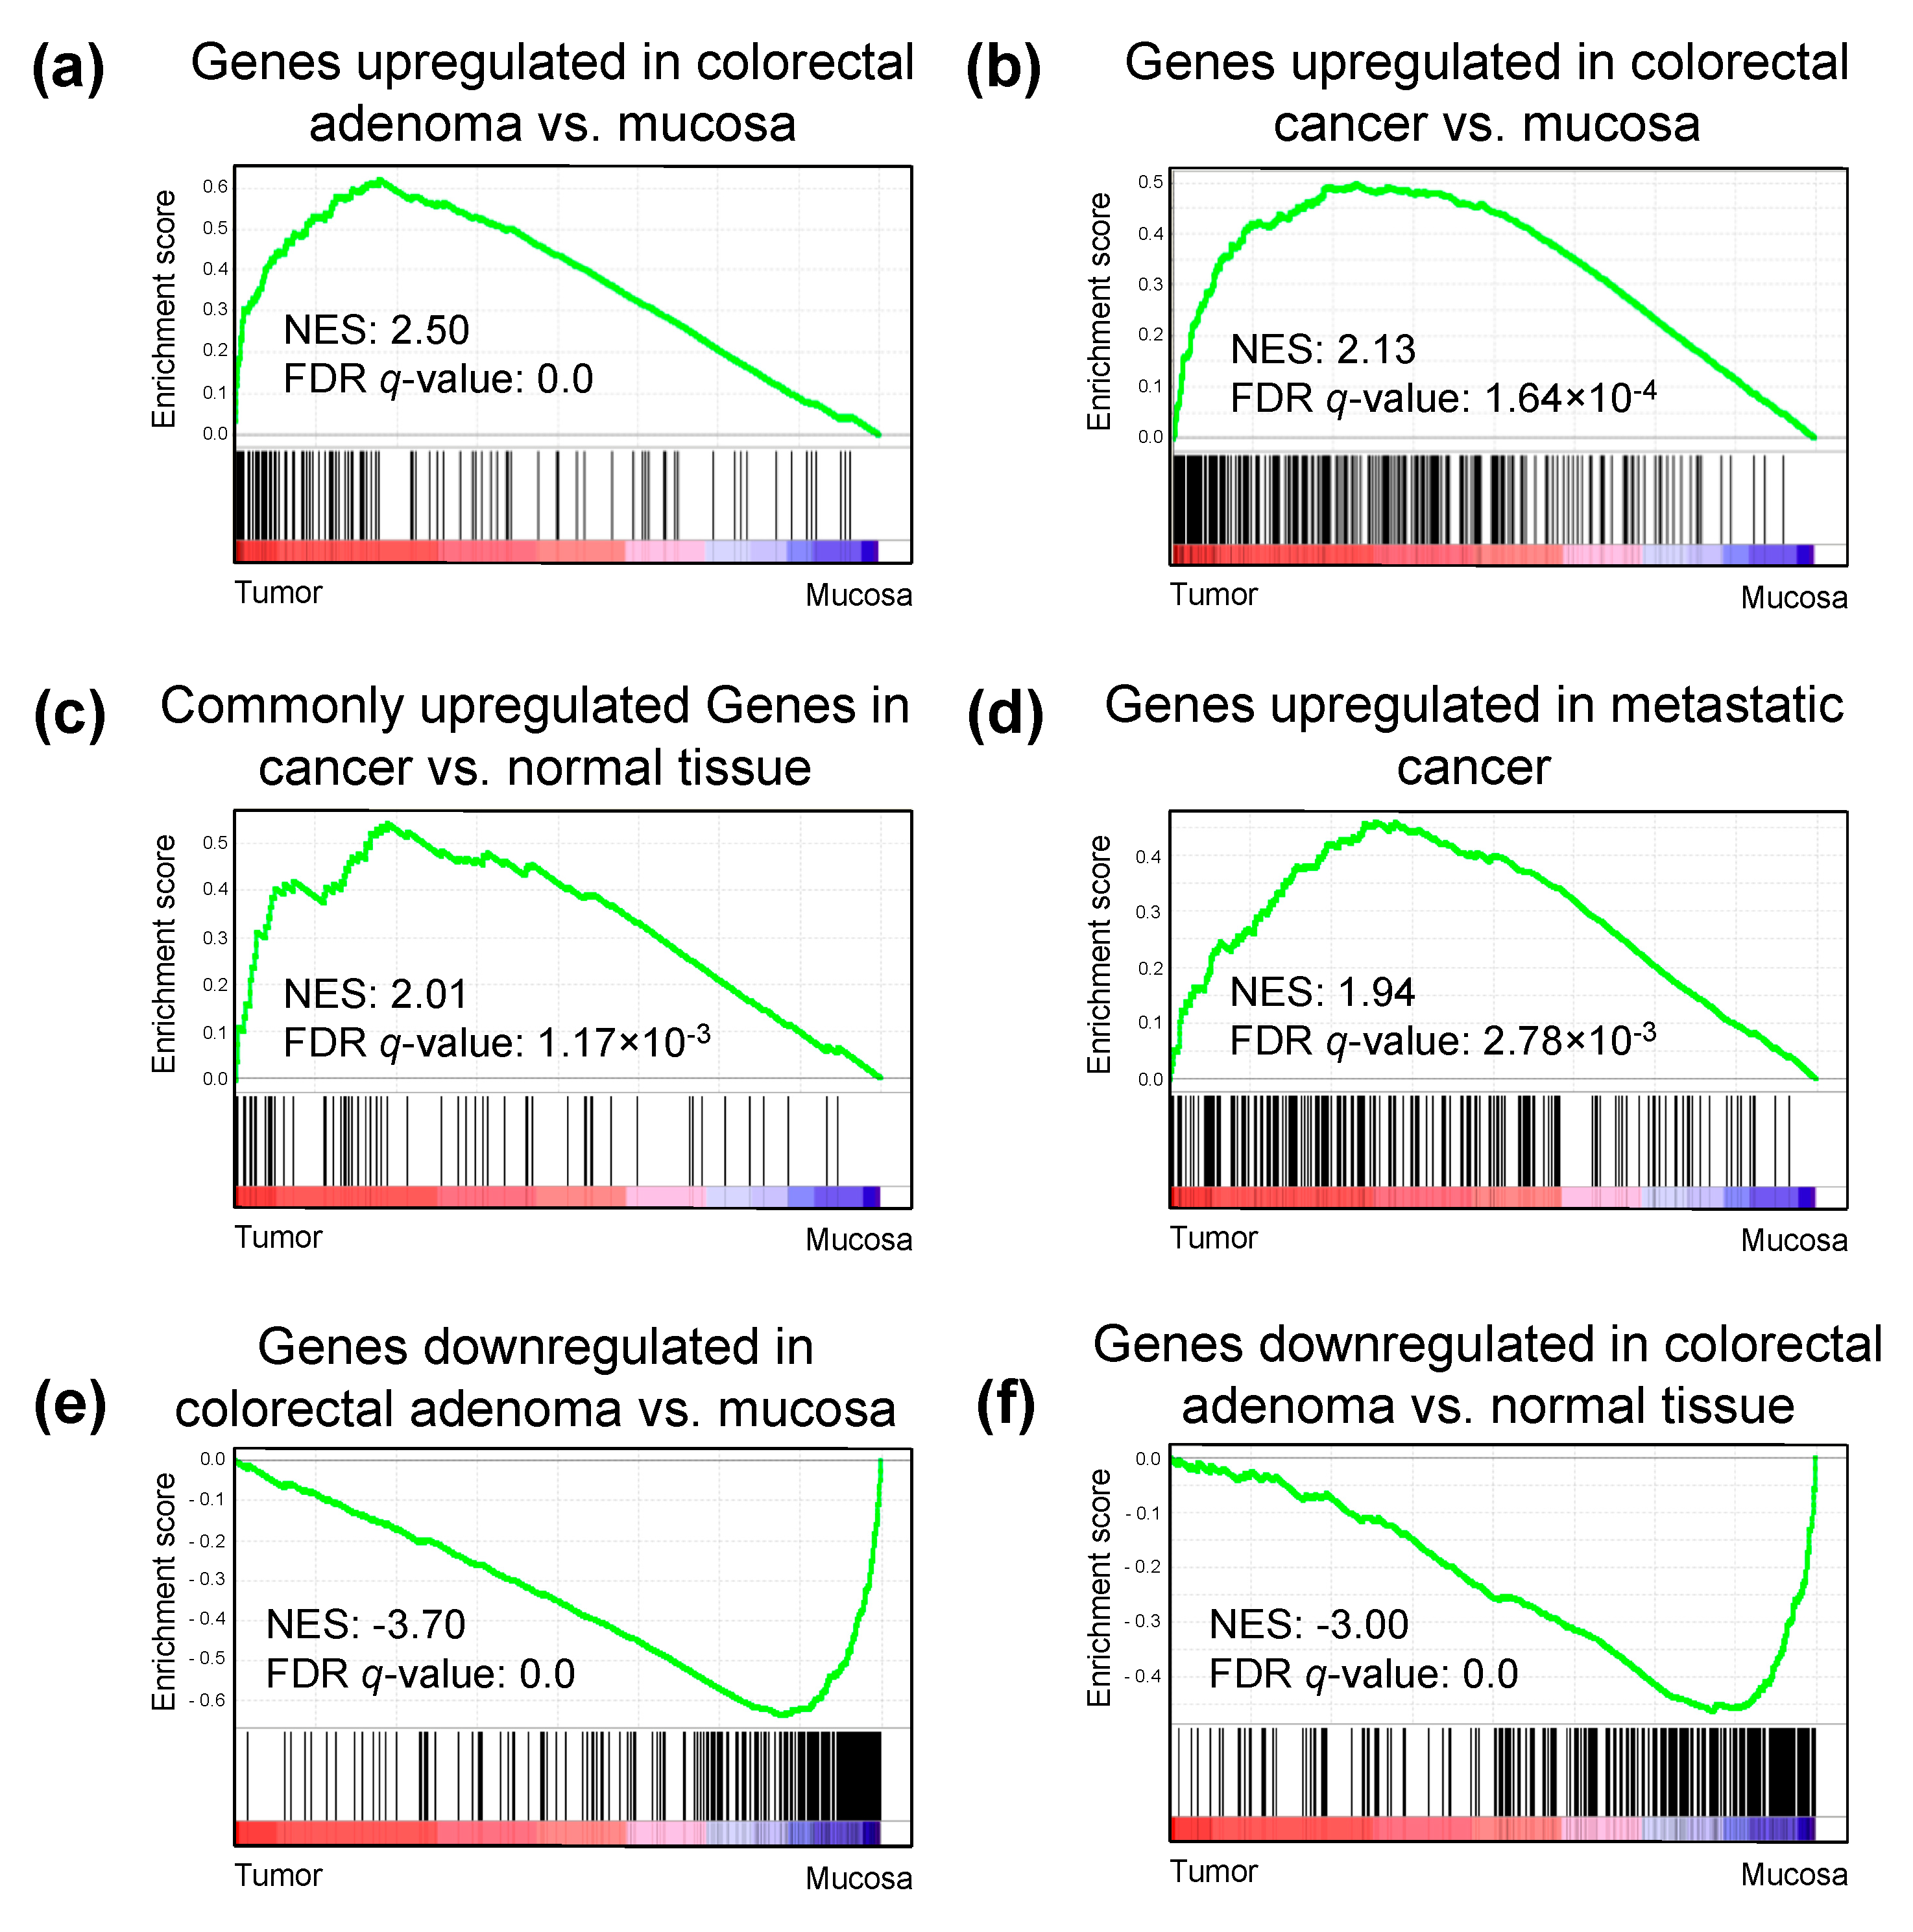
2.5. H3K27ac Enrichment Marks Tumorigenic Gene Sets
3. Discussion
4. Materials and Methods
4.1. Patients and Samples
4.2. Chromatin Immunoprecipitation and Next Generation Sequencing
4.3. Statistical Analysis of ChIP-Seq Data
4.4. Immunohistochemistry
5. Conclusions
Supplementary Materials
Author Contributions
Funding
Acknowledgments
Conflicts of Interest
References
- Siegel, R.L.; Miller, K.D.; Jemal, A. Cancer statistics, 2018. CA Cancer J. Clin. 2018, 68, 7–30. [Google Scholar] [CrossRef] [PubMed]
- Fearon, E.R.; Vogelstein, B. A genetic model for colorectal tumorigenesis. Cell 1990, 61, 759–767. [Google Scholar] [CrossRef]
- Ried, T.; Heselmeyer-Haddad, K.; Blegen, H.; Schrock, E.; Auer, G. Genomic changes defining the genesis, progression, and malignancy potential in solid human tumors: A phenotype/genotype correlation. Genes Chromosomes Cancer 1999, 25, 195–204. [Google Scholar] [CrossRef]
- Walther, A.; Johnstone, E.; Swanton, C.; Midgley, R.; Tomlinson, I.; Kerr, D. Genetic prognostic and predictive markers in colorectal cancer. Nat. Rev. Cancer 2009, 9, 489–499. [Google Scholar] [CrossRef] [PubMed]
- Markowitz, S.D.; Bertagnolli, M.M. Molecular origins of cancer: Molecular basis of colorectal cancer. N. Engl. J. Med. 2009, 361, 2449–2460. [Google Scholar] [CrossRef] [PubMed]
- Network, T.C.G.A. Comprehensive molecular characterization of human colon and rectal cancer. Nature 2012, 487, 330–337. [Google Scholar] [CrossRef] [PubMed] [Green Version]
- Zhang, B.; Wang, J.; Wang, X.; Zhu, J.; Liu, Q.; Shi, Z.; Chambers, M.C.; Zimmerman, L.J.; Shaddox, K.F.; Kim, S.; et al. Proteogenomic characterization of human colon and rectal cancer. Nature 2014, 513, 382–387. [Google Scholar] [CrossRef] [PubMed] [Green Version]
- Sadanandam, A.; Lyssiotis, C.A.; Homicsko, K.; Collisson, E.A.; Gibb, W.J.; Wullschleger, S.; Ostos, L.C.; Lannon, W.A.; Grotzinger, C.; Del Rio, M.; et al. A colorectal cancer classification system that associates cellular phenotype and responses to therapy. Nat. Med. 2013, 19, 619–625. [Google Scholar] [CrossRef] [PubMed] [Green Version]
- Guinney, J.; Dienstmann, R.; Wang, X.; de Reynies, A.; Schlicker, A.; Soneson, C.; Marisa, L.; Roepman, P.; Nyamundanda, G.; Angelino, P.; et al. The consensus molecular subtypes of colorectal cancer. Nat. Med. 2015, 21, 1350–1356. [Google Scholar] [CrossRef] [PubMed]
- Okugawa, Y.; Grady, W.M.; Goel, A. Epigenetic Alterations in Colorectal Cancer: Emerging Biomarkers. Gastroenterology 2015, 149, 1204–1225. [Google Scholar] [CrossRef] [PubMed]
- El Bairi, K.; Tariq, K.; Himri, I.; Jaafari, A.; Smaili, W.; Kandhro, A.H.; Gouri, A.; Ghazi, B. Decoding colorectal cancer epigenomics. Cancer Genet. 2018, 220, 49–76. [Google Scholar] [CrossRef]
- Hamdan, F.H.; Johnsen, S.A. Perturbing Enhancer Activity in Cancer Therapy. Cancers 2019, 11. [Google Scholar] [CrossRef] [PubMed]
- Cunningham, D.; Atkin, W.; Lenz, H.J.; Lynch, H.T.; Minsky, B.; Nordlinger, B.; Starling, N. Colorectal cancer. Lancet 2010, 375, 1030–1047. [Google Scholar] [CrossRef]
- Brenner, H.; Kloor, M.; Pox, C.P. Colorectal cancer. Lancet 2014, 383, 1490–1502. [Google Scholar] [CrossRef]
- Rickels, R.; Shilatifard, A. Enhancer Logic and Mechanics in Development and Disease. Trends Cell Biol. 2018, 28, 608–630. [Google Scholar] [CrossRef] [PubMed]
- Pundhir, S.; Poirazi, P.; Gorodkin, J. Emerging applications of read profiles towards the functional annotation of the genome. Front. Genet. 2015, 6, 188. [Google Scholar] [CrossRef] [PubMed] [Green Version]
- Karlić, R.; Chung, H.-R.; Lasserre, J.; Vlahoviček, K.; Vingron, M. Histone modification levels are predictive for gene expression. Proc. Natl. Acad. Sci. USA 2010, 107, 2926. [Google Scholar] [CrossRef] [PubMed]
- Gaedcke, J.; Grade, M.; Jung, K.; Camps, J.; Jo, P.; Emons, G.; Gehoff, A.; Sax, U.; Schirmer, M.; Becker, H.; et al. Mutated KRAS results in overexpression of DUSP4, a MAP-kinase phosphatase, and SMYD3, a histone methyltransferase, in rectal carcinomas. Genes Chromosomes Cancer 2010, 49, 1024–1034. [Google Scholar] [CrossRef] [PubMed] [Green Version]
- Elloumi, F.; Hu, Z.; Li, Y.; Parker, J.S.; Gulley, M.L.; Amos, K.D.; Troester, M.A. Systematic bias in genomic classification due to contaminating non-neoplastic tissue in breast tumor samples. BMC Med. Genom. 2011, 4, 54. [Google Scholar] [CrossRef]
- Wei, L.; Papanicolau-Sengos, A.; Liu, S.; Wang, J.; Conroy, J.M.; Glenn, S.T.; Brese, E.; Hu, Q.; Miles, K.M.; Burgher, B.; et al. Pitfalls of improperly procured adjacent non-neoplastic tissue for somatic mutation analysis using next-generation sequencing. BMC Med. Genom. 2016, 9, 64. [Google Scholar] [CrossRef] [Green Version]
- Stansfield, J.C.; Rusay, M.; Shan, R.; Kelton, C.; Gaykalova, D.A.; Fertig, E.J.; Califano, J.A.; Ochs, M.F. Toward Signaling-Driven Biomarkers Immune to Normal Tissue Contamination. Cancer Inform. 2016, 15, 15–21. [Google Scholar] [CrossRef]
- Shen, Q.; Hu, J.; Jiang, N.; Hu, X.; Luo, Z.; Zhang, H. contamDE: Differential expression analysis of RNA-seq data for contaminated tumor samples. Bioinformatics 2016, 32, 705–712. [Google Scholar] [CrossRef] [PubMed]
- Fanelli, M.; Amatori, S.; Barozzi, I.; Soncini, M.; Dal Zuffo, R.; Bucci, G.; Capra, M.; Quarto, M.; Dellino, G.I.; Mercurio, C.; et al. Pathology tissue–chromatin immunoprecipitation, coupled with high-throughput sequencing, allows the epigenetic profiling of patient samples. Proc. Natl. Acad. Sci. USA 2010, 107, 21535. [Google Scholar] [CrossRef]
- Amatori, S.; Persico, G.; Paolicelli, C.; Hillje, R.; Sahnane, N.; Corini, F.; Furlan, D.; Luzi, L.; Minucci, S.; Giorgio, M.; et al. Epigenomic profiling of archived FFPE tissues by enhanced PAT-ChIP (EPAT-ChIP) technology. Clin. Epigenet. 2018, 10, 143. [Google Scholar] [CrossRef]
- Cejas, P.; Li, L.; O’Neill, N.K.; Duarte, M.; Rao, P.; Bowden, M.; Zhou, C.W.; Mendiola, M.; Burgos, E.; Feliu, J.; et al. Chromatin immunoprecipitation from fixed clinical tissues reveals tumor-specific enhancer profiles. Nat. Med. 2016, 22, 685–691. [Google Scholar] [CrossRef]
- Sharma, V.; Malgulwar, P.B.; Purkait, S.; Patil, V.; Pathak, P.; Agrawal, R.; Kulshreshtha, R.; Mallick, S.; Julka, P.K.; Suri, A.; et al. Genome-wide ChIP-seq analysis of EZH2-mediated H3K27me3 target gene profile highlights differences between low- and high-grade astrocytic tumors. Carcinogenesis 2017, 38, 152–161. [Google Scholar] [CrossRef] [PubMed]
- Droog, M.; Nevedomskaya, E.; Kim, Y.; Severson, T.; Flach, K.D.; Opdam, M.; Schuurman, K.; Gradowska, P.; Hauptmann, M.; Dackus, G.; et al. Comparative Cistromics Reveals Genomic Cross-talk between FOXA1 and ERalpha in Tamoxifen-Associated Endometrial Carcinomas. Cancer Res. 2016, 76, 3773–3784. [Google Scholar] [CrossRef]
- Ross-Innes, C.S.; Stark, R.; Teschendorff, A.E.; Holmes, K.A.; Ali, H.R.; Dunning, M.J.; Brown, G.D.; Gojis, O.; Ellis, I.O.; Green, A.R.; et al. Differential oestrogen receptor binding is associated with clinical outcome in breast cancer. Nature 2012, 481, 389–393. [Google Scholar] [CrossRef] [Green Version]
- Sun, R.; Tan, X.; Wang, X.; Wang, X.; Yang, L.; Robertson, E.S.; Lan, K. Epigenetic Landscape of Kaposi’s Sarcoma-Associated Herpesvirus Genome in Classic Kaposi’s Sarcoma Tissues. PLoS Pathog. 2017, 13, e1006167. [Google Scholar] [CrossRef]
- Curry, E.; Zeller, C.; Masrour, N.; Patten, D.K.; Gallon, J.; Wilhelm-Benartzi, C.S.; Ghaem-Maghami, S.; Bowtell, D.D.; Brown, R. Genes Predisposed to DNA Hypermethylation during Acquired Resistance to Chemotherapy Are Identified in Ovarian Tumors by Bivalent Chromatin Domains at Initial Diagnosis. Cancer Res. 2018, 78, 1383–1391. [Google Scholar] [CrossRef] [Green Version]
- Stelloo, S.; Nevedomskaya, E.; van der Poel, H.G.; de Jong, J.; van Leenders, G.J.; Jenster, G.; Wessels, L.F.; Bergman, A.M.; Zwart, W. Androgen receptor profiling predicts prostate cancer outcome. EMBO Mol. Med. 2015, 7, 1450–1464. [Google Scholar] [CrossRef]
- Cohen, A.J.; Saiakhova, A.; Corradin, O.; Luppino, J.M.; Lovrenert, K.; Bartels, C.F.; Morrow, J.J.; Mack, S.C.; Dhillon, G.; Beard, L.; et al. Hotspots of aberrant enhancer activity punctuate the colorectal cancer epigenome. Nat. Commun. 2017, 8, 14400. [Google Scholar] [CrossRef] [Green Version]
- González, B.; de la Cruz, F.F.; Samuelsson, J.K.; Alibés, A.; Alonso, S. Epigenetic and transcriptional dysregulation of VWA2 associated with a MYC-driven oncogenic program in colorectal cancer. Sci. Rep. 2018, 8, 11097. [Google Scholar] [CrossRef]
- Kaneda, H.; Arao, T.; Tanaka, K.; Tamura, D.; Aomatsu, K.; Kudo, K.; Sakai, K.; De Velasco, M.A.; Matsumoto, K.; Fujita, Y.; et al. FOXQ1 is overexpressed in colorectal cancer and enhances tumorigenicity and tumor growth. Cancer Res. 2010, 70, 2053–2063. [Google Scholar] [CrossRef]
- Birkenkamp-Demtröder, K.; Hahn, S.A.; Mansilla, F.; Thorsen, K.; Maghnouj, A.; Christensen, R.; Øster, B.; Ørntoft, T.F. Keratin23 (KRT23) knockdown decreases proliferation and affects the DNA damage response of colon cancer cells. PLoS ONE 2013, 8, e73593. [Google Scholar] [CrossRef]
- Singel, S.M.; Batten, K.; Cornelius, C.; Jia, G.; Fasciani, G.; Barron, S.L.; Wright, W.E.; Shay, J.W. Receptor-interacting protein kinase 2 promotes triple-negative breast cancer cell migration and invasion via activation of nuclear factor-kappaB and c-Jun N-terminal kinase pathways. Breast Cancer Res. 2014, 16, R28. [Google Scholar] [CrossRef] [PubMed]
- He, S.; Wang, X. RIP kinases as modulators of inflammation and immunity. Nat. Immunol. 2018, 19, 912–922. [Google Scholar] [CrossRef]
- Erez, N.; Milyavsky, M.; Eilam, R.; Shats, I.; Goldfinger, N.; Rotter, V. Expression of prolyl-hydroxylase-1 (PHD1/EGLN2) suppresses hypoxia inducible factor-1alpha activation and inhibits tumor growth. Cancer Res. 2003, 63, 8777–8783. [Google Scholar]
- Deschoemaeker, S.; Di Conza, G.; Lilla, S.; Martin-Perez, R.; Mennerich, D.; Boon, L.; Hendrikx, S.; Maddocks, O.D.; Marx, C.; Radhakrishnan, P.; et al. PHD1 regulates p53-mediated colorectal cancer chemoresistance. EMBO Mol. Med. 2015, 7, 1350–1365. [Google Scholar] [CrossRef]
- Massague, J. How cells read TGF-beta signals. Nat. Rev. Mol. Cell Biol. 2000, 1, 169–178. [Google Scholar] [CrossRef]
- Najafova, Z.; Tirado-Magallanes, R.; Subramaniam, M.; Hossan, T.; Schmidt, G.; Nagarajan, S.; Baumgart, S.J.; Mishra, V.K.; Bedi, U.; Hesse, E.; et al. BRD4 localization to lineage-specific enhancers is associated with a distinct transcription factor repertoire. Nucleic Acids Res. 2017, 45, 127–141. [Google Scholar] [CrossRef]
- Langmead, B.; Salzberg, S.L. Fast gapped-read alignment with Bowtie 2. Nat. Methods 2012, 9, 357–359. [Google Scholar] [CrossRef] [Green Version]
- Zhang, Y.; Liu, T.; Meyer, C.A.; Eeckhoute, J.; Johnson, D.S.; Bernstein, B.E.; Nusbaum, C.; Myers, R.M.; Brown, M.; Li, W.; et al. Model-based analysis of ChIP-Seq (MACS). Genome Biol. 2008, 9, R137. [Google Scholar] [CrossRef] [PubMed]
- Robinson, J.T.; Thorvaldsdottir, H.; Winckler, W.; Guttman, M.; Lander, E.S.; Getz, G.; Mesirov, J.P. Integrative genomics viewer. Nat. Biotechnol. 2011, 29, 24–26. [Google Scholar] [CrossRef] [Green Version]
- Ramirez, F.; Dundar, F.; Diehl, S.; Gruning, B.A.; Manke, T. deepTools: A flexible platform for exploring deep-sequencing data. Nucleic Acids Res. 2014, 42, W187–W191. [Google Scholar] [CrossRef] [PubMed]
- McLean, C.Y.; Bristor, D.; Hiller, M.; Clarke, S.L.; Schaar, B.T.; Lowe, C.B.; Wenger, A.M.; Bejerano, G. GREAT improves functional interpretation of cis-regulatory regions. Nat. Biotechnol. 2010, 28, 495–501. [Google Scholar] [CrossRef] [PubMed] [Green Version]
- Heinz, S.; Benner, C.; Spann, N.; Bertolino, E.; Lin, Y.C.; Laslo, P.; Cheng, J.X.; Murre, C.; Singh, H.; Glass, C.K. Simple combinations of lineage-determining transcription factors prime cis-regulatory elements required for macrophage and B cell identities. Mol. Cell 2010, 38, 576–589. [Google Scholar] [CrossRef]
- Subramanian, A.; Tamayo, P.; Mootha, V.K.; Mukherjee, S.; Ebert, B.L.; Gillette, M.A.; Paulovich, A.; Pomeroy, S.L.; Golub, T.R.; Lander, E.S.; et al. Gene set enrichment analysis: A knowledge-based approach for interpreting genome-wide expression profiles. Proc. Natl. Acad. Sci. USA 2005, 102, 15545–15550. [Google Scholar] [CrossRef] [PubMed] [Green Version]


© 2019 by the authors. Licensee MDPI, Basel, Switzerland. This article is an open access article distributed under the terms and conditions of the Creative Commons Attribution (CC BY) license (http://creativecommons.org/licenses/by/4.0/).
Share and Cite
Flebbe, H.; Hamdan, F.H.; Kari, V.; Kitz, J.; Gaedcke, J.; Ghadimi, B.M.; Johnsen, S.A.; Grade, M. Epigenome Mapping Identifies Tumor-Specific Gene Expression in Primary Rectal Cancer. Cancers 2019, 11, 1142. https://0-doi-org.brum.beds.ac.uk/10.3390/cancers11081142
Flebbe H, Hamdan FH, Kari V, Kitz J, Gaedcke J, Ghadimi BM, Johnsen SA, Grade M. Epigenome Mapping Identifies Tumor-Specific Gene Expression in Primary Rectal Cancer. Cancers. 2019; 11(8):1142. https://0-doi-org.brum.beds.ac.uk/10.3390/cancers11081142
Chicago/Turabian StyleFlebbe, Hannah, Feda H. Hamdan, Vijayalakshmi Kari, Julia Kitz, Jochen Gaedcke, B. Michael Ghadimi, Steven A. Johnsen, and Marian Grade. 2019. "Epigenome Mapping Identifies Tumor-Specific Gene Expression in Primary Rectal Cancer" Cancers 11, no. 8: 1142. https://0-doi-org.brum.beds.ac.uk/10.3390/cancers11081142