NAMPT Over-Expression Recapitulates the BRAF Inhibitor Resistant Phenotype Plasticity in Melanoma

 ,
,  , , , and
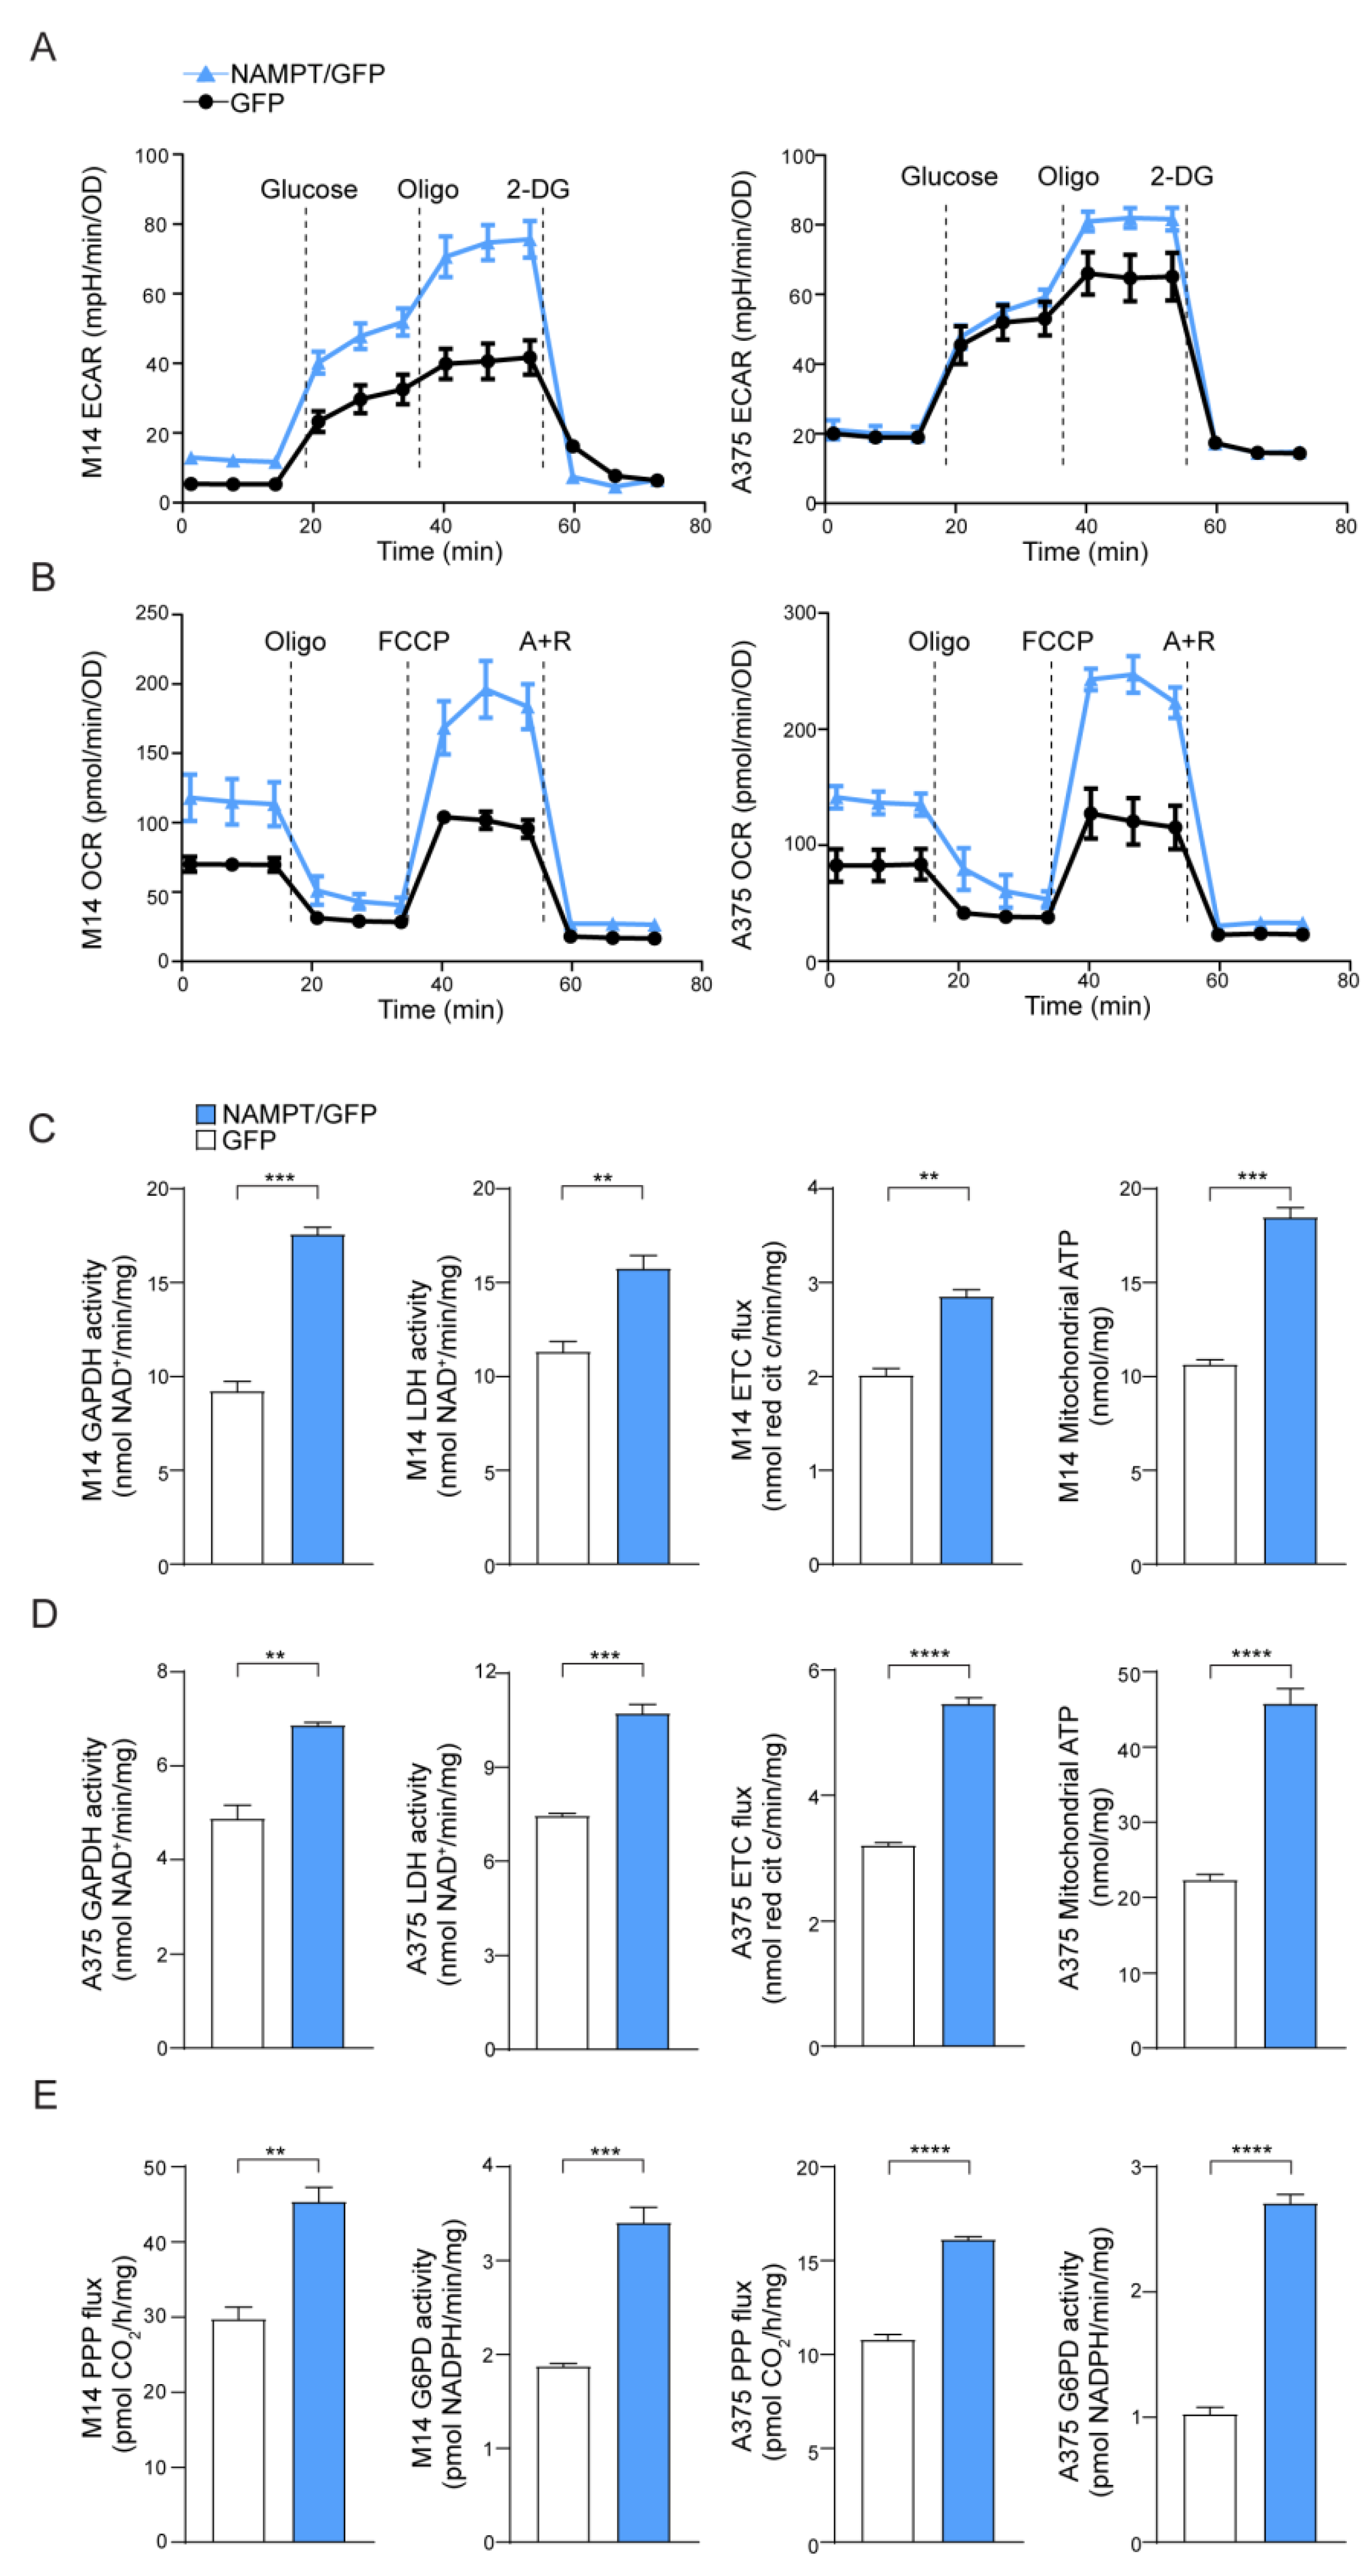
Abstract
:Simple Summary
Abstract
1. Introduction
2. Results
2.1. NAMPT Over-Expression Enhances Metabolic Fluxes
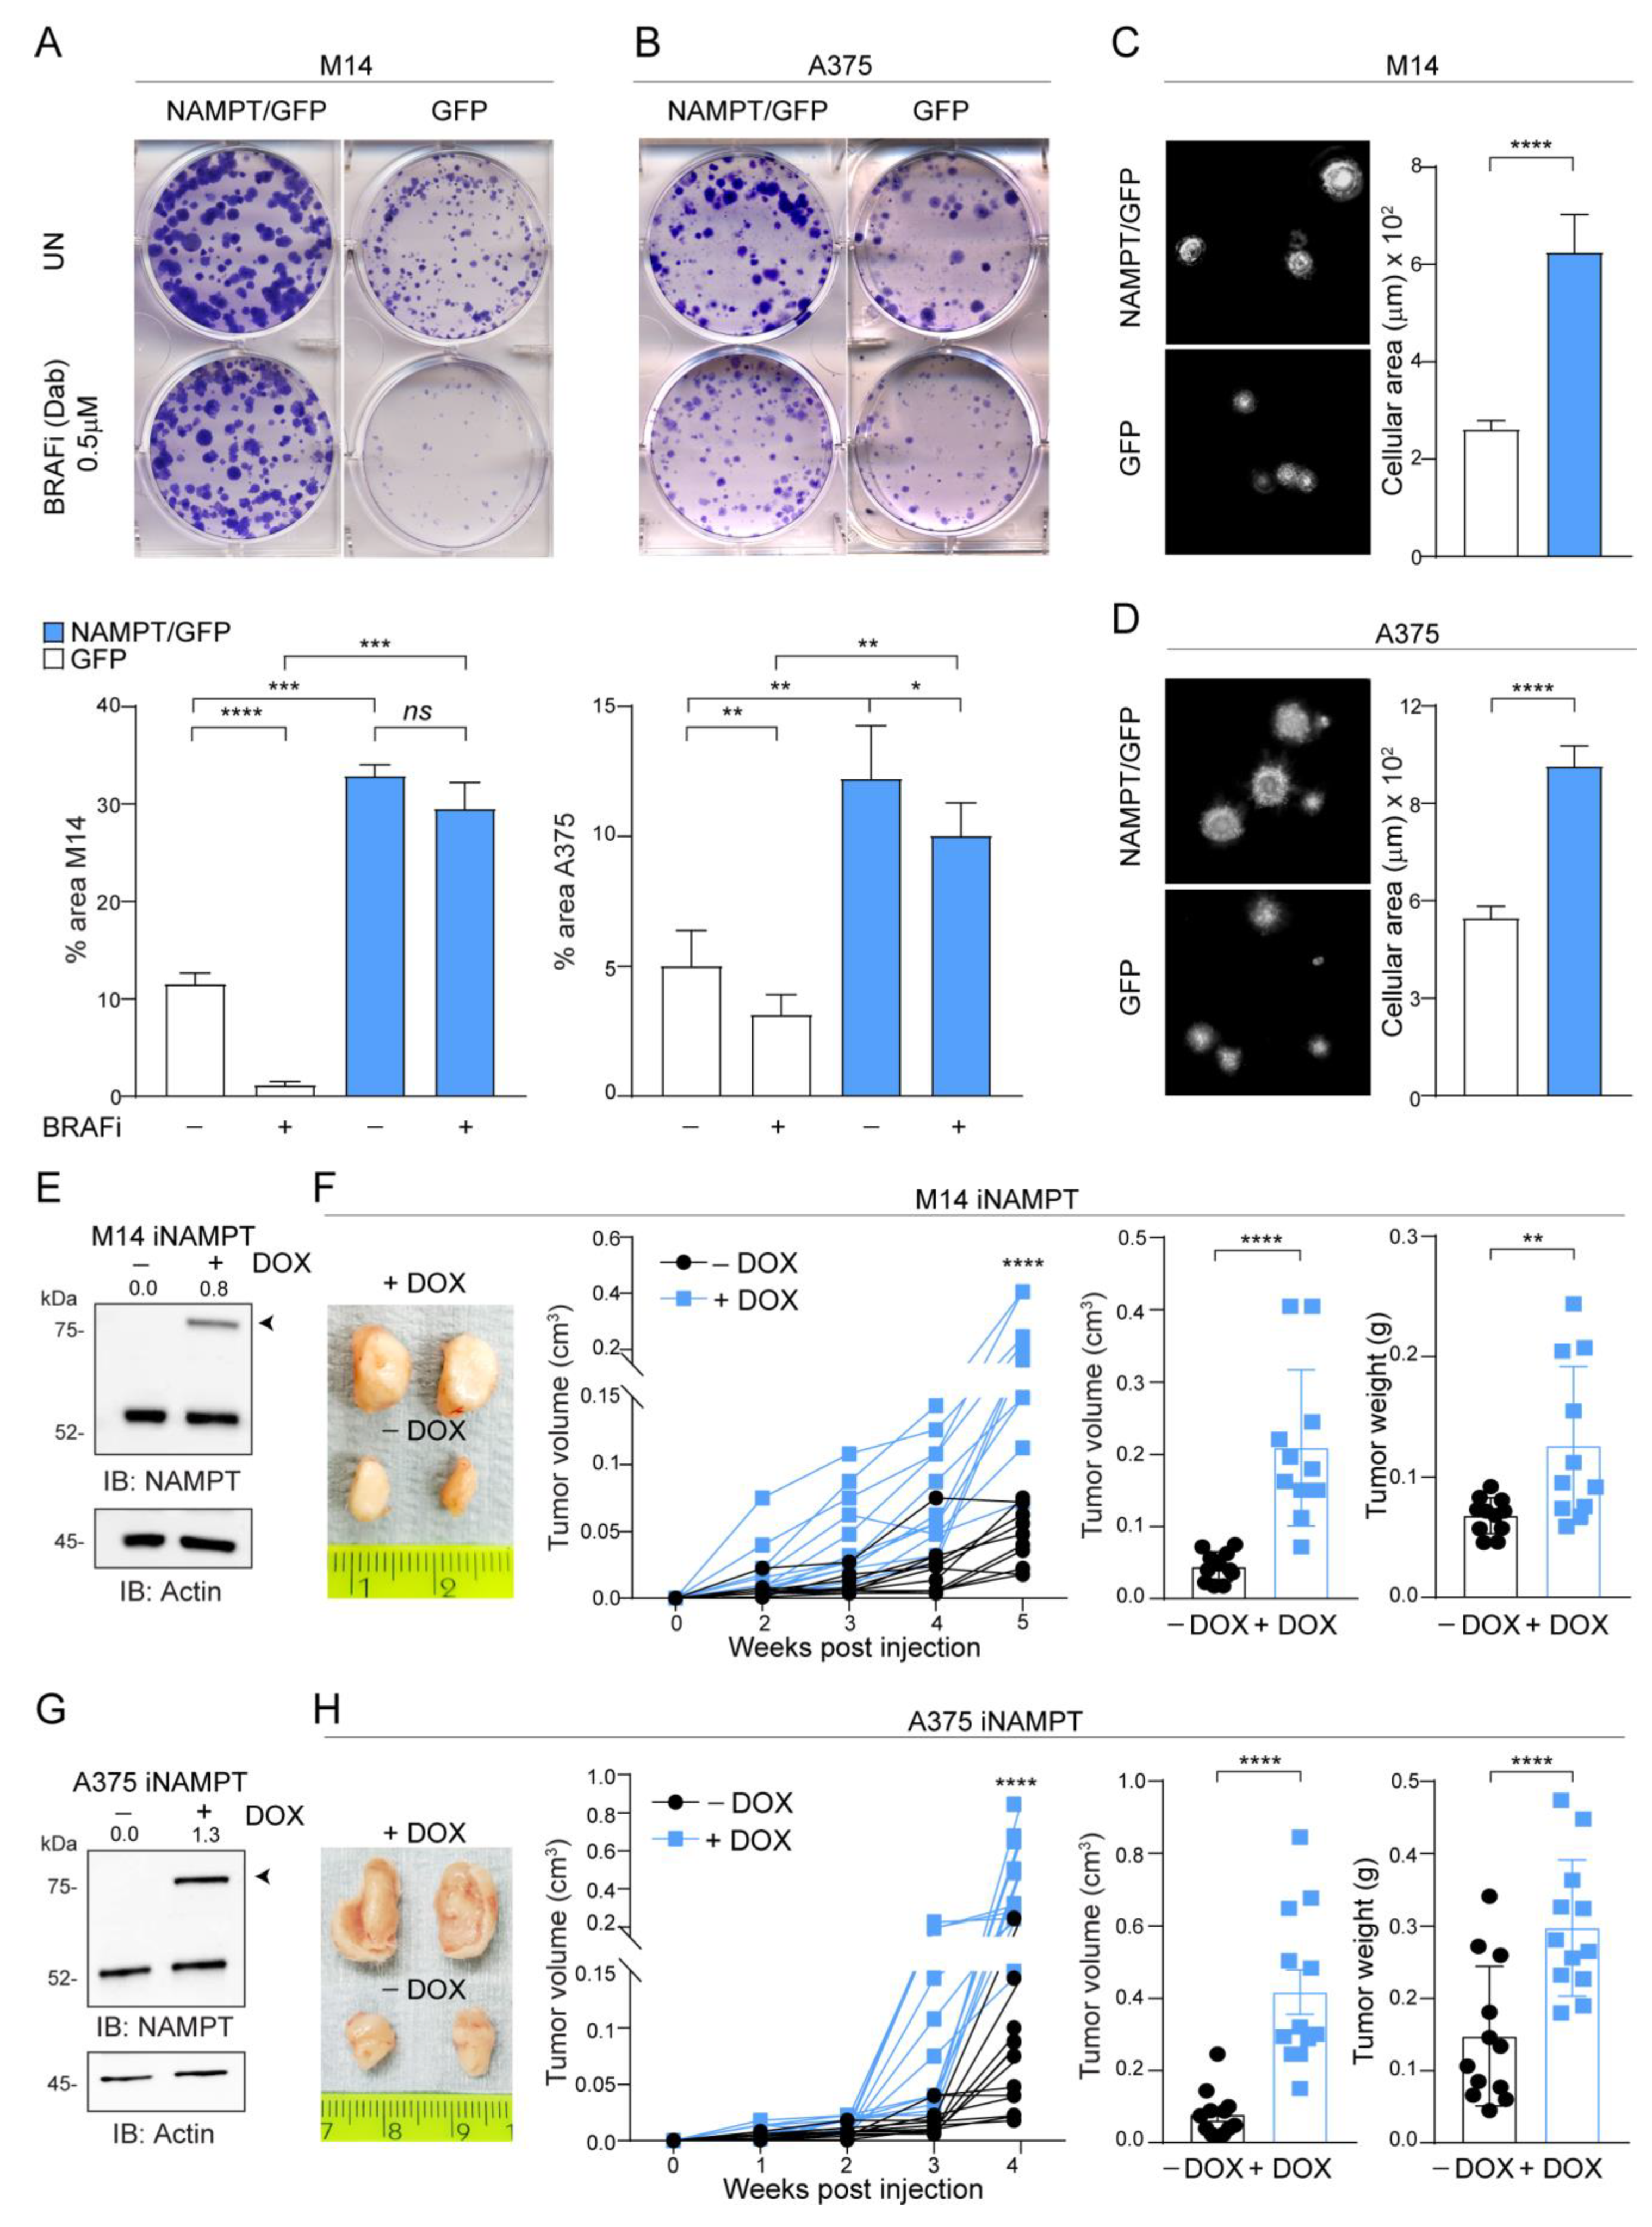
2.2. NAMPT Over-Expression Boosts Tumor Growth Capacity In Vitro and In Vivo and ERK Phosphorylation
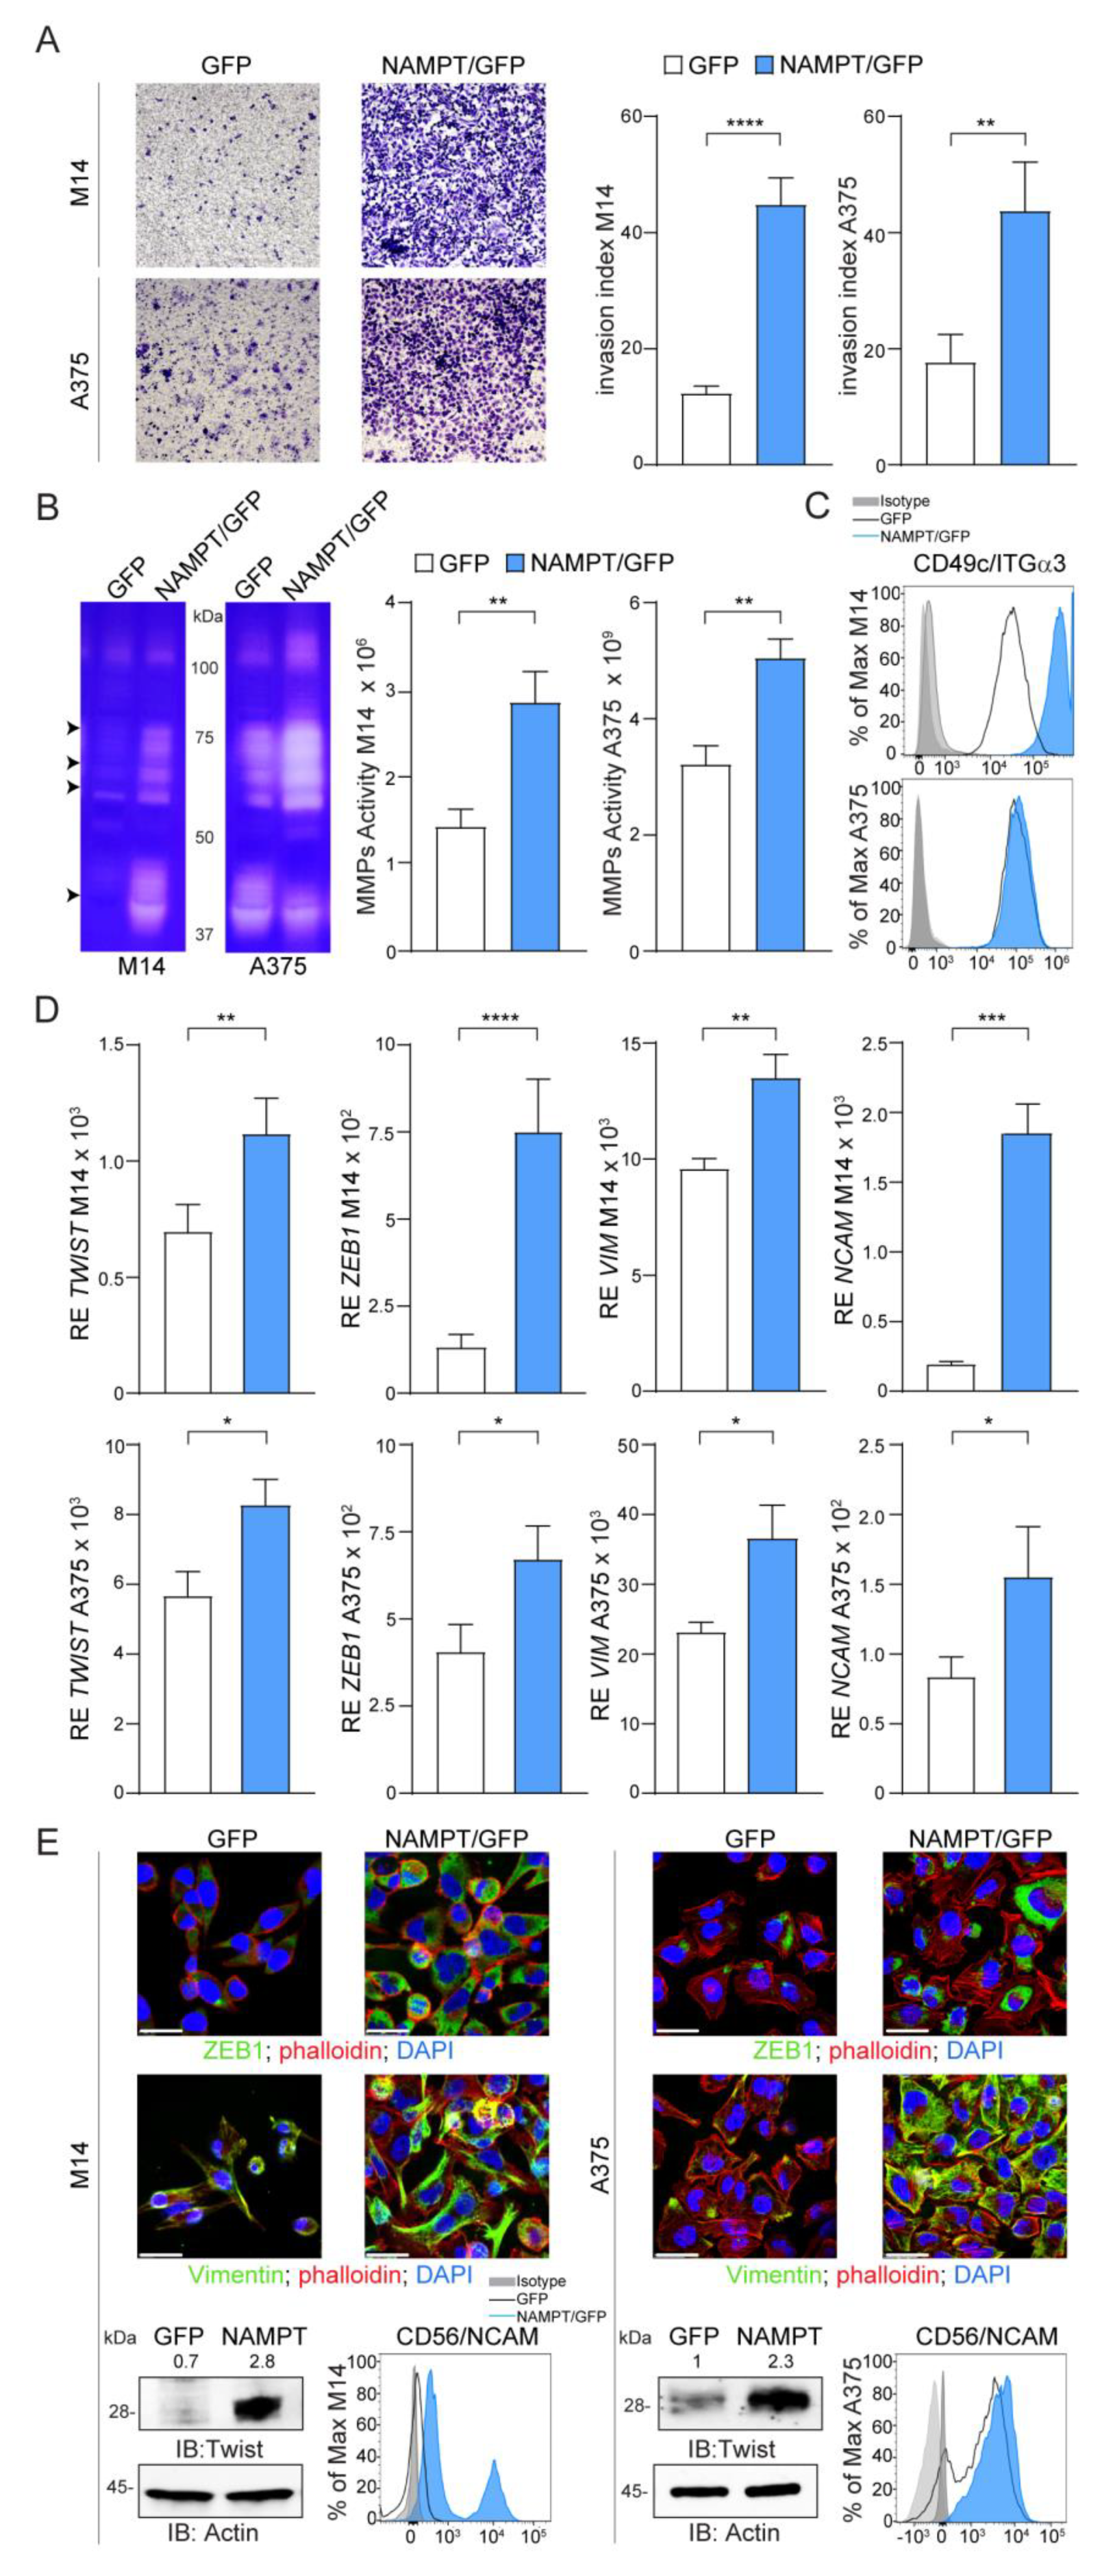
2.3. NAMPT Over-Expression Promotes Invasion and Acquisition of Mesenchymal Features
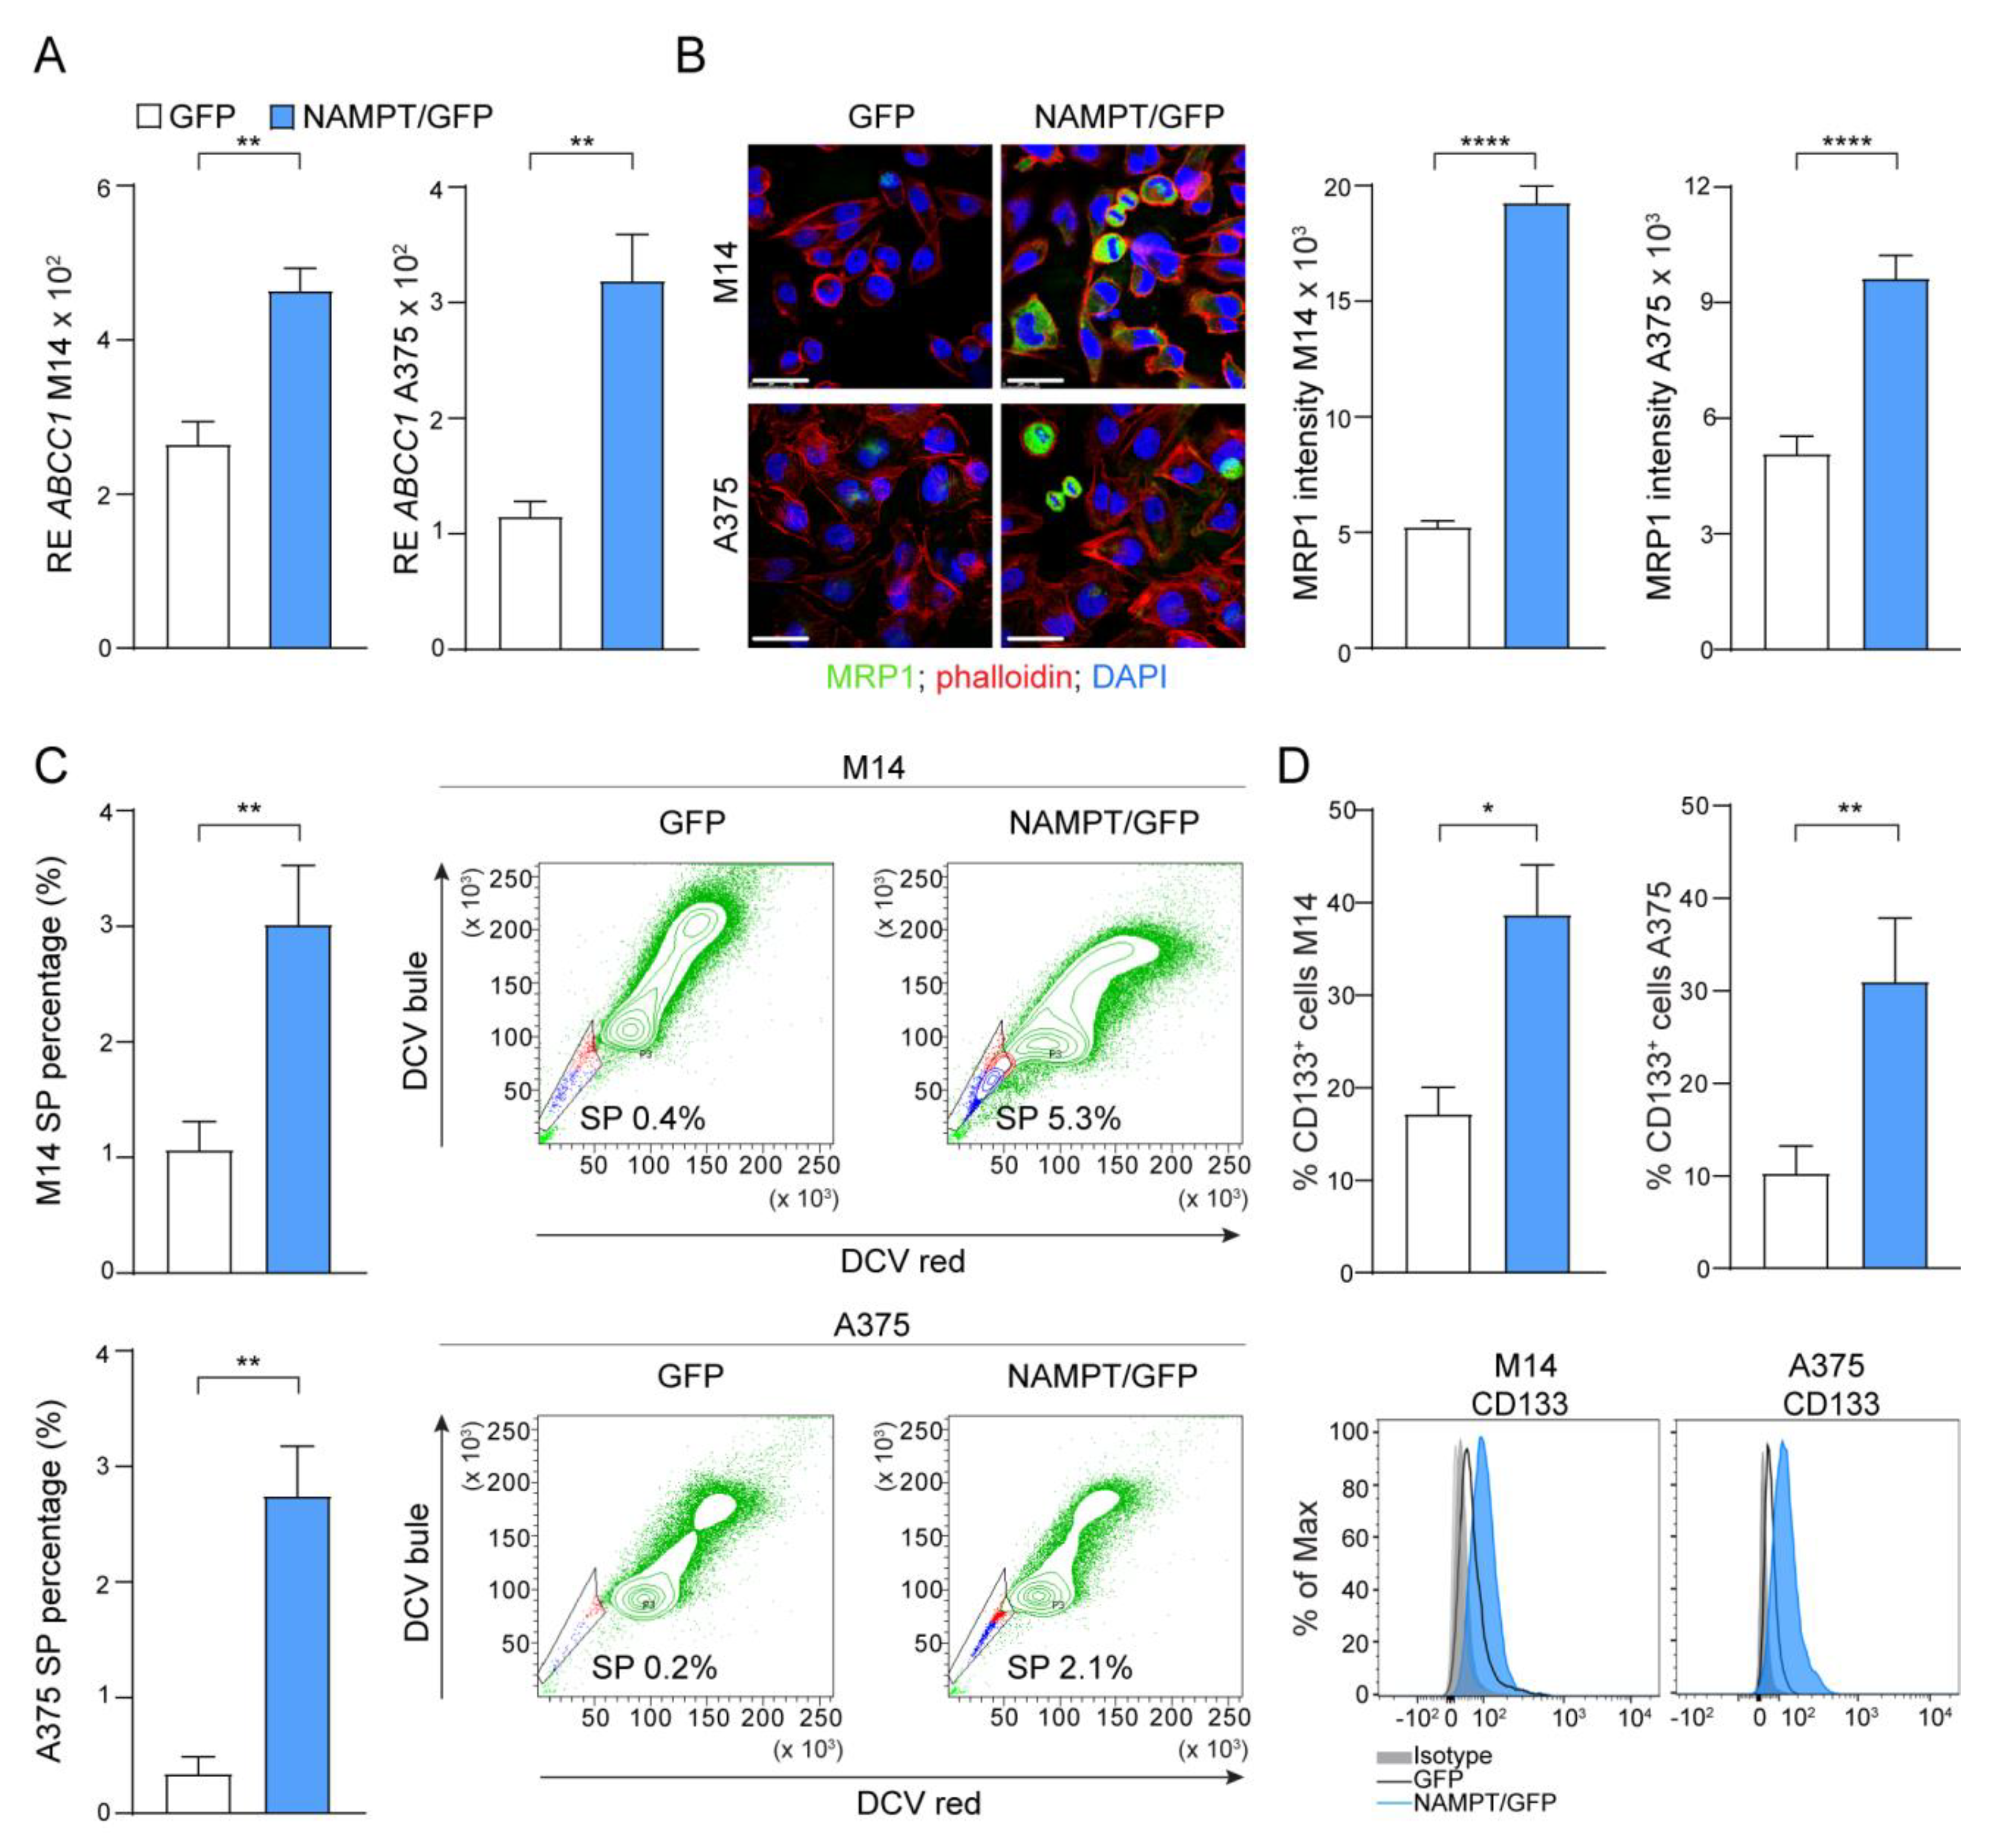
2.4. NAMPT Over-Expression Forces Stemness Properties
2.5. NAMPT Silencing Reverts Aggressiveness of BRAFi-Resistant Cells
3. Discussion
4. Materials and Methods
4.1. Reagents and Antibodies
4.2. Cell Culture
4.3. Stable NAMPT Over-Expression
4.4. Inducible NAMPT Silencing (shRNA NAMPT)
4.5. CRISPR-CAS9 NAMPT Knock-Out (KO) Cells
4.6. RNA Extraction and Quantitative Real-Time PCR (qRT-PCR)
4.7. Western Blot Analysis
4.8. Confocal Microscopy
4.9. FACS Analysis
4.10. Seahorse Metabolic Experiments
4.11. Lactate Dehydrogenase (LDH), Glyceraldehyde 3-Phosphate Dehydrogenase (GAPDH) and Glucose 6-Phosphate Dehydrogenase (G6PD) Activity
4.12. Electron Transport Chain (ETC) Flux and Mitochondrial ATP
4.13. Pentose Phosphate Pathway (PPP) Flux
4.14. Colony Formation Assay
4.15. Soft Agar Colony Formation Assay
4.16. Signaling Experiments
4.17. Invasion Assay
4.18. Zymography Assay
4.19. Side population Analysis
4.20. Xenograft Models
4.21. TCGA Analysis
4.22. Statistical Analysis
5. Conclusions
Supplementary Materials
Author Contributions
Funding
Acknowledgments
Conflicts of Interest
References
- Davies, N.; Bignell, G.R.; Cox, C.; Stephens, P.; Edkins, S.; Clegg, S.; Teague, J.W.; Woffendin, H.; Garnett, M.J.; Bottomley, W.; et al. Mutations of the BRAF gene in human cancer. Nature 2002, 417, 949–954. [Google Scholar] [CrossRef] [PubMed]
- Dankner, M.; Rose, A.A.N.; Rajkumar, S.; Siegel, P.M.; Watson, I.R. Classifying BRAF alterations in cancer: New rational therapeutic strategies for actionable mutations. Oncogene 2018, 37, 3183–3199. [Google Scholar] [CrossRef] [PubMed]
- Flaherty, K.T.; Infante, J.R.; Daud, A.; Gonzalez, R.; Kefford, R.F.; Sosman, J.; Hamid, O.; Schuchter, L.; Cebon, J.; Ibrahim, N.; et al. Combined BRAF and MEK Inhibition in Melanoma with BRAF V600 Mutations. N. Engl. J. Med. 2012, 367, 1694–1703. [Google Scholar] [CrossRef] [PubMed] [Green Version]
- Eggermont, A.M.; Blank, C.U.; Mandalà, M.; Long, G.V.; Atkinson, V.; Dalle, S.; Haydon, A.; Lichinitser, M.; Khattak, A.; Carlino, M.S.; et al. Adjuvant Pembrolizumab versus Placebo in Resected Stage III Melanoma. N. Engl. J. Med. 2018, 378, 1789–1801. [Google Scholar] [CrossRef] [PubMed]
- Long, G.V.; Stroyakovskiy, D.; Gogas, H.; Levchenko, E.; De Braud, F.; Larkin, J.; Garbe, C.; Jouary, T.; Hauschild, A.; Grob, J.J.; et al. Combined BRAF and MEK Inhibition versus BRAF Inhibition Alone in Melanoma. N. Engl. J. Med. 2014, 371, 1877–1888. [Google Scholar] [CrossRef] [PubMed] [Green Version]
- Arozarena, I.; Wellbrock, C. Phenotype plasticity as enabler of melanoma progression and therapy resistance. Nat. Rev. Cancer 2019, 19, 377–391. [Google Scholar] [CrossRef] [Green Version]
- Falletta, P.; Sanchez-Del-Campo, L.; Chauhan, J.; Effern, M.; Kenyon, A.; Kershaw, C.J.; Siddaway, R.; Lisle, R.J.; Freter, R.; Daniels, M.J.; et al. Translation reprogramming is an evolutionarily conserved driver of phenotypic plasticity and therapeutic resistance in melanoma. Genes Dev. 2017, 31, 18–33. [Google Scholar] [CrossRef] [Green Version]
- Abildgaard, C.; Guldberg, P. Molecular drivers of cellular metabolic reprogramming in melanoma. Trends Mol. Med. 2015, 21, 164–171. [Google Scholar] [CrossRef]
- Parmenter, T.J.; Kleinschmidt, M.; Kinross, K.M.; Bond, S.T.; Li, J.; Kaadige, M.R.; Rao, A.; Sheppard, K.E.; Hugo, W.; Pupo, G.M.; et al. Response of BRAF-Mutant Melanoma to BRAF Inhibition Is Mediated by a Network of Transcriptional Regulators of Glycolysis. Cancer Discov. 2014, 4, 423–433. [Google Scholar] [CrossRef] [Green Version]
- Haq, R.; Shoag, J.; Andreu-Perez, P.; Yokoyama, S.; Edelman, H.; Rowe, G.C.; Frederick, D.T.; Hurley, A.D.; Nellore, A.; Kung, A.L.; et al. Oncogenic BRAF Regulates Oxidative Metabolism via PGC1α and MITF. Cancer Cell 2013, 23, 302–315. [Google Scholar] [CrossRef] [Green Version]
- Tarrado-Castellarnau, M.; De Atauri, P.; Cascante, M. Oncogenic regulation of tumor metabolic reprogramming. Oncotarget 2016, 7, 62726–62753. [Google Scholar] [CrossRef] [PubMed] [Green Version]
- Chiarugi, A.; Dölle, C.; Felici, R.; Ziegler, M. The NAD metabolome—A key determinant of cancer cell biology. Nat. Rev. Cancer 2012, 12, 741–752. [Google Scholar] [CrossRef] [PubMed]
- Audrito, V.; Managò, A.; La Vecchia, S.; Zamporlini, F.; Vitale, N.; Baroni, G.; Cignetto, S.; Serra, S.; Bologna, C.; Stingi, A.; et al. Nicotinamide Phosphoribosyltransferase (NAMPT) as a Therapeutic Target in BRAF-Mutated Metastatic Melanoma. J. Natl. Cancer Inst. 2018, 110, 290–303. [Google Scholar] [CrossRef] [PubMed]
- Ohanna, M.; Cerezo, M.; Nottet, N.; Bille, K.; Didier, R.; Beranger, G.; Mograbi, B.; Rocchi, S.; Yvan-Charvet, L.; Ballotti, R.; et al. Pivotal role of NAMPT in the switch of melanoma cells toward an invasive and drug-resistant phenotype. Genes Dev. 2018, 32, 448–461. [Google Scholar] [CrossRef]
- Garten, A.; Schuster, S.; Penke, M.; Gorski, T.; De Giorgis, T.; Kiess, W. Physiological and pathophysiological roles of NAMPT and NAD metabolism. Nat. Rev. Endocrinol. 2015, 11, 535–546. [Google Scholar] [CrossRef]
- Audrito, V.; Messana, V.G.; Deaglio, S. NAMPT and NAPRT: Two Metabolic Enzymes With Key Roles in Inflammation. Front. Oncol. 2020, 10, 358. [Google Scholar] [CrossRef] [Green Version]
- Audrito, V.; Managò, A.; Gaudino, F.; Deaglio, S. Targeting metabolic reprogramming in metastatic melanoma: The key role of nicotinamide phosphoribosyltransferase (NAMPT). Semin. Cell Dev. Biol. 2020, 98, 192–201. [Google Scholar] [CrossRef] [Green Version]
- Khamari, R.; Trinh, A.; Gabert, P.E.; Corazao-Rozas, P.; Riveros-Cruz, S.; Balayssac, S.; Malet-Martino, M.; Dekiouk, S.; Curt, M.J.C.; Maboudou, P.; et al. Glucose metabolism and NRF2 coordinate the antioxidant response in melanoma resistant to MAPK inhibitors. Cell Death Dis. 2018, 9, 1–14. [Google Scholar] [CrossRef] [Green Version]
- Lito, P.; Rosen, N.; Solit, D.B. Tumor adaptation and resistance to RAF inhibitors. Nat. Med. 2013, 19, 1401–1409. [Google Scholar] [CrossRef]
- Hofmann, U.B.; Westphal, J.R.; Van Muijen, G.N.; Ruiter, D.J. Matrix Metalloproteinases in Human Melanoma. J. Investig. Dermatol. 2000, 115, 337–344. [Google Scholar] [CrossRef] [Green Version]
- Da Silva, E.C.; Dontenwill, M.; Choulier, L.; Lehmann, M. Role of Integrins in Resistance to Therapies Targeting Growth Factor Receptors in Cancer. Cancers 2019, 11, 692. [Google Scholar] [CrossRef] [PubMed] [Green Version]
- Audrito, V.; Serra, S.; Stingi, A.; Orso, F.; Gaudino, F.; Bologna, C.; Neri, F.; Garaffo, G.; Nassini, R.; Baroni, G.; et al. PD-L1 up-regulation in melanoma increases disease aggressiveness and is mediated through miR-17-5p. Oncotarget 2017, 8, 15894–15911. [Google Scholar] [CrossRef] [PubMed] [Green Version]
- Caramel, J.; Papadogeorgakis, E.; Hill, L.; Browne, G.J.; Richard, G.; Wierinckx, A.; Saldanha, G.; Osborne, J.; Hutchinson, P.; Tse, G.; et al. A Switch in the Expression of Embryonic EMT-Inducers Drives the Development of Malignant Melanoma. Cancer Cell 2013, 24, 466–480. [Google Scholar] [CrossRef] [PubMed] [Green Version]
- Paulitschke, V.; Eichhoff, O.; Gerner, C.; Paulitschke, P.; Bileck, A.; Mohr, T.; Cheng, P.F.; Leitner, A.; Guenova, E.; Saulite, I.; et al. Proteomic identification of a marker signature for MAPK i resistance in melanoma. EMBO J. 2019, 38, e95874. [Google Scholar] [CrossRef] [PubMed]
- Lu, W.; Kang, Y. Epithelial-Mesenchymal Plasticity in Cancer Progression and Metastasis. Dev. Cell 2019, 49, 361–374. [Google Scholar] [CrossRef]
- Visvader, J.E.; Lindeman, G.J. Cancer Stem Cells: Current Status and Evolving Complexities. Cell Stem Cell 2012, 10, 717–728. [Google Scholar] [CrossRef] [Green Version]
- Kemper, K.; De Goeje, P.L.; Peeper, D.S.; Van Amerongen, R. Phenotype Switching: Tumor Cell Plasticity as a Resistance Mechanism and Target for Therapy. Cancer Res. 2014, 74, 5937–5941. [Google Scholar] [CrossRef] [Green Version]
- Cole, S.P. Multidrug Resistance Protein 1 (MRP1, ABCC1), a “Multitasking” ATP-binding Cassette (ABC) Transporter. J. Biol. Chem. 2014, 289, 30880–30888. [Google Scholar] [CrossRef] [Green Version]
- Luo, Y.; Ellis, L.Z.; Dallaglio, K.; Takeda, M.; Robinson, W.A.; Robinson, S.E.; Liu, W.; Lewis, K.D.; McCarter, M.D.; Gonzalez, R.; et al. Side Population Cells from Human Melanoma Tumors Reveal Diverse Mechanisms for Chemoresistance. J. Investig. Dermatol. 2012, 132, 2440–2450. [Google Scholar] [CrossRef] [Green Version]
- Zimmerer, R.M.; Korn, P.; Demougin, P.; Kampmann, A.; Kokemueller, H.; Eckardt, A.M.; Gellrich, N.-C.; Tavassol, F. Functional features of cancer stem cells in melanoma cell lines. Cancer Cell Int. 2013, 13, 78. [Google Scholar] [CrossRef] [Green Version]
- Revollo, J.R.; Korner, A.; Mills, K.F.; Satoh, A.; Wang, T.; Garten, A.; Dasgupta, B.; Sasaki, Y.; Wolberger, C.; Townsend, R.R.; et al. Nampt/PBEF/Visfatin regulates insulin secretion in beta cells as a systemic NAD biosynthetic enzyme. Cell Metab. 2007, 6, 363–375. [Google Scholar] [CrossRef] [PubMed] [Green Version]
- Nacarelli, T.; Lau, L.; Fukumoto, T.; Zundell, J.; Fatkhutdinov, N.; Wu, S.; Aird, K.M.; Iwasaki, O.; Kossenkov, A.V.; Schultz, D.; et al. NAD+ metabolism governs the proinflammatory senescence-associated secretome. Nat. Cell Biol. 2019, 21, 397–407. [Google Scholar] [CrossRef] [PubMed]
- Jones, C.L.; Stevens, B.M.; Pollyea, D.A.; Culp-Hill, R.; Reisz, J.A.; Nemkov, T.; Gehrke, S.; Gamboni, F.; Krug, A.; Winters, A.; et al. Nicotinamide Metabolism Mediates Resistance to Venetoclax in Relapsed Acute Myeloid Leukemia Stem Cells. Cell Stem Cell 2020, 27, 748–764. [Google Scholar] [CrossRef] [PubMed]
- Lucena-Cacace, A.; Otero-Albiol, D.; Jiménez-García, M.P.; Peinado-Serrano, J.; Carnero, A. NAMPT overexpression induces cancer stemness and defines a novel tumor signature for glioma prognosis. Oncotarget 2017, 8, 99514–99530. [Google Scholar] [CrossRef] [PubMed] [Green Version]
- Lucena-Cacace, A.; Otero-Albiol, D.; Jiménez-García, M.P.; Muñoz-Galvan, S.; Carnero, A. NAMPTIs a Potent Oncogene in Colon Cancer Progression that Modulates Cancer Stem Cell Properties and Resistance to Therapy through Sirt1 and PARP. Clin. Cancer Res. 2017, 24, 1202–1215. [Google Scholar] [CrossRef] [Green Version]
- Soncini, D.; Caffa, I.; Zoppoli, G.; Cea, M.; Cagnetta, A.; Passalacqua, M.; Mastracci, L.; Boero, S.; Montecucco, F.; Sociali, G.; et al. Nicotinamide Phosphoribosyltransferase Promotes Epithelial-to-Mesenchymal Transition as a Soluble Factor Independent of Its Enzymatic Activity. J. Biol. Chem. 2014, 289, 34189–34204. [Google Scholar] [CrossRef] [Green Version]
- Hoek, K.S.; Eichhoff, O.M.; Schlegel, N.C.; Döbbeling, U.; Kobert, N.; Schaerer, L.; Hemmi, S.; Dummer, R. In vivo Switching of Human Melanoma Cells between Proliferative and Invasive States. Cancer Res. 2008, 68, 650–656. [Google Scholar] [CrossRef] [Green Version]
- Grolla, A.A.; Miggiano, R.; Di Marino, D.; Bianchi, M.; Gori, A.; Orsomando, G.; Gaudino, F.; Galli, U.; Del Grosso, E.; Mazzola, F.; et al. A nicotinamide phosphoribosyltransferase–GAPDH interaction sustains the stress-induced NMN/NAD+ salvage pathway in the nucleus. J. Biol. Chem. 2020, 295, 3635–3651. [Google Scholar] [CrossRef]
- Audrito, V.; Managò, A.; Zamporlini, F.; Rulli, E.; Gaudino, F.; Madonna, G.; D’Atri, S.; Cappellini, G.C.A.; Ascierto, P.A.; Massi, D.; et al. Extracellular nicotinamide phosphoribosyltransferase (eNAMPT) is a novel marker for patients with BRAF-mutated metastatic melanoma. Oncotarget 2018, 9, 18997–19005. [Google Scholar] [CrossRef] [Green Version]
- Camp, S.M.; Ceco, E.; Evenoski, C.L.; Danilov, S.M.; Zhou, T.; Chiang, E.T.; Moreno-Vinasco, L.; Mapes, B.; Zhao, J.; Gursoy, G.; et al. Unique Toll-Like Receptor 4 Activation by NAMPT/PBEF Induces NFkappaB Signaling and Inflammatory Lung Injury. Sci. Rep. 2015, 5, 13135. [Google Scholar] [CrossRef] [Green Version]
- Heske, C.M. Beyond Energy Metabolism: Exploiting the Additional Roles of NAMPT for Cancer Therapy. Front. Oncol. 2020, 9, 1514. [Google Scholar] [CrossRef] [PubMed] [Green Version]
- Dalamaga, M.; Christodoulatos, G.S.; Mantzoros, C.S. The role of extracellular and intracellular Nicotinamide phosphoribosyl-transferase in cancer: Diagnostic and therapeutic perspectives and challenges. Metabolism 2018, 82, 72–87. [Google Scholar] [CrossRef] [PubMed]
- Galli, U.; Colombo, G.; Travelli, C.; Tron, G.C.; Genazzani, A.A.; Grolla, A.A. Recent Advances in NAMPT Inhibitors: A Novel Immunotherapic Strategy. Front. Pharmacol. 2020, 11, 656. [Google Scholar] [CrossRef] [PubMed]
- Rongvaux, A.; Andris, F.; Leo, O. Reconstructing eukaryotic NAD metabolism. BioEssays 2003, 25, 683–690. [Google Scholar] [CrossRef]
- Arruga, F.; Gizdic, B.; Bologna, C.; Cignetto, S.; Buonincontri, R.; Serra, S.; Vaisitti, T.; Gizzi, K.; Vitale, N.; Garaffo, G.; et al. Mutations in NOTCH1 PEST domain orchestrate CCL19-driven homing of chronic lymphocytic leukemia cells by modulating the tumor suppressor gene DUSP22. Leukemia 2016, 31, 1882–1893. [Google Scholar] [CrossRef]
- Audrito, V.; Serra, S.; Brusa, D.; Mazzola, F.; Arruga, F.; Vaisitti, T.; Coscia, M.; Maffei, R.; Rossi, D.; Wang, T.; et al. Extracellular nicotinamide phosphoribosyltransferase (NAMPT) promotes M2 macrophage polarization in chronic lymphocytic leukemia. Blood 2015, 125, 111–123. [Google Scholar] [CrossRef]
- Riganti, C.; Aldieri, E.; Bergandi, L.; Fenoglio, I.; Costamagna, C.; Fubini, B.; Bosia, A.; Ghigo, D. Crocidolite asbestos inhibits pentose phosphate oxidative pathway and glucose 6-phosphate dehydrogenase activity in human lung epithelial cells. Free. Radic. Biol. Med. 2002, 32, 938–949. [Google Scholar] [CrossRef]
- Tassone, B.; Saoncella, S.; Neri, F.; Ala, U.; Brusa, D.; Magnuson, M.A.; Provero, P.; Oliviero, S.; Riganti, C.; Calautti, V. Rictor/mTORC2 deficiency enhances keratinocyte stress tolerance via mitohormesis. Cell Death Differ. 2017, 24, 731–746. [Google Scholar] [CrossRef]
- Borowicz, S.; Van Scoyk, M.; Avasarala, S.; Karuppusamy Rathinam, M.K.; Tauler, J.; Bikkavilli, R.K.; Winn, R.A. The soft agar colony formation assay. J. Vis. Exp. 2014, e51998. [Google Scholar] [CrossRef] [Green Version]
- Vaisitti, T.; Serra, S.; Pepper, C.; Rossi, D.; Laurenti, L.; Gaidano, G.; Malavasi, F.; Deaglio, S. CD38 signals upregulate expression and functions of matrix metalloproteinase-9 in chronic lymphocytic leukemia cells. Leukemia 2012, 27, 1177–1181. [Google Scholar] [CrossRef] [Green Version]
- Telford, W.G.; Bradford, J.; Godfrey, W.; Robey, R.W.; Bates, S.E. Side Population Analysis Using a Violet-Excited Cell-Permeable DNA Binding Dye. Stem Cells 2007, 25, 1029–1036. [Google Scholar] [CrossRef] [PubMed]


Publisher’s Note: MDPI stays neutral with regard to jurisdictional claims in published maps and institutional affiliations. |
© 2020 by the authors. Licensee MDPI, Basel, Switzerland. This article is an open access article distributed under the terms and conditions of the Creative Commons Attribution (CC BY) license (http://creativecommons.org/licenses/by/4.0/).
Share and Cite
Audrito, V.; Messana, V.G.; Moiso, E.; Vitale, N.; Arruga, F.; Brandimarte, L.; Gaudino, F.; Pellegrino, E.; Vaisitti, T.; Riganti, C.; et al. NAMPT Over-Expression Recapitulates the BRAF Inhibitor Resistant Phenotype Plasticity in Melanoma. Cancers 2020, 12, 3855. https://0-doi-org.brum.beds.ac.uk/10.3390/cancers12123855
Audrito V, Messana VG, Moiso E, Vitale N, Arruga F, Brandimarte L, Gaudino F, Pellegrino E, Vaisitti T, Riganti C, et al. NAMPT Over-Expression Recapitulates the BRAF Inhibitor Resistant Phenotype Plasticity in Melanoma. Cancers. 2020; 12(12):3855. https://0-doi-org.brum.beds.ac.uk/10.3390/cancers12123855
Chicago/Turabian StyleAudrito, Valentina, Vincenzo Gianluca Messana, Enrico Moiso, Nicoletta Vitale, Francesca Arruga, Lorenzo Brandimarte, Federica Gaudino, Elisa Pellegrino, Tiziana Vaisitti, Chiara Riganti, and et al. 2020. "NAMPT Over-Expression Recapitulates the BRAF Inhibitor Resistant Phenotype Plasticity in Melanoma" Cancers 12, no. 12: 3855. https://0-doi-org.brum.beds.ac.uk/10.3390/cancers12123855