Immune-Complexome Analysis Identifies Immunoglobulin-Bound Biomarkers That Predict the Response to Chemotherapy of Pancreatic Cancer Patients

 , , ,
, , , 
Abstract
:1. Introduction
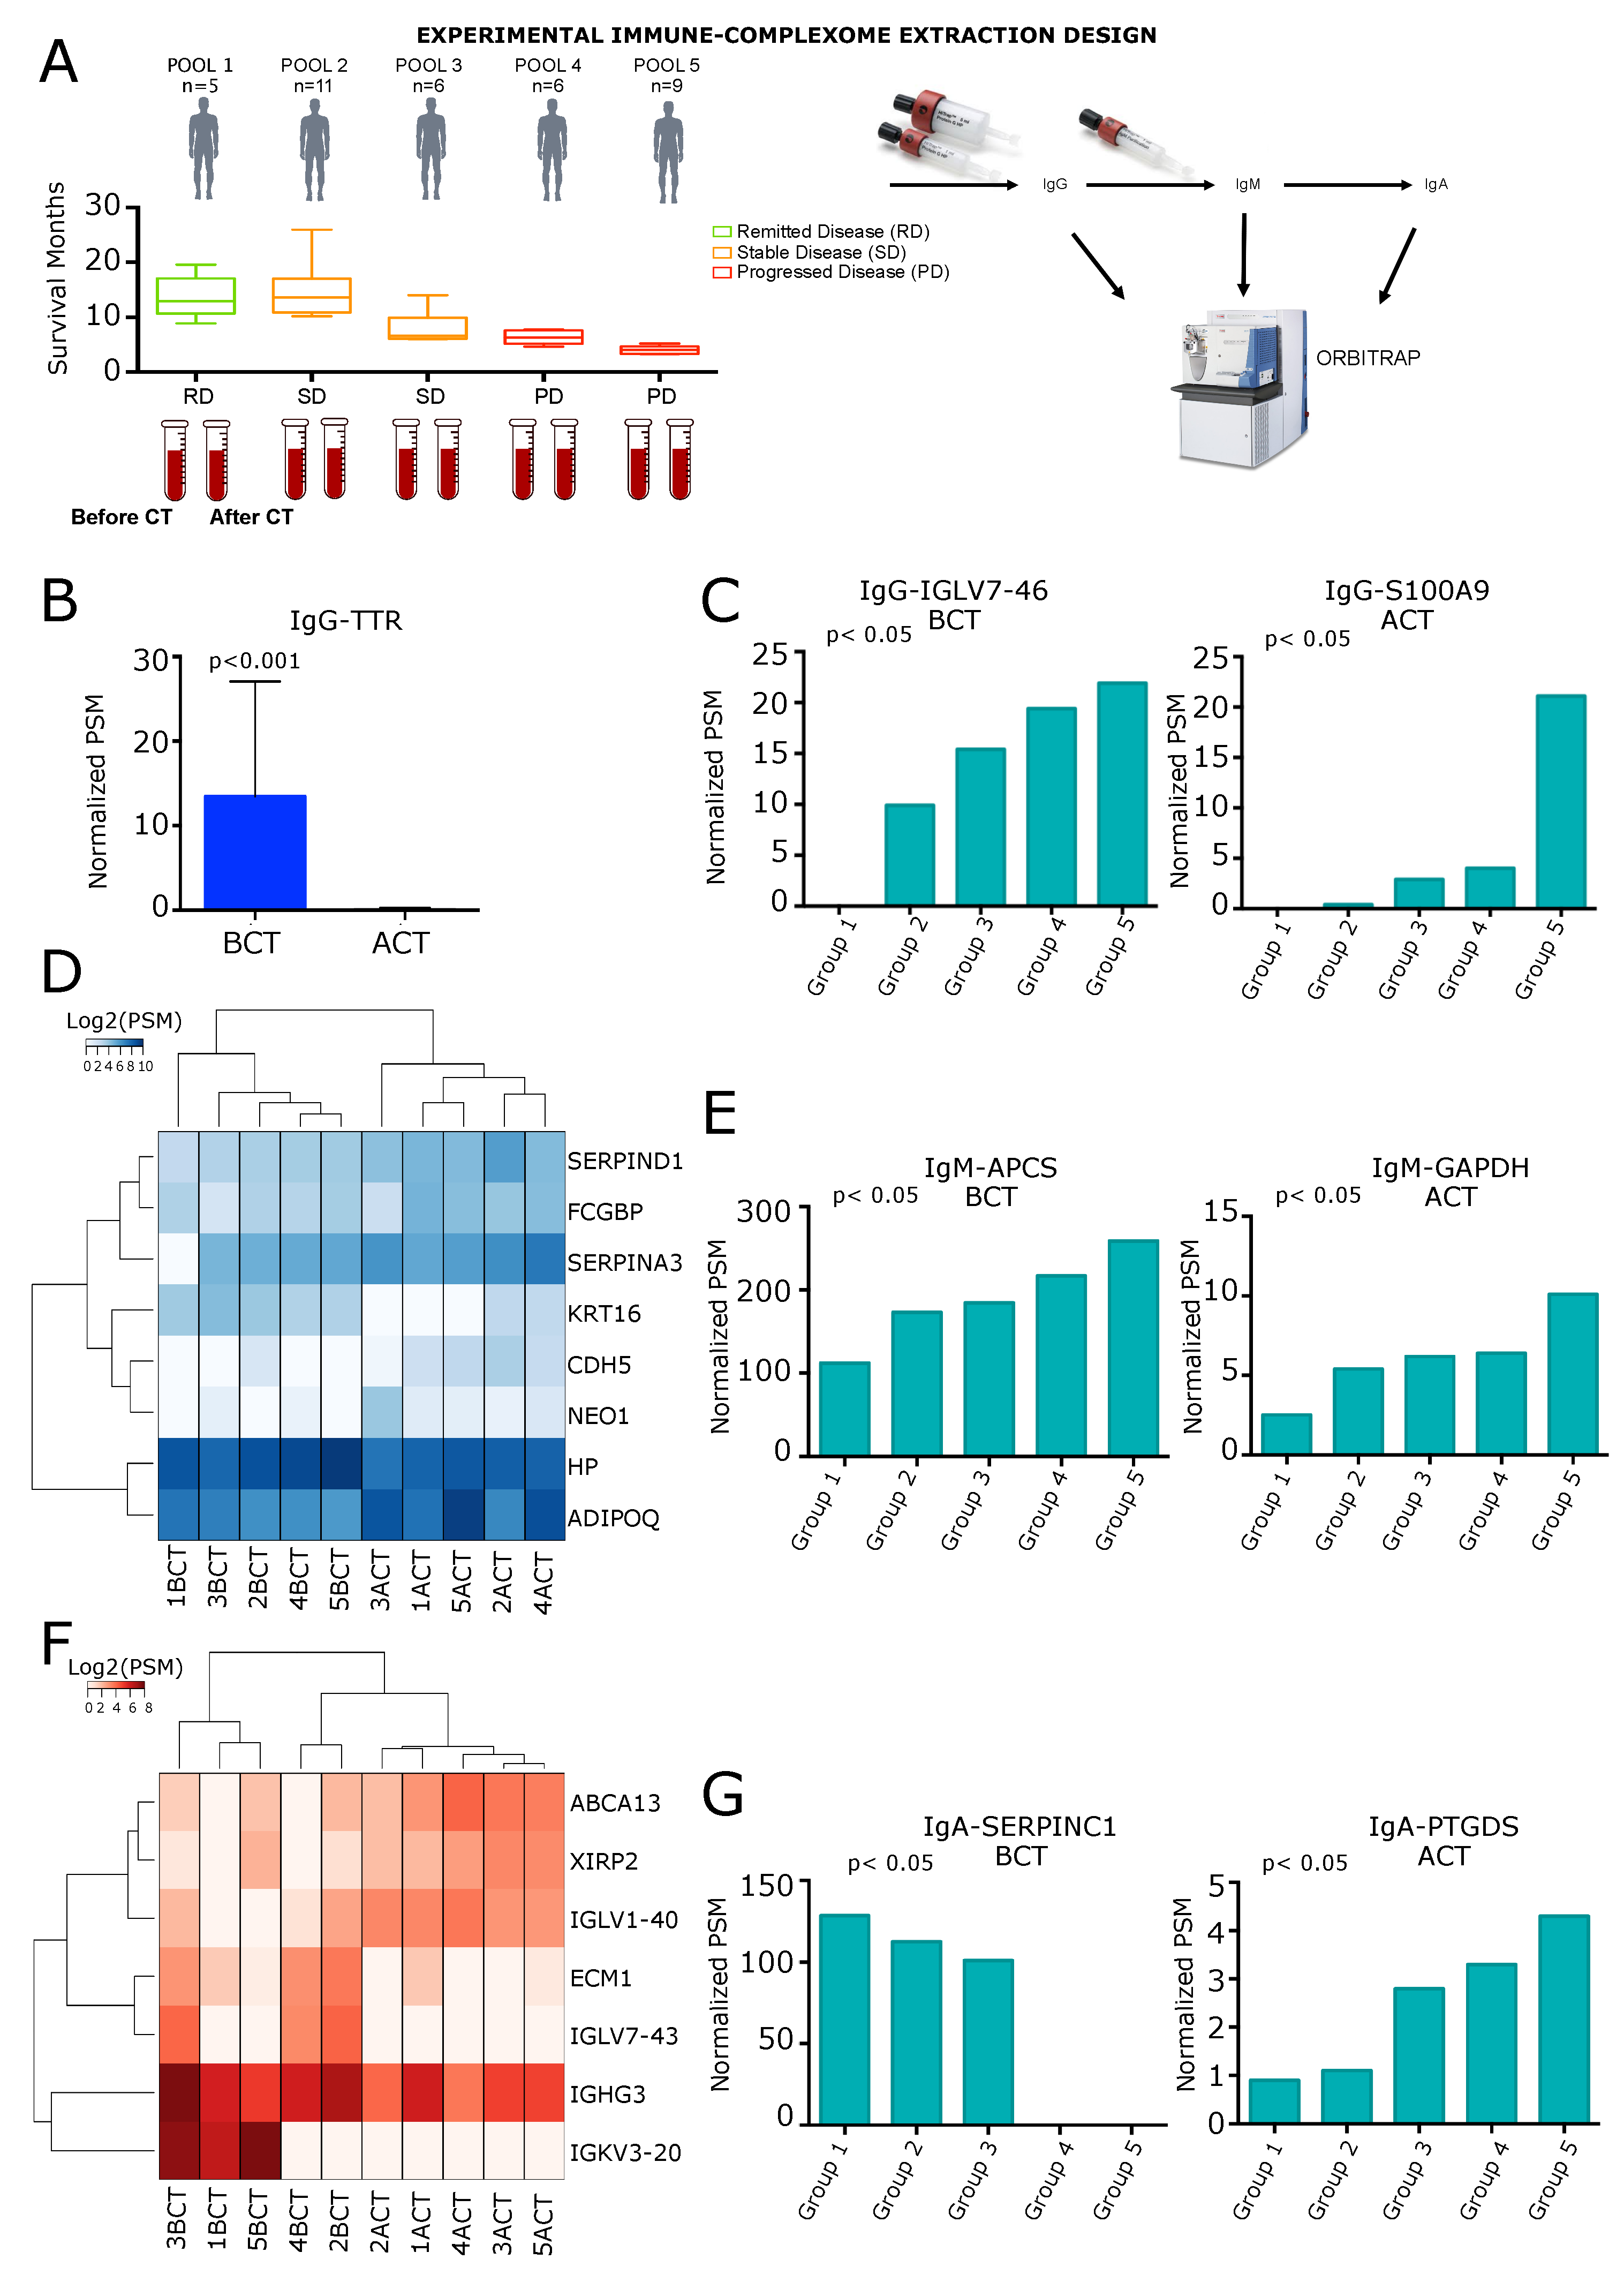
2. Results
2.1. Analysis of IgG-Circulating Immune Complexes
2.2. Analysis of IgM Circulating Immune Complexes
2.3. Analysis of IgA Circulating Immune Complexes
2.4. Enrichment Analysis of IgA, IgM and IgG CIC
3. Discussion
4. Materials and Methods
4.1. Patients
4.2. IgG-IC Purification
4.3. IgM-IC Purification
4.4. IgA-IC Separation
4.5. LC-MS Analysis
4.6. Protein Identification and Bioinformatics Aanalysis
4.7. Data Pre-Processing and Normalization
4.8. Differential Associated Antigens and Antigen Recognition Trends
4.9. Gene Set Enrichment Analysis
5. Conclusions
Supplementary Materials
Author Contributions
Funding
Conflicts of Interest
Abbreviations
| PDA | Pancreatic Ductal Adenocarcinoma |
| CT | ChemoTherapy |
| IC | Immune-Complexome |
| CIC | Circulating Immune Complexes |
| DAA | Differential Associated Antigens |
| TAA | Tumor Associated Antigens |
References
- Soares, K.C.; Zheng, L.; Edil, B.; Jaffee, E.M. Vaccines for pancreatic cancer. Cancer J. Sudbury Mass. 2012, 18, 642. [Google Scholar] [CrossRef] [PubMed] [Green Version]
- Tomaino, B.; Cappello, P.; Capello, M.; Fredolini, C.; Ponzetto, A.; Novarino, A.; Ciuffreda, L.; Bertetto, O.; De Angelis, C.; Gaia, E.; et al. Autoantibody signature in human ductal pancreatic adenocarcinoma. J. Proteome Res. 2007, 6, 4025–4031. [Google Scholar] [CrossRef] [PubMed]
- Cappello, P.; Tomaino, B.; Chiarle, R.; Ceruti, P.; Novarino, A.; Castagnoli, C.; Migliorini, P.; Perconti, G.; Giallongo, A.; Milella, M.; et al. An integrated humoral and cellular response is elicited in pancreatic cancer by α-enolase, a novel pancreatic ductal adenocarcinoma-associated antigen. Int. J. Cancer 2009, 125, 639–648. [Google Scholar] [CrossRef] [PubMed]
- Tomaino, B.; Cappello, P.; Capello, M.; Fredolini, C.; Sperduti, I.; Migliorini, P.; Salacone, P.; Novarino, A.; Giacobino, A.; Ciuffreda, L.; et al. Circulating autoantibodies to phosphorylated α-enolase are a hallmark of pancreatic cancer. J. Proteome Res. 2010, 10, 105–112. [Google Scholar] [CrossRef] [PubMed]
- Cappello, P.; Rolla, S.; Chiarle, R.; Principe, M.; Cavallo, F.; Perconti, G.; Feo, S.; Giovarelli, M.; Novelli, F. Vaccination with ENO1 DNA prolongs survival of genetically engineered mice with pancreatic cancer. Gastroenterology 2013, 144, 1098–1106. [Google Scholar] [CrossRef] [PubMed] [Green Version]
- Capello, M.; Cappello, P.; Linty, F.C.; Chiarle, R.; Sperduti, I.; Novarino, A.; Salacone, P.; Mandili, G.; Naccarati, A.; Sacerdote, C.; et al. Autoantibodies to Ezrin are an early sign of pancreatic cancer in humans and in genetically engineered mouse models. J. Hematol. Oncol. 2013, 6, 67. [Google Scholar] [CrossRef] [Green Version]
- Cappello, P.; Curcio, C.; Mandili, G.; Roux, C.; Bulfamante, S.; Novelli, F. Next, Generation Immunotherapy for Pancreatic Cancer: DNA Vaccination is Seeking New Combo Partners. Cancers 2018, 10, 51. [Google Scholar] [CrossRef] [Green Version]
- Ritzmann, S.E.; Daniels, J.C. Immune complexes: Characteristics, clinical correlations, and interpretive approaches in the clinical laboratory. Clin. Chem. 1982, 28, 1259–1271. [Google Scholar] [CrossRef]
- Nezlin, R. A quantitative approach to the determination of antigen in immune complexes. J. Immunol. Methods 2000, 237, 1–17. [Google Scholar] [CrossRef]
- Wener, M.H. Tests for circulating immune complexes. In Systemic Lupus Erythematosus; Springer: Berlin/Heidelberg, Germany, 2014; pp. 47–57. [Google Scholar]
- Ferrari, S.; Palavra, K.; Gruber, B.; Hovinga, J.A.K.; Knöbl, P.; Caron, C.; Cromwell, C.; Aledort, L.; Plaimauer, B.; Turecek, P.L.; et al. Persistence of circulating ADAMTS13-specific immune complexes in patients with acquired thrombotic thrombocytopenic purpura. Haematologica 2014, 99, 779–787. [Google Scholar] [CrossRef] [Green Version]
- Korolevskaya, L.; Shmagel, K.; Saidakova, E.; Shmagel, N.; Chereshnev, V. Immune complexes that contain HIV antigens activate peripheral blood T cells. In Doklady Biological Sciences; Springer: Berlin/Heidelberg, Germany, 2016; Volume 469, pp. 196–198. [Google Scholar]
- Theofilopoulos, A.N.; Andrews, B.S.; Urist, M.M.; Morton, D.L.; Dixon, F.J. The nature of immune complexes in human cancer sera. J. Immunol. 1977, 119, 657–663. [Google Scholar] [PubMed]
- Seth, P.; Balachandran, N.; Malaviya, A.; Kumar, R. Circulating immune complexes in carcinoma of uterine cervix. Clin. Exp. Immunol. 1979, 38, 77. [Google Scholar] [PubMed]
- Merl, J.; Deeg, C.A.; Swadzba, M.E.; Ueffing, M.; Hauck, S.M. Identification of autoantigens in body fluids by combining pull-downs and organic precipitations of intact immune complexes with quantitative label-free mass spectrometry. J. Proteome Res. 2013, 12, 5656–5665. [Google Scholar] [CrossRef] [PubMed]
- Capello, M.; Vykoukal, J.V.; Katayama, H.; Bantis, L.E.; Wang, H.; Kundnani, D.L.; Aguilar-Bonavides, C.; Aguilar, M.; Tripathi, S.C.; Dhillon, D.S.; et al. Exosomes harbor B cell targets in pancreatic adenocarcinoma and exert decoy function against complement-mediated cytotoxicity. Nat. Commun. 2019, 10, 254. [Google Scholar] [CrossRef]
- Carmi, Y.; Spitzer, M.H.; Linde, I.L.; Burt, B.M.; Prestwood, T.R.; Perlman, N.; Davidson, M.G.; Kenkel, J.A.; Segal, E.; Pusapati, G.V.; et al. Allogeneic IgG combined with dendritic cell stimuli induce antitumour T-cell immunity. Nature 2015, 521, 99. [Google Scholar] [CrossRef]
- Shalapour, S.; Karin, M. Immunity, inflammation, and cancer: An eternal fight between good and evil. J. Clin. Invest. 2015, 125, 3347–3355. [Google Scholar] [CrossRef] [Green Version]
- Castaldi, F.; Marino, M.; Beneduce, L.; Belluco, C.; De Marchi, F.; Mammano, E.; Nitti, D.; Lise, M.; Fassina, G. Detection of circulating CEA-IgM complexes in early stage colorectal cancer. Int. J. Biol. Markers 2005, 20, 204–208. [Google Scholar] [CrossRef]
- Beneduce, L.; Prayer-Galetti, T.; Giustinian, A.M.G.; Gallotta, A.; Betto, G.; Pagano, F.; Fassina, G. Detection of prostate-specific antigen coupled to immunoglobulin M in prostate cancer patients. Cancer Detect. Prev. 2007, 31, 402–407. [Google Scholar] [CrossRef]
- Satoh, M.; Takano, S.; Sogawa, K.; Noda, K.; Yoshitomi, H.; Ishibashi, M.; Mogushi, K.; Takizawa, H.; Otsuka, M.; Shimizu, H.; et al. Immune-complex level of cofilin-1 in sera is associated with cancer progression and poor prognosis in pancreatic cancer. Cancer Sci. 2017, 108, 795–803. [Google Scholar] [CrossRef]
- Bracci, L.; Schiavoni, G.; Sistigu, A.; Belardelli, F. Immune-based mechanisms of cytotoxic chemotherapy: Implications for the design of novel and rationale-based combined treatments against cancer. Cell Death Differ. 2014, 21, 15. [Google Scholar] [CrossRef] [Green Version]
- Grasso, C.; Jansen, G.; Giovannetti, E. Drug resistance in pancreatic cancer: Impact of altered energy metabolism. Crit. Rev. Oncol. Hematol. 2017, 114, 139–152. [Google Scholar] [CrossRef] [PubMed]
- Follia, L.; Ferrero, G.; Mandili, G.; Beccuti, M.; Giordano, D.; Spadi, R.; Satolli, M.A.; Evangelista, A.; Katayama, H.; Wang, H.; et al. Integrative analysis of novel metabolic subtypes in pancreatic cancer fosters new prognostic biomarkers. Front. Oncol. 2019, 9, 115. [Google Scholar] [CrossRef] [PubMed]
- Basso, D.; Bozzato, D.; Padoan, A.; Moz, S.; Zambon, C.F.; Fogar, P.; Greco, E.; Scorzeto, M.; Simonato, F.; Navaglia, F.; et al. Inflammation and pancreatic cancer: Molecular and functional interactions between S100A8, S100A9, NT-S100A8 and TGFβ1. Cell Cmmun. Signal. 2014, 12, 20. [Google Scholar] [CrossRef] [PubMed] [Green Version]
- Lv, S.; Gao, J.; Zhu, F.; Li, Z.; Gong, Y.; Xu, G.; Ma, L. Transthyretin, identified by proteomics, is overabundant in pancreatic juice from pancreatic carcinoma and originates from pancreatic islets. Diagn. Cytopathol. 2011, 39, 875–881. [Google Scholar] [CrossRef]
- Huang, B.; Cheng, X.; Wang, D.; Peng, M.; Xue, Z.; Da, Y.; Zhang, N.; Yao, Z.; Li, M.; Xu, A.; et al. Adiponectin promotes pancreatic cancer progression by inhibiting apoptosis via the activation of AMPK/Sirt1/PGC-1α signaling. Oncotarget 2014, 5, 4732. [Google Scholar] [CrossRef] [Green Version]
- Murphy, S.J.; Hart, S.N.; Lima, J.F.; Kipp, B.R.; Klebig, M.; Winters, J.L.; Szabo, C.; Zhang, L.; Eckloff, B.W.; Petersen, G.M.; et al. Genetic alterations associated with progression from pancreatic intraepithelial neoplasia to invasive pancreatic tumor. Gastroenterology 2013, 145, 1098–1109. [Google Scholar] [CrossRef] [Green Version]
- Morishita, K.; Ito, N.; Koda, S.; Maeda, M.; Nakayama, K.; Yoshida, K.; Takamatsu, S.; Yamada, M.; Eguchi, H.; Kamada, Y.; et al. Haptoglobin phenotype is a critical factor in the use of fucosylated haptoglobin for pancreatic cancer diagnosis. Clin. Chim. Acta 2018, 487, 84–89. [Google Scholar] [CrossRef]
- Chen, J.; Chen, L.J.; Xia, Y.L.; Zhou, H.C.; Yang, R.B.; Wu, W.; Lu, Y.; Hu, L.W.; Zhao, Y. Identification and verification of transthyretin as a potential biomarker for pancreatic ductal adenocarcinoma. J. Cancer Res. Clin. Oncol. 2013, 139, 1117–1127. [Google Scholar] [CrossRef]
- Miyoshi, E.; Kamada, Y. Application of glycoscience to the early detection of pancreatic cancer. Cancer Sci. 2016, 107, 1357–1362. [Google Scholar] [CrossRef] [Green Version]
- Speisky, D.; Duces, A.; Bièche, I.; Rebours, V.; Hammel, P.; Sauvanet, A.; Richard, S.; Bedossa, P.; Vidaud, M.; Murat, A.; et al. Molecular profiling of pancreatic neuroendocrine tumors in sporadic and Von Hippel-Lindau patients. Clin. Cancer Res. 2012, 18, 2838–2849. [Google Scholar] [CrossRef] [Green Version]
- Park, J.; Yun, H.S.; Lee, K.H.; Lee, K.T.; Lee, J.K.; Lee, S.Y. Discovery and validation of biomarkers that distinguish mucinous and nonmucinous pancreatic cysts. Cancer Res. 2015, 75, 3227–3235. [Google Scholar] [CrossRef] [PubMed] [Green Version]
- Stamp, L.A.; Braxton, D.R.; Wu, J.; Akopian, V.; Hasegawa, K.; Chandrasoma, P.T.; Hawes, S.M.; McLean, C.; Petrovic, L.M.; Wang, K.; et al. The GCTM-5 epitope associated with the mucin-like glycoprotein FCGBP marks progenitor cells in tissues of endodermal origin. Stem Cells 2012, 30, 1999–2009. [Google Scholar] [CrossRef] [PubMed] [Green Version]
- Nedjadi, T.; Evans, A.; Sheikh, A.; Barerra, L.; Al-Ghamdi, S.; Oldfield, L.; Greenhalf, W.; Neoptolemos, J.P.; Costello, E. S100A8 and S100A9 proteins form part of a paracrine feedback loop between pancreatic cancer cells and monocytes. BMC Cancer 2018, 18, 1255. [Google Scholar] [CrossRef] [PubMed]
- Hebbard, L.; Ranscht, B. Multifaceted roles of adiponectin in cancer. Best Pract. Res. Clin. Eendocrinol. Metab. 2014, 28, 59–69. [Google Scholar] [CrossRef] [PubMed] [Green Version]
- Kato, M.; Watabe, K.; Tsujii, M.; Funahashi, T.; Shimomura, I.; Takehara, T. Adiponectin inhibits murine pancreatic cancer growth. Dig. Dis. Sci. 2014, 59, 1192–1196. [Google Scholar] [CrossRef] [PubMed]
- Chang, M.C.; Chang, Y.T.; Su, T.C.; Yang, W.S.; Chen, C.L.; Tien, Y.W.; Liang, P.C.; Wei, S.C.; Wong, J.M. Adiponectin as a potential differential marker to distinguish pancreatic cancer and chronic pancreatitis. Pancreas 2007, 35, 16–21. [Google Scholar] [CrossRef] [Green Version]
- Dalamaga, M.; Migdalis, I.; Fargnoli, J.L.; Papadavid, E.; Bloom, E.; Mitsiades, N.; Karmaniolas, K.; Pelecanos, N.; Tseleni-Balafouta, S.; Dionyssiou-Asteriou, A.; et al. Pancreatic cancer expresses adiponectin receptors and is associated with hypoleptinemia and hyperadiponectinemia: A case–control study. Cancer Caus. Control 2009, 20, 625–633. [Google Scholar] [CrossRef] [Green Version]
- Dranka-Bojarowska, D.; Lekstan, A.; Olakowski, M.; Jablonska, B.; Lewinski, A.; Musialski, P.; Sobczyk, W.; Kapalka, A.; Lampe, P. The assessment of serum concentration of adiponectin, leptin and serum carbohydrate antigen-19.9 in patients with pancreatic cancer and chronic pancreatitis. J. Physiol. Pharmacol. 2015, 66, 653–663. [Google Scholar]
- Stolzenberg-Solomon, R.Z.; Weinstein, S.; Pollak, M.; Tao, Y.; Taylor, P.R.; Virtamo, J.; Albanes, D. Prediagnostic adiponectin concentrations and pancreatic cancer risk in male smokers. Am. J. Epidemiol. 2008, 168, 1047–1055. [Google Scholar] [CrossRef]
- Bao, Y.; Giovannucci, E.L.; Kraft, P.; Stampfer, M.J.; Ogino, S.; Ma, J.; Buring, J.E.; Sesso, H.D.; Lee, I.M.; Gaziano, J.M.; et al. A prospective study of plasma adiponectin and pancreatic cancer risk in five US cohorts. J. Natl. Cancer Ins. 2012, 105, 95–103. [Google Scholar] [CrossRef]
- Pezzilli, R.; Barassi, A.; Corsi, M.M.; Morselli-Labate, A.M.; Campana, D.; Casadei, R.; Santini, D.; Corinaldesi, R.; D’Eril, G.M. Serum leptin, but not adiponectin and receptor for advanced glycation end products, is able to distinguish autoimmune pancreatitis from both chronic pancreatitis and pancreatic neoplasms. Scand. J. Gastroenterol. 2010, 45, 93–99. [Google Scholar] [CrossRef]
- Kadri, M.C.; Bostanci, E.; Ozdemir, Y.; Dalgic, T.; Aksoy, E.; Ozer, I.; Ozogul, Y.; Oter, V. Roles of adiponectin and leptin as diagnostic markers in pancreatic cancer. Bratislavske Lekarske Listy 2017, 118, 394–398. [Google Scholar]
- Trachte, A.L.; Suthers, S.E.; Lerner, M.R.; Hanas, J.S.; Jupe, E.R.; Sienko, A.E.; Adesina, A.M.; Lightfoot, S.A.; Brackett, D.J.; Postier, R.G. Increased expression of alpha-1-antitrypsin, glutathione S-transferase π and vascular endothelial growth factor in human pancreatic adenocarcinoma. Am. J. Surg. 2002, 184, 642–647. [Google Scholar] [CrossRef]
- Trichopoulos, D.; Tzonou, A.; Kalapothaki, V.; Sparos, L.; Kremastinou, T.; Skoutari, M. Alpha1-antitrypsin and survival in pancreatic cancer. Int. J. Cancers 1990, 45, 685–686. [Google Scholar] [CrossRef]
- Hexige Saiyin, N.N.; Han, X.; Fang, Y.; Wu, Y.; Lou, W.; Yang, X. BRSK2 induced by nutrient deprivation promotes Akt activity in pancreatic cancer via downregulation of mTOR activity. Oncotarget 2017, 8, 44669. [Google Scholar]
- Nymoen, D.A.; Holth, A.; Falkenthal, T.E.H.; Tropé, C.G.; Davidson, B. CIAPIN1 and ABCA13 are markers of poor survival in metastatic ovarian serous carcinoma. Mol. Cancer 2015, 14, 44. [Google Scholar] [CrossRef] [Green Version]
- Li, X.; Wu, W.K.; Xing, R.; Wong, S.H.; Liu, Y.; Fang, X.; Zhang, Y.; Wang, M.; Wang, J.; Li, L.; et al. Distinct subtypes of gastric cancer defined by molecular characterization include novel mutational signatures with prognostic capability. Cancer Res. 2016, 76, 1724–1732. [Google Scholar] [CrossRef] [Green Version]
- Zeng, X.; Hood, B.L.; Zhao, T.; Conrads, T.P.; Sun, M.; Gopalakrishnan, V.; Grover, H.; Day, R.S.; Weissfeld, J.L.; Wilson, D.O.; et al. Lung cancer serum biomarker discovery using label-free liquid chromatography-tandem mass spectrometry. J. Thor. Oncol. 2011, 6, 725–734. [Google Scholar] [CrossRef] [Green Version]
- Katayama, H.; Paczesny, S.; Prentice, R.; Aragaki, A.; Faca, V.M.; Pitteri, S.J.; Zhang, Q.; Wang, H.; Silva, M.; Kennedy, J.; et al. Application of serum proteomics to the Women’s Health Initiative conjugated equine estrogens trial reveals a multitude of effects relevant to clinical findings. Genome Med. 2009, 1, 47. [Google Scholar] [CrossRef]
- Love, M.I.; Huber, W.; Anders, S. Moderated estimation of fold change and dispersion for RNA-seq data with DESeq2. Genome Biol. 2014, 15, 550. [Google Scholar] [CrossRef] [Green Version]
- Nueda, M.J.; Tarazona, S.; Conesa, A. Next, maSigPro: Updating maSigPro bioconductor package for RNA-seq time series. Bioinformatics 2014, 30, 2598–2602. [Google Scholar] [CrossRef] [PubMed] [Green Version]
- Kuleshov, M.V.; Jones, M.R.; Rouillard, A.D.; Fernandez, N.F.; Duan, Q.; Wang, Z.; Koplev, S.; Jenkins, S.L.; Jagodnik, K.M.; Lachmann, A.; et al. Enrichr: A comprehensive gene set enrichment analysis web server 2016 update. Nucleic Acids Res. 2016, 44, W90–W97. [Google Scholar] [CrossRef] [PubMed] [Green Version]
Sample Availability: All relevant data are available within the Article and the Supplementary files, or available from the authors upon request. |


| Gene Name | Ig Subtype | Variation Following Chemotherapy |
|---|---|---|
| TTR | IgG | decreased |
| ADIPOQ | IgM | increased |
| CDH5 | IgM | increased |
| FCGBP | IgM | increased |
| HP | IgM | decreased |
| KRT16 | IgM | decreased |
| NEO1 | IgM | increased |
| SERPINA3 | IgM | increased |
| SERPIND1 | IgM | increased |
| ABCA13 | IgA | increased |
| ECM1 | IgA | decreased |
| IGHG3 | IgA | decreased |
| IGKV3-20 | IgA | decreased |
| IGLV1-40 | IgA | increased |
| IGLV7-43 | IgA | decreased |
| XIRP2 | IgA | increased |
| Gene Name | Ig Subtype | Trend (from Group 1 to 5) |
|---|---|---|
| IGKV6D-21 | IgG | increasing |
| IGLV7-46 | IgG | increasing |
| AOC3 | IgM | decreasing |
| APCS | IgM | increasing |
| APOB | IgM | decreasing |
| IGLV3-25 | IgM | decreasing |
| APOL1 | IgA | increasing |
| IGHV3OR16-9 | IgA | increasing |
| MMRN2 | IgA | increasing |
| SERPINC1 | IgA | decreasing |
| SERPIND1 | IgA | increasing |
| Gene Name | Ig Subtype | Trend (from Groups 1 to 5) |
|---|---|---|
| APOC2 | IgG | decreasing |
| C4B | IgG | decreasing |
| S100A9 | IgG | increasing |
| GAPDH | IgM | increasing |
| IGLV1-47 | IgM | decreasing |
| OLFM2 | IgM | decreasing |
| C9 | IgA | increasing |
| FREM2 | IgA | increasing |
| IGHD | IgA | increasing |
| KCNQ2 | IgA | increasing |
| PTGDS | IgA | increasing |
© 2020 by the authors. Licensee MDPI, Basel, Switzerland. This article is an open access article distributed under the terms and conditions of the Creative Commons Attribution (CC BY) license (http://creativecommons.org/licenses/by/4.0/).
Share and Cite
Mandili, G.; Follia, L.; Ferrero, G.; Katayama, H.; Hong, W.; Momin, A.A.; Capello, M.; Giordano, D.; Spadi, R.; Satolli, M.A.; et al. Immune-Complexome Analysis Identifies Immunoglobulin-Bound Biomarkers That Predict the Response to Chemotherapy of Pancreatic Cancer Patients. Cancers 2020, 12, 746. https://0-doi-org.brum.beds.ac.uk/10.3390/cancers12030746
Mandili G, Follia L, Ferrero G, Katayama H, Hong W, Momin AA, Capello M, Giordano D, Spadi R, Satolli MA, et al. Immune-Complexome Analysis Identifies Immunoglobulin-Bound Biomarkers That Predict the Response to Chemotherapy of Pancreatic Cancer Patients. Cancers. 2020; 12(3):746. https://0-doi-org.brum.beds.ac.uk/10.3390/cancers12030746
Chicago/Turabian StyleMandili, Giorgia, Laura Follia, Giulio Ferrero, Hiroyuki Katayama, Wang Hong, Amin A. Momin, Michela Capello, Daniele Giordano, Rosella Spadi, Maria Antonietta Satolli, and et al. 2020. "Immune-Complexome Analysis Identifies Immunoglobulin-Bound Biomarkers That Predict the Response to Chemotherapy of Pancreatic Cancer Patients" Cancers 12, no. 3: 746. https://0-doi-org.brum.beds.ac.uk/10.3390/cancers12030746