Hakin-1, a New Specific Small-Molecule Inhibitor for the E3 Ubiquitin-Ligase Hakai, Inhibits Carcinoma Growth and Progression

 and
and 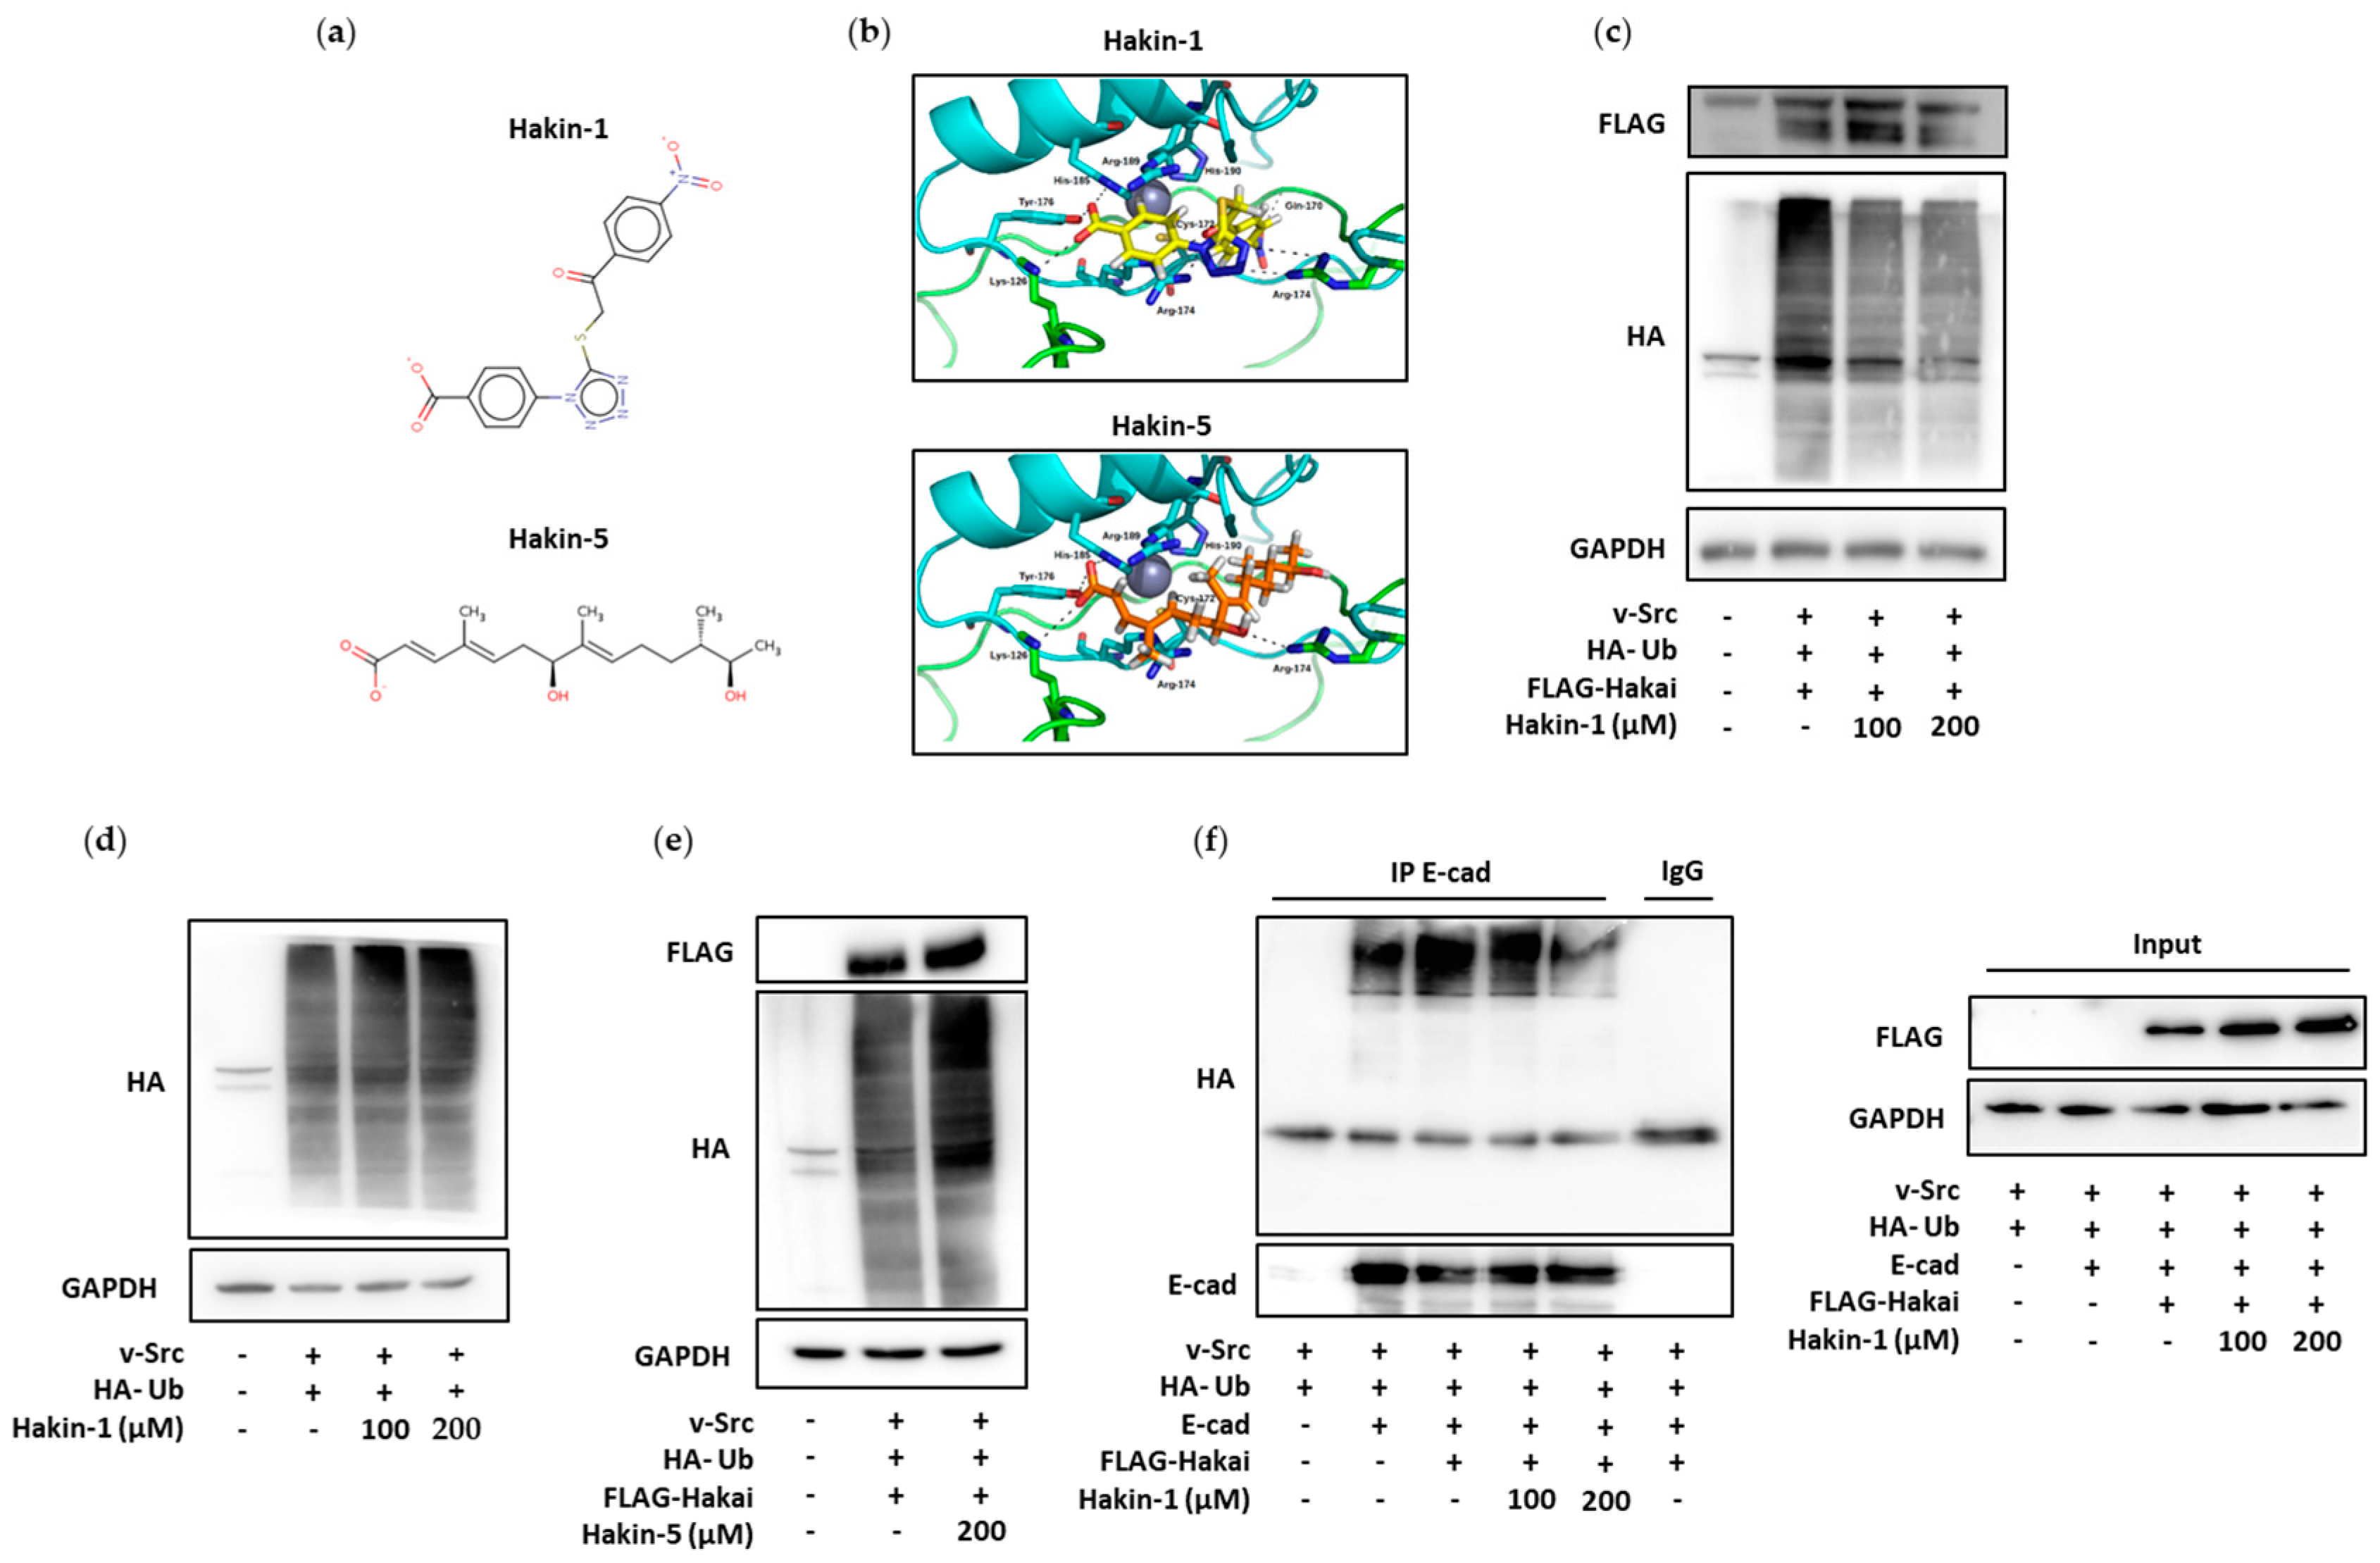
Abstract
:1. Introduction
2. Results
2.1. Identification of Putative Selective Hakai Inhibitors
2.2. Effect of Hakin-1 on Hakai-Induced Ubiquitination
2.3. Hakin-1 Activates Epithelial Cell Differentiation in Tumour Cells
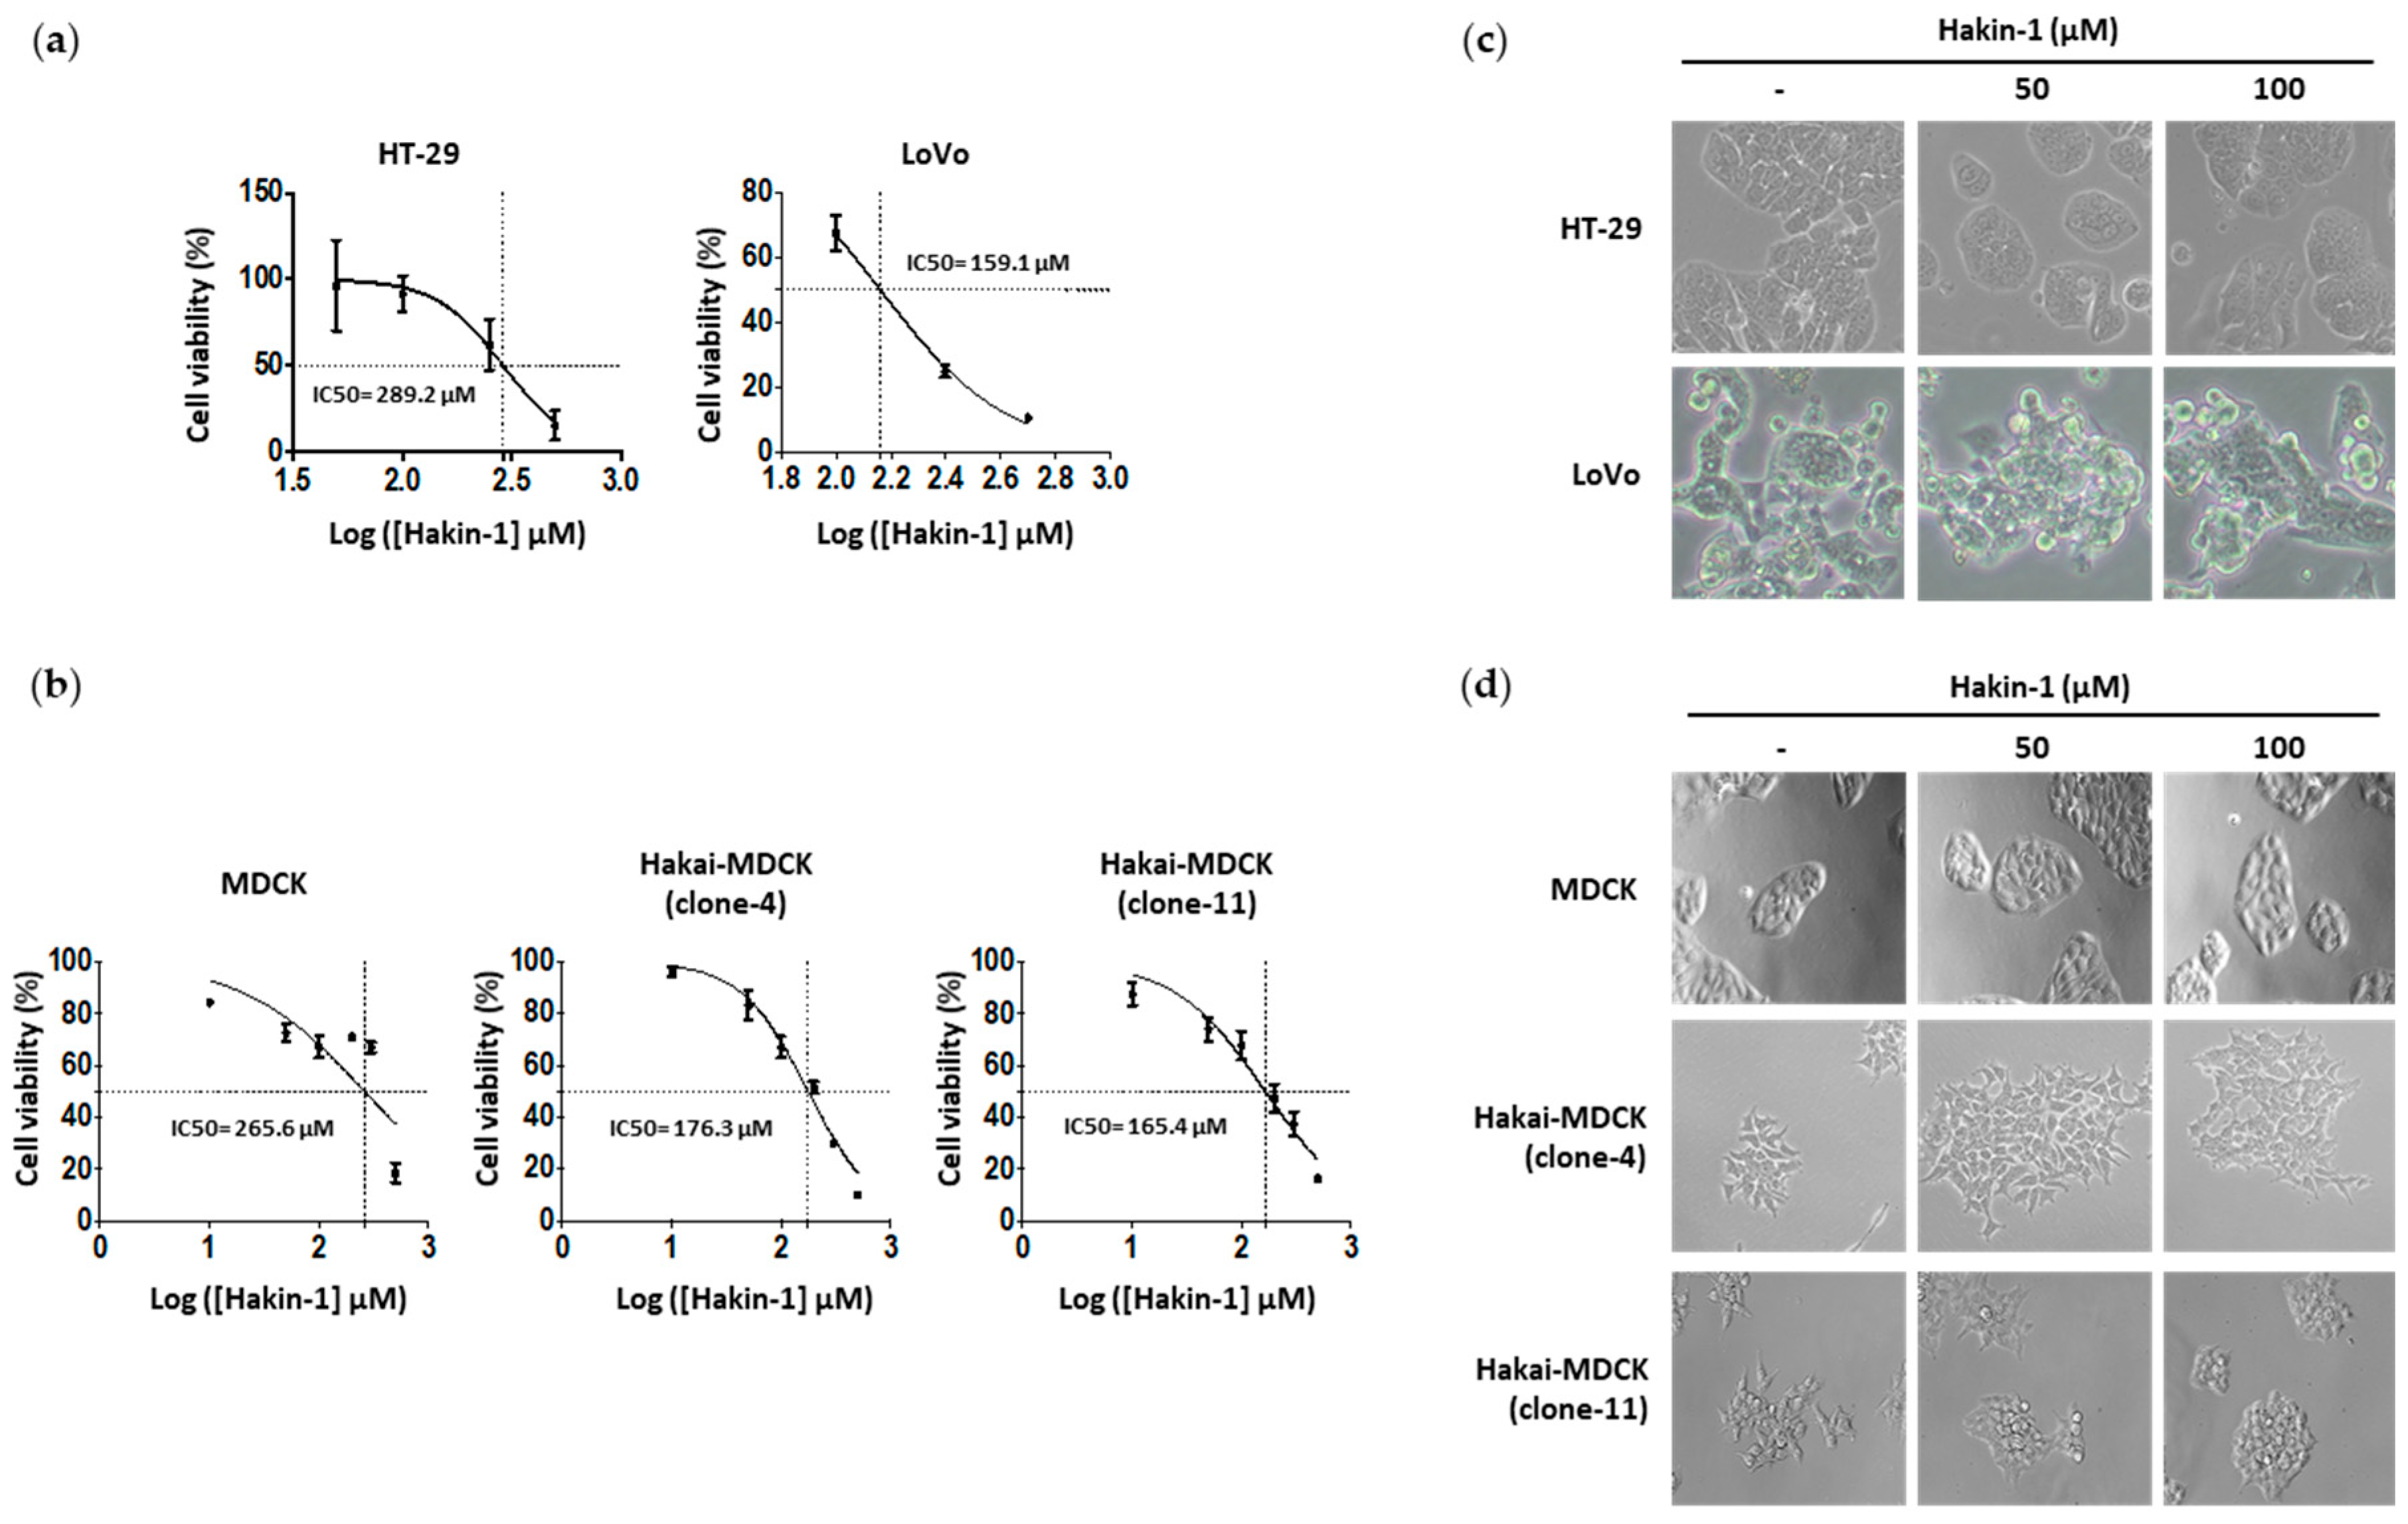
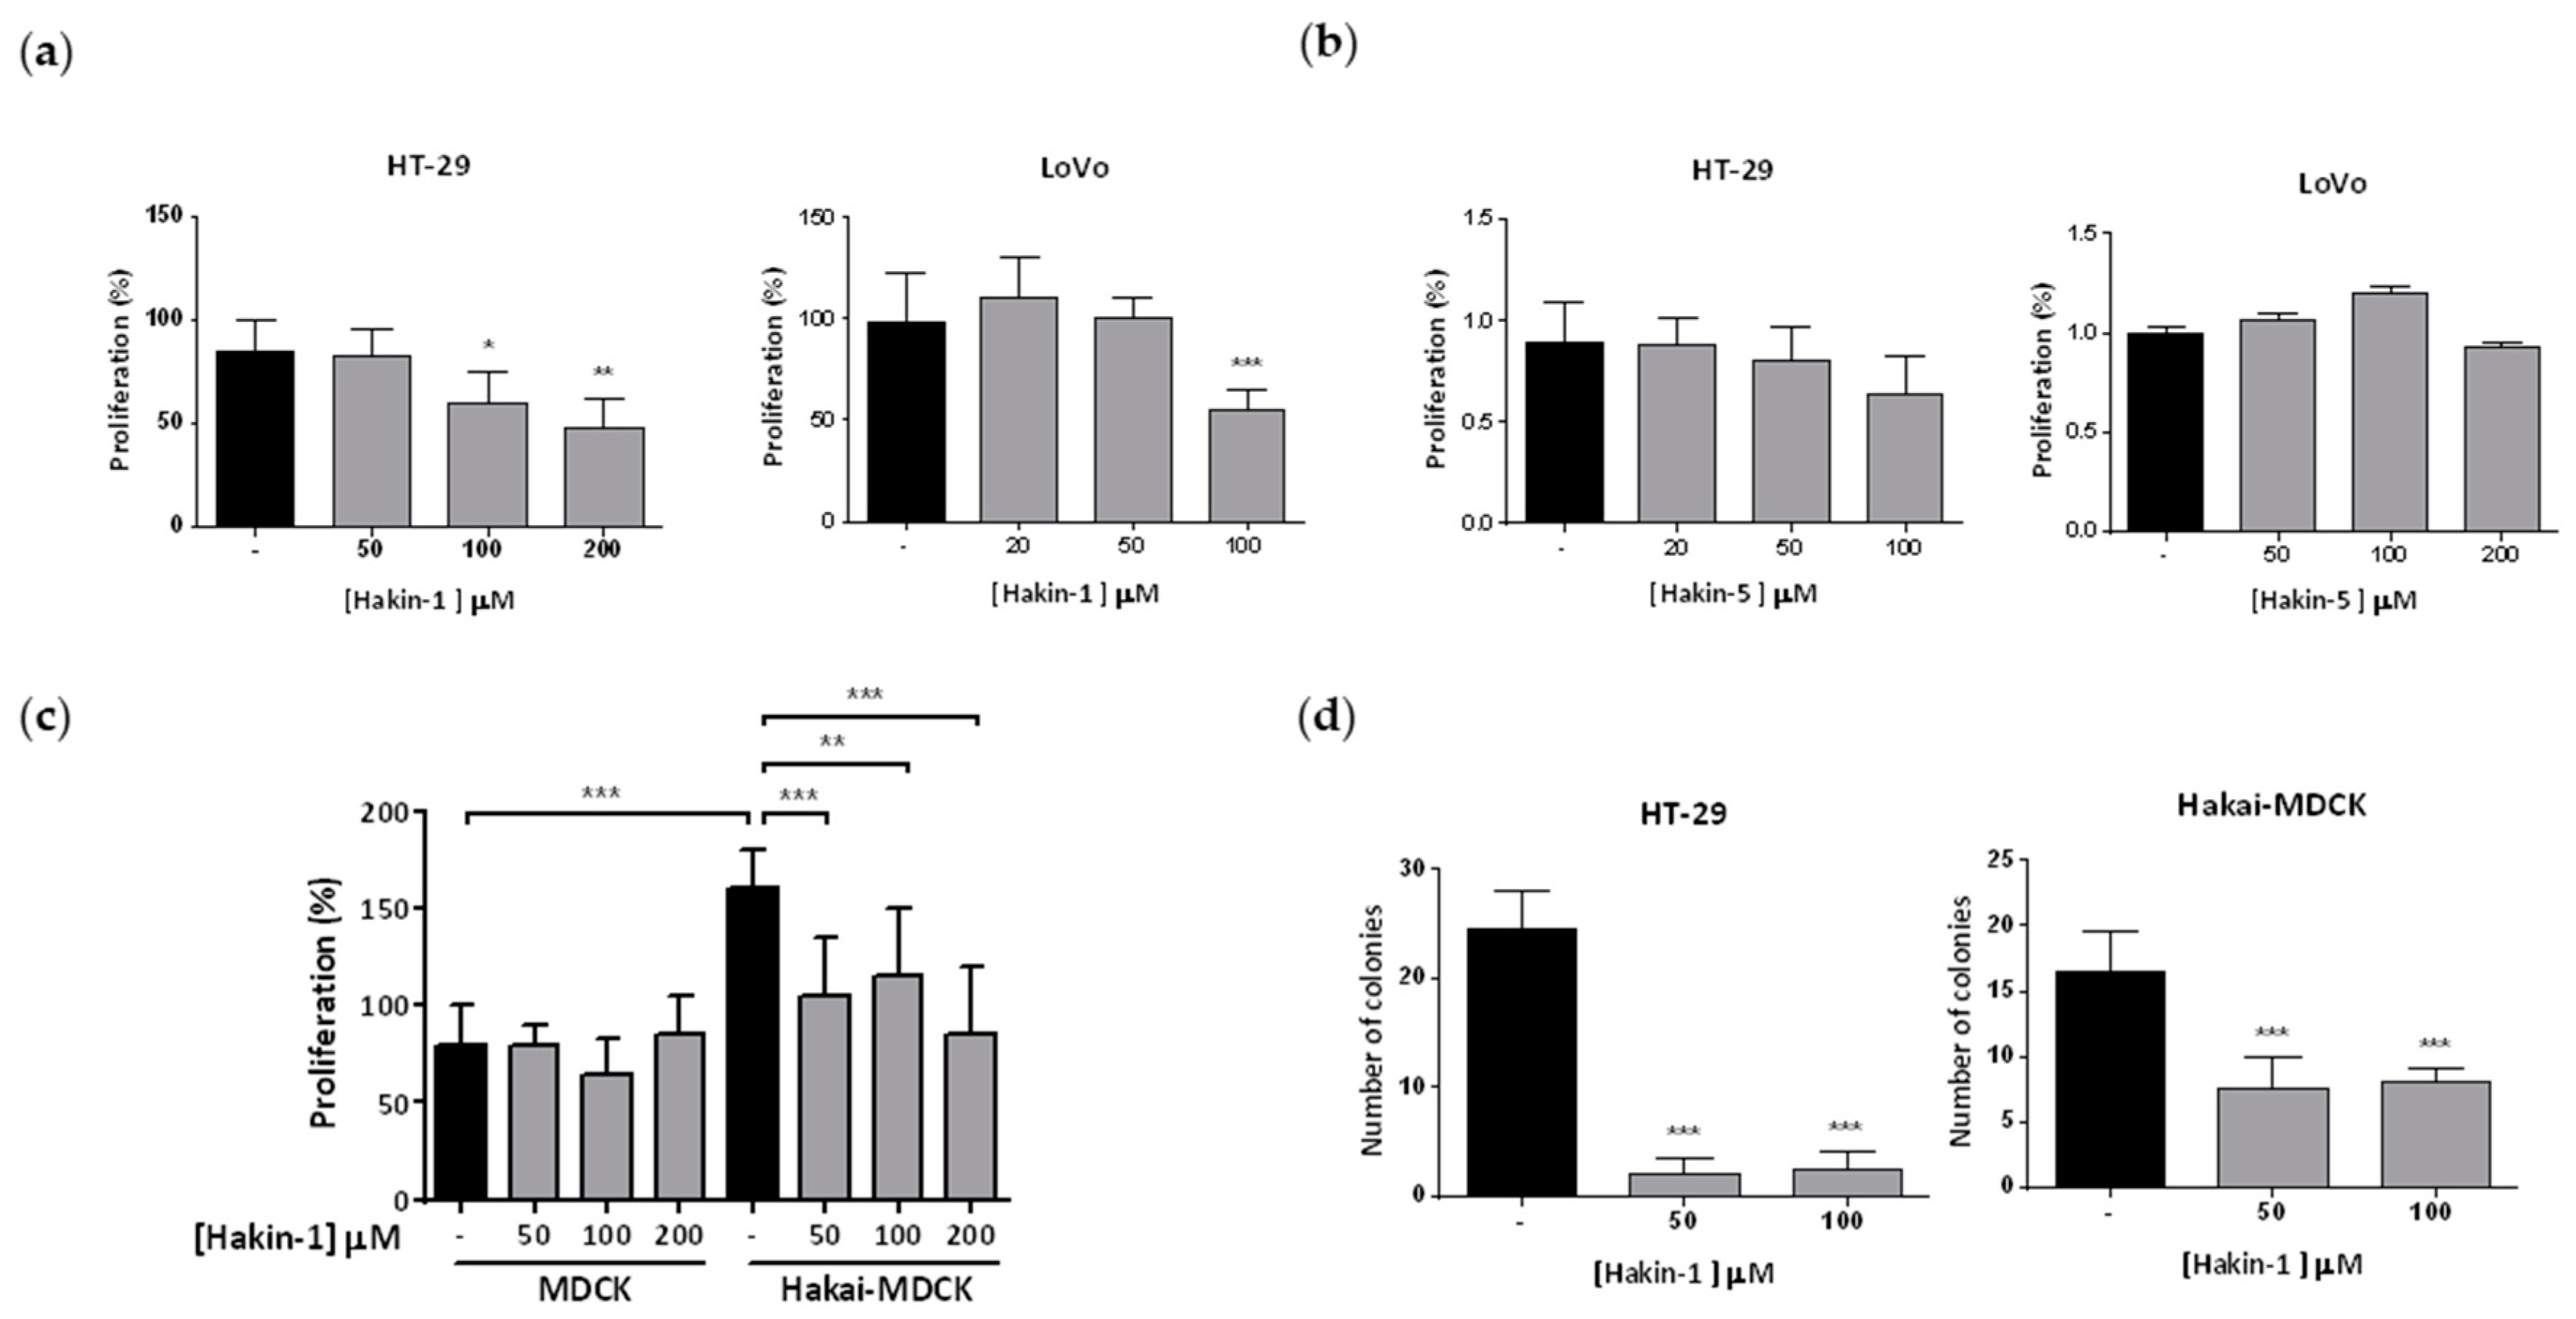
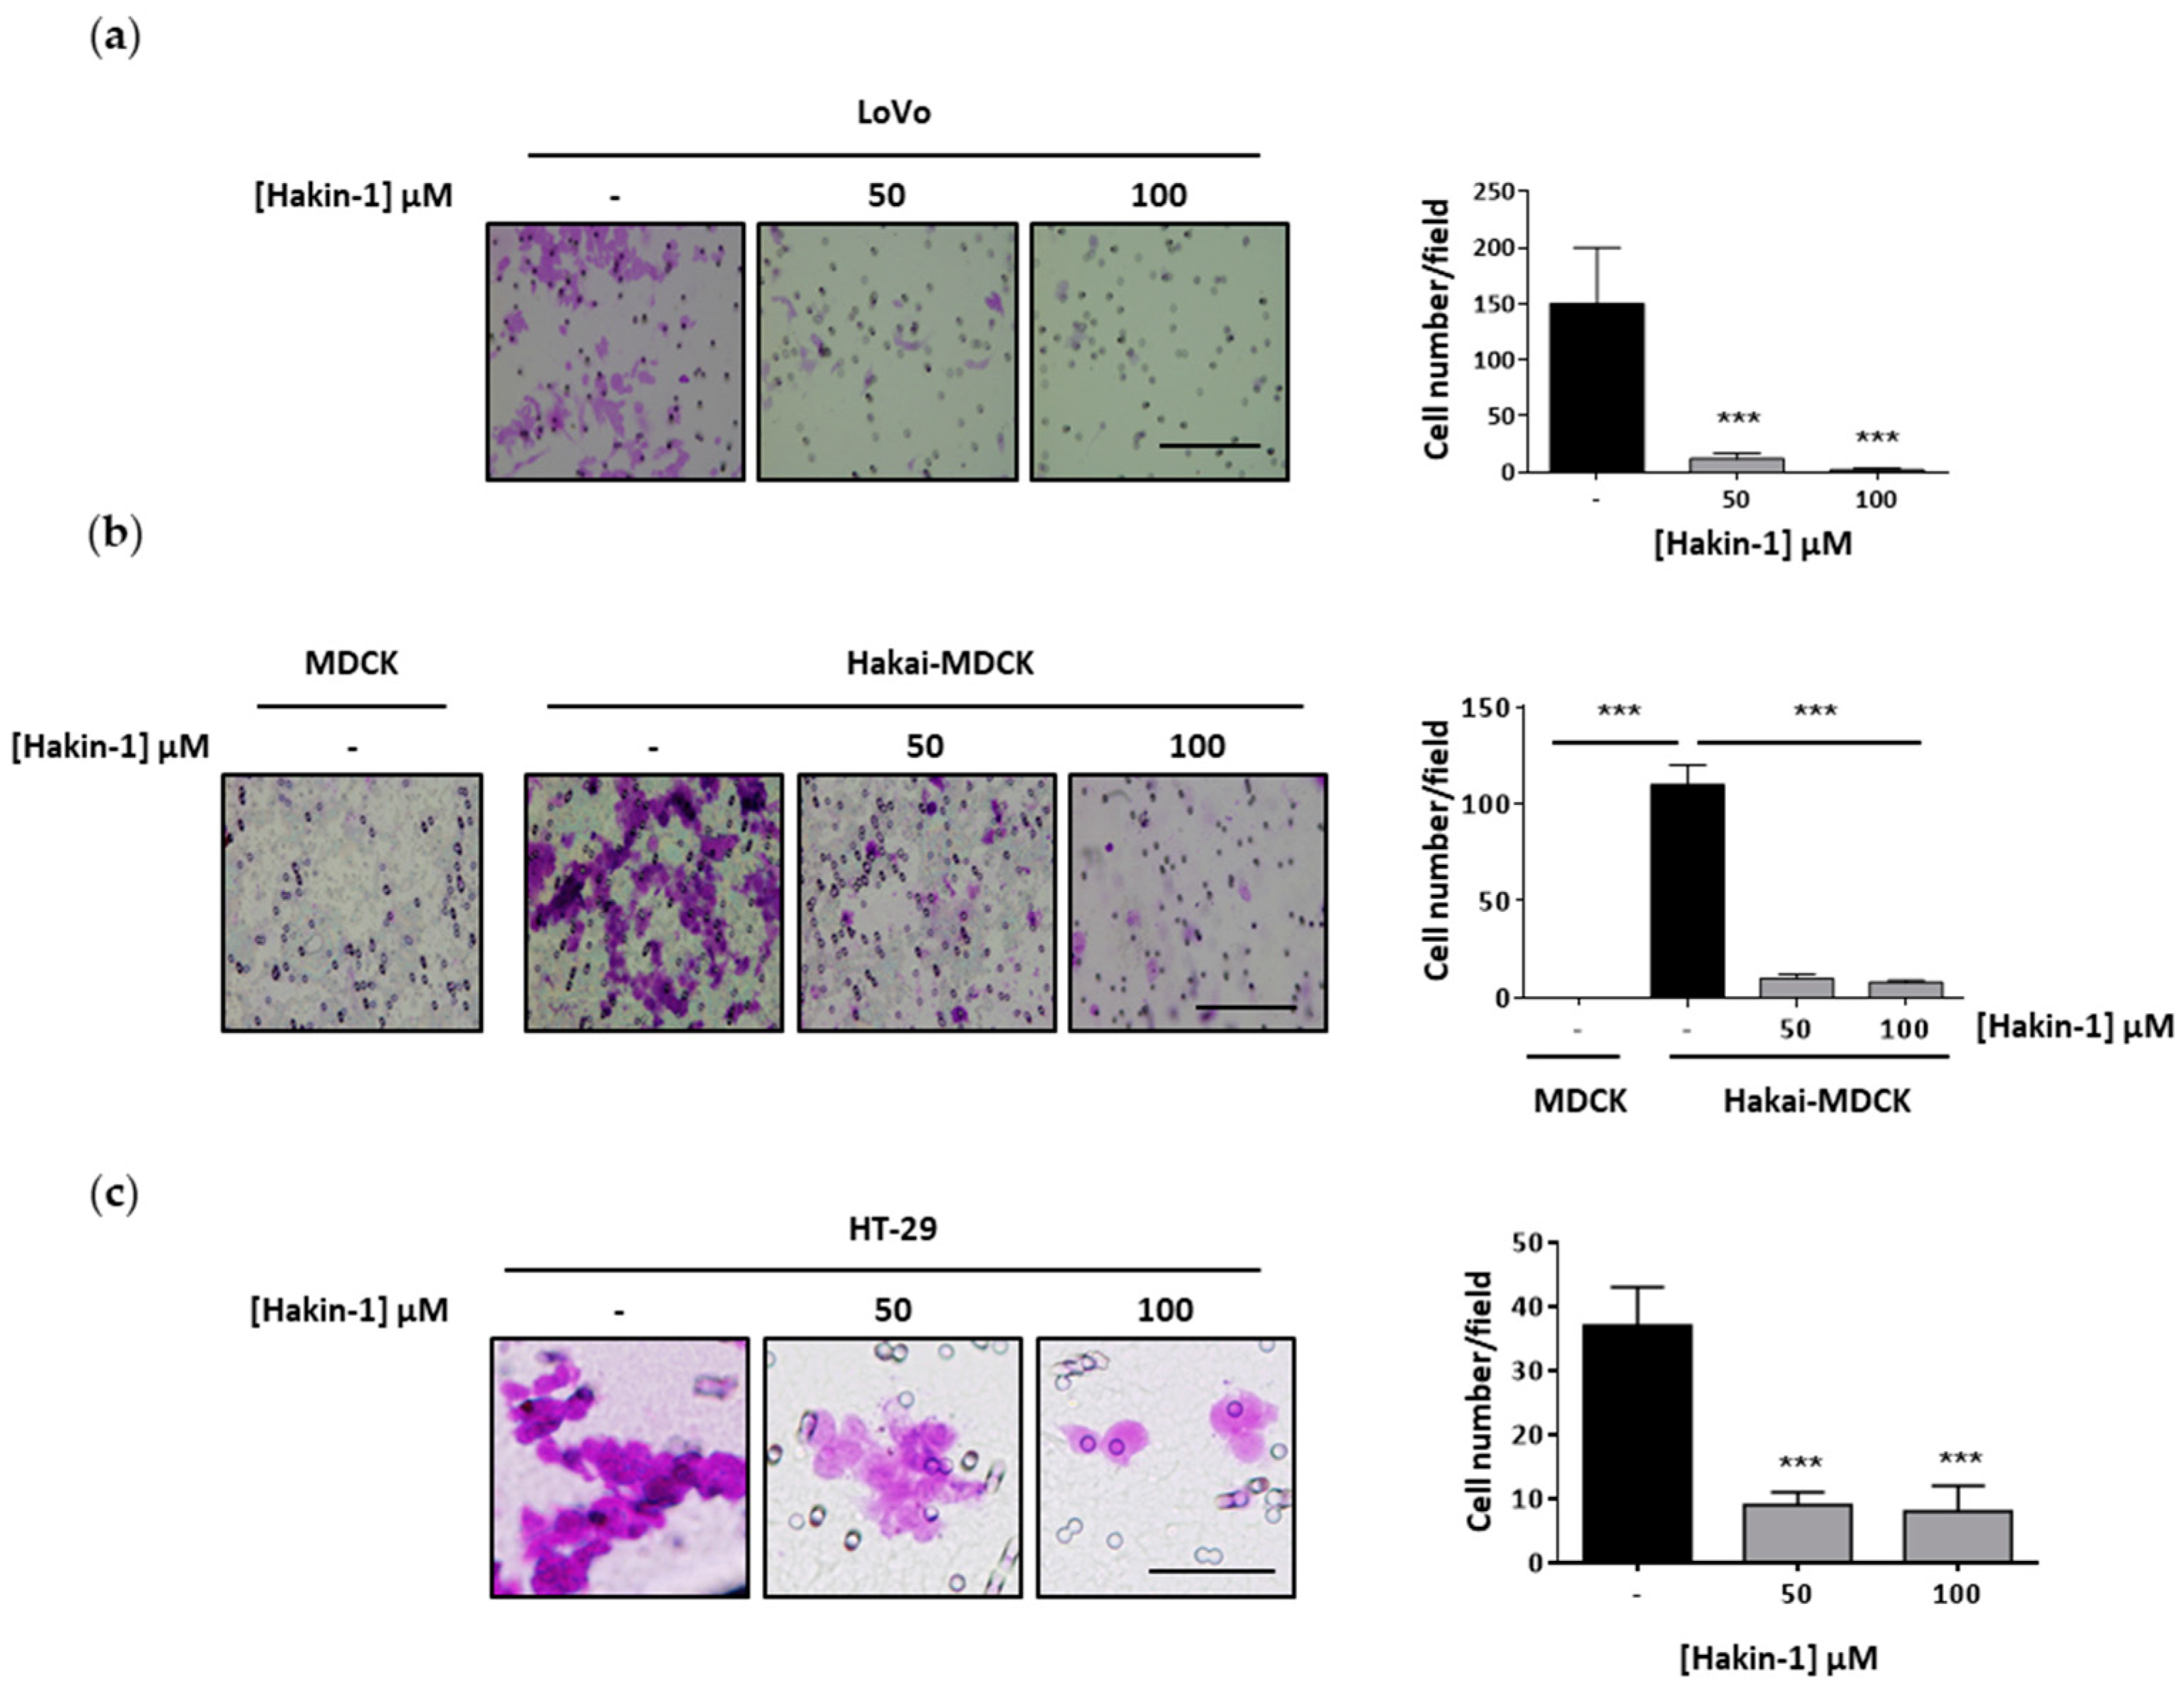
2.4. Hakin-1 Inhibits Proliferation, Oncogenic Potential and Invasiveness of Epithelial Tumour Cells
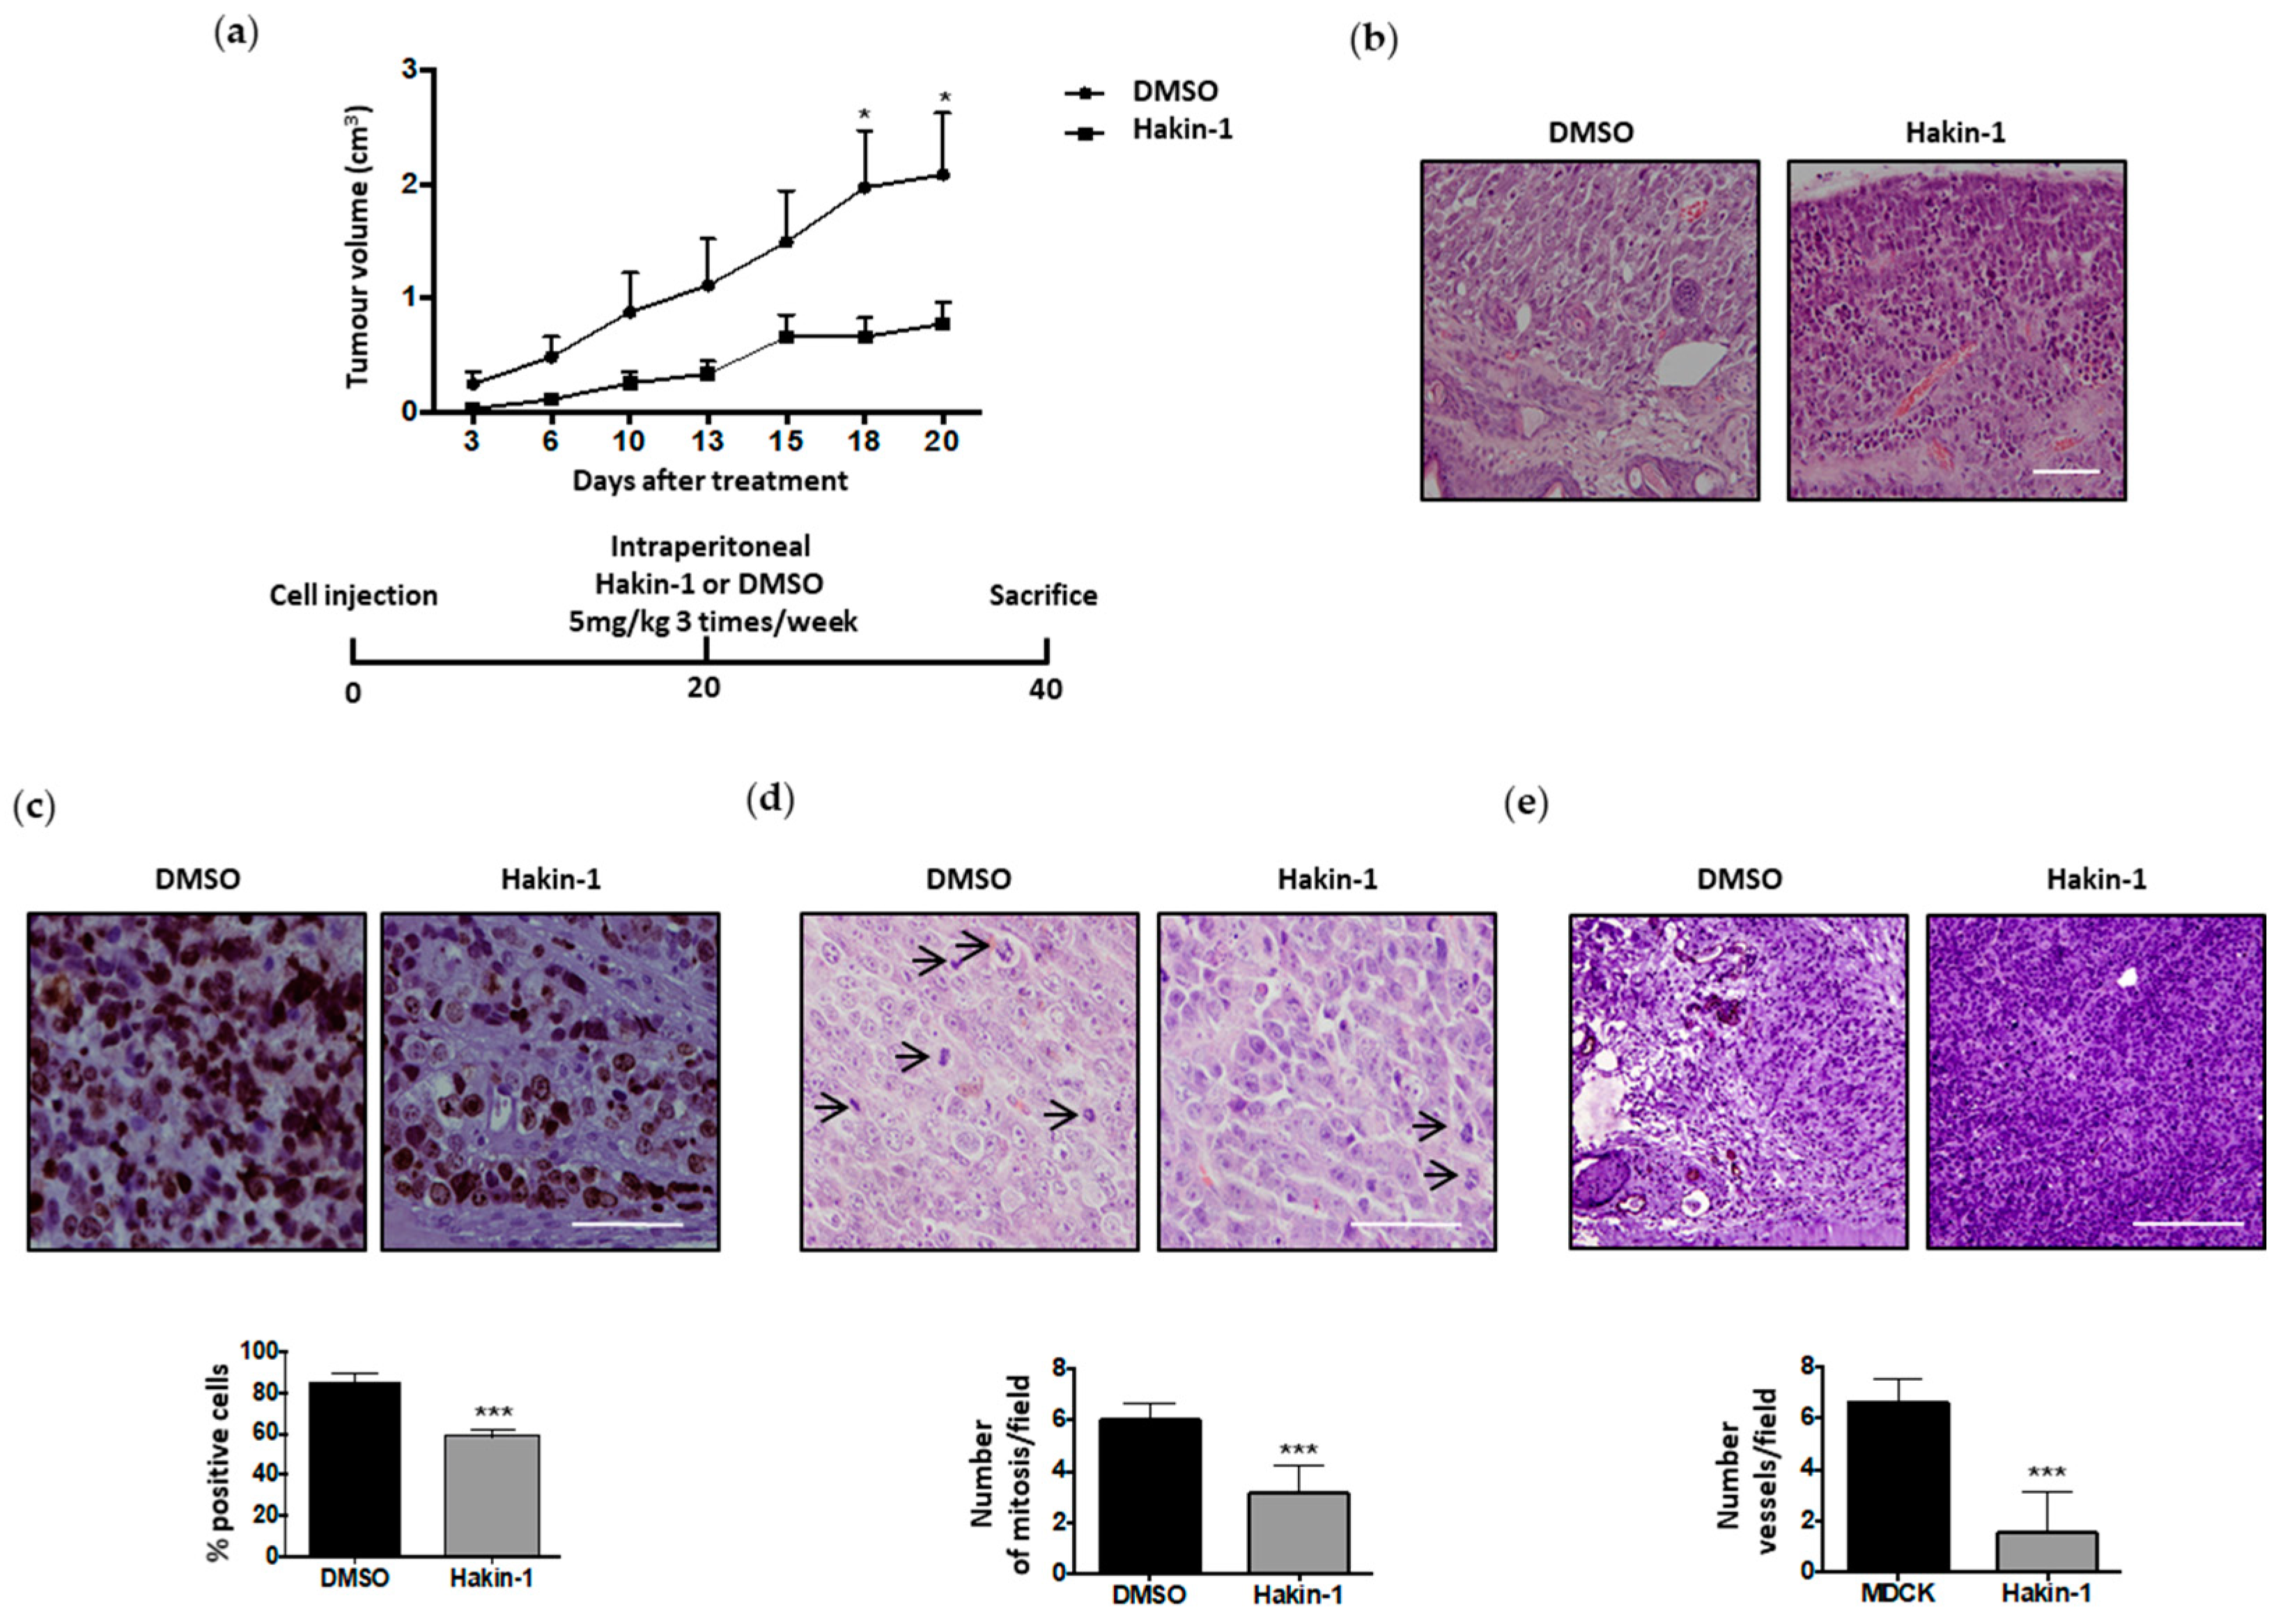
2.5. Antitumour Effect of Hakin-1 in Tumour Xenografts In Vivo
2.6. Hakin-1 Treatment Reduces N-Cadherin Mesenchymal Marker in Tumour Xenografts and Initiation of Lung Metastases
3. Discussion
4. Materials and Methods
4.1. Protein and Ligands Models
4.2. Virtual Screening
4.3. Binding Pocket Analysis
4.4. Plasmids, Inhibitors and Antibodies
4.5. Cell Culture
4.6. Ubiquitination Assays
4.7. Immunoprecipitation
4.8. Viability Assays
4.9. Western Blotting and Immunofluorescence
4.10. Real-Time Quantitative PCR (qRT-PCR)
4.11. Proliferation Assays
4.12. Soft Agar-Colony Formation Assay
4.13. Migration and Invasion Assay
4.14. Tumour Xenograft Model
4.15. Histology and Immunohistochemistry
4.16. Quantification of Lung Metastasis from In Vivo Mouse Model
4.17. Statistical Analysis
5. Conclusions
6. Patents
Supplementary Materials
Author Contributions
Funding
Acknowledgments
Conflicts of Interest
References
- Nieto, M.A. Epithelial plasticity: A common theme in embryonic and cancer cells. Science 2013, 342, 1234850. [Google Scholar] [CrossRef] [Green Version]
- Varga, J.; Greten, F.R. Cell plasticity in epithelial homeostasis and tumorigenesis. Nat. Cell Biol. 2017, 19, 1133–1141. [Google Scholar] [CrossRef]
- Pastushenko, I.; Blanpain, C. EMT transition states during tumor progression and metastasis. Trends Cell Biol. 2018. [Google Scholar] [CrossRef] [PubMed] [Green Version]
- Pastushenko, I.; Brisebarre, A.; Sifrim, A.; Fioramonti, M.; Revenco, T.; Boumahdi, S.; Van Keymeulen, A.; Brown, D.; Moers, V.; Lemaire, S.; et al. Identification of the tumour transition states occurring during EMT. Nature 2018, 556, 463–468. [Google Scholar] [CrossRef] [PubMed]
- Nieto, M.A.; Huang, R.Y.; Jackson, R.A.; Thiery, J.P. EMT: 2016. Cell 2016, 166, 21–45. [Google Scholar] [CrossRef] [PubMed] [Green Version]
- Aparicio, L.A.; Blanco, M.; Castosa, R.; Concha, Á.; Valladares, M.; Calvo, L.; Figueroa, A. Clinical implications of epithelial cell plasticity in cancer progression. Cancer Lett. 2015, 366, 1–10. [Google Scholar] [CrossRef] [PubMed]
- Perez-Moreno, M.; Jamora, C.; Fuchs, E. Sticky business: Orchestrating cellular signals at adherens junctions. Cell 2003, 112, 535–548. [Google Scholar] [CrossRef] [Green Version]
- Gumbiner, B.M. Regulation of cadherin-mediated adhesion in morphogenesis. Nat. Rev. Mol. Cell Biol. 2005, 6, 622–634. [Google Scholar] [CrossRef]
- Peinado, H.; Olmeda, D.; Cano, A. Snail, Zeb and bHLH factors in tumour progression: An alliance against the epithelial phenotype? Nat. Rev. Cancer 2007, 7, 415–428. [Google Scholar] [CrossRef]
- Peinado, H.; Portillo, F.; Cano, A. Transcriptional regulation of cadherins during development and carcinogenesis. Int. J. Dev. Biol. 2004, 48, 365–375. [Google Scholar] [CrossRef] [Green Version]
- Aparicio, L.A.; Abella, V.; Valladares, M.; Figueroa, A. Posttranscriptional regulation by RNA-binding proteins during epithelial-to-mesenchymal transition. Cell. Mol. Life Sci. 2013, 70, 4463–4477. [Google Scholar] [CrossRef] [PubMed] [Green Version]
- Fujita, Y.; Krause, G.; Scheffner, M.; Zechner, D.; Leddy, H.E.; Behrens, J.; Sommer, T.; Birchmeier, W. Hakai, a c-Cbl-like protein, ubiquitinates and induces endocytosis of the E-cadherin complex. Nat. Cell Biol. 2002, 4, 222–231. [Google Scholar] [CrossRef]
- Aparicio, L.A.; Valladares, M.; Blanco, M.; Alonso, G.; Figueroa, A. Biological influence of Hakai in cancer: A 10-year review. Cancer Metastasis Rev. 2012, 31, 375–386. [Google Scholar] [CrossRef] [PubMed] [Green Version]
- Hershko, A.; Ciechanover, A.; Varshavsky, A. Basic Medical Research Award. The ubiquitin system. Nat. Med. 2000, 6, 1073–1081. [Google Scholar] [CrossRef] [PubMed]
- Komander, D.; Rape, M. The ubiquitin code. Annu. Rev. Biochem. 2012, 81, 203–229. [Google Scholar] [CrossRef] [PubMed] [Green Version]
- Clague, M.J.; Urbé, S. Ubiquitin: Same molecule, different degradation pathways. Cell 2010, 143, 682–685. [Google Scholar] [CrossRef] [Green Version]
- Deshaies, R.J.; Joazeiro, C.A. RING domain E3 ubiquitin ligases. Annu. Rev. Biochem. 2009, 78, 399–434. [Google Scholar] [CrossRef]
- Schulman, B.A.; Harper, J.W. Ubiquitin-like protein activation by E1 enzymes: The apex for downstream signalling pathways. Nat. Rev. Mol. Cell Biol. 2009, 10, 319–331. [Google Scholar] [CrossRef] [Green Version]
- Buac, D.; Shen, M.; Schmitt, S.; Kona, F.R.; Deshmukh, R.; Zhang, Z.; Neslund-Dudas, C.; Mitra, B.; Dou, Q.P. From bortezomib to other inhibitors of the proteasome and beyond. Curr. Pharm. Des. 2013, 19, 4025–4038. [Google Scholar] [CrossRef] [Green Version]
- Micel, L.N.; Tentler, J.J.; Smith, P.G.; Eckhardt, G.S. Role of ubiquitin ligases and the proteasome in oncogenesis: Novel targets for anticancer therapies. J. Clin. Oncol. 2013, 31, 1231–1238. [Google Scholar] [CrossRef] [Green Version]
- Senft, D.; Qi, J.; Ronai, Z.A. Ubiquitin ligases in oncogenic transformation and cancer therapy. Nat. Rev. Cancer 2018, 18, 69–88. [Google Scholar] [CrossRef] [PubMed]
- Sun, Y. E3 ubiquitin ligases as cancer targets and biomarkers. Neoplasia 2006, 8, 645–654. [Google Scholar] [CrossRef] [PubMed] [Green Version]
- Qi, J.; Ronai, Z.A. Dysregulation of ubiquitin ligases in cancer. Drug Resist. Updat. 2015, 23, 1–11. [Google Scholar] [CrossRef] [PubMed] [Green Version]
- Huang, X.; Dixit, V.M. Drugging the undruggables: Exploring the ubiquitin system for drug development. Cell Res. 2016, 26, 484–498. [Google Scholar] [CrossRef]
- Mani, A.; Gelmann, E.P. The ubiquitin-proteasome pathway and its role in cancer. J. Clin. Oncol. 2005, 23, 4776–4789. [Google Scholar] [CrossRef] [PubMed]
- Morrow, J.K.; Lin, H.K.; Sun, S.C.; Zhang, S. Targeting ubiquitination for cancer therapies. Future Med. Chem. 2015, 7, 2333–2350. [Google Scholar] [CrossRef] [PubMed] [Green Version]
- Richardson, P.G.; Barlogie, B.; Berenson, J.; Singhal, S.; Jagannath, S.; Irwin, D.; Rajkumar, S.V.; Srkalovic, G.; Alsina, M.; Alexanian, R.; et al. A phase 2 study of bortezomib in relapsed, refractory myeloma. N. Engl. J. Med. 2003, 348, 2609–2617. [Google Scholar] [CrossRef] [Green Version]
- Gandolfi, S.; Laubach, J.P.; Hideshima, T.; Chauhan, D.; Anderson, K.C.; Richardson, P.G. The proteasome and proteasome inhibitors in multiple myeloma. Cancer Metastasis Rev. 2017, 36, 561–584. [Google Scholar] [CrossRef]
- Khan, M.L.; Stewart, A.K. Carfilzomib: A novel second-generation proteasome inhibitor. Future Oncol. 2011, 7, 607–612. [Google Scholar] [CrossRef] [Green Version]
- Kumar, S.K.; Bensinger, W.I.; Zimmerman, T.M.; Reeder, C.B.; Berenson, J.R.; Berg, D.; Hui, A.M.; Gupta, N.; Di Bacco, A.; Yu, J.; et al. Phase 1 study of weekly dosing with the investigational oral proteasome inhibitor ixazomib in relapsed/refractory multiple myeloma. Blood 2014, 124, 1047–1055. [Google Scholar] [CrossRef]
- Aghajanian, C.; Blessing, J.A.; Darcy, K.M.; Reid, G.; DeGeest, K.; Rubin, S.C.; Mannel, R.S.; Rotmensch, J.; Schilder, R.J.; Riordan, W.; et al. A phase II evaluation of bortezomib in the treatment of recurrent platinum-sensitive ovarian or primary peritoneal cancer: A Gynecologic Oncology Group study. Gynecol. Oncol. 2009, 115, 215–220. [Google Scholar] [CrossRef] [PubMed]
- Rosenberg, J.E.; Halabi, S.; Sanford, B.L.; Himelstein, A.L.; Atkins, J.N.; Hohl, R.J.; Millard, F.; Bajorin, D.F.; Small, E.J.; Cancer and Leukemia Group, B. Phase II study of bortezomib in patients with previously treated advanced urothelial tract transitional cell carcinoma: CALGB 90207. Ann. Oncol. 2008, 19, 946–950. [Google Scholar] [CrossRef] [PubMed]
- Swaminathan, G.; Cartwright, C.A. Rack1 promotes epithelial cell-cell adhesion by regulating E-cadherin endocytosis. Oncogene 2012, 31, 376–389. [Google Scholar] [CrossRef] [PubMed] [Green Version]
- Zhou, W.J.; Geng, Z.H.; Chi, S.; Zhang, W.; Niu, X.F.; Lan, S.J.; Ma, L.; Yang, X.; Wang, L.J.; Ding, Y.Q.; et al. Slit-Robo signaling induces malignant transformation through Hakai-mediated E-cadherin degradation during colorectal epithelial cell carcinogenesis. Cell Res. 2011, 21, 609–626. [Google Scholar] [CrossRef] [Green Version]
- Mukherjee, M.; Chow, S.Y.; Yusoff, P.; Seetharaman, J.; Ng, C.; Sinniah, S.; Koh, X.W.; Asgar, N.F.; Li, D.; Yim, D.; et al. Structure of a novel phosphotyrosine-binding domain in Hakai that targets E-cadherin. EMBO J. 2012, 7, 1308–1319. [Google Scholar] [CrossRef]
- Weng, C.H.; Chen, L.Y.; Lin, Y.C.; Shih, J.Y.; Lin, Y.C.; Tseng, R.Y.; Chiu, A.C.; Yeh, Y.H.; Liu, C.; Lin, Y.T.; et al. Epithelial-mesenchymal transition (EMT) beyond EGFR mutations per se is a common mechanism for acquired resistance to EGFR TKI. Oncogene 2019, 38, 455–468. [Google Scholar] [CrossRef]
- Figueroa, A.; Fujita, Y.; Gorospe, M. Hacking RNA: Hakai promotes tumorigenesis by enhancing the RNA-binding function of PSF. Cell Cycle 2009, 8, 3648–3651. [Google Scholar] [CrossRef] [Green Version]
- Figueroa, A.; Kotani, H.; Toda, Y.; Mazan-Mamczarz, K.; Mueller, E.C.; Otto, A.; Disch, L.; Norman, M.; Ramdasi, R.M.; Keshtgar, M.; et al. Novel roles of hakai in cell proliferation and oncogenesis. Mol. Biol. Cell 2009, 20, 3533–3542. [Google Scholar] [CrossRef] [Green Version]
- Abella, V.; Valladares, M.; Rodriguez, T.; Haz, M.; Blanco, M.; Tarrío, N.; Iglesias, P.; Aparicio, L.A.; Figueroa, A. miR-203 regulates cell proliferation through its influence on hakai expression. PLoS ONE 2012, 7, e52568. [Google Scholar] [CrossRef] [Green Version]
- Rodríguez-Rigueiro, T.; Valladares-Ayerbes, M.; Haz-Conde, M.; Aparicio, L.A.; Figueroa, A. Hakai reduces cell-substratum adhesion and increases epithelial cell invasion. BMC Cancer 2011, 11, 474. [Google Scholar] [CrossRef] [Green Version]
- Castosa, R.; Martinez-Iglesias, O.; Roca-Lema, D.; Casas-Pais, A.; Díaz-Díaz, A.; Iglesias, P.; Santamarina, I.; Graña, B.; Calvo, L.; Valladares-Ayerbes, M.; et al. Hakai overexpression effectively induces tumour progression and metastasis in vivo. Sci. Rep. 2018, 8, 3466. [Google Scholar] [CrossRef] [PubMed] [Green Version]
- Díaz-Díaz, A.; Casas-Pais, A.; Calamia, V.; Castosa, R.; Martinez-Iglesias, O.; Roca-Lema, D.; Santamarina, I.; Valladares-Ayerbes, M.; Calvo, L.; Chantada, V.; et al. Proteomic Analysis of the E3 Ubiquitin-Ligase Hakai Highlights a Role in Plasticity of the Cytoskeleton Dynamics and in the Proteasome System. J. Proteome Res. 2017, 16, 2773–2788. [Google Scholar] [CrossRef] [PubMed]
- Díaz-Díaz, A.; Roca-Lema, D.; Casas-Pais, A.; Romay, G.; Colombo, G.; Concha, Á.; Graña, B.; Figueroa, A. Heat Shock Protein 90 Chaperone Regulates the E3 Ubiquitin-Ligase Hakai Protein Stability. Cancers 2020, 12, 215. [Google Scholar] [CrossRef] [PubMed] [Green Version]
- Liu, M.; Jiang, K.; Lin, G.; Liu, P.; Yan, Y.; Ye, T.; Yao, G.; Barr, M.P.; Liang, D.; Wang, Y.; et al. Ajuba inhibits hepatocellular carcinoma cell growth via targeting of β-catenin and YAP signaling and is regulated by E3 ligase Hakai through neddylation. J. Exp. Clin. Cancer Res. 2018, 37, 165. [Google Scholar] [CrossRef]
- Mukherjee, M.; Jing-Song, F.; Ramachandran, S.; Guy, G.R.; Sivaraman, J. Dimeric switch of Hakai-truncated monomers during substrate recognition: Insights from solution studies and NMR structure. J. Biol. Chem. 2014, 289, 25611–25623. [Google Scholar] [CrossRef] [Green Version]
- Cooper, J.A.; Kaneko, T.; Li, S.S. Cell regulation by phosphotyrosine-targeted ubiquitin ligases. Mol. Cell Biol. 2015, 35, 1886–1897. [Google Scholar] [CrossRef] [Green Version]
- Marcucci, F.; Stassi, G.; De Maria, R. Epithelial-mesenchymal transition: A new target in anticancer drug discovery. Nat. Rev. Drug Discov. 2016, 15, 311–325. [Google Scholar] [CrossRef]
- Tang, M.; Yue, P.; Ip, P.P.; Huang, R.L.; Lai, H.C.; Cheung, A.; Tse, K.Y.; Ngan, H.; Wong, A. Soluble E-cadherin promotes tumor angiogenesis and localizes to exosome surface. Nat. Commun. 2018, 9, 2270. [Google Scholar] [CrossRef]
- Janda, E.; Nevolo, M.; Lehmann, K.; Downward, J.; Beug, H.; Grieco, M. Raf plus TGFbeta-dependent EMT is initiated by endocytosis and lysosomal degradation of E-cadherin. Oncogene 2006, 25, 7117–7130. [Google Scholar] [CrossRef] [Green Version]
- Yang, J.; Antin, P.; Berx, G.; Blanpain, C.; Brabletz, T.; Bronner, M.; Campbell, K.; Cano, A.; Casanova, J.; Christofori, G.; et al. Guidelines and definitions for research on epithelial-mesenchymal transition. Nat. Rev. Mol. Cell Biol. 2020. [Google Scholar] [CrossRef] [Green Version]
- Díaz, V.M.; de Herreros, A.G. F-box proteins: Keeping the epithelial-to-mesenchymal transition (EMT) in check. Semin. Cancer Biol. 2016, 36, 71–79. [Google Scholar] [CrossRef] [PubMed]
- Wu, Y.; Wang, Y.; Lin, Y.; Liu, Y.; Wang, Y.; Jia, J.; Singh, P.; Chi, Y.I.; Wang, C.; Dong, C.; et al. Dub3 inhibition suppresses breast cancer invasion and metastasis by promoting Snail1 degradation. Nat. Commun. 2017, 8, 14228. [Google Scholar] [CrossRef] [PubMed] [Green Version]
- Yang, J.Y.; Zong, C.S.; Xia, W.; Wei, Y.; Ali-Seyed, M.; Li, Z.; Broglio, K.; Berry, D.A.; Hung, M.C. MDM2 promotes cell motility and invasiveness by regulating E-cadherin degradation. Mol. Cell Biol. 2006, 26, 7269–7282. [Google Scholar] [CrossRef] [PubMed] [Green Version]
- Landré, V.; Rotblat, B.; Melino, S.; Bernassola, F.; Melino, G. Screening for E3-ubiquitin ligase inhibitors: Challenges and opportunities. Oncotarget 2014, 5, 7988–8013. [Google Scholar] [CrossRef] [PubMed] [Green Version]
- Vassilev, L.T.; Vu, B.T.; Graves, B.; Carvajal, D.; Podlaski, F.; Filipovic, Z.; Kong, N.; Kammlott, U.; Lukacs, C.; Klein, C.; et al. In vivo activation of the p53 pathway by small-molecule antagonists of MDM2. Science 2004, 303, 844–848. [Google Scholar] [CrossRef] [Green Version]
- Weathington, N.M.; Mallampalli, R.K. Emerging therapies targeting the ubiquitin proteasome system in cancer. J. Clin. Investig. 2014, 124, 6–12. [Google Scholar] [CrossRef] [Green Version]
- Wu, Y.; Fu, Y.; Zheng, L.; Lin, G.; Ma, J.; Lou, J.; Zhu, H.; He, Q.; Yang, B. Nutlin-3 inhibits epithelial-mesenchymal transition by interfering with canonical transforming growth factor-β1-Smad-Snail/Slug axis. Cancer Lett. 2014, 342, 82–91. [Google Scholar] [CrossRef]
- Turbin, D.A.; Cheang, M.C.; Bajdik, C.D.; Gelmon, K.A.; Yorida, E.; De Luca, A.; Nielsen, T.O.; Huntsman, D.G.; Gilks, C.B. MDM2 protein expression is a negative prognostic marker in breast carcinoma. Mod. Pathol. 2006, 19, 69–74. [Google Scholar] [CrossRef] [Green Version]
- Mackay, H.; Hedley, D.; Major, P.; Townsley, C.; Mackenzie, M.; Vincent, M.; Degendorfer, P.; Tsao, M.S.; Nicklee, T.; Birle, D.; et al. A phase II trial with pharmacodynamic endpoints of the proteasome inhibitor bortezomib in patients with metastatic colorectal cancer. Clin. Cancer Res. 2005, 11, 5526–5533. [Google Scholar] [CrossRef] [Green Version]
- Banno, A.; Garcia, D.A.; van Baarsel, E.D.; Metz, P.J.; Fisch, K.; Widjaja, C.E.; Kim, S.H.; Lopez, J.; Chang, A.N.; Geurink, P.P.; et al. Downregulation of 26S proteasome catalytic activity promotes epithelial-mesenchymal transition. Oncotarget 2016, 7, 21527–21541. [Google Scholar] [CrossRef] [Green Version]
- Santamaria, P.G.; Moreno-Bueno, G.; Portillo, F.; Cano, A. EMT: Present and future in clinical oncology. Mol. Oncol. 2017, 11, 718–738. [Google Scholar] [CrossRef] [PubMed] [Green Version]
- Dolinsky, T.J.; Nielsen, J.E.; McCammon, J.A.; Baker, N.A. PDB2PQR: An automated pipeline for the setup of Poisson-Boltzmann electrostatics calculations. Nucleic Acids Res. 2004, 32, W665–W667. [Google Scholar] [CrossRef] [PubMed]
- Gil-Redondo, R.; Estrada, J.; Morreale, A.; Herranz, F.; Sancho, J.; Ortiz, A.R. VSDMIP: Virtual screening data management on an integrated platform. J. Comput. Aided Mol. Des. 2009, 23, 171–184. [Google Scholar] [CrossRef] [PubMed]
- Cabrera, Á.; Gil-Redondo, R.; Perona, A.; Gago, F.; Morreale, A. VSDMIP 1.5: An automated structure- and ligand-based virtual screening platform with a PyMOL graphical user interface. J. Comput. Aided Mol. Des. 2011, 25, 813–824. [Google Scholar] [CrossRef]
- Klett, J.; Cortés-Cabrera, Á.; Gil-Redondo, R.; Gago, F.; Morreale, A. ALFA: Automatic ligand flexibility assignment. J. Chem. Inf. Model. 2014, 54, 314–323. [Google Scholar] [CrossRef]
- Cortés Cabrera, Á.; Klett, J.; Dos Santos, H.G.; Perona, A.; Gil-Redondo, R.; Francis, S.M.; Priego, E.M.; Gago, F.; Morreale, A. CRDOCK: An ultrafast multipurpose protein-ligand docking tool. J. Chem. Inf. Model. 2012, 52, 2300–2309. [Google Scholar] [CrossRef]
- Schneider, N.; Lange, G.; Hindle, S.; Klein, R.; Rarey, M. A consistent description of HYdrogen bond and DEhydration energies in protein-ligand complexes: Methods behind the HYDE scoring function. J. Comput. Aided Mol. Des. 2013, 27, 15–29. [Google Scholar] [CrossRef]
- Rodríguez-Rigueiro, T.; Valladares-Ayerbes, M.; Haz-Conde, M.; Blanco, M.; Aparicio, G.; Fernández-Puente, P.; Blanco, F.J.; Lorenzo, M.J.; Aparicio, L.A.; Figueroa, A. A novel procedure for protein extraction from formalin-fixed paraffin-embedded tissues. Proteomics 2011, 11, 2555–2559. [Google Scholar] [CrossRef] [Green Version]
- Fujiki, Y.; Tao, K.; Bianchi, D.W.; Giel-Moloney, M.; Leiter, A.B.; Johnson, K.L. Quantification of green fluorescent protein by in vivo imaging, PCR, and flow cytometry: Comparison of transgenic strains and relevance for fetal cell microchimerism. Cytometry 2008, 73, 11–118. [Google Scholar] [CrossRef] [Green Version]
- Lin, J.; Kennedy, S.H.; Svarovsky, T.; Rogers, J.; Kemnitz, J.W.; Xu, A.; Zondervan, K.T. High-quality genomic DNA extraction from formalin-fixed and paraffin-embedded samples deparaffinized using mineral oil. Anal. Biochem. 2009, 395, 265–267. [Google Scholar] [CrossRef] [Green Version]


© 2020 by the authors. Licensee MDPI, Basel, Switzerland. This article is an open access article distributed under the terms and conditions of the Creative Commons Attribution (CC BY) license (http://creativecommons.org/licenses/by/4.0/).
Share and Cite
Martinez-Iglesias, O.; Casas-Pais, A.; Castosa, R.; Díaz-Díaz, A.; Roca-Lema, D.; Concha, Á.; Cortés, Á.; Gago, F.; Figueroa, A. Hakin-1, a New Specific Small-Molecule Inhibitor for the E3 Ubiquitin-Ligase Hakai, Inhibits Carcinoma Growth and Progression. Cancers 2020, 12, 1340. https://0-doi-org.brum.beds.ac.uk/10.3390/cancers12051340
Martinez-Iglesias O, Casas-Pais A, Castosa R, Díaz-Díaz A, Roca-Lema D, Concha Á, Cortés Á, Gago F, Figueroa A. Hakin-1, a New Specific Small-Molecule Inhibitor for the E3 Ubiquitin-Ligase Hakai, Inhibits Carcinoma Growth and Progression. Cancers. 2020; 12(5):1340. https://0-doi-org.brum.beds.ac.uk/10.3390/cancers12051340
Chicago/Turabian StyleMartinez-Iglesias, Olaia, Alba Casas-Pais, Raquel Castosa, Andrea Díaz-Díaz, Daniel Roca-Lema, Ángel Concha, Álvaro Cortés, Federico Gago, and Angélica Figueroa. 2020. "Hakin-1, a New Specific Small-Molecule Inhibitor for the E3 Ubiquitin-Ligase Hakai, Inhibits Carcinoma Growth and Progression" Cancers 12, no. 5: 1340. https://0-doi-org.brum.beds.ac.uk/10.3390/cancers12051340