Tracing Nutrient Flux Following Monocarboxylate Transporter-1 Inhibition with AZD3965

 , , and
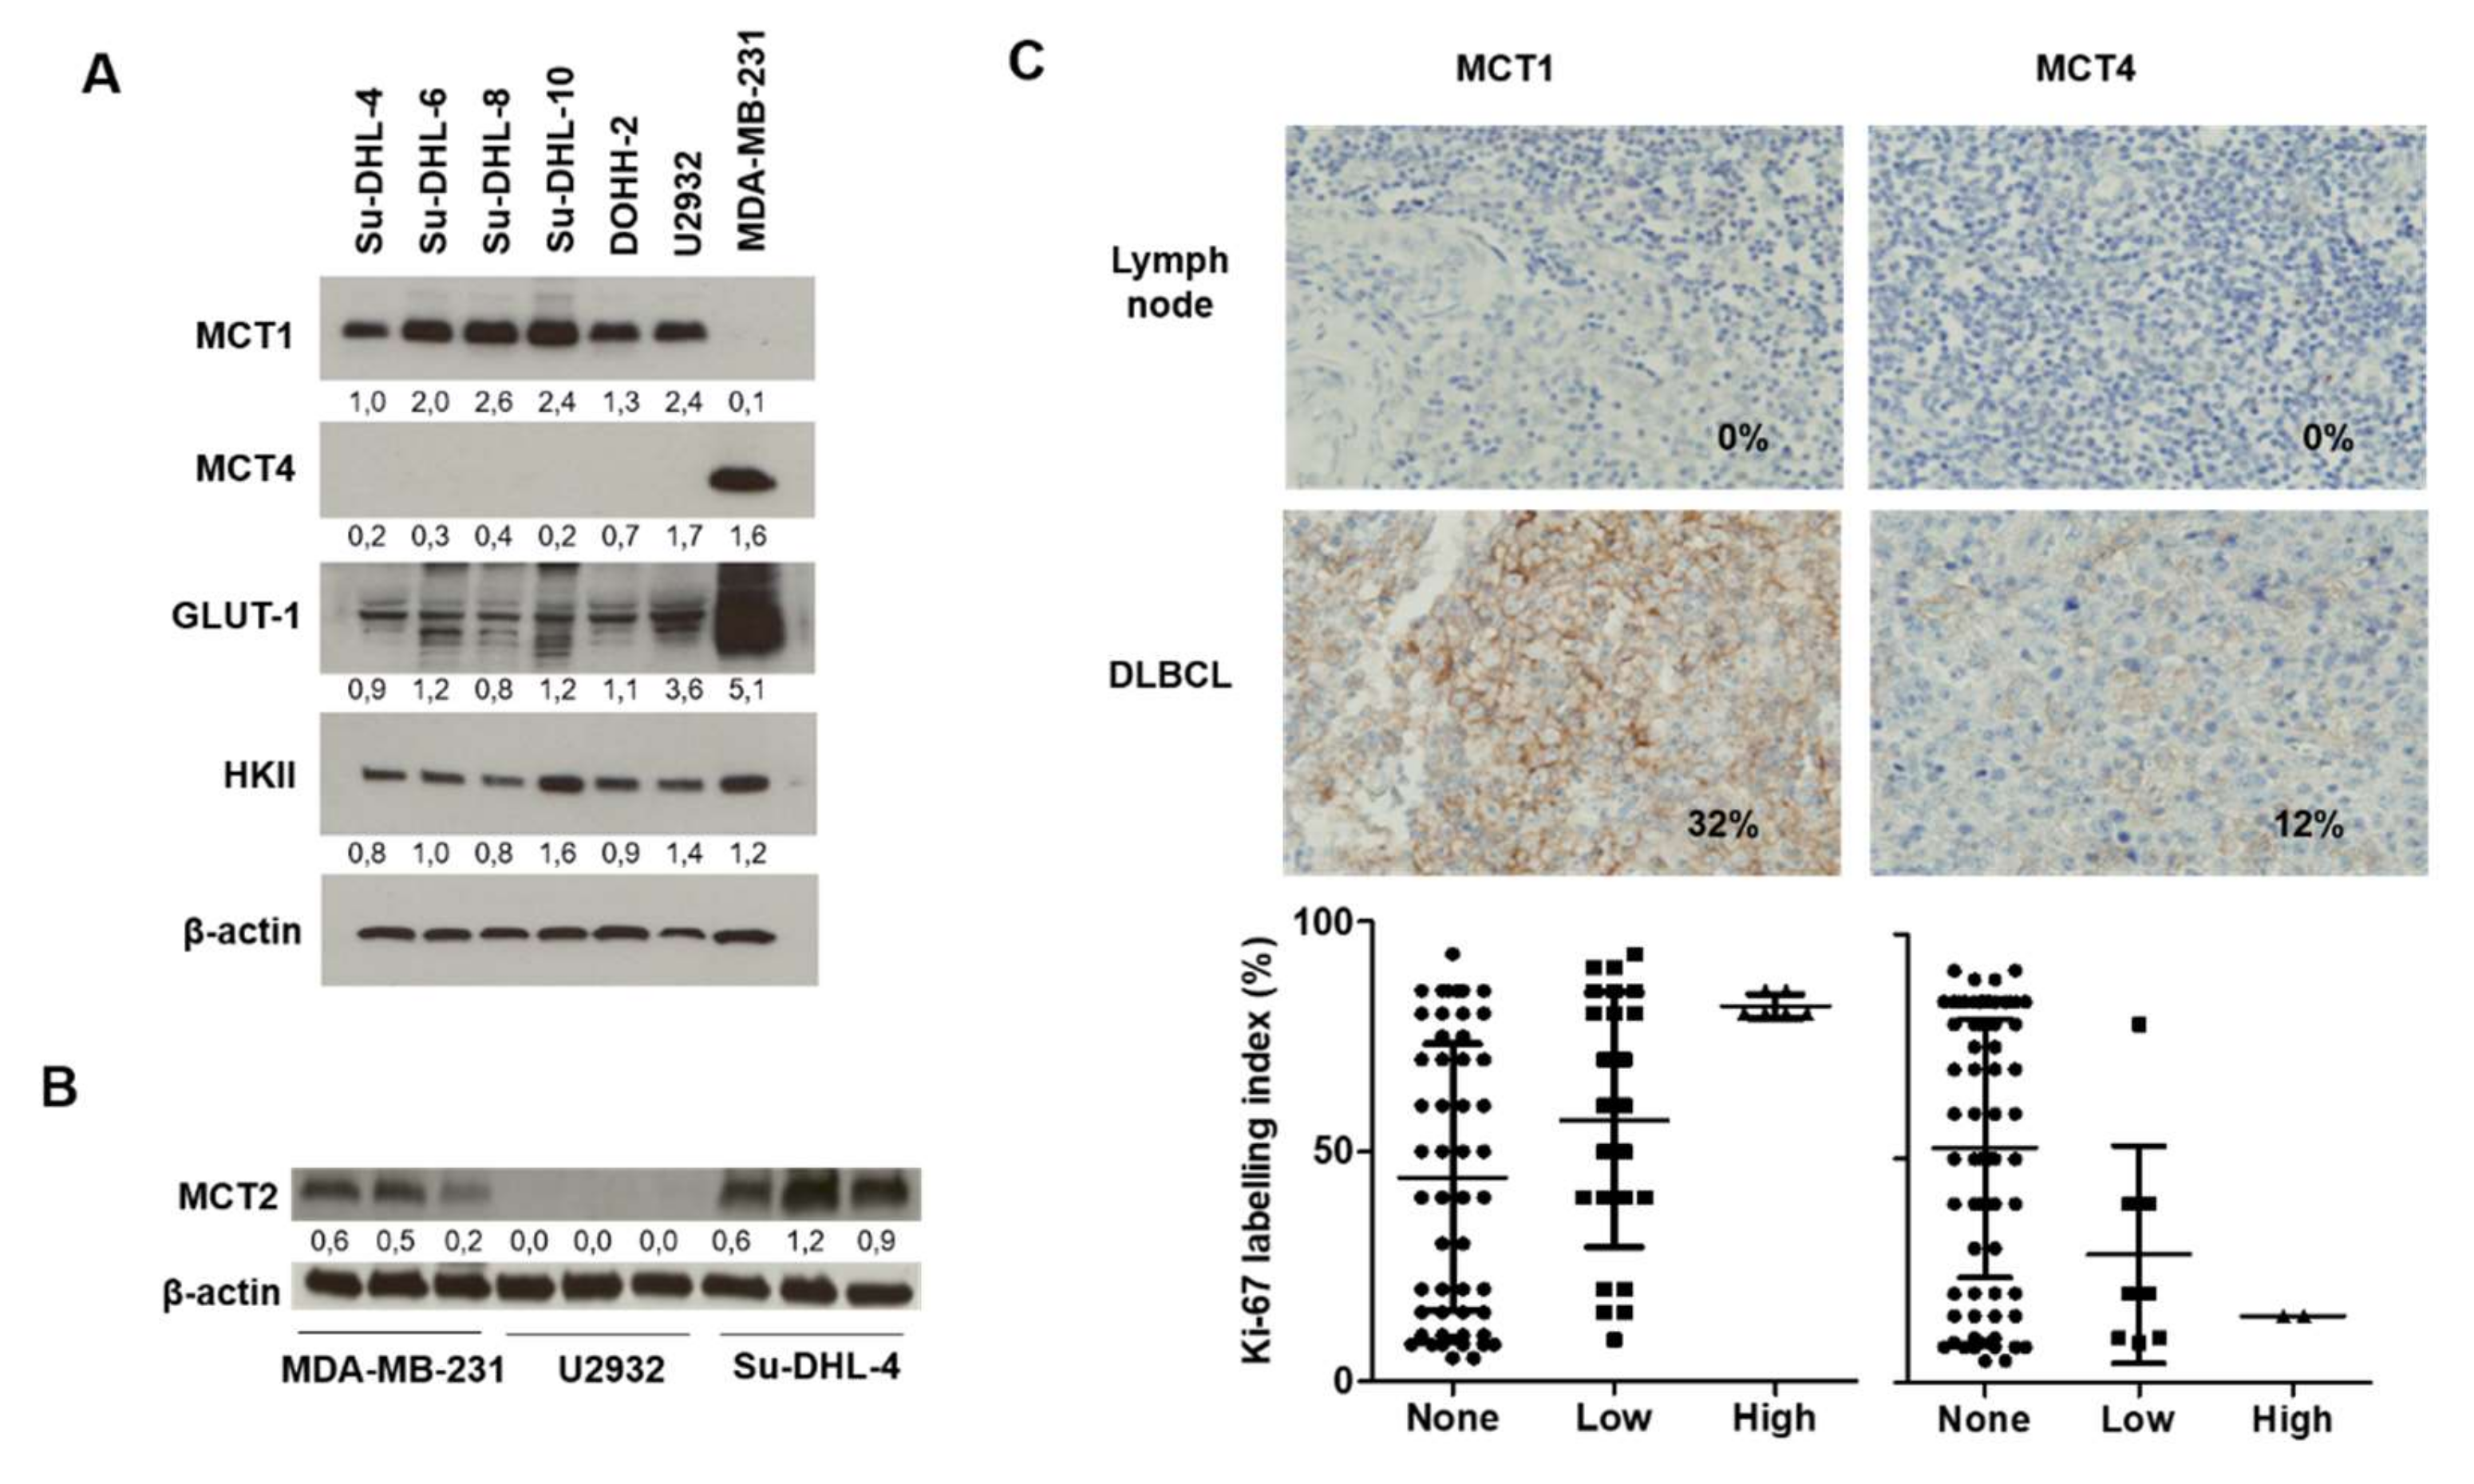
Abstract
:1. Introduction
2. Results
2.1. Relevance of DLBCL as a Model for MCT1 Inhibition
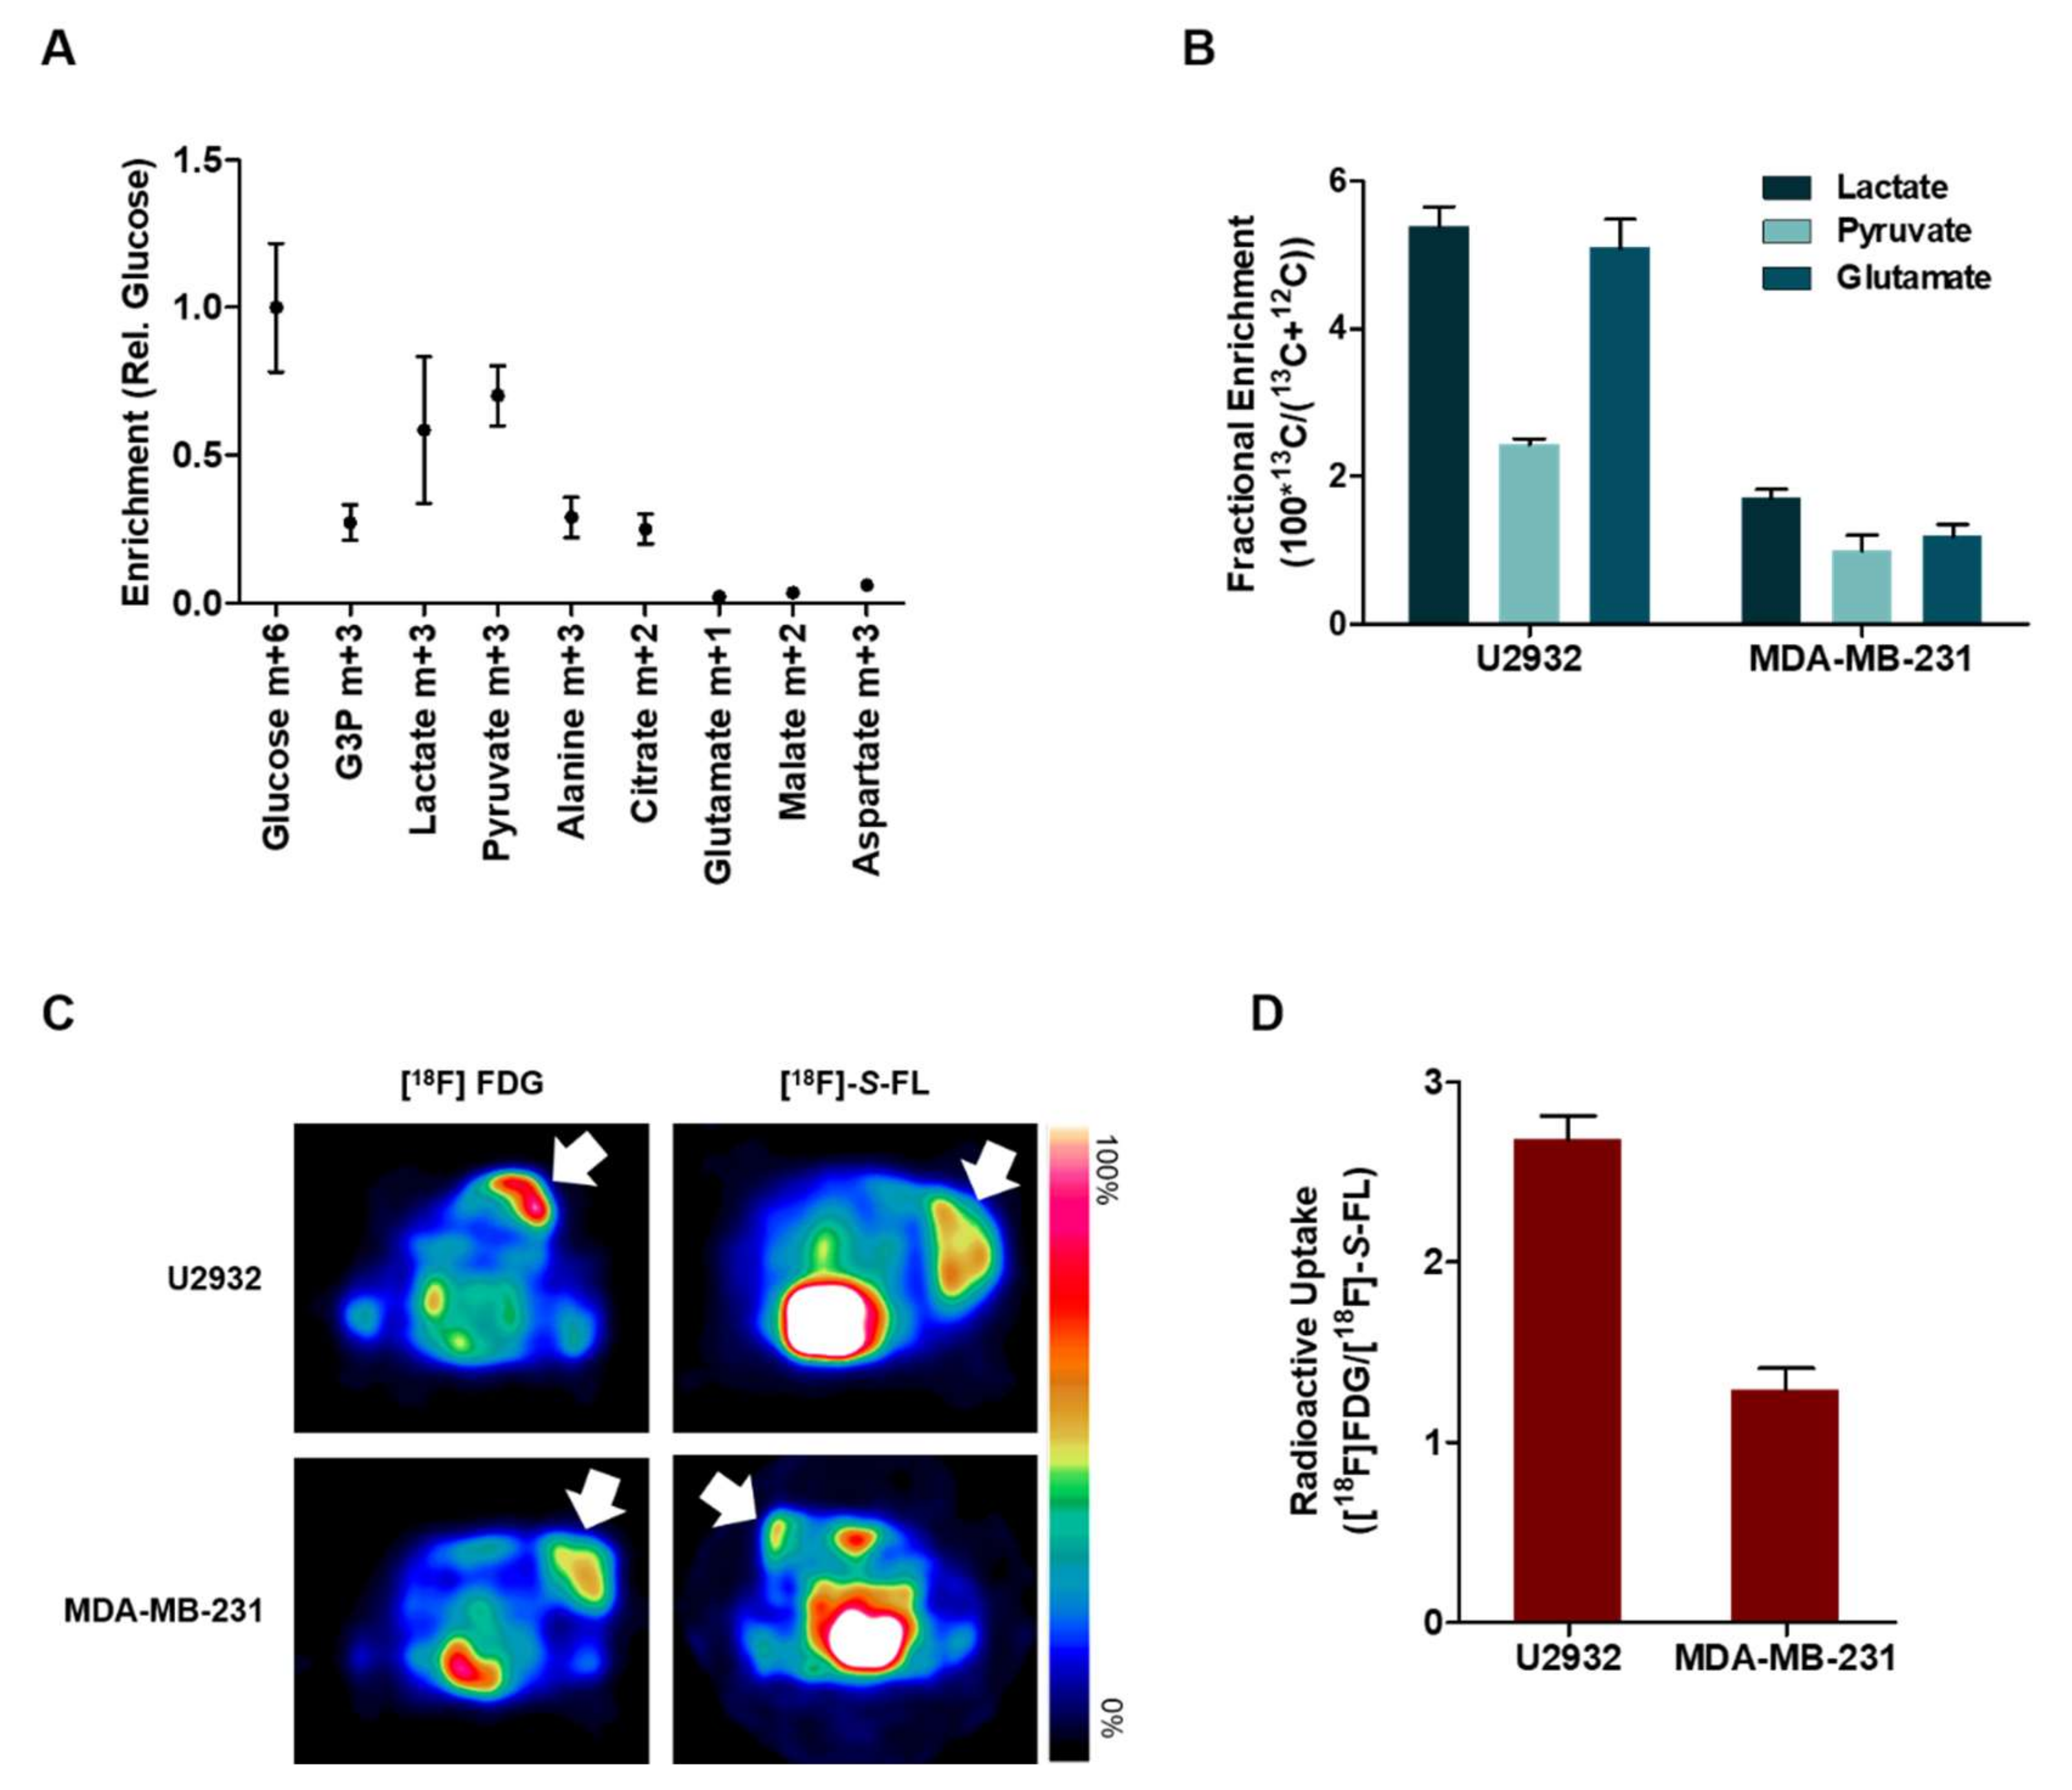
2.2. DLBCL Tumor Models Use Predominantly Glucose In Vitro
2.3. Lactate and Glucose are Used as Metabolic Fuels in DLBCL Xenografts
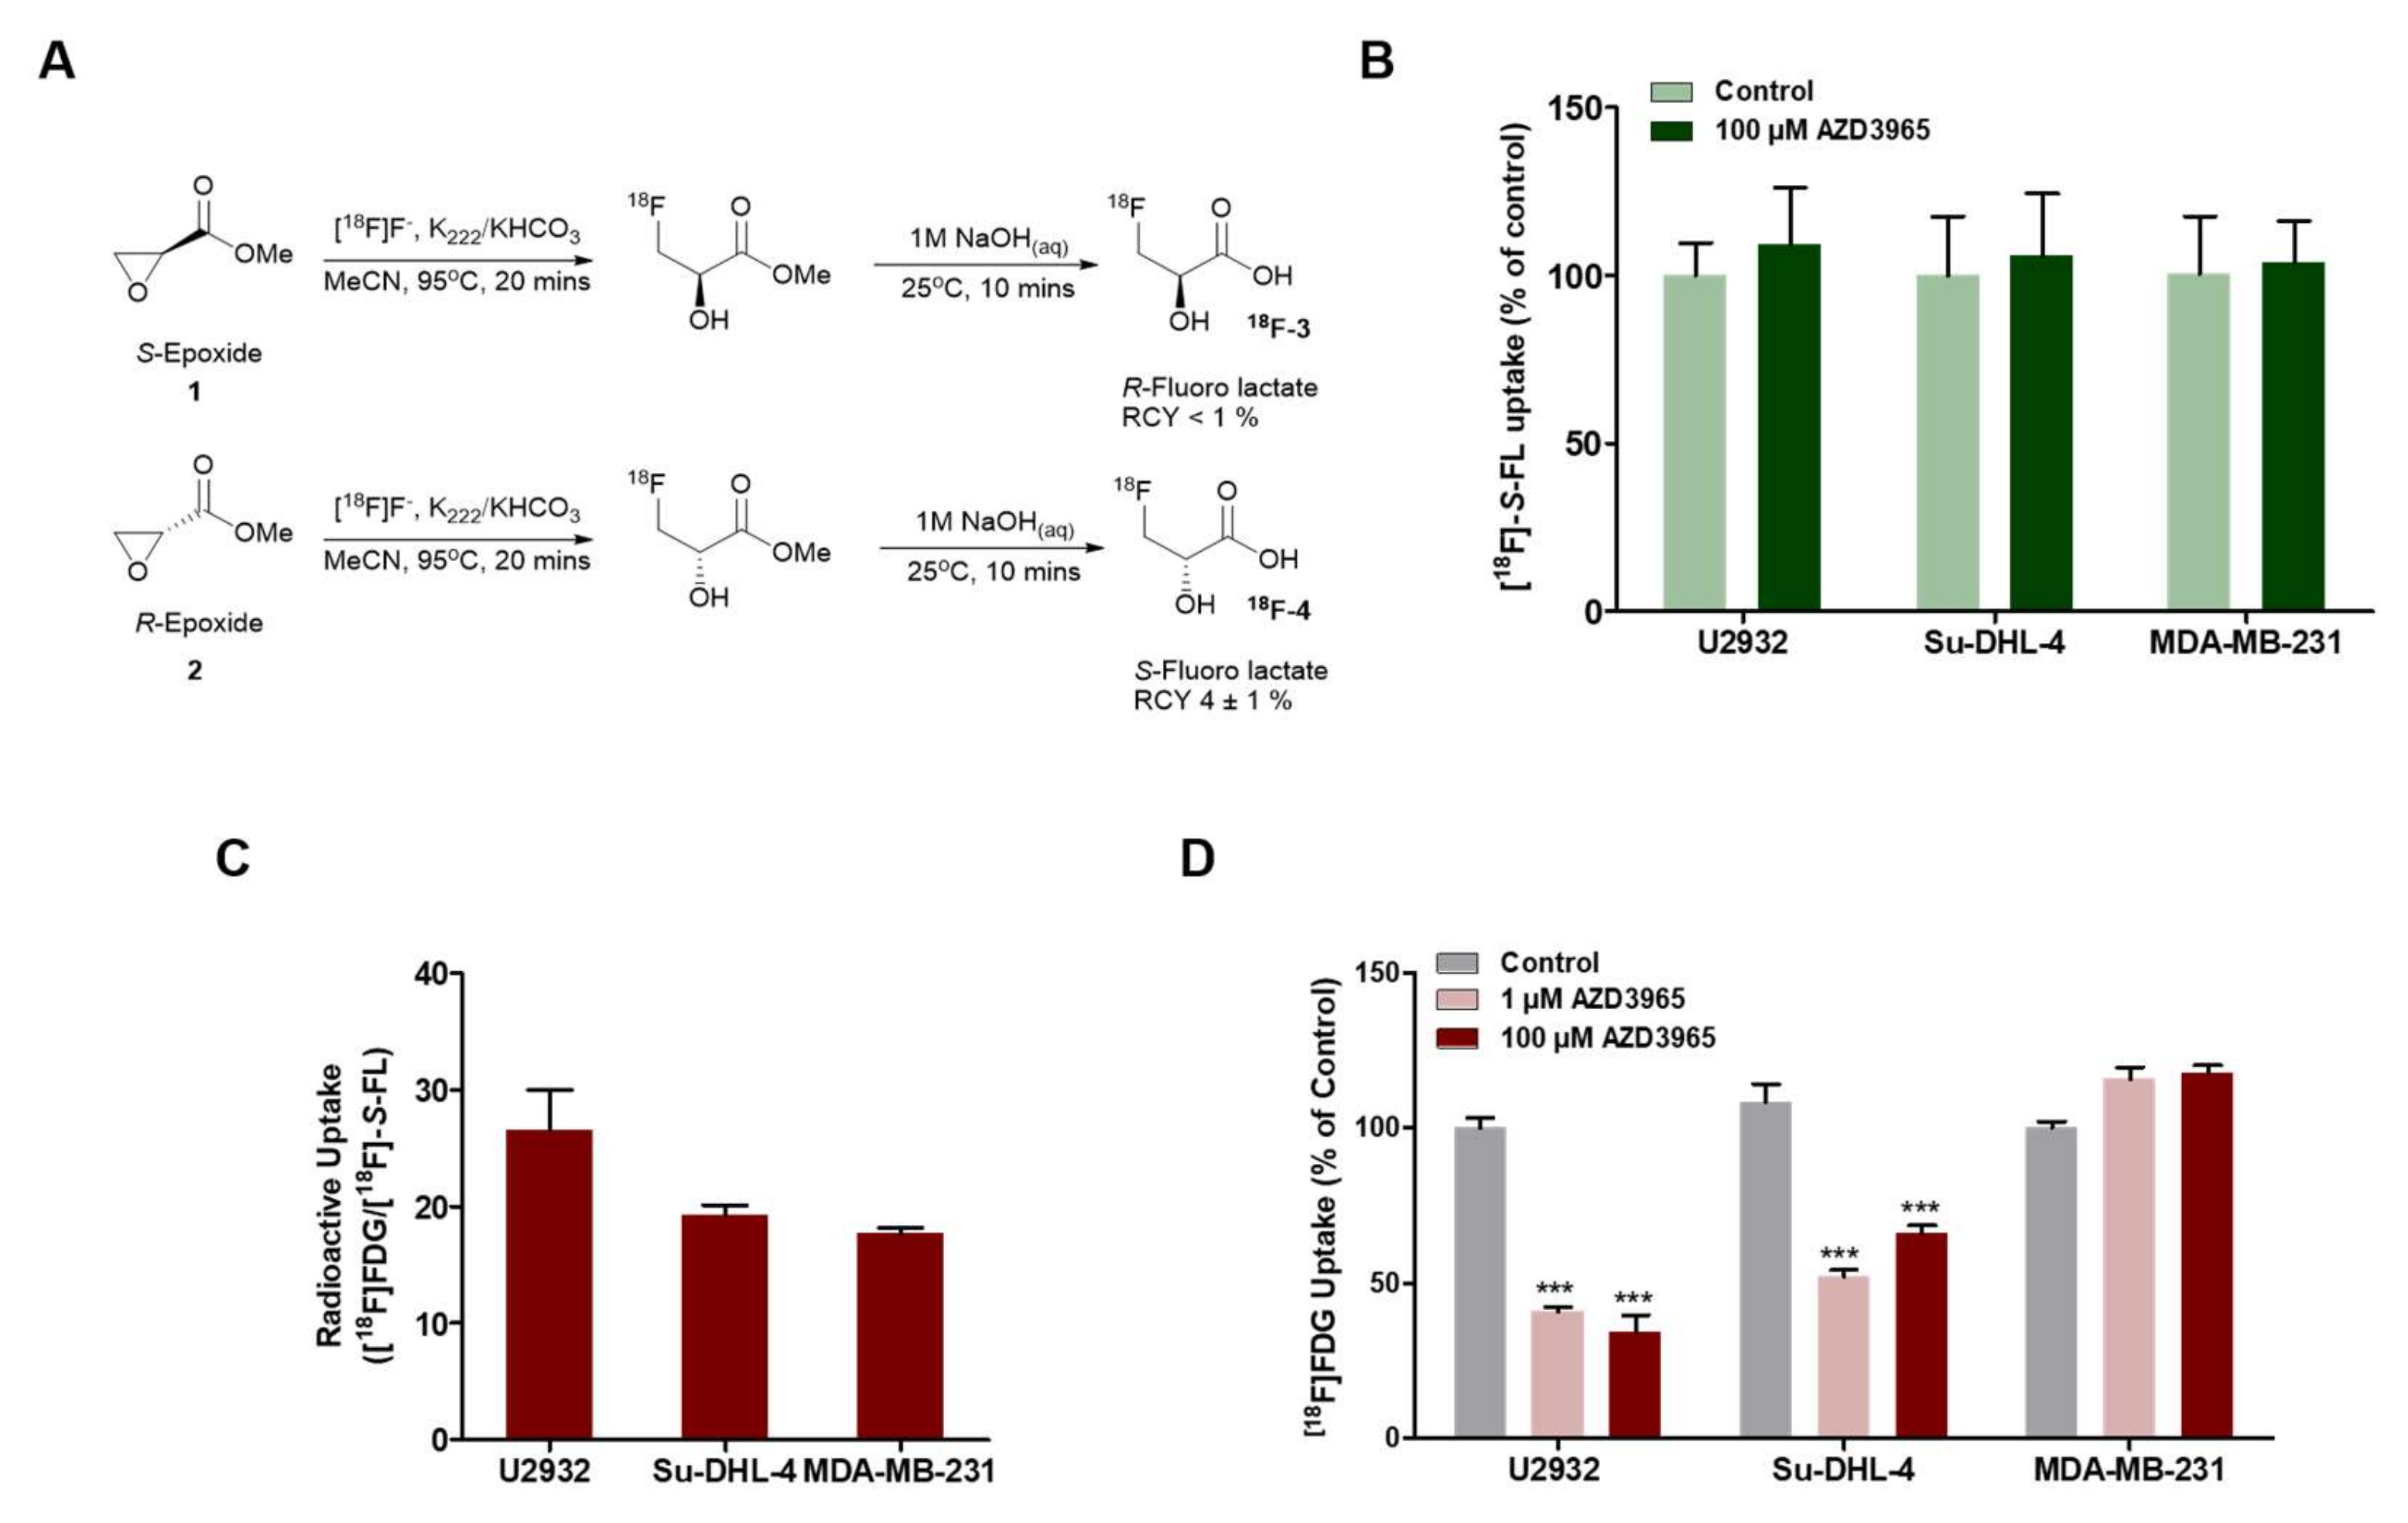
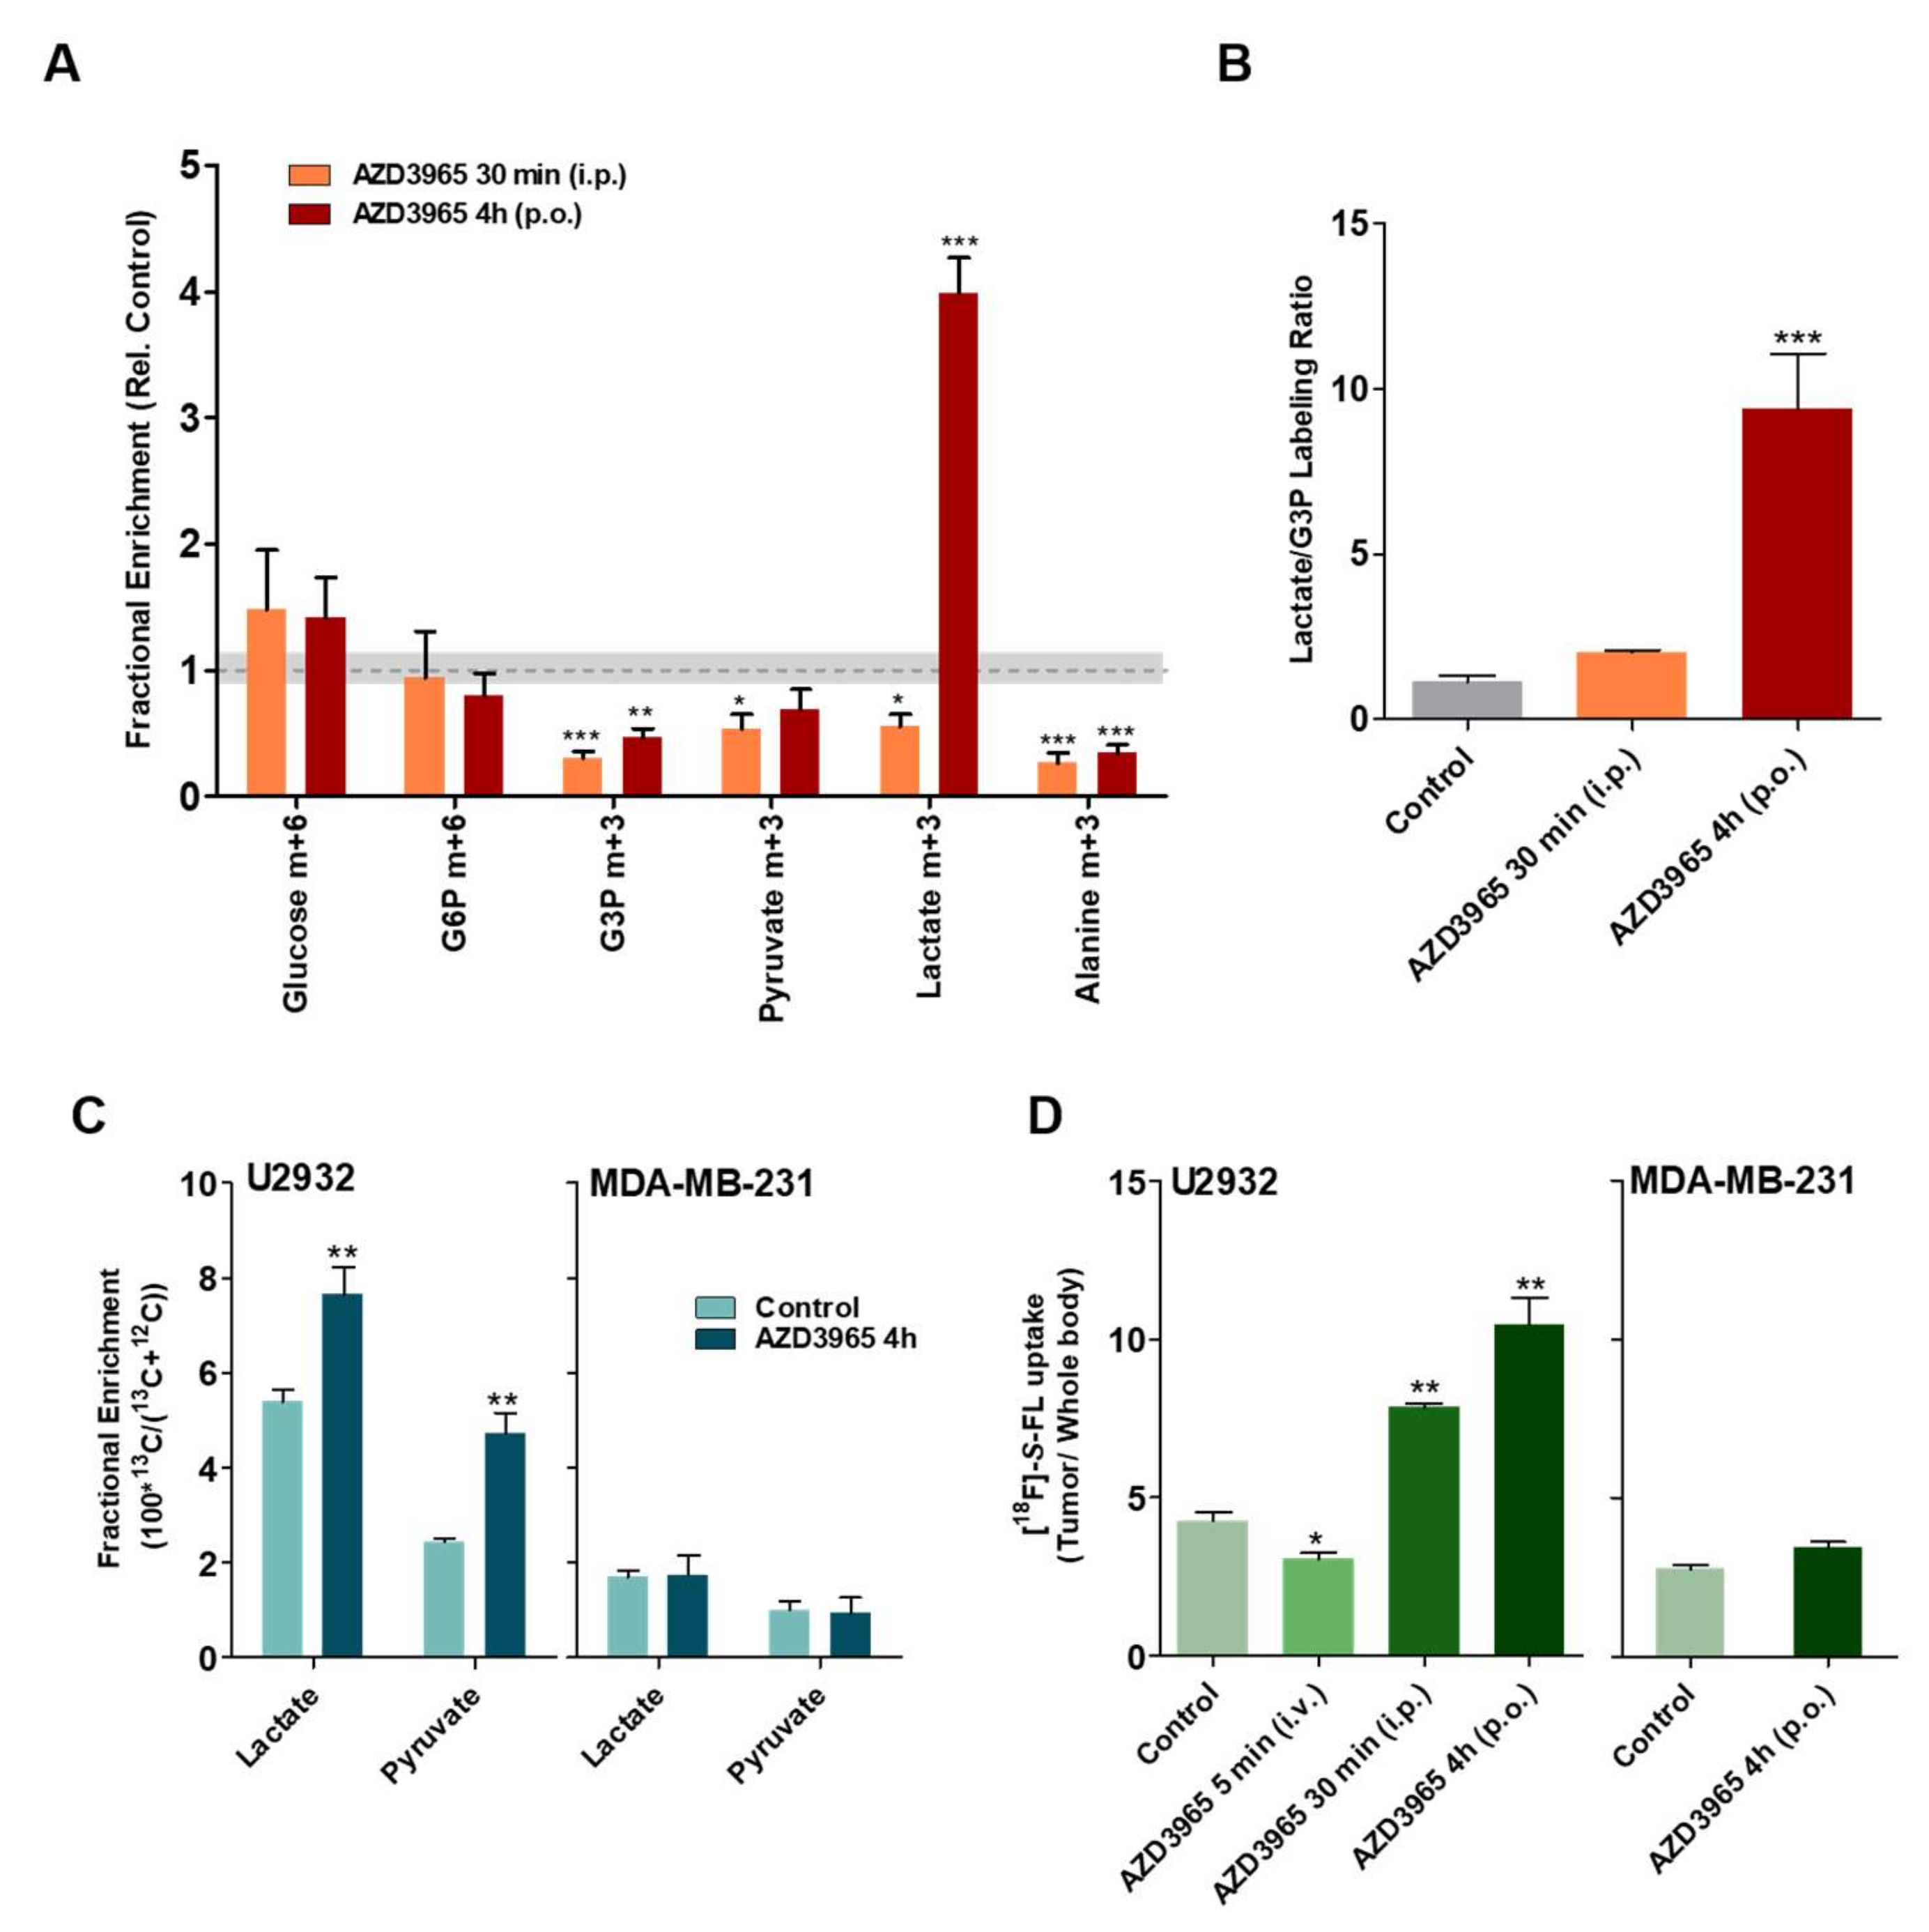
2.4. Pharmacodynamics of Lactate Transport Inhibition by AZD3965
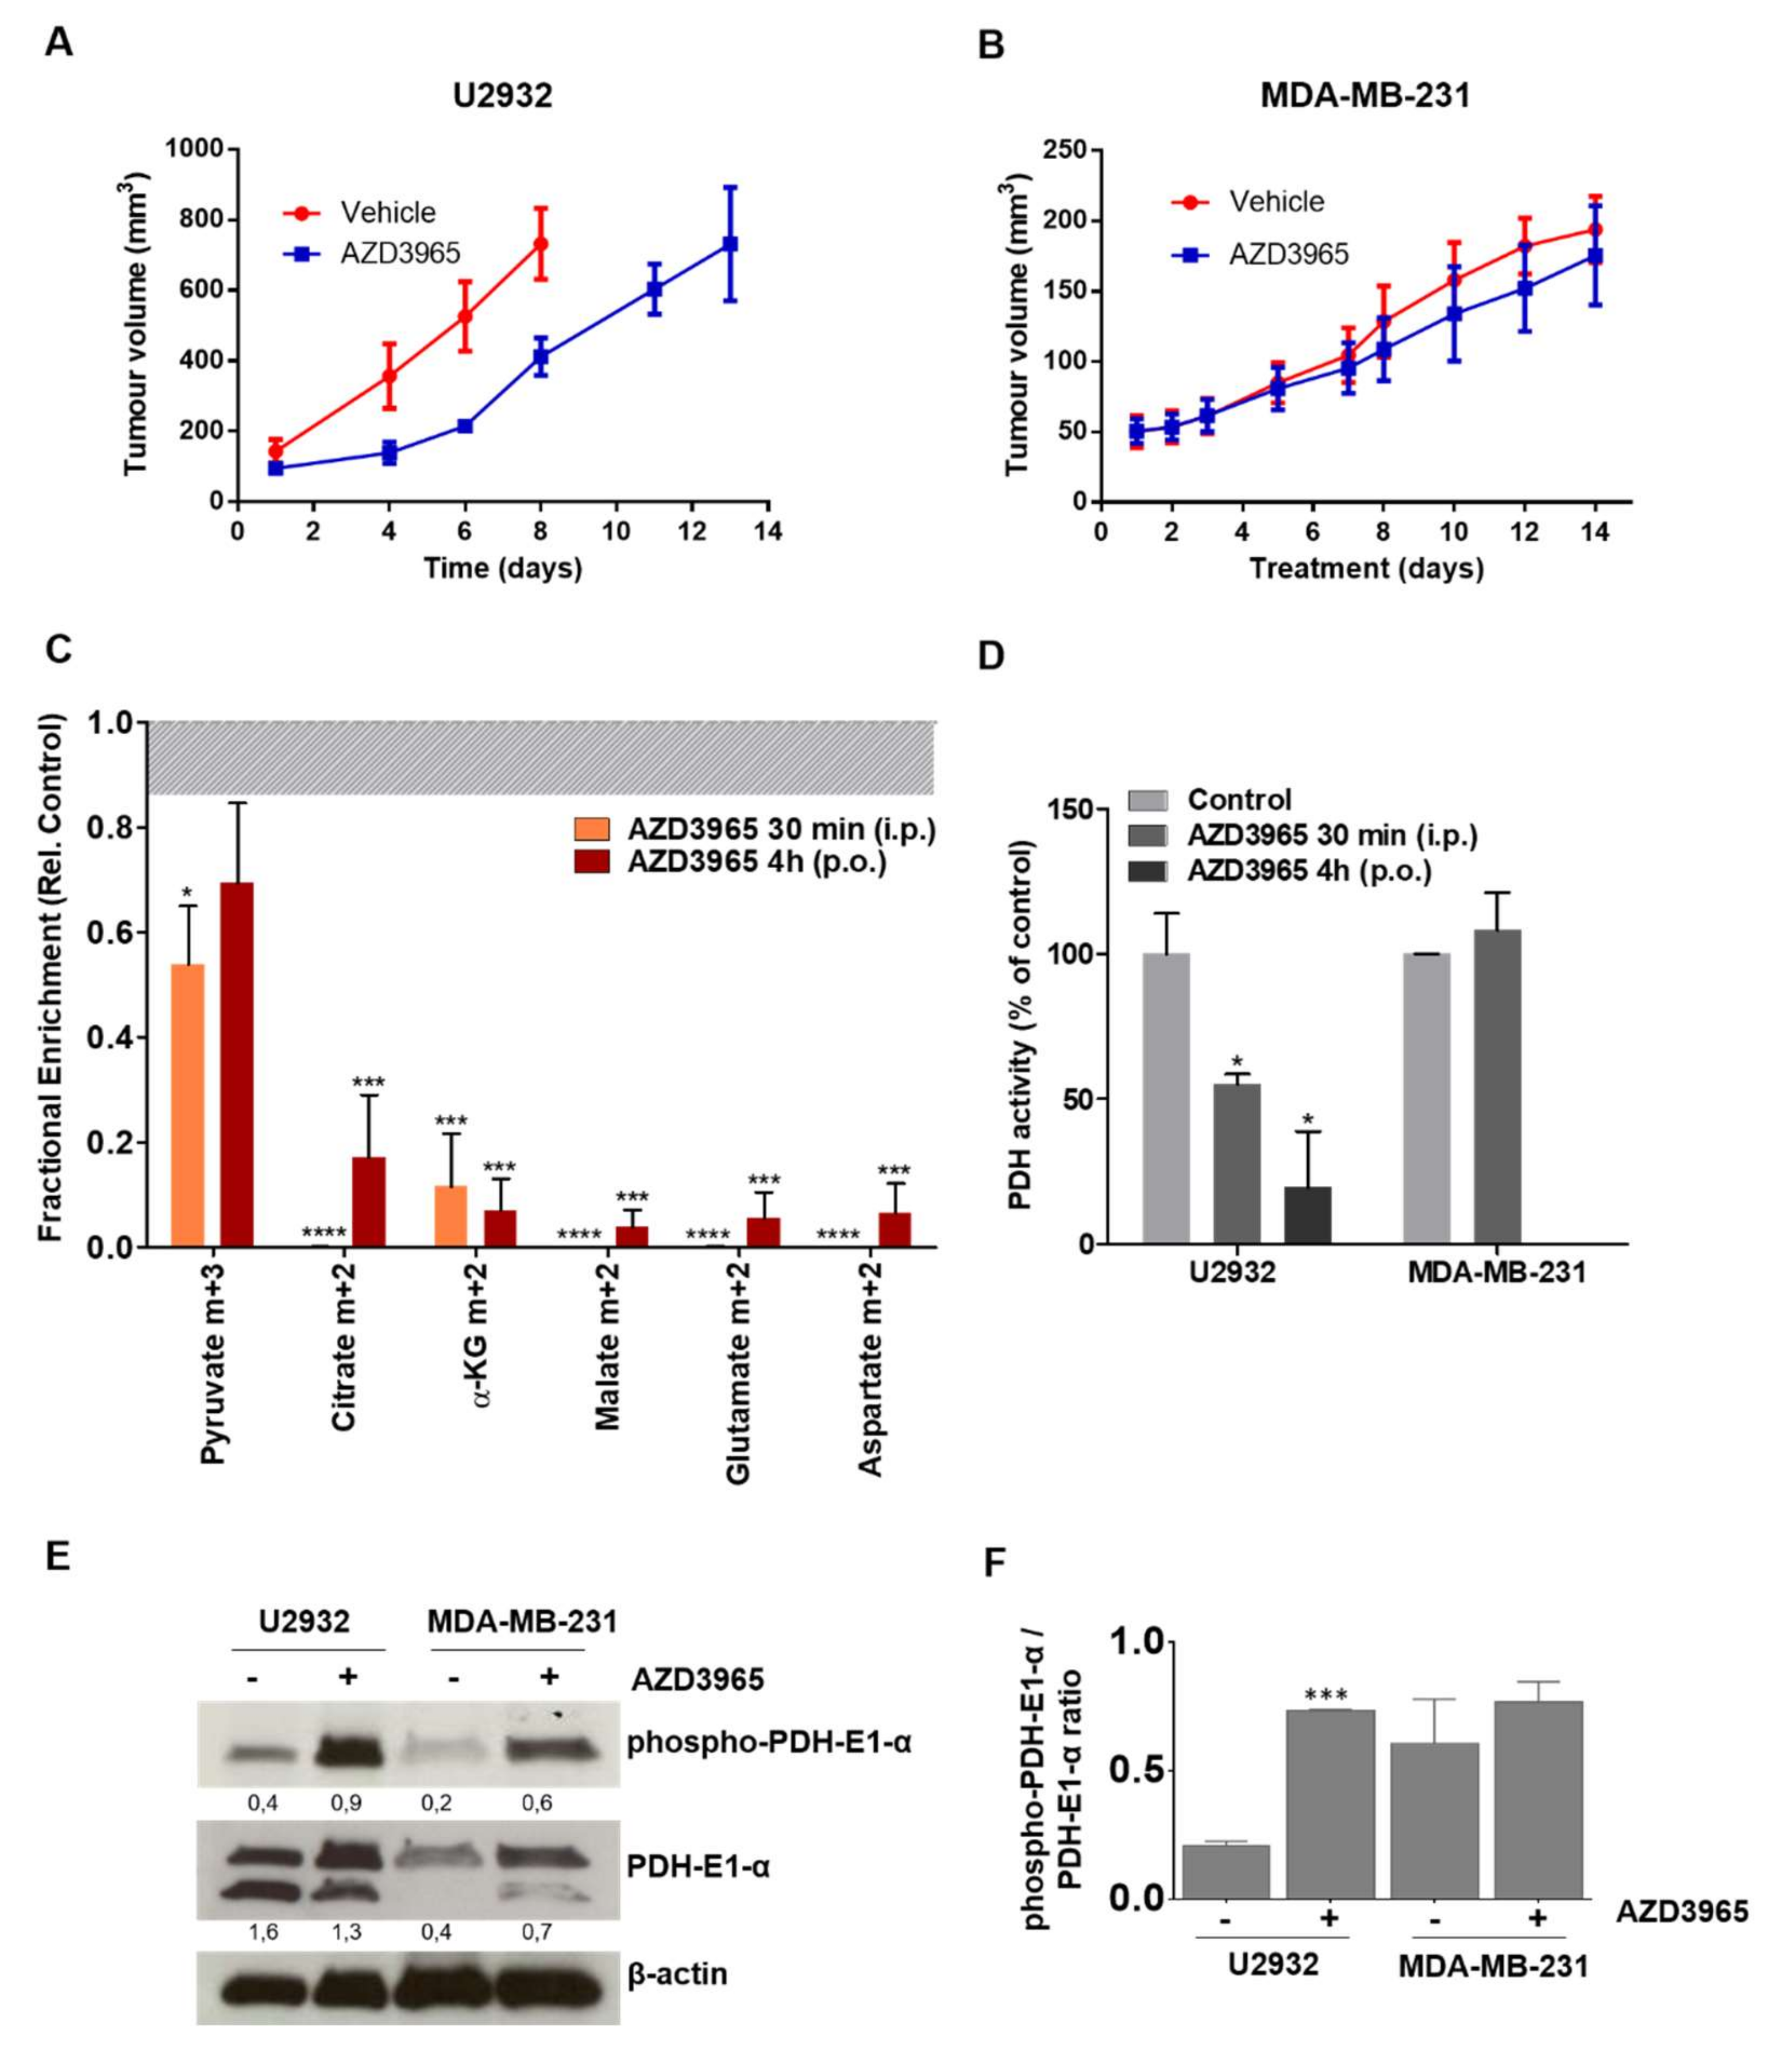
2.5. AZD3965 Impairs TCA Cycle and Inhibits Tumor Growth in DLBCL
3. Discussion
4. Materials and Methods
4.1. Cell Lines and Drugs
4.2. Synthesis of [18F]-S-FL
4.3. Western Blot
4.4. Immunohistochemistry
4.5. In Vitro [18F]FDG and [18F]-S-FL Uptake
4.6. Animal Experiments
4.7. In Vivo Imaging
4.8. In Vivo D-[13C6]glucose and L-[1-13C]lactate Uptake Studies
4.9. Enzyme-Linked Immunosorbent Assay (ELISA)
4.10. Statistical Analysis
5. Conclusions
Supplementary Materials
Author Contributions
Funding
Acknowledgments
Conflicts of Interest
References
- Halestrap, A.P. The SLC16 gene family—Structure, role and regulation in health and disease. Mol. Aspects Med. 2013, 34, 337–349. [Google Scholar] [CrossRef]
- Doherty, J.R.; Yang, C.; Scott, K.E.N.; Cameron, M.D.; Fallahi, M.; Li, W.; Hall, M.A.; Amelio, A.L.; Mishra, J.K.; Li, F.; et al. Blocking lactate export by inhibiting the Myc target MCT1 Disables glycolysis and glutathione synthesis. Cancer Res. 2014, 74, 908–920. [Google Scholar] [CrossRef] [PubMed] [Green Version]
- Kirk, P.; Wilson, M.C.; Heddle, C.; Brown, M.H.; Barclay, A.N.; Halestrap, A.P. CD147 is tightly associated with lactate transporters MCT1 and MCT4 and facilitates their cell surface expression. EMBO J. 2000, 19, 3896–3904. [Google Scholar] [CrossRef]
- Ullah, M.S.; Davies, A.J.; Halestrap, A.P. The Plasma Membrane Lactate Transporter MCT4, but Not MCT1, Is Up-regulated by Hypoxia through a HIF-1α-dependent Mechanism. J. Biol. Chem. 2006, 281, 9030–9037. [Google Scholar] [CrossRef] [Green Version]
- Polański, R.; Hodgkinson, C.L.; Fusi, A.; Nonaka, D.; Priest, L.; Kelly, P.; Trapani, F.; Bishop, P.W.; White, A.; Critchlow, S.E.; et al. Activity of the monocarboxylate transporter 1 inhibitor AZD3965 in small cell lung cancer. Clin. Cancer Res. 2014, 20, 926–937. [Google Scholar] [CrossRef] [PubMed] [Green Version]
- Curtis, N.J.; Mooney, L.; Hopcroft, L.; Michopoulos, F.; Whalley, N.; Zhong, H.; Murray, C.; Logie, A.; Revill, M.; Byth, K.F.; et al. Pre-clinical pharmacology of AZD3965, a selective inhibitor of MCT1: DLBCL, NHL and Burkitt’s lymphoma anti-tumor activity. Oncotarget 2017, 8, 69219–69236. [Google Scholar] [CrossRef] [PubMed] [Green Version]
- Guan, X.; Rodriguez-Cruz, V.; Morris, M.E. Cellular Uptake of MCT1 Inhibitors AR-C155858 and AZD3965 and Their Effects on MCT-Mediated Transport of L-Lactate in Murine 4T1 Breast Tumor Cancer Cells. AAPS J. 2019, 21, 13. [Google Scholar] [CrossRef] [PubMed]
- Cultrera, J.L.; Dalia, S.M. Diffuse Large B-Cell Lymphoma: Current Strategies and Future Directions. Cancer Control. 2012, 19, 204–213. [Google Scholar] [CrossRef] [PubMed] [Green Version]
- Friedberg, J.W. New Strategies in Diffuse Large B-cell Lymphoma: Translating Findings from Gene Expression Analyses into Clinical Practice. Clin. Cancer Res. 2011, 17, 6112–6117. [Google Scholar] [CrossRef] [Green Version]
- Hu, S.; Xu-Monette, Z.Y.; Tzankov, A.; Green, T.; Wu, L.; Balasubramanyam, A.; Liu, W.; Visco, C.; Li, Y.; Miranda, R.N.; et al. MYC/BCL2 protein coexpression contributes to the inferior survival of activated B-cell subtype of diffuse large B-cell lymphoma and demonstrates high-risk gene expression signatures: A report from The International DLBCL Rituximab-CHOP Consortium Program. Blood 2013, 121, 4021–4031. [Google Scholar] [CrossRef] [PubMed] [Green Version]
- DeBerardinis, R.J.; Lum, J.J.; Hatzivassiliou, G.; Thompson, C.B. The Biology of Cancer: Metabolic Reprogramming Fuels Cell Growth and Proliferation. Cell Metab. 2008, 7, 11–20. [Google Scholar] [CrossRef] [PubMed] [Green Version]
- Noble, R.A.; Bell, N.; Blair, H.; Sikka, A.; Thomas, H.; Phillips, N.; Nakjang, S.; Miwa, S.; Crossland, R.; Rand, V.; et al. Inhibition of monocarboxylate transporter 1 by AZD3965 as a novel therapeutic approach for diffuse large B-cell lymphoma and Burkitt lymphoma. Haematologica 2017, 102, 1247–1257. [Google Scholar] [CrossRef] [PubMed]
- Faubert, B.; Li, K.Y.; Cai, L.; Hensley, C.T.; Kim, J.; Zacharias, L.G.; Yang, C.; Do, Q.N.; Doucette, S.; Burguete, D.; et al. Lactate Metabolism in Human Lung Tumors. Cell 2017, 171, 358–371. [Google Scholar] [CrossRef] [PubMed] [Green Version]
- Beloueche-Babari, M.; Wantuch, S.; Casals Galobart, T.; Koniordou, M.; Parkes, H.G.; Arunan, V.; Chung, Y.; Eykyn, T.R.; Smith, P.D.; Leach, M.O.; et al. MCT1 Inhibitor AZD3965 Increases Mitochondrial Metabolism, Facilitating Combination Therapy and Noninvasive Magnetic Resonance Spectroscopy. Ther. Targets Chem. Biol. 2017, 77, 5913–5924. [Google Scholar] [CrossRef] [PubMed] [Green Version]
- Guan, X.; Morris, M.E. Pharmacokinetics of the Monocarboxylate Transporter 1 Inhibitor AZD3965 in Mice: Potential Enterohepatic Circulation and Target-Mediated Disposition. Pharm. Res. 2019, 37, 5–18. [Google Scholar] [CrossRef] [PubMed]
- Pawelczyk, T.; Easom, R.A.; Olson, M.S. Effect of ionic strength and pH on the activity of pyruvate dehydrogenase complex from pig kidney cortex. Arch. Biochem. Biophys. 1992, 294, 44–49. [Google Scholar] [CrossRef]
- Hong, S.M.; Lee, Y.-K.; Park, I.; Kwon, S.M.; Min, S.; Yoon, G. Lactic acidosis caused by repressed lactate dehydrogenase subunit B expression down-regulates mitochondrial oxidative phosphorylation via the pyruvate dehydrogenase (PDH)-PDH kinase axis. J. Biol. Chem. 2019, 294, 7810–7820. [Google Scholar] [CrossRef]
- Bosshart, P.D.; Kalbermatter, D.; Bonetti, S.; Fotiadis, D. Mechanistic basis of L-lactate transport in the SLC16 solute carrier family. Nat. Commun. 2019, 10, 2649–2659. [Google Scholar] [CrossRef]
- Halestrap, A.P.; Price, N.T. The proton-linked monocarboxylate transporter (MCT) family: Structure, function and regulation. Biochem. J. 1999, 343, 281–299. [Google Scholar] [CrossRef]
- Zu, X.L.; Guppy, M. Cancer metabolism: Facts, fantasy, and fiction. Biochem. Biophys. Res. Commun. 2004, 313, 459–465. [Google Scholar] [CrossRef]
- Kennedy, K.M.; Scarbrough, P.M.; Ribeiro, A.; Richardson, R.; Yuan, H.; Sonveaux, P.; Landon, C.D.; Chi, J.-T.; Pizzo, S.; Schroeder, T.; et al. Catabolism of Exogenous Lactate Reveals It as a Legitimate Metabolic Substrate in Breast Cancer. PLoS ONE 2013, 8, e75154. [Google Scholar] [CrossRef] [PubMed] [Green Version]
- Sonveaux, P.; Végran, F.; Schroeder, T.; Wergin, M.C.; Verrax, J.; Rabbani, Z.N.; de Saedeleer, C.J.; Kennedy, K.M.; Diepart, C.; Jordan, B.F.; et al. Targeting lactate-fueled respiration selectively kills hypoxic tumor cells in mice. J. Clin. Invest. 2008, 118, 3930–3942. [Google Scholar] [CrossRef] [Green Version]
- Pavlides, S.; Whitaker-Menezes, D.; Castello-Cros, R.; Flomenberg, N.; Witkiewicz, A.K.; Frank, P.G.; Casimiro, M.C.; Wang, C.; Fortina, P.; Addya, S.; et al. The reverse Warburg effect: Aerobic glycolysis in cancer associated fibroblasts and the tumor stroma. Cell Cycle 2009, 8, 984–4001. [Google Scholar] [CrossRef] [PubMed] [Green Version]
- Hui, S.; Ghergurovich, J.M.; Morscher, R.J.; Jang, C.; Teng, X.; Lu, W.; Esparza, L.A.; Reya, T.; Zhan, L.; Guo, J.Y.; et al. Glucose feeds the TCA cycle via circulating lactate. Nature 2017, 551, 115–118. [Google Scholar] [CrossRef] [Green Version]
- Gooptu, M.; Whitaker-Menezes, D.; Sprandio, J.; Domingo-Vidal, M.; Lin, Z.; Uppal, G.; Gongd, J.; Fratamicob, R.; Leibye, B.; Dulau-Floreaf, A.; et al. Mitochondrial and glycolytic metabolic compartmentalization in diffuse large B-cell lymphoma. Semin. Oncol. 2017, 44, 204–217. [Google Scholar] [CrossRef]
- Park, S.; Chang, C.-Y.; Safi, R.; Liu, X.; Baldi, R.; Jasper, J.S.; Anderson, G.R.; Liu, T.; Rathmell, J.C.; Dewhirst, M.W.; et al. ERRα-Regulated Lactate Metabolism Contributes to Resistance to Targeted Therapies in Breast Cancer. Cell Rep. 2016, 15, 323–335. [Google Scholar] [CrossRef] [PubMed] [Green Version]
- Van Hée, V.F.; Labar, D.; Dehon, G.; Grasso, D.; Grégoire, V.; Muccioli, G.G.; Frédérick, R.; Sonveaux, P. Radiosynthesis and validation of (±)-[18F]-3-fluoro-2-hydroxypropionate ([18F]-FLac) as a PET tracer of lactate to monitor MCT1-dependent lactate uptake in tumors. Oncotarget 2017, 8, 24415–24428. [Google Scholar] [CrossRef]
- Counillon, L.; Bouret, Y.; Marchiq, I.; Pouysségur, J. Na+/H+ antiporter (NHE1) and lactate/H+ symporters (MCTs) in pH homeostasis and cancer metabolism. Biochim. Biophys. Acta Mol. Cell Res. 2016, 1863, 2465–2480. [Google Scholar] [CrossRef]
- Benjamin, D.; Robay, D.; Hindupur, S.K.; Pohlmann, J.; Colombi, M.; El-Shemerly, M.Y.; Maira, S.; Moroni, C.; Lane, H.A.; Hall, M.N. Dual Inhibition of the Lactate Transporters MCT1 and MCT4 Is Synthetic Lethal with Metformin due to NAD+ Depletion in Cancer Cells. Cell Rep. 2018, 25, 3047–3058. [Google Scholar] [CrossRef] [Green Version]
- Molina, J.R.; Sun, Y.; Protopopova, M.; Gera, S.; Bandi, M.; Bristow, C.; McAfoos, T.; Morlacchi, P.; Ackroyd, J.; Agip, A.A.-N.; et al. An inhibitor of oxidative phosphorylation exploits cancer vulnerability. Nat. Med. 2018, 24, 1036–1046. [Google Scholar] [CrossRef] [Green Version]
- Birsoy, K.; Wang, T.; Chen, W.W.; Freinkman, E.; Abu-Remaileh, M.; Sabatini, D.M. An essential role of the mitochondrial electron transport chain in cell proliferation is to enable aspartate synthesis. Cell 2015, 162, 540–551. [Google Scholar] [CrossRef] [PubMed] [Green Version]
- Sullivan, L.B.; Gui, D.Y.; Hosios, A.M.; Bush, L.N.; Freinkman, E.; Vander Heiden, M.G. Supporting Aspartate Biosynthesis Is an Essential Function of Respiration in Proliferating Cells. Cell 2015, 162, 552–563. [Google Scholar] [CrossRef] [PubMed] [Green Version]
- Zhou, Y.; Tozzi, F.; Chen, J.; Fan, F.; Xia, L.; Wang, J.; Gao, G.; Zhang, A.; Xia, X.; Brasher, H.; et al. Intracellular ATP levels are a pivotal determinant of chemoresistance in colon cancer cells. Cancer Res. 2012, 72, 304–314. [Google Scholar] [CrossRef] [PubMed] [Green Version]
- Workman, P.; Aboagye, E.O.; Balkwill, F.; Balmain, A.; Bruder, G.; Chaplin, D.J.; Double, J.A.; Everitt, J.; Farningham, D.A.H.; Glennie, M.J.; et al. Guidelines for the welfare and use of animals in cancer research. Br. J. Cancer 2010, 102, 1555–1577. [Google Scholar] [CrossRef] [PubMed] [Green Version]


© 2020 by the authors. Licensee MDPI, Basel, Switzerland. This article is an open access article distributed under the terms and conditions of the Creative Commons Attribution (CC BY) license (http://creativecommons.org/licenses/by/4.0/).
Share and Cite
Braga, M.; Kaliszczak, M.; Carroll, L.; Schug, Z.T.; Heinzmann, K.; Baxan, N.; Benito, A.; Valbuena, G.N.; Stribbling, S.; Beckley, A.; et al. Tracing Nutrient Flux Following Monocarboxylate Transporter-1 Inhibition with AZD3965. Cancers 2020, 12, 1703. https://0-doi-org.brum.beds.ac.uk/10.3390/cancers12061703
Braga M, Kaliszczak M, Carroll L, Schug ZT, Heinzmann K, Baxan N, Benito A, Valbuena GN, Stribbling S, Beckley A, et al. Tracing Nutrient Flux Following Monocarboxylate Transporter-1 Inhibition with AZD3965. Cancers. 2020; 12(6):1703. https://0-doi-org.brum.beds.ac.uk/10.3390/cancers12061703
Chicago/Turabian StyleBraga, Marta, Maciej Kaliszczak, Laurence Carroll, Zachary T. Schug, Kathrin Heinzmann, Nicoleta Baxan, Adrian Benito, Gabriel N. Valbuena, Stephen Stribbling, Alice Beckley, and et al. 2020. "Tracing Nutrient Flux Following Monocarboxylate Transporter-1 Inhibition with AZD3965" Cancers 12, no. 6: 1703. https://0-doi-org.brum.beds.ac.uk/10.3390/cancers12061703