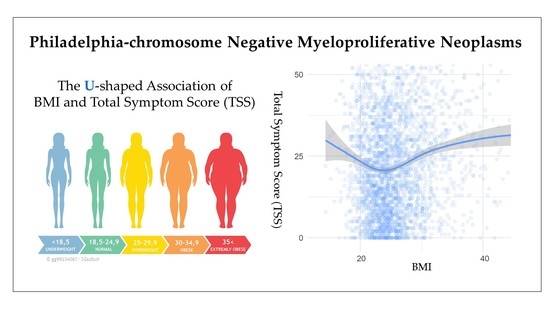
Body Mass Index and Total Symptom Burden in Myeloproliferative Neoplasms Discovery of a U-shaped Association

Abstract
:
1. Introduction
2. Results
2.1. Patient Demographics
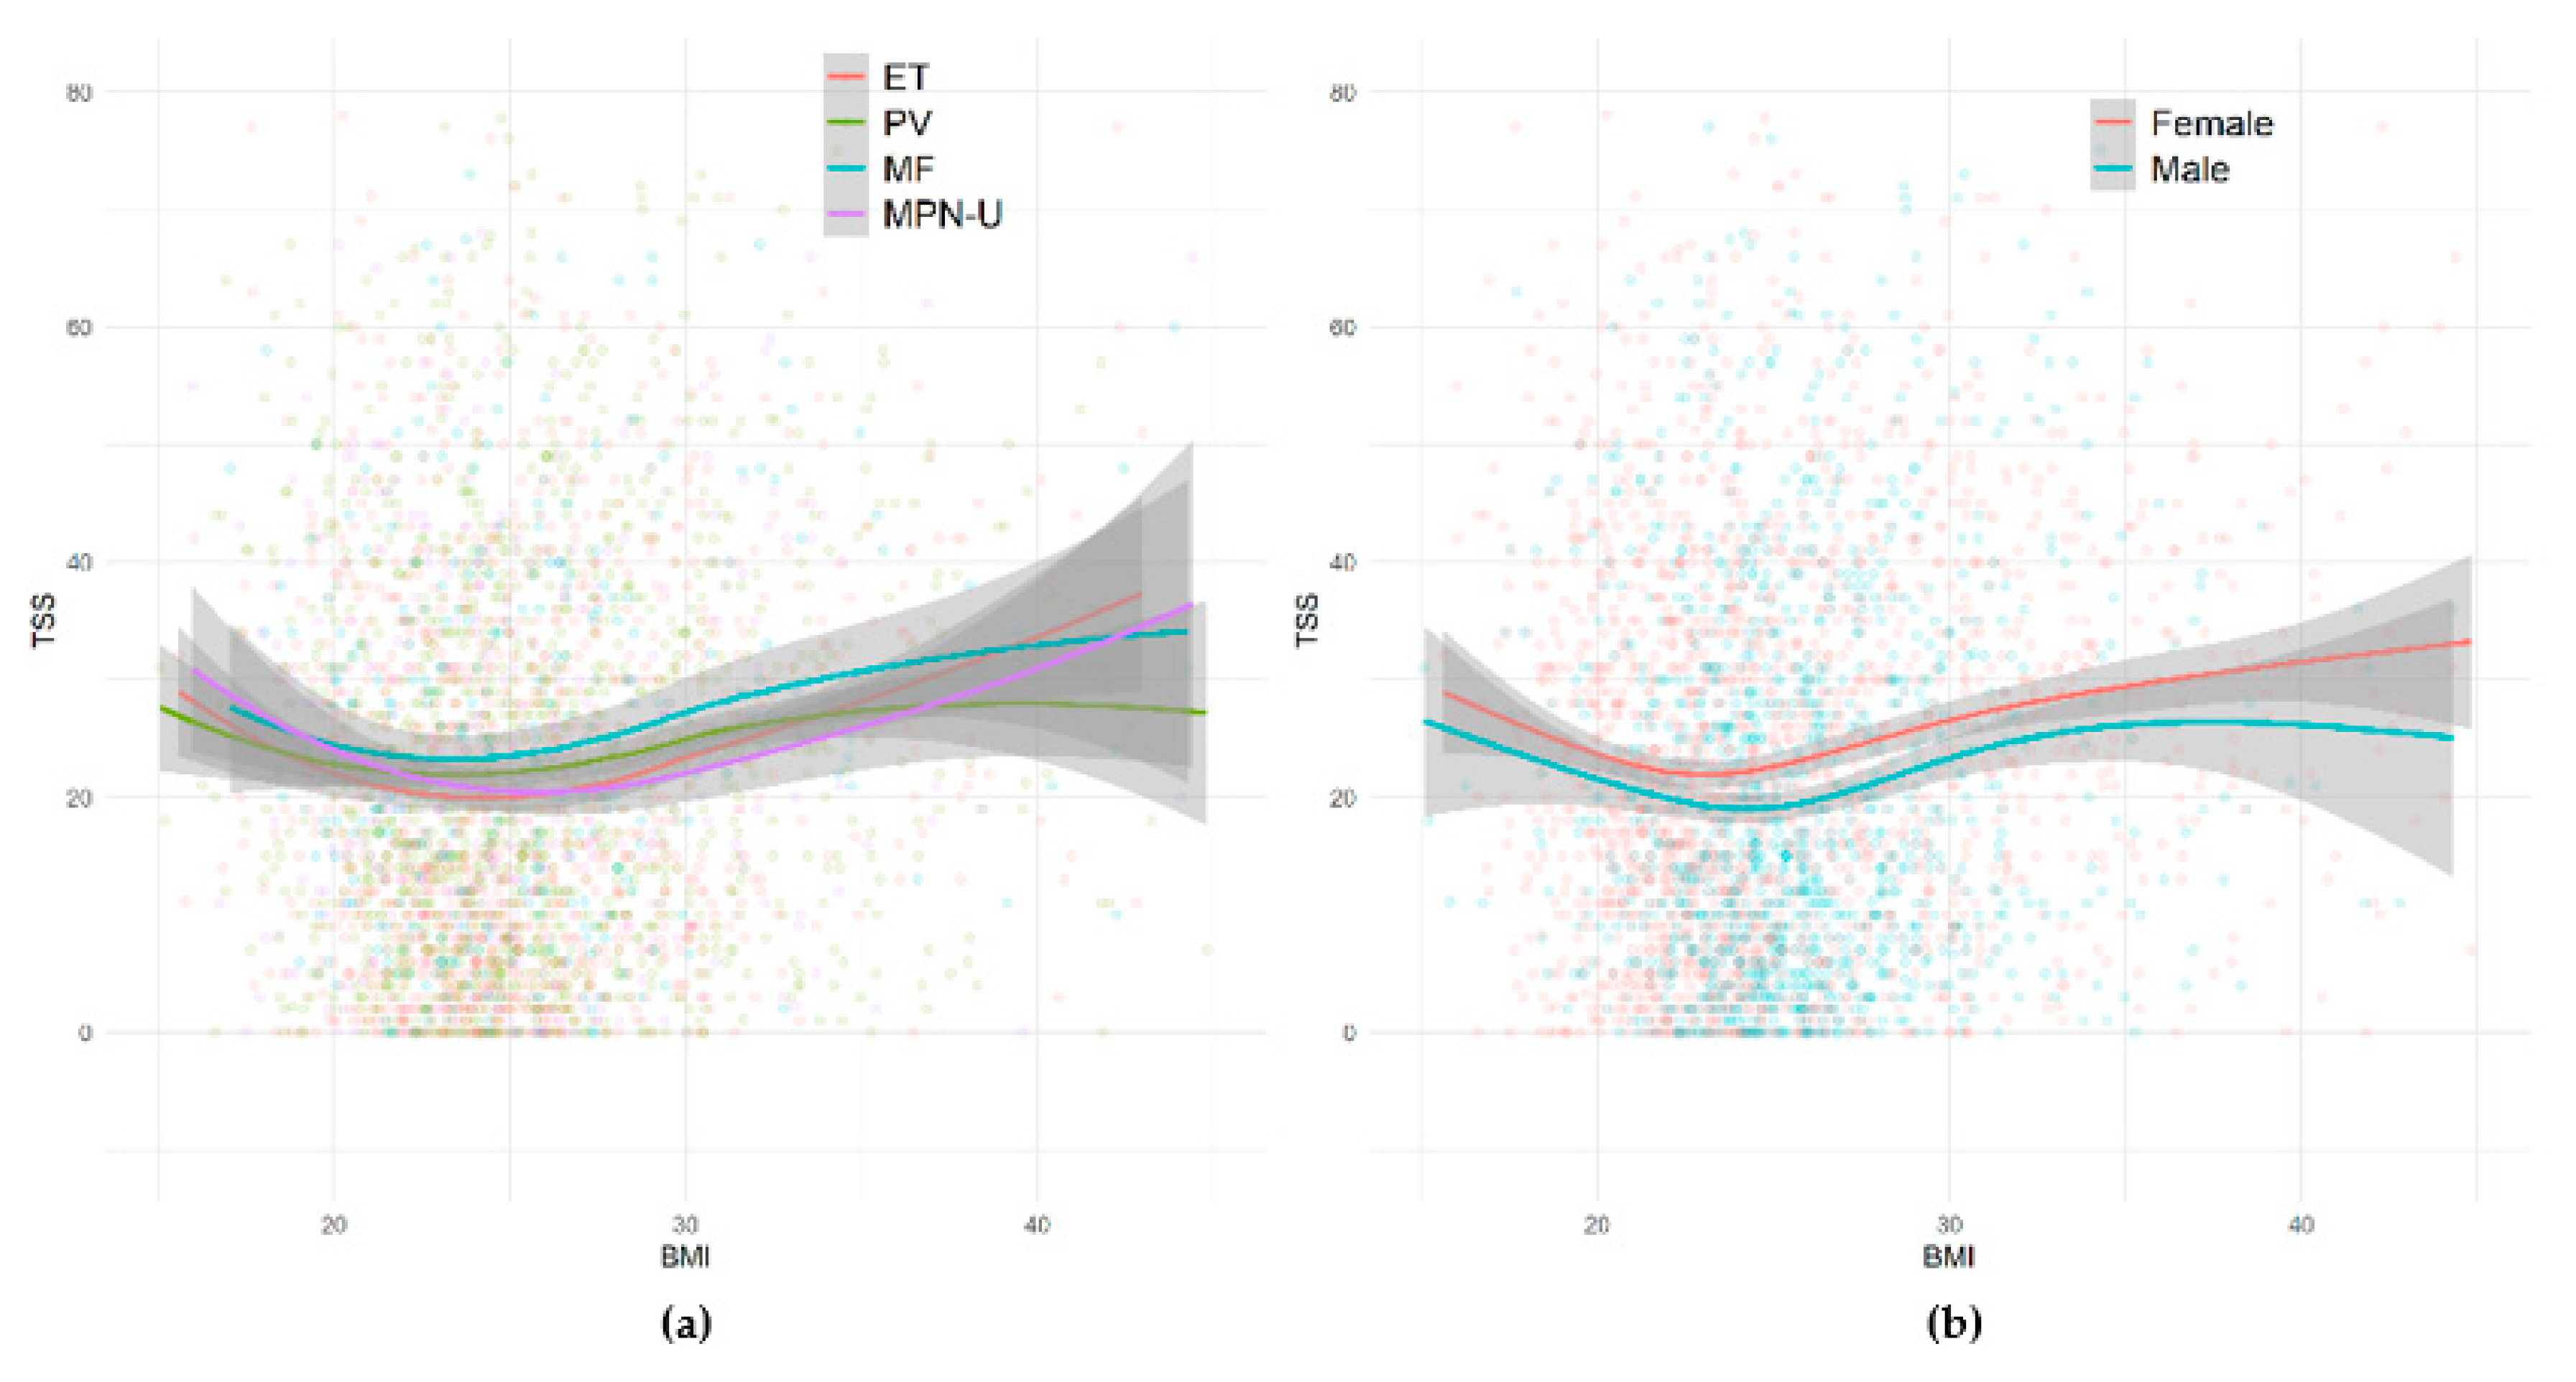
2.2. Body Mass Index and Symptom Burden
2.3. Adjusted Differences in MPN-SAF Symptom Score
3. Discussion
4. Materials and Methods
4.1. Descriptions of Surveys
4.2. Symptoms, Lifestyle Factors, and BMI Categories
4.3. Statistical Analysis
5. Conclusions
Supplementary Materials
Author Contributions
Funding
Acknowledgments
Conflicts of Interest
References
- Stevens, G.A.; Singh, G.M.; Lu, Y.; Danaei, G.; Lin, J.K.; Finucane, M.M.; Bahalim, A.N.; McIntire, R.K.; Gutierrez, H.R.; Cowan, M.; et al. National, regional, and global trends in adult overweight and obesity prevalences. Popul. Health Metr. 2012, 10, 1. [Google Scholar] [CrossRef] [PubMed] [Green Version]
- Di Cesare, M.; Bentham, J.; Stevens, G.A.; Zhou, B.; Danaei, G.; Lu, Y.; Bixby, H.; Cowan, M.J.; Riley, L.M.; Hajifathalian, K.; et al. Trends in adult body-mass index in 200 countries from 1975 to 2014: A pooled analysis of 1698 population-based measurement studies with 19.2 million participants. Lancet 2016, 387, 1377–1396. [Google Scholar] [CrossRef] [Green Version]
- Abarca-Gómez, L.; Abdeen, Z.A.; Hamid, Z.A.; Abu-Rmeileh, N.M.; Acosta-Cazares, B.; Acuin, C.; Adams, R.J.; Aekplakorn, W.; Afsana, K.; Aguilar-Salinas, C.A.; et al. Worldwide trends in body-mass index, underweight, overweight, and obesity from 1975 to 2016: A pooled analysis of 2416 population-based measurement studies in 128.9 million children, adolescents, and adults. Lancet 2017, 390, 2627–2642. [Google Scholar] [CrossRef] [Green Version]
- Blüher, M. Obesity: Global epidemiology and pathogenesis. Nat. Rev. Endocrinol. 2019. [Google Scholar] [CrossRef] [PubMed]
- Mokdad, A.; Marks, J.; Stroup, D.; Gerberding, J. Actual causes of death in the United States, 2000. J. Am. Med. Assoc. 2004, 291, 1238–1246. [Google Scholar] [CrossRef] [PubMed]
- Fontaine, K.R.; Redden, D.T.; Wang, C.; Westfall, A.O.; Allison, D.B. Years of Life Lost Due to Obesity Kevin. JAMA 2003, 289, 187–193. [Google Scholar] [CrossRef] [PubMed]
- Renahan, A.; Tyson, M.; Egger, M.; Rf, H.; Zwahlen, M. Body-mass index and incidence of cancer: A systematic review and meta-analysis of prospective observational studies. Lancet 2008, 371, 569–578. [Google Scholar] [CrossRef]
- Wang, J.; Yang, D.L.; Chen, Z.Z.; Gou, B.F. Associations of body mass index with cancer incidence among populations, genders, and menopausal status: A systematic review and meta-analysis. Cancer Epidemiol. 2016, 42, 1–8. [Google Scholar] [CrossRef]
- Kyrgiou, M.; Kalliala, I.; Markozannes, G.; Gunter, M.J.; Paraskevaidis, E.; Gabra, H.; Martin-Hirsch, P.; Tsilidis, K.K. Adiposity and cancer at major anatomical sites: Umbrella review of the literature. BMJ 2017, 356, 1–10. [Google Scholar] [CrossRef] [Green Version]
- Lauby-Secretan, B.; Scoccianti, C.; Loomis, D. Body Fatness and Cancer—Viewpoint of the IARC Working Group. N. Engl. J. Med. 2016, 375, 794–798. [Google Scholar] [CrossRef] [Green Version]
- Leal, A.; Thompson, C.; Wang, A.; Vierkant, R.; Habermann, T.; Ross, J.; Mesa, R.; Virnig, B.; Cerhan, J. Anthropometric, medical history and lifestyle risk factors for myeloproliferative neoplasms in The Iowa Women’s Health Study (IWHS) cohort. Int. J. Cancer 2014, 134, 1741–1750. [Google Scholar] [CrossRef] [Green Version]
- Leiba, A.; Duek, A.; Afek, A.; Derazne, E.; Leiba, M. Obesity and related risk of myeloproliferative neoplasms among israeli adolescents. Obesity 2017, 25, 1187–1190. [Google Scholar] [CrossRef] [PubMed]
- Murphy, F.; Kroll, M.E.; Pirie, K.; Reeves, G.; Green, J.; Beral, V. Body size in relation to incidence of subtypes of haematological malignancy in the prospective Million Women Study. Br. J. Cancer 2013, 108, 2390–2398. [Google Scholar] [CrossRef] [PubMed] [Green Version]
- Engeland, A.; Tretli, S.; Hansen, S.; Bjørge, T. Height and body mass index and risk of lymphohematopoietic malignancies in two million Norwegian men and women. Am. J. Epidemiol. 2007, 165, 44–52. [Google Scholar] [CrossRef] [PubMed]
- Duncombe, A.S.; Anderson, L.A.; James, G.; de Vocht, F.; Fritschi, L.; Mesa, R.; Clarke, M.; McMullin, M.F. Modifiable Lifestyle and Medical Risk Factors Associated With Myeloproliferative Neoplasms. HemaSphere 2020, 4, 327. [Google Scholar] [CrossRef]
- Campbell, P.J.; Green, A.R. 5–15: The Myeloproliferative Disorders. N. Engl. J. Med. 2006, 355, 2452–2466. [Google Scholar] [CrossRef]
- Hasselbalch, H.C. Perspectives on chronic inflammation in essential thrombocythemia, polycythemia vera, and myelofibrosis: Is chronic inflammation a trigger atherosclerosis and second cancer? Blood 2012, 119, 3219–3225. [Google Scholar] [CrossRef] [Green Version]
- Tefferi, A.; Pardanani, A. Myeloproliferative neoplasms: A contemporary review. JAMA Oncol. 2015, 1, 97–105. [Google Scholar] [CrossRef]
- Mesa, R.A.; Niblack, J.; Wadleigh, M.; Verstovsek, S.; Camoriano, J.; Barnes, S.; Tan, A.D.; Atherton, P.J.; Sloan, J.A.; Tefferi, A. The burden of fatigue and quality of life in myeloproliferative disorders (MPDs): An international internet-based survey of 1179 MPD patients. Cancer 2007, 109, 68–76. [Google Scholar] [CrossRef]
- Geyer, H.L.; Dueck, A.C.; Scherber, R.M.; Mesa, R.A. Impact of Inflammation on Myeloproliferative Neoplasm Symptom Development. Mediat. Inflamm. 2015. [Google Scholar] [CrossRef] [Green Version]
- González-Muniesa, P.; Garcia-Gerique, L.; Quintero, P.; Arriaza, S.; Lopez-Pascual, A.; Martinez, J.A. Effects of hyperoxia on oxygen-related inflammation with a focus on obesity. Oxid. Med. Cell. Longev. 2016, 2016. [Google Scholar] [CrossRef] [PubMed] [Green Version]
- Bergens, O.; Nilsson, A.; Kadi, F. Cardiorespiratory Fitness Does Not Offset Adiposity-Related Systemic Inflammation in Physically Active Older Women. J. Clin. Endocrinol. Metab. 2019. [Google Scholar] [CrossRef] [PubMed]
- Stepanikova, I.; Oates, G.R.; Bateman, L.B. Does one size fit all? The role of body mass index and waist circumference in systemic inflammation in midlife by race and gender. Ethn. Health 2017, 22, 169–183. [Google Scholar] [CrossRef] [PubMed] [Green Version]
- Thorand, B.; Baumert, J.; Döring, A.; Herder, C.; Kolb, H.; Rathmann, W.; Giani, G.; Koenig, W.; Wichmann, H.E.; Löwel, H.; et al. Sex differences in the relation of body composition to markers of inflammation. Atherosclerosis 2006, 184, 216–224. [Google Scholar] [CrossRef]
- Lumeng, C.N.; Saltiel, A.R.; Lumeng, C.N.; Saltiel, A.R. Inflammatory links between obesity and metabolic disease Find the latest version: Review series Inflammatory links between obesity and metabolic disease. J. Clin. Investig. 2011, 121, 2111–2117. [Google Scholar] [CrossRef] [Green Version]
- Sun, S.; Ji, Y.; Kersten, S.; Qi, L. Mechanisms of Inflammatory Responses in Obese Adipose Tissue. Annu. Rev. Nutr. 2012, 32, 261–286. [Google Scholar] [CrossRef] [Green Version]
- Hotamislig, G.S. Inflammation and metabolic disorders. Nature 2006, 444, 861–867. [Google Scholar]
- Scherber, R.M.; Kosiorek, H.E.; Senyak, Z.; Dueck, A.C.; Clark, M.M.; Boxer, M.A.; Geyer, H.L.; McCallister, A.; Cotter, M.; Van Husen, B.; et al. Comprehensively understanding fatigue in patients with myeloproliferative neoplasms. Cancer 2016, 122, 477–485. [Google Scholar] [CrossRef]
- Scherber, R.; Langlais, B.; Geyer, H.; Dueck, A.; Huberty, J.; Padrnos, L.; Palmer, J.; Fleischman, A.; Ruben, M. The relationship of Body Mass Index to Symptom Burden in the Myeloproliferative Neoplams. Haematologia (Budap) 2018, 102, 215667. [Google Scholar]
- Breccia, M.; Bartoletti, D.; Bonifacio, M.; Palumbo, G.A.; Polverelli, N.; Palandri, F. Impact of comorbidities and body mass index in myelofibrosis patients treated with ruxolitinib: A retrospective analysis. Ann. Hematol. 2018, 98, 889–896. [Google Scholar] [CrossRef]
- Eckert, R.; Huberty, J.; Gowin, K.L.; Ginos, B.; Kosiorek, H.E.; Dueck, A.C.; Mesa, R.A. Impact of Weight on Symptom Burden Outcomes in Myeloproliferative Neoplasm Patients Participating in an Online Yoga Intervention. Blood 2016, 128, 5481. [Google Scholar] [CrossRef]
- Tsai, A.G.; Bessesen, D.H. Obesity. Ann. Intern. Med. 2019, 170, ITC33–ITC48. [Google Scholar] [CrossRef] [PubMed]
- Fang, P.; Tan, K.S.; Troxel, A.B.; Rengan, R.; Freedman, G.; Lin, L.L. High body mass index is associated with worse quality of life in breast cancer patients receiving radiotherapy. Breast Cancer Res. Treat. 2013, 141, 125–133. [Google Scholar] [CrossRef] [PubMed]
- Kroes, M.; Osei-Assibey, G.; Baker-Searle, R.; Huang, J. Impact of weight change on quality of life in adults with overweight/obesity in the United States: A systematic review. Curr. Med. Res. Opin. 2015, 32, 485–508. [Google Scholar] [CrossRef]
- Korhonen, P.E.; Seppälä, T.; Järvenpää, S.; Kautiainen, H. Body mass index and health-related quality of life in apparently healthy individuals. Qual. Life Res. 2014, 23, 67–74. [Google Scholar] [CrossRef]
- Søltoft, F.; Hammer, M.; Kragh, N. The association of body mass index and health-related quality of life in the general population: Data from the 2003 Health Survey of England. Qual. Life Res. 2009, 18, 1293–1299. [Google Scholar] [CrossRef] [Green Version]
- Ul-Haq, Z.; Mackay, D.F.; Fenwick, E.; Pell, J.P. Meta-analysis of the association between body mass index and health-related quality of life among adults, assessed by the SF-36. Obesity 2013, 21, 322–328. [Google Scholar] [CrossRef]
- Ul-Haq, Z.; MacKay, D.F.; Fenwick, E.; Pell, J.P. Meta-analysis of the association between body mass index and health-related quality of life among children and adolescents, assessed using the pediatric quality of life inventory index. J. Pediatr. 2013, 162, 280–286. [Google Scholar] [CrossRef]
- Huang, I.C.; Frangakis, C.; Wu, A.W. The relationship of excess body weight and health-related quality of life: Evidence from a population study in Taiwan. Int. J. Obes. 2006, 30, 1250–1259. [Google Scholar] [CrossRef] [Green Version]
- Hassan, M.K.; Joshi, A.V.; Madhavan, S.S.; Amonkar, M.M. Obesity and health-related quality of life: A cross-sectional analysis of the US population. Int. J. Obes. 2003, 27, 1227–1232. [Google Scholar] [CrossRef] [Green Version]
- Mesa, R.; Miller, C.B.; Thyne, M.; Mangan, J.; Goldberger, S.; Fazal, S.; Ma, X.; Wilson, W.; Paranagama, D.C.; Dubinski, D.G.; et al. Myeloproliferative neoplasms (MPNs) have a significant impact on patients’ overall health and productivity: The MPN Landmark survey. BMC Cancer 2016, 16, 1–10. [Google Scholar] [CrossRef] [PubMed] [Green Version]
- Scherber, R.; Dueck, A.C.; Johansson, P.; Barbui, T.; Barosi, G.; Vannucchi, A.M.; Passamonti, F.; Andreasson, B.; Ferarri, M.L.; Rambaldi, A.; et al. The Myeloproliferative Neoplasm Symptom Assessment Form (MPN-SAF): International prospective validation and reliability trial in 402 patients. Blood 2011, 118, 401–408. [Google Scholar] [CrossRef] [PubMed]
- Emanuel, R.M.; Dueck, A.C.; Geyer, H.L.; Kiladjian, J.J.; Slot, S.; Zweegman, S.; Te Boekhorst, P.A.W.; Commandeur, S.; Schouten, H.C.; Sackmann, F.; et al. Myeloproliferative neoplasm (MPN) symptom assessment form total symptom score: Prospective international assessment of an abbreviated symptom burden scoring system among patients with MPNs. J. Clin. Oncol. 2012. [Google Scholar] [CrossRef] [PubMed] [Green Version]
- Harrison, C.N.; Koschmieder, S.; Foltz, L.; Guglielmelli, P.; Flindt, T.; Koehler, M.; Mathias, J.; Komatsu, N.; Boothroyd, R.N.; Spierer, A.; et al. The impact of myeloproliferative neoplasms (MPNs) on patient quality of life and productivity: Results from the international MPN Landmark survey. Ann. Hematol. 2017, 96, 1653–1665. [Google Scholar] [CrossRef] [Green Version]
- Paxton, R.J.; Phillips, K.L.; Jones, L.A.; Chang, S.; Taylor, W.C.; Courneya, K.S.; Pierce, J.P.; Care, W.H. Associations among physical activity, bodt mass index, and health related quality of in breast cancer survivors. Cancer 2013, 118, 4024–4031. [Google Scholar] [CrossRef] [Green Version]
- Forsythe, L.; Alfano, C.; George, S.; McTiernan, A.; Baumgartner, K.; Bernstein, L.; Ballard-Barbash, R. Pain in long-term breast cancer survivors: The role of body mass index, physical activity, and sedentary behavior. Breast Cancer Res. Treat. 2013, 137, 617–630. [Google Scholar] [CrossRef] [PubMed] [Green Version]
- Gerber, L.H.; Stout, N.; McGarvey, C.; Soballe, P.; Shieh, C.Y.; Diao, G.; Springer, B.A.; Pfalzer, L.A. Factors predicting clinically significant fatigue in women following treatment for primary breast cancer. Support. Care Cancer 2011, 19, 1581–1591. [Google Scholar] [CrossRef] [Green Version]
- Morcos, B.; Ahmad, F.A.; Anabtawi, I.; Sba’, A.M.A.; Shabani, H.; Yaseen, R. Development of breast cancer-related lymphedema: Is it dependent on the patient, the tumor or the treating physicians? Surg. Today 2014, 44, 100–106. [Google Scholar] [CrossRef]
- Kolotkin, R.L.; Zunker, C.; Ostbye, T. Sexual functioning and obesity: A review. Obesity 2012, 20, 2325–2333. [Google Scholar] [CrossRef]
- Chai, N.C.; Scher, A.; Moghekar, A.; Bond, D.; Peterlin, B.L. The Epidemiology of Obesity and Headache: Epidemiology of Obesity. Headache 2014, 54, 219–234. [Google Scholar] [CrossRef]
- Fontaine, K.R.; Barofsky, I. Obesity and health-related quality of life. Obes. Rev. 2001, 2, 173–182. [Google Scholar] [CrossRef] [PubMed]
- Fine, J.T.; Colditz, G.A.; Coakley, E.H.; Moseley, G.; Manson, J.E.; Willett, W.C. A prospective study of weight change and health-related quality of life in women. J. Am. Med. Assoc. 1999, 282, 2136–2142. [Google Scholar] [CrossRef] [PubMed] [Green Version]
- Koutoukidis, D.A.; Knobf, M.T.; Lanceley, A. Obesity, diet, physical activity, and health-related quality of life in endometrial cancer survivors. Nutr. Rev. 2015, 73, 399–408. [Google Scholar] [CrossRef] [PubMed] [Green Version]
- Jansen, L.; Koch, L.; Brenner, H.; Arndt, V. Quality of life among long-term (≥5 years) colorectal cancer survivors—Systematic review. Eur. J. Cancer 2010, 46, 2879–2888. [Google Scholar] [CrossRef]
- Smits, A.; Smits, E.; Lopes, A.; Das, N.; Hughes, G.; Talaat, A.; Pollard, A.; Bouwman, F.; Massuger, L.; Bekkers, R.; et al. Body mass index, physical activity and quality of life of ovarian cancer survivors: Time to get moving? Gynecol. Oncol. 2015, 139, 148–154. [Google Scholar] [CrossRef]
- De Beer, M.; Hofsteenge, G.H.; Koot, H.M.; Hirasing, R.A.; Delemarre-Van De Waal, H.A.; Gemke, R.J.B.J. Health-related-quality-of-life in obese adolescents is decreased and inversely related to BMI. Acta Paediatr. Int. J. Paediatr. 2007, 96, 710–714. [Google Scholar] [CrossRef]
- Williams, J.; Wake, M.; Hesketh, K.; Maher, E.; Waters, E. Health-related quality of life of overweight and obese children. J. Am. Med. Assoc. 2005, 293, 70–76. [Google Scholar] [CrossRef] [Green Version]
- Hairi, N.N.; Bulgiba, A.; Cumming, R.G.; Naganathan, V.; Mudla, I. Relationship between obesity, hypertension and diabetes, and health-related quality of life among the elderly and Fernando Rodrı. BMC Public Health 2010, 10, 492. [Google Scholar]
- Kostka, T.; Bogus, K. Independent contribution of overweight/obesity and physical inactivity to lower health-related quality of life in community-dwelling older subjects. Z. Gerontol. Geriatr. 2007, 40, 43–51. [Google Scholar] [CrossRef]
- Hasselbalch, H.C.; Bjørn, M.E. MPNs as Inflammatory Diseases: The Evidence, Consequences, and Perspectives. Mediat. Inflamm. 2015. [Google Scholar] [CrossRef] [Green Version]
- Tefferi, A.; Vaidya, R.; Caramazza, D.; Finke, C.; Lasho, T.; Pardanani, A. Circulating interleukin (IL)-8, IL-2R, IL-12, and IL-15 levels are independently prognostic in primary myelofibrosis: A comprehensive cytokine profiling study. J. Clin. Oncol. 2011, 29, 1356–1363. [Google Scholar] [CrossRef] [PubMed]
- Vaidya, R.; Gangat, N.; Jimma, T.; Finke, C.M.; Lasho, T.L. Plasma cytokines in polycythemia vera: Phenotypic correlates, prognostic relevance, and comparison with myelofibrosis. Am. J. Hematol. 2012, 1003–1005. [Google Scholar] [CrossRef] [PubMed]
- Pourcelot, E.; Trocme, C.; Mondet, J. Cytokine profiles in polycythemia vera and essential thrombocythemia patients: Clinical implications. Exp. Hematol. 2019, 360–368. [Google Scholar] [CrossRef] [PubMed]
- Weisberg, S.P.; Leibel, R.L.; Ferrante, A.W., Jr.; Mccann, D.; Desai, M.; Rosenbaum, M.; Leibel, R.L.; Ferrante, A.W. Obesity is associated with macrophage accumulation in adipose tissue. J. Clin. Investig. 2003, 112, 1796–1808. [Google Scholar] [CrossRef] [PubMed]
- Xu, H.; Barnes, G.; Yang, Q.; Tan, G.; Louis, T.; Chen, H. Chronic inflammation in fat Plays a crucial role in development of obesity-related insulin resistance. Screen 2003, 112, 1821–1830. [Google Scholar] [CrossRef]
- Bower, J.E.; Ganz, P.A.; Irwin, M.R.; Kwan, L.; Breen, E.C.; Cole, S.W. Inflammation and Behavioral Symptoms After Breast Cancer Treatment: Do Fatigue, Depression, and Sleep Disturbance Share a Common Underlying Mechanism? J. Clin. Oncol. 2011, 29, 3517–3522. [Google Scholar] [CrossRef] [Green Version]
- Moon, Y.S.; Kim, D.H.; Song, D.K. Serum tumor necrosis factor-α levels and components of the metabolic syndrome in obese adolescents. Metabolism 2004, 53, 863–867. [Google Scholar] [CrossRef]
- De Luca, C.; Olefsky, J. Inflammation and Insulin Resistance. FEBS Lett. 2008, 582, 97–105. [Google Scholar] [CrossRef] [Green Version]
- Pickup, J.C. Inflammation and Activated Innate Immunity in the Pathogenesis of Type 2 Diabetes. Diabetes Care 2004, 27, 813–823. [Google Scholar] [CrossRef] [Green Version]
- Fritschi, C.; Quinn, L. Fatigue in patients with diabetes: A review. J. Psychosom. Res. 2010, 69, 33–41. [Google Scholar] [CrossRef] [Green Version]
- Bower, J.E.; Ganz, P.A.; Desmond, K.A.; Bernaards, C.; Rowland, J.H.; Meyerowitz, B.E.; Belin, T.R. Fatigue in long-term breast carcinoma survivors: A longitudinal investigation. Cancer 2006, 106, 751–758. [Google Scholar] [CrossRef]
- Fossa, S.D.; Dahl, A.A.; Loge, J.H. Fatigue, anxiety, and depression in long-term survivors of testicular cancer. J. Clin. Oncol. 2003, 21, 1249–1254. [Google Scholar] [CrossRef] [PubMed]
- Maes, M.; Bosmans, E.; De Jongh, R.; Kenis, G.; Vandoolaeghe, E.; Neels, H. Increased serum IL-6 and IL-1 receptor antagonist concentrations in major depression and treatment resistant depression. Cytokine 1997, 9, 853–858. [Google Scholar] [CrossRef] [PubMed]
- Wang, X.S.; Williams, L.A.; Krishnan, S.; Liao, Z.; Liu, P.; Mao, L.; Shi, Q.; Mobley, G.M.; Woodruff, J.F.; Cleeland, C.S. Serum sTNF-R1, IL-6, and the development of fatigue in patients with gastrointestinal cancer undergoing chemoradiation therapy. Brain Behav. Immun. 2012, 26, 699–705. [Google Scholar] [CrossRef] [PubMed] [Green Version]
- Musselman, D.L.; Miller, A.H.; Porter, M.R.; Manatunga, A.; Gao, F.; Penna, S.; Pearce, B.D.; Landry, J.; Glover, S.; McDaniel, J.S.; et al. Higher than normal plasma interleukin-6 concentrations in cancer patients with depression: Preliminary findings. Am. J. Psychiatry 2001, 158, 1252–1257. [Google Scholar] [CrossRef]
- Krabbe, K.S.; Reichenberg, A.; Yirmiya, R.; Smed, A.; Pedersen, B.K.; Bruunsgaard, H. Low-dose endotoxemia and human neuropsychological functions. Brain Behav. Immun. 2005, 19, 453–460. [Google Scholar] [CrossRef]
- Krabbe, K.S.; Pedersen, M.; Bruunsgaard, H. Inflammatory mediators in the elderly. Exp. Gerontol. 2004, 39, 687–699. [Google Scholar] [CrossRef]
- Zipp, F.; Aktas, O. The brain as a target of inflammation: Common pathways link inflammatory and neurodegenerative diseases. Trends Neurosci. 2006, 29, 518–527. [Google Scholar] [CrossRef]
- Meyers, C.A.; Albitar, M.; Estey, E. Cognitive impairment, fatigue, and cytokine levels in patients with acute myelogenous leukemia or myelodysplastic syndrome. Cancer 2005, 104, 788–793. [Google Scholar] [CrossRef]
- Lorem, G.F.; Schirmer, H.; Emaus, N. What is the impact of underweight on self-reported health trajectories and mortality rates: A cohort study. Health Qual. Life Outcomes 2017, 15, 1–14. [Google Scholar] [CrossRef]
- Katsura, H.; Yamada, K.; Kida, K. Both generic and disease specific health-related quality of life are deteriorated in patients with underweight COPD. Respir. Med. 2005, 99, 624–630. [Google Scholar] [CrossRef] [PubMed] [Green Version]
- Dobner, J.; Kaser, S. Body mass index and the risk of infection—From underweight to obesity. Clin. Microbiol. Infect. 2018, 24, 24–28. [Google Scholar] [CrossRef] [PubMed] [Green Version]
- Mattox, T.W. Cancer Cachexia: Cause, Diagnosis, and Treatment. Nutr. Clin. Pract. 2017, 32, 599–606. [Google Scholar] [CrossRef] [PubMed]
- Mesa, R.A.; Verstovsek, S.; Gupta, V.; Mascarenhas, J.O. Effects of Ruxolitinib Treatment on Metabolic and Nutritional Parameters in Patients With Myelofibrosis From COMFORT-I. Clin. Lymphoma Myeloma Leuk 2015, 15, 214–221. [Google Scholar] [CrossRef] [Green Version]
- Tefferi, A. Primary myelofibrosis: 2017 update on diagnosis, risk-stratification and management. Am. J. Hematol. 2016, 91, 1262–1271. [Google Scholar] [CrossRef]
- Tefferi, A.; Nicolosi, M.; Penna, D.; Mudireddy, M.; Szuber, N.; Lasho, T.L.; Hanson, C.A.; Ketterling, R.P.; Gangat, N.; Pardanani, A.D. Development of a prognostically relevant cachexia index in primary myelofibrosis using serum albumin and cholesterol levels. Blood Adv. 2018, 2, 1980–1984. [Google Scholar] [CrossRef]
- Fearon, K.C.H.; Glass, D.J.; Guttridge, D.C. Cancer cachexia: Mediators, signaling and metabolic pathways. Cell Metab. 2012, 16, 153–166. [Google Scholar] [CrossRef] [Green Version]
- Chrysohoou, C.; Panagiotakos, D.B.; Pitsavos, C.; Das, U.N.; Stefanadis, C. Adherence to the Mediterranean diet attenuates inflammation and coagulation process in healthy adults: The ATTICA study. J. Am. Coll. Cardiol. 2004, 44, 152–158. [Google Scholar] [CrossRef] [Green Version]
- Flynn, M.G.; McFarlin, B.K. Toll-like receptor 4: Link to the anti-inflammatory effects of exercise? Exerc. Sport Sci. Rev. 2006, 34, 176–181. [Google Scholar] [CrossRef]
- Shivappa, N.; Hebert, J.; Marcos, A.; Diaz, L.-E.; Gomez, S.; Nova, E.; Michels, N.; Arouca, A.; González-Gil, E.; Frederic, G.; et al. Association between dietary inflammatory index and inflammatory markers in the HELENA study. Mol. Nutr. Food Res. 2018, 61, 1–18. [Google Scholar] [CrossRef]
- Shivappa, N.; Hébert, J.R.; Rietzschel, E.R.; de Buyzere, M.L.; Debruyne, E.; Marcos, A.; Huybrechts, I. Associations between dietary inflammatory index and inflammatory markers in the Asklepios Study. Br. J. Nutr. 2016, 113, 665–671. [Google Scholar] [CrossRef] [PubMed] [Green Version]
- Gleeson, M.; Bishop, N.C.; Stensel, D.J.; Lindley, M.R.; Mastana, S.S.; Nimmo, M.A. The anti-inflammatory effects of exercise: Mechanisms and implications for the prevention and treatment of disease. Nat. Rev. Immunol. 2011, 11, 607–610. [Google Scholar] [CrossRef] [PubMed]
- Mathur, N.; Pedersen, B.K. Exercise as a Mean to Control Low-Grade Systemic Inflammation. Mediat. Inflamm. 2008, 2008, 1–6. [Google Scholar] [CrossRef] [Green Version]
- Mishra, S.; Scherer, R.; Snyder, C.; Geigle, P.; Topaloglu, O. Exercise interventions on health-related quality of life for people with cancer during active treatment (Review). Cochrane Collab. 2012. [Google Scholar] [CrossRef]
- Kurzrock, R. The role of cytokines in cancer-related fatigue. Cancer 2001, 92, 1684–1688. [Google Scholar] [CrossRef]
- Ran, J.; Wang, J.; Bi, N.; Jiang, W.; Zhou, Z.; Hui, Z.; Liang, J.; Feng, Q.; Wang, L. Health-related quality of life in long-term survivors of unresectable locally advanced non-small cell lung cancer. Radiat. Oncol. 2017, 12, 1–8. [Google Scholar] [CrossRef] [Green Version]
- García-Morales, J.M.; Lozada-Mellado, M.; Hinojosa-Azaola, A.; Llorente, L.; Ogata-Medel, M.; Pineda-Juárez, J.A.; Alcocer-Varela, J.; Cervantes-Gaytán, R.; Castillo-Martínez, L. Effect of a Dynamic Exercise Program in Combination With Mediterranean Diet on Quality of Life in Women With Rheumatoid Arthritis. JCR J. Clin. Rheumatol. 2019. [Google Scholar] [CrossRef]
- Surapaneni, P.; Scherber, R.M. Integrative Approaches to Managing Myeloproliferative Neoplasms: The Role of Nutrition, Exercise and Psychological Interventions. Curr. Hematol. Malig. Rep. 2019, 14. [Google Scholar] [CrossRef]
- Huberty, J.; Eckert, R.; Gowin, K.; Mitchell, J.; Dueck, A.C.; Ginos, B.F.; Larkey, L.; Mesa, R. Feasibility study of online yoga for symptom management in patients with myeloproliferative neoplasms. Haematologica 2017, 36, 308–312. [Google Scholar] [CrossRef] [Green Version]
- Pedersen, K.M.; Zangger, G.; Brochmann, N.; Grønfeldt, B.M.; Zwisler, A.-D.; Hasselbalch, H.C.; Tang, L.H. The effectiveness of exercise-based rehabilitation to patients with myeloproliferative neoplasms-An explorative study. Eur. J. Cancer Care (Engl.) 2018, e12865. [Google Scholar] [CrossRef]
- Eckert, R.; Huberty, J.; Gowin, K.; Mesa, R.; Marks, L. Physical Activity as a Nonpharmacological Symptom Management Approach in Myeloproliferative Neoplasms: Recommendations for Future Research. Integr. Cancer Ther. 2017, 16, 439–450. [Google Scholar] [CrossRef] [PubMed]
- Scherber, R.M.; Langlais, B.T.; Geyer, H.; Dueck, A.; Kosoriek, H.; Johnston, C.; Padrnos, L.; Palmer, J.; Fleischman, A.G.; Mesa, R.A. Nutrition and Supplement Use Characteristics in the Myeloproliferative Neoplasms: Results from the Nutrient Survey. Blood 2017, 130, 2193. [Google Scholar]
- Wild, D.; Grove, A.; Martin, M.; Eremenco, S.; McElroy, S.; Verjee-Lorenz, A.; Erikson, P. Principles of good practice for the translation and cultural adaptation process for patient-reported outcomes (PRO) measures: Report of the ISPOR Task Force for Translation and Cultural Adaptation. Value Health 2005, 8, 94–104. [Google Scholar] [CrossRef] [Green Version]
- Brochmann, N.; Flachs, E.M.; Christensen, A.I.; Andersen, C.L.; Juel, K.; Hasselbalch, H.C.; Zwisler, A.D. A nationwide population-based cross-sectional survey of health-related quality of life in patients with myeloproliferative neoplasms in Denmark (MPNhealthSurvey): Survey design and characteristics of respondents and nonrespondents. Clin. Epidemiol. 2017, 9, 141–150. [Google Scholar] [CrossRef] [PubMed] [Green Version]
- Schmidt, M.; Alba, S.; Schmidt, J.; Sandegaard, J.L.; Ehrenstein, V.; Pedersen, L.; Toft Sørensen, H. The Danish National Patient Registry: A review of content, data quality, and research potential. Clin. Epidemiol. 2015, 7, 449–490. [Google Scholar] [CrossRef] [PubMed] [Green Version]
- Schmidt, M.; Pedersen, L.; Sørensen, H.T. The Danish Civil Registration System as a tool in epidemiology. Eur. J. Epidemiol. 2014, 29, 541–549. [Google Scholar] [CrossRef] [PubMed]
- National Committee on Health Reserch Ethics. Act on Research Ethics Review of Health Research Projects. Available online: https://en.nvk.dk/rules-and-guidelines/act-on-research-ethics-review-of-health-research-projects (accessed on 9 June 2020).
- Consultation, W.H.O. Obesity: Preventing and managing the global epidemic: Report of a WHO consultation. World Health Organ. 2000, 894, 8–9. [Google Scholar]
- Gelfond, J.; Goros, M.; Hernandez, B.; Bokov, A. A System for an Accountable Data Analysis Process in R Jonathan. R J. 2018, 10, 6–21. [Google Scholar] [CrossRef] [Green Version]


| Demographics | MPN Health Survey n = 2044 | The Fatigue Study n = 1070 | Total n = 3114 | p-Value |
|---|---|---|---|---|
| Age (mean, sd) | 69.0 (12.3) | 58.8 (11.6) | 65.5 (13.0) | <0.0001 |
| Gender (N, %) | <0.0001 | |||
| Female | 1150 (56.3) | 702 (66.0) | 1852 (59.6) | |
| Male | 894 (43.7) | 362 (34.0) | 1256 (40.4) | |
| MPN subtype (n, %) | <0.0001 | |||
| ET | 697 (34.1) | 350 (32.8) | 1047 (33.7) | |
| PV | 878 (43.0) | 423 (39.6) | 1301 (41.8) | |
| MF | 68 (3.3) | 262 (24.6) | 330 (10.6) | |
| MPN-U | 401 (19.6) | 32 (3.0) | 433 (13.9) | |
| Disease duration (n, %) | <0.0001 | |||
| <½ years | 13 (0.6) | 54 (5.1) | 67 (2.2) | |
| ½–1 years | 136 (6.7) | 43 (4.0) | 179 (5.8) | |
| 1–3 years | 407 (19.9) | 216 (20.2) | 623 (20.0) | |
| >3 years | 1488 (72.8) | 754 (70.7) | 2242 (72.1) | |
| BMI (BMI, sd) | <0.0001 | |||
| <18.5 | 54 (2.6) | 18 (1.7) | 72 (2.3) | |
| 18.5–24.9 | 1072 (52.4) | 495 (46.3) | 1567 (50.3) | |
| 25.0–29.9 | 648 (31.7) | 335 (31.3) | 983 (31.6) | |
| ≥30 | 270 (13.2) | 222 (20.7) | 492 (15.8) |
| MPN-SAF Item | Underweight n = 72 | Normal Weight n = 1567 | Overweight n = 983 | Obese n = 492 | p-Value |
|---|---|---|---|---|---|
| Fatigue (BFI score) | 4.36 (3.39) | 4.08 (3.14) | 4.26 (3.14) | 5.25 (3.11) | <0.001 |
| Early satiety | 3.86 (3.05) | 2.58 (2.70) | 2.56 (2.62) | 2.91 (2.70) | <0.001 |
| Abdominal pain | 1.75 (2.63) | 1.27 (2.17) | 1.34 (2.17) | 1.80 (2.40) | <0.001 |
| Abdominal discomfort | 2.26 (2.66) | 1.78 (2.45) | 1.93 (2.44) | 2.33 (2.64) | <0.001 |
| Inactivity | 3.12 (3.00) | 2.38 (2.63) | 2.65 (2.72) | 3.66 (2.89) | <0.001 |
| Headache | 1.90 (2.87) | 1.76 (2.57) | 1.88 (2.58) | 2.38 (2.90) | <0.001 |
| Concentration problems | 3.09 (3.12) | 2.69 (2.82) | 2.92 (2.88) | 3.59 (3.12) | <0.001 |
| Dizziness | 2.71 (2.68) | 2.24 (2.59) | 2.32 (2.57) | 2.82 (2.88) | 0.001 |
| Numbness | 2.83 (3.24) | 2.25 (2.82) | 2.34 (2.85) | 3.19 (3.15) | <0.001 |
| Insomnia | 3.54 (3.25) | 3.04 (2.99) | 3.19 (3.11) | 3.97 (3.22) | <0.001 |
| Sad mood | 2.67 (2.74) | 2.40 (2.71) | 2.49 (2.71) | 3.17 (2.88) | <0.001 |
| Sexuality problems | 3.29 (3.85) | 3.46 (3.61) | 3.91 (3.66) | 4.37 (3.79) | <0.001 |
| Cough | 2.56 (2.98) | 1.61 (2.36) | 1.80 (2.46) | 2.37 (2.80) | <0.001 |
| Night sweats | 2.33 (3.00) | 2.40 (2.83) | 2.72 (3.02) | 3.28 (3.16) | <0.001 |
| Itching | 1.91 (2.48) | 2.09 (2.74) | 2.52 (2.96) | 3.03 (3.12) | <0.001 |
| Bone pain | 2.40 (3.17) | 1.84 (2.70) | 2.08 (2.86) | 2.96 (3.18) | <0.001 |
| Fever | 0.42 (1.12) | 0.31 (1.13) | 0.32 (1.03) | 0.42 (1.30) | 0.057 |
| Weight loss | 3.41 (3.52) | 1.24 (2.34) | 0.61 (1.66) | 0.54 (1.71) | <0.001 |
| Quality of life | 3.61 (2.71) | 2.90 (2.44) | 3.08 (2.51) | 3.50 (2.49) | <0.001 |
| Total Symptom Score | 26.65 (17.27) | 21.39 (16.38) | 22.57 (16.66) | 27.95 (17.06) | <0.001 |
| MPN-SAF Item | Underweight (n = 72) | Normal Weight (n = 1567) | Overweight (n = 983) | Obese (n = 492) | p-Value |
|---|---|---|---|---|---|
| Fatigue (BFI score) | 54 (78.3) | 1238 (80.3) | 795 (82.1) | 434 (89.5) | <0.001 |
| Early satiety | 53 (76.8) | 961 (62.4) | 610 (62.7) | 331 (67.7) | 0.018 |
| Abdominal pain | 31 (44.9) | 590 (38.2) | 397 (41.0) | 244 (50.1) | <0.001 |
| Abdominal discomfort | 41 (59.4) | 773 (50.0) | 521 (53.8) | 295 (60.5) | <0.001 |
| Inactivity | 45 (69.2) | 932 (61.5) | 609 (64.4) | 366 (76.7) | <0.001 |
| Headache | 31 (44.9) | 741 (47.7) | 492 (50.4) | 280 (57.4) | 0.002 |
| Concentration problems | 48 (68.6) | 979 (63.5) | 645 (67.0) | 352 (72.6) | 0.003 |
| Dizziness | 49 (70.0) | 937 (60.7) | 618 (63.5) | 326 (66.5) | 0.057 |
| Numbness | 41 (59.4) | 843 (54.5) | 542 (55.8) | 328 (67.2) | <0.001 |
| Insomnia | 49 (71.0) | 1054 (68.2) | 671 (68.9) | 374 (76.8) | 0.004 |
| Sad mood | 50 (71.4) | 957 (62.0) | 612 (62.9) | 356 (72.7) | <0.001 |
| Sexuality problems | 36 (55.4) | 943 (62.7) | 642 (67.7) | 340 (71.0) | 0.001 |
| Cough | 45 (64.3) | 726 (47.0) | 488 (50.2) | 285 (58.2) | <0.001 |
| Night sweats | 37 (52.9) | 918 (59.4) | 598 (61.5) | 342 (69.5) | <0.001 |
| Itching | 38 (54.3) | 822 (53.4) | 581 (59.8) | 327 (66.6) | <0.001 |
| Bone pain | 35 (50.0) | 706 (45.9) | 461 (47.6) | 296 (60.9) | <0.001 |
| Fever | 14 (20.3) | 191 (12.4) | 146 (15.1) | 77 (15.8) | 0.047 |
| Weight loss | 44 (62.0) | 493 (31.9) | 174 (17.8) | 78 (16.0) | <0.001 |
| Quality of life | 58 (82.9) | 1224 (79.2) | 783 (80.6) | 411 (84.0) | 0.123 |
| MPN-SAF Item | Underweight 1 | Overweight 1 | Obese 1 | ||||||
|---|---|---|---|---|---|---|---|---|---|
| Difference (%) | Mean Difference (CI95%) | p-Value (Mean) | Difference (%) | Mean Difference (CI95%) | p-Value (Mean) | Difference (%) | Mean Difference (CI95%) | p-Value (Mean) | |
| Fatigue (BFI score) | 10.0 | 0.41 (−0.32, 1.13) | 0.269 | 4.9 | 0.20 (−0.04, 0.45) | 0.098 | 23.3 | 0.95 (0.65, 1.26) | <0.001 |
| Early satiety | 48.4 | 1.25 (0.61, 1.9) | <0.001 | 0.4 | 0.01 (−0.20, 0.23) | 0.893 | 12.8 | 0.33 (0.05, 0.6) | 0.02 |
| Abdominal pain | 37.8 | 0.48 (−0.05, 1.01) | 0.078 | 7.9 | 0.10 (−0.07, 0.28) | 0.251 | 36.2 | 0.46 (0.23, 0.69) | <0.001 |
| Abdominal discomfort | 27.0 | 0.48 (−0.11, 1.07) | 0.11 | 10.7 | 0.19 (−0.01, 0.39) | 0.062 | 25.8 | 0.46 (0.21, 0.71) | <0.001 |
| Inactivity | 31.9 | 0.76 (0.09, 1.43) | 0.026 | 10.5 | 0.25 (0.03, 0.48) | 0.025 | 51.3 | 1.22 (0.94, 1.5) | <0.001 |
| Headache | 9.1 | 0.16 (−0.44, 0.77) | 0.599 | 8.0 | 0.14 (−0.06, 0.35) | 0.164 | 22.7 | 0.4 (0.15, 0.66) | 0.002 |
| Concentration problems | 17.1 | 0.46 (−0.21, 1.13) | 0.18 | 8.2 | 0.22 (0.00, 0.45) | 0.054 | 26.4 | 0.71 (0.42, 1) | <0.001 |
| Dizziness | 20.5 | 0.46 (−0.17, 1.09) | 0.149 | 5.8 | 0.13 (−0.08, 0.35) | 0.214 | 23.2 | 0.52 (0.25, 0.79) | <0.001 |
| Numbness | 24.4 | 0.55 (−0.14, 1.25) | 0.12 | 5.8 | 0.13 (−0.10, 0.37) | 0.267 | 40.0 | 0.9 (0.6, 1.2) | <0.001 |
| Insomnia | 14.1 | 0.43 (−0.3, 1.16) | 0.246 | 8.2 | 0.25 (0.01, 0.50) | 0.042 | 25.3 | 0.77 (0.46, 1.08) | <0.001 |
| Sad mood | 13.8 | 0.33 (−0.31, 0.98) | 0.311 | 4.2 | 0.10 (−0.12, 0.32) | 0.375 | 26.7 | 0.64 (0.37, 0.92) | <0.001 |
| Sexuality problems | −1.4 | −0.05 (−0.96, 0.85) | 0.91 | 9.8 | 0.34 (0.04, 0.64) | 0.026 | 25.7 | 0.89 (0.52, 1.27) | <0.001 |
| Cough | 57.8 | 0.93 (0.33, 1.52) | 0.002 | 11.2 | 0.18 (−0.02, 0.38) | 0.081 | 47.8 | 0.77 (0.52, 1.03) | <0.001 |
| Night sweats | −5.0 | −0.12 (−0.82, 0.58) | 0.728 | 15.8 | 0.38 (0.14, 0.62) | 0.002 | 33.8 | 0.81 (0.51, 1.11) | <0.001 |
| Itching | −8.6 | −0.18 (−0.86, 0.5) | 0.606 | 21.1 | 0.44 (0.21, 0.67) | <0.001 | 41.1 | 0.86 (0.57, 1.15) | <0.001 |
| Bone pain | 29.3 | 0.54 (−0.13, 1.21) | 0.114 | 16.8 | 0.31 (0.08, 0.54) | 0.007 | 53.3 | 0.98 (0.69, 1.26) | <0.001 |
| Fever | 38.7 | 0.12 (−0.15, 0.39) | 0.376 | 0.0 | 0.00 (−0.09, 0.09) | 0.939 | 29.0 | 0.09 (−0.03, 0.2) | 0.142 |
| Weight loss | 176.6 | 2.19 (1.69, 2.68) | <0.001 | −53.2 | −0.66 (−0.83, −0.49) | <0.001 | −52.4 | −0.65 (−0.86, −0.44) | <0.001 |
| Quality of life | 25.9 | 0.75 (0.16, 1.33) | 0.013 | 6.6 | 0.19 (0.00, 0.39) | 0.055 | 17.9 | 0.52 (0.27, 0.77) | <0.001 |
| Total Symptom Score | 25.1 | 5.37 (1.47, 9.27) | 0.007 | 6.4 | 1.36 (0.04, 2.67) | 0.044 | 26.8 | 5.73 (4.07, 7.39) | <0.001 |
© 2020 by the authors. Licensee MDPI, Basel, Switzerland. This article is an open access article distributed under the terms and conditions of the Creative Commons Attribution (CC BY) license (http://creativecommons.org/licenses/by/4.0/).
Share and Cite
Christensen, S.F.; Scherber, R.M.; Brochmann, N.; Goros, M.; Gelfond, J.; Andersen, C.L.; Flachs, E.M.; Mesa, R. Body Mass Index and Total Symptom Burden in Myeloproliferative Neoplasms Discovery of a U-shaped Association. Cancers 2020, 12, 2202. https://0-doi-org.brum.beds.ac.uk/10.3390/cancers12082202
Christensen SF, Scherber RM, Brochmann N, Goros M, Gelfond J, Andersen CL, Flachs EM, Mesa R. Body Mass Index and Total Symptom Burden in Myeloproliferative Neoplasms Discovery of a U-shaped Association. Cancers. 2020; 12(8):2202. https://0-doi-org.brum.beds.ac.uk/10.3390/cancers12082202
Chicago/Turabian StyleChristensen, Sarah Friis, Robyn Marie Scherber, Nana Brochmann, Martin Goros, Jonathan Gelfond, Christen Lykkegaard Andersen, Esben Meulengracht Flachs, and Ruben Mesa. 2020. "Body Mass Index and Total Symptom Burden in Myeloproliferative Neoplasms Discovery of a U-shaped Association" Cancers 12, no. 8: 2202. https://0-doi-org.brum.beds.ac.uk/10.3390/cancers12082202