
Small Extracellular Vesicle-Derived microRNAs Stratify Prostate Cancer Patients According to Gleason Score, Race and Associate with Survival of African American and Caucasian Men

 , ,
, ,  , , ,
, , ,
Abstract
:Simple Summary
Abstract
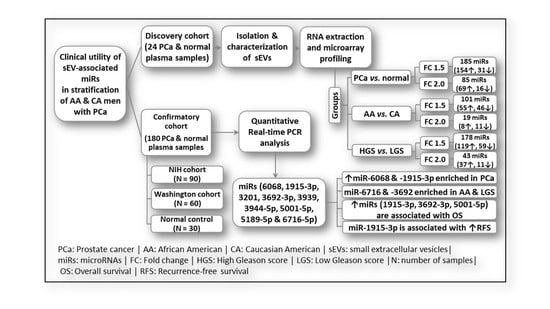
1. Introduction
2. Results
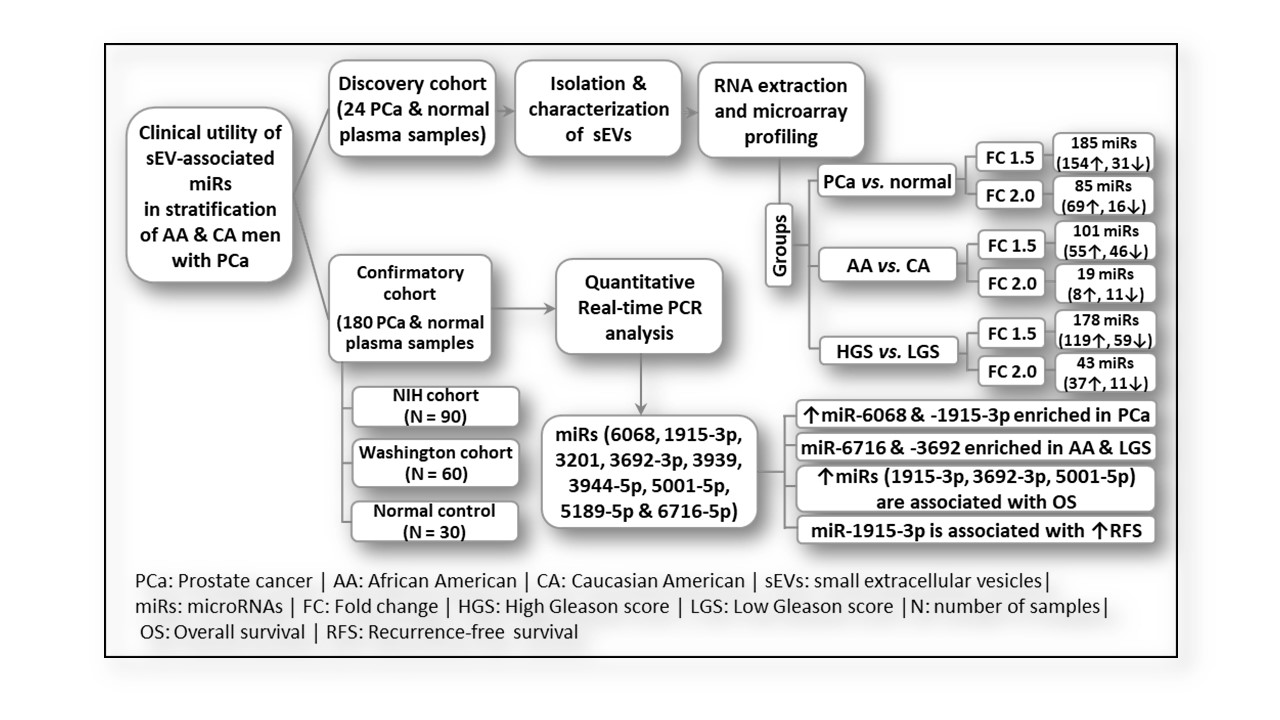
2.1. Characterization of Small Extracellular Vesicles
2.2. sEV-Associated miR Profiling
2.3. Pathway Prediction of sEV-Associated miRs
2.4. Differential Expression of sEV-Associated miRs in PCa Patients Compared to Normal Individuals in the Confirmatory Cohorts
2.5. sEV-Associated miRs Discriminating PCa Patients from Normal Subjects with High Accuracy
2.6. Differential Packaging of sEV-Associated miRs in AA versus CA PCa Patients
2.7. sEV-Associated miRs Discriminating AA PCa Patients from CA PCa Patients
2.8. Differential Packaging of sEV-Associated miRs in PCa Patients Based on Gleason Score (GS)
2.9. The Ability of sEV-Associated miRs to Stratify PCa Patients According to Their Gleason Scores
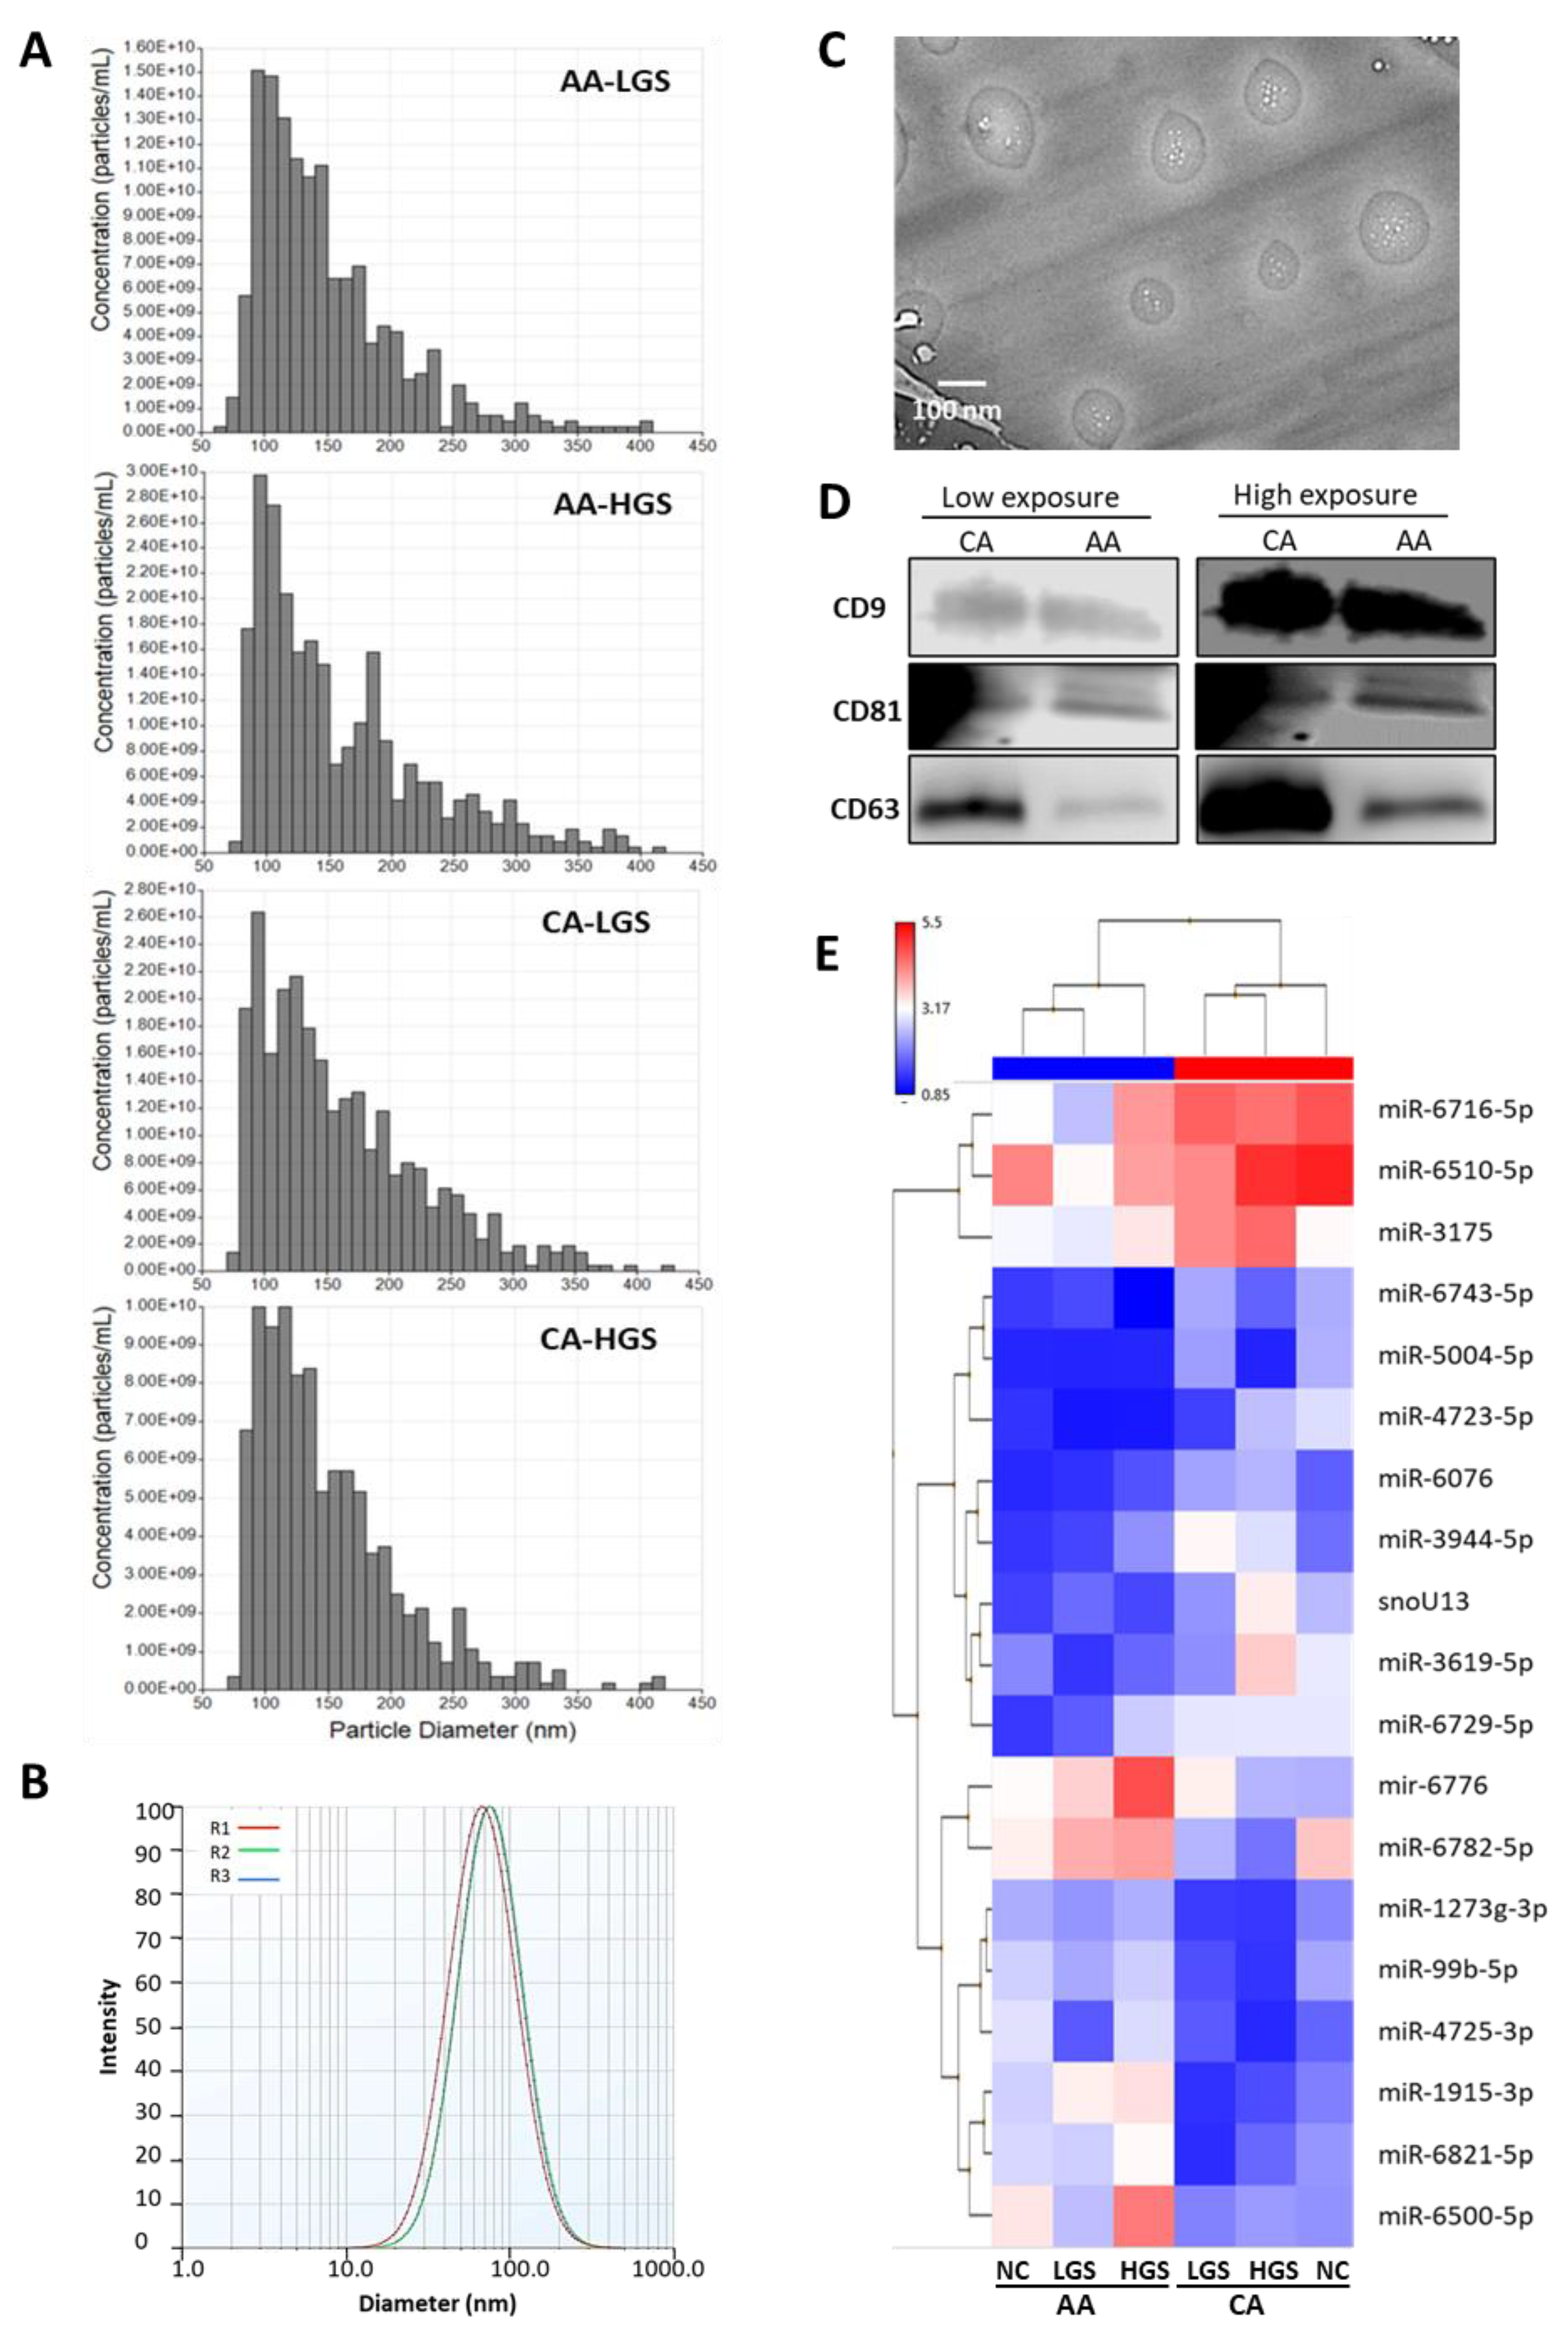
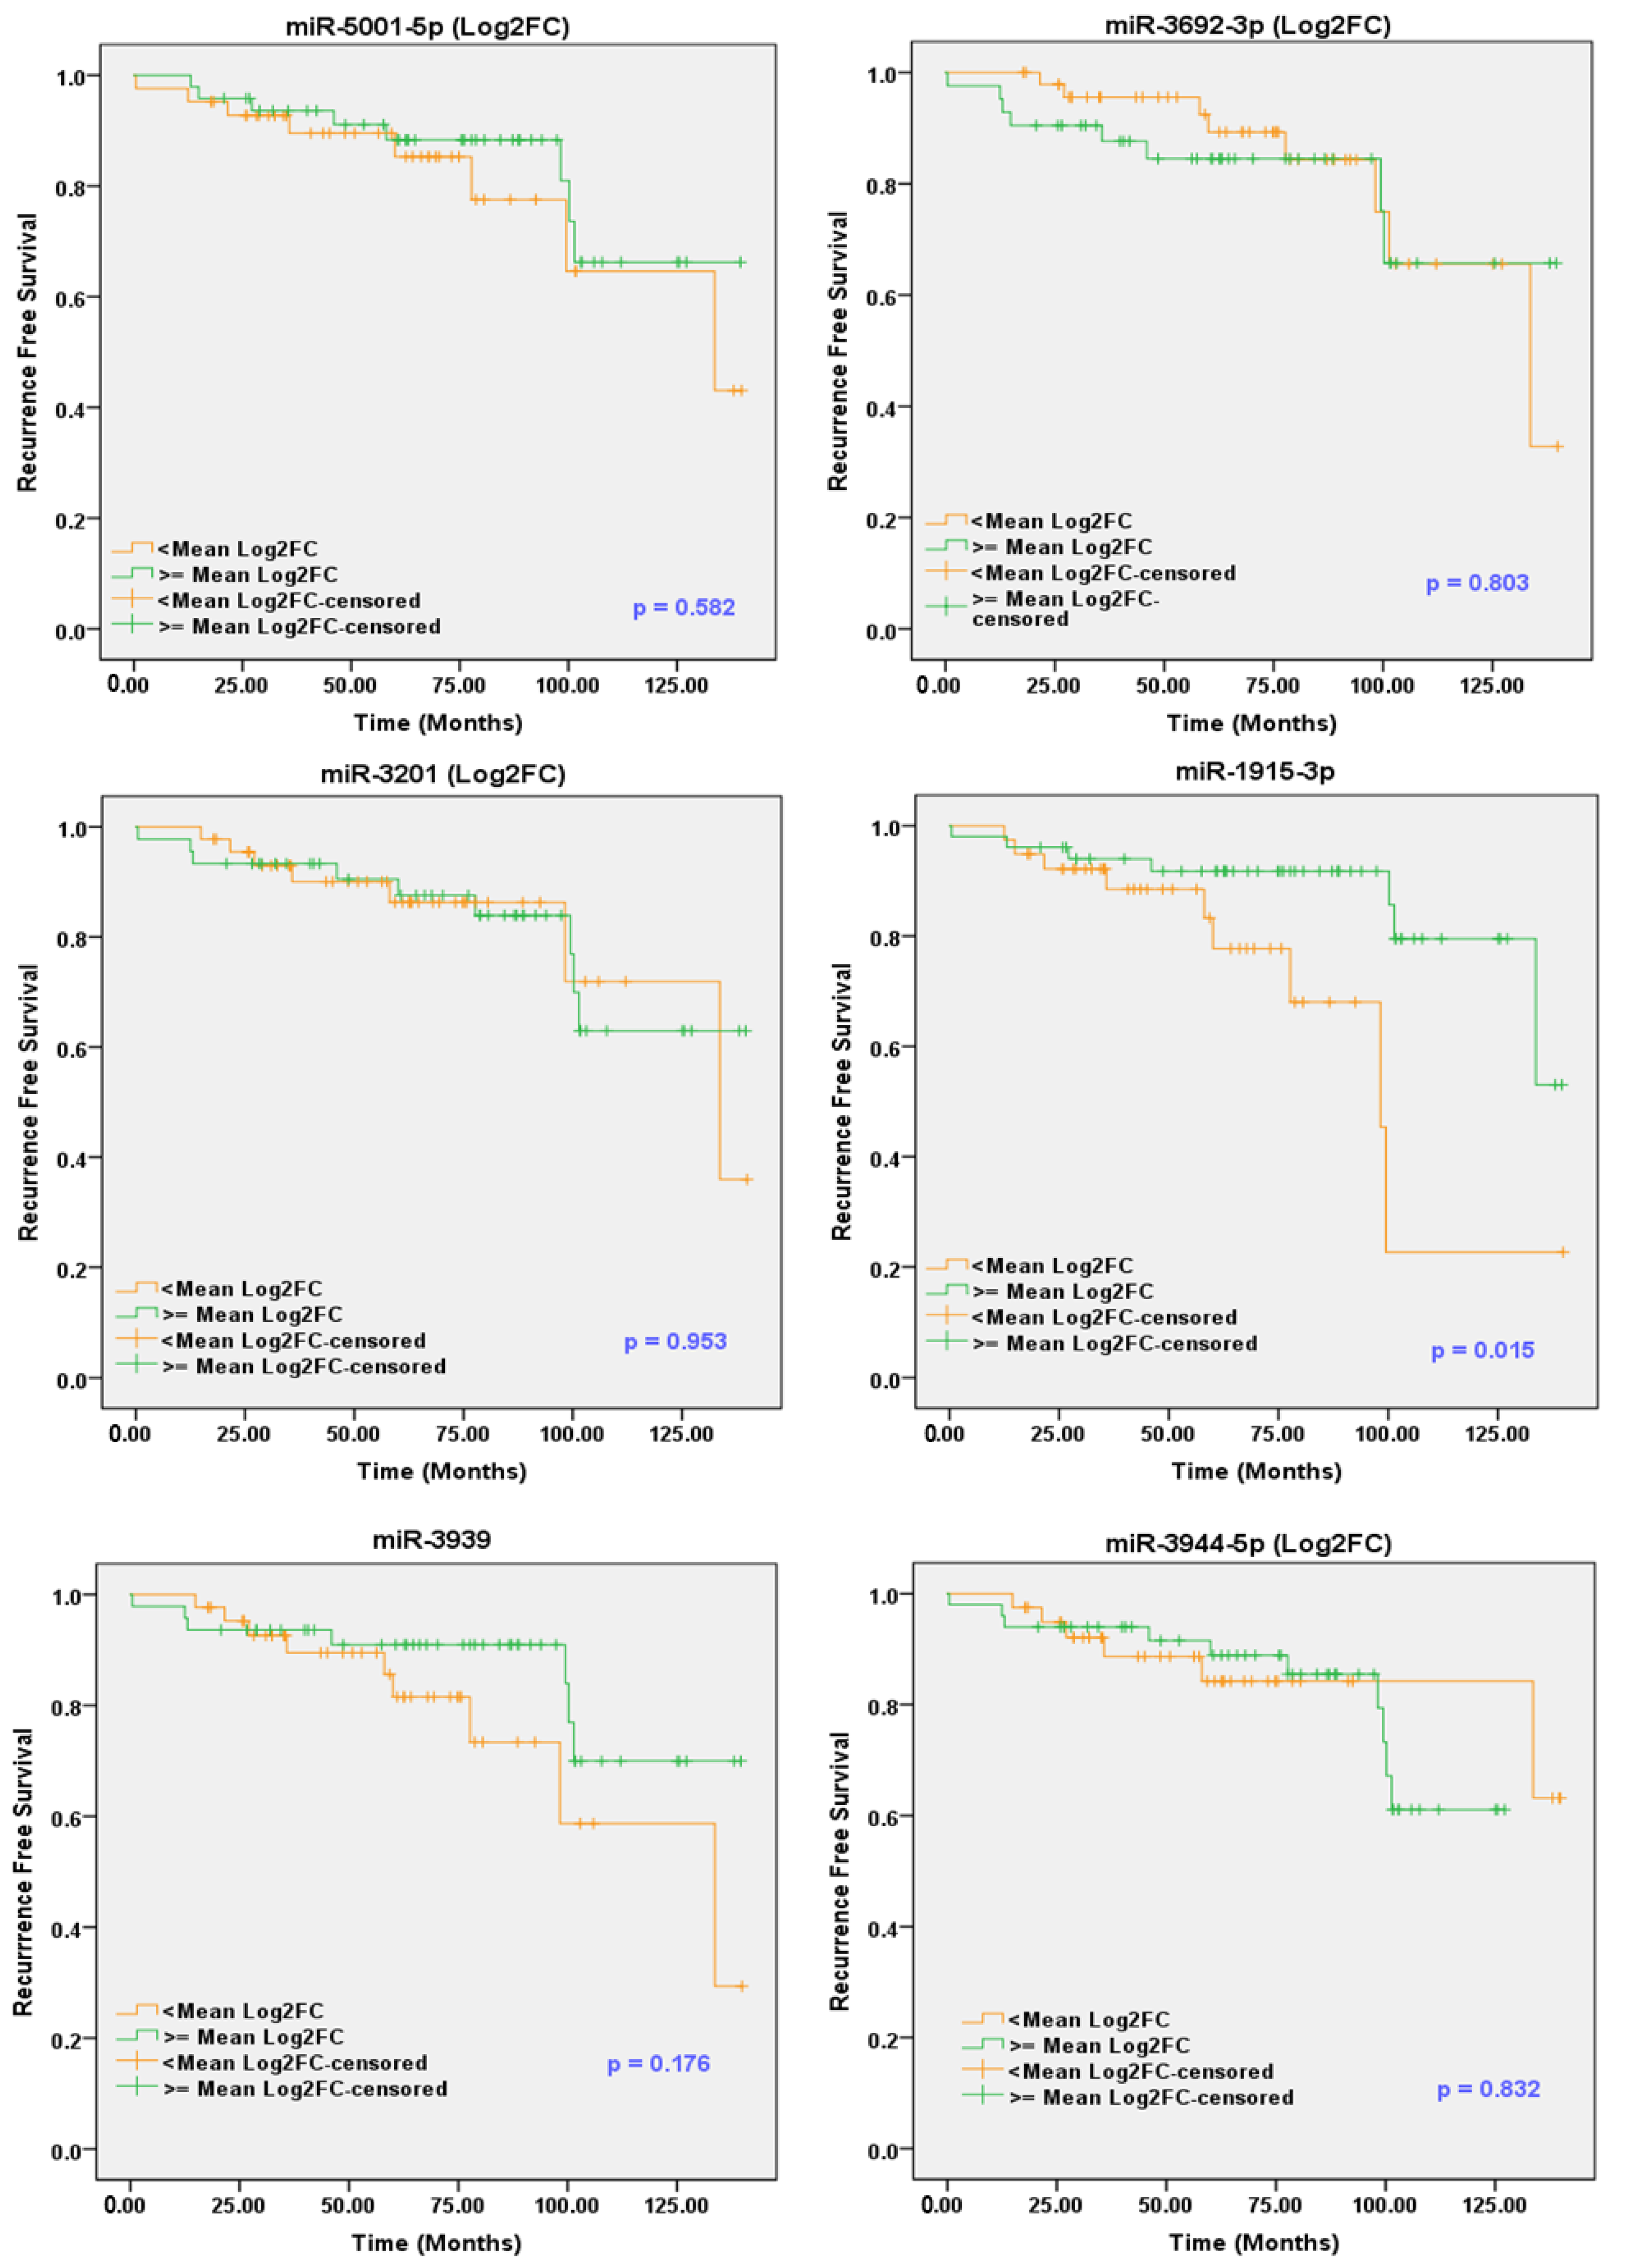
2.10. sEV-Associated miRs as Potential Prognostic Markers for PCa
3. Discussion
4. Materials and Methods
4.1. Clinical Samples
4.2. Isolation and Characterization of sEVs, and Extraction of sEV-Associated RNA
4.3. Western Blot Analysis
4.4. microRNA Profiling of sEVs (Discovery Cohort)
4.5. Validation of the Differentially Packaged miRs by qPCR (Confirmatory Cohorts)
4.6. Pathway Prediction for sEV-Associated miRs
4.7. Statistical Analysis
5. Conclusions
Supplementary Materials
Author Contributions
Funding
Institutional Review Board Statement
Informed Consent Statement
Data Availability Statement
Acknowledgments
Conflicts of Interest
References
- Siegel, R.L.; Miller, K.D.; Fuchs, H.E.; Jemal, A. Cancer Statistics, 2021. CA Cancer J. Clin. 2021, 71, 7–33. [Google Scholar] [CrossRef]
- Cyll, K.; Ersvaer, E.; Vlatkovic, L.; Pradhan, M.; Kildal, W.; Avranden Kjaer, M.; Kleppe, A.; Hveem, T.S.; Carlsen, B.; Gill, S.; et al. Tumour heterogeneity poses a significant challenge to cancer biomarker research. Br. J. Cancer 2017, 117, 367–375. [Google Scholar] [CrossRef] [Green Version]
- Prensner, J.R.; Rubin, M.A.; Wei, J.T.; Chinnaiyan, A.M. Beyond PSA: The next generation of prostate cancer biomarkers. Sci. Transl. Med. 2012, 4, 127rv123. [Google Scholar] [CrossRef] [Green Version]
- Caram, M.E.; Skolarus, T.A.; Cooney, K.A. Limitations of Prostate-specific Antigen Testing after a Prostate Cancer Diagnosis. Eur. Urol. 2016, 70, 209–210. [Google Scholar] [CrossRef]
- Kheirandish, P.; Chinegwundoh, F. Ethnic differences in prostate cancer. Br. J. Cancer 2011, 105, 481–485. [Google Scholar] [CrossRef] [PubMed] [Green Version]
- Powell, I.J.; Bock, C.H.; Ruterbusch, J.J.; Sakr, W. Evidence supports a faster growth rate and/or earlier transformation to clinically significant prostate cancer in black than in white American men, and influences racial progression and mortality disparity. J. Urol. 2010, 183, 1792–1796. [Google Scholar] [CrossRef] [PubMed] [Green Version]
- Powell, I.J.; Banerjee, M.; Novallo, M.; Sakr, W.; Grignon, D.; Wood, D.P.; Pontes, J.E. Prostate cancer biochemical recurrence stage for stage is more frequent among African-American than white men with locally advanced but not organ-confined disease. Urology 2000, 55, 246–251. [Google Scholar] [CrossRef]
- Thery, C.; Witwer, K.W.; Aikawa, E.; Alcaraz, M.J.; Anderson, J.D.; Andriantsitohaina, R.; Antoniou, A.; Arab, T.; Archer, F.; Atkin-Smith, G.K.; et al. Minimal information for studies of extracellular vesicles 2018 (MISEV2018): A position statement of the International Society for Extracellular Vesicles and update of the MISEV2014 guidelines. J. Extracell. Vesicles 2018, 7, 1535750. [Google Scholar] [CrossRef] [Green Version]
- Mathivanan, S.; Fahner, C.J.; Reid, G.E.; Simpson, R.J. ExoCarta 2012: Database of exosomal proteins, RNA and lipids. Nucleic Acids Res. 2012, 40, D1241–D1244. [Google Scholar] [CrossRef] [Green Version]
- Zhao, H.; Yang, L.; Baddour, J.; Achreja, A.; Bernard, V.; Moss, T.; Marini, J.C.; Tudawe, T.; Seviour, E.G.; San Lucas, F.A.; et al. Tumor microenvironment derived exosomes pleiotropically modulate cancer cell metabolism. Elife 2016, 5, e10250. [Google Scholar] [CrossRef]
- Wang, Y.; Wang, L.; Chen, C.; Chu, X. New insights into the regulatory role of microRNA in tumor angiogenesis and clinical implications. Mol. Cancer 2018, 17, 22. [Google Scholar] [CrossRef] [Green Version]
- Urabe, F.; Matsuzaki, J.; Yamamoto, Y.; Kimura, T.; Hara, T.; Ichikawa, M.; Takizawa, S.; Aoki, Y.; Niida, S.; Sakamoto, H.; et al. Large-scale Circulating microRNA Profiling for the Liquid Biopsy of Prostate Cancer. Clin. Cancer Res. 2019, 25, 3016–3025. [Google Scholar] [CrossRef] [PubMed] [Green Version]
- Gaballa, R.; Ali, H.E.A.; Mahmoud, M.O.; Rhim, J.S.; Ali, H.I.; Salem, H.F.; Saleem, M.; Kandeil, M.A.; Ambs, S.; Abd Elmageed, Z.Y. Exosomes-Mediated Transfer of Itga2 Promotes Migration and Invasion of Prostate Cancer Cells by Inducing Epithelial-Mesenchymal Transition. Cancers 2020, 12, 2300. [Google Scholar] [CrossRef]
- Chen, X.; Liu, J.; Zhang, Q.; Liu, B.; Cheng, Y.; Zhang, Y.; Sun, Y.; Ge, H.; Liu, Y. Exosome-mediated transfer of miR-93-5p from cancer-associated fibroblasts confer radioresistance in colorectal cancer cells by downregulating FOXA1 and upregulating TGFB3. J. Exp. Clin. Cancer Res. 2020, 39, 65. [Google Scholar] [CrossRef]
- Liang, Y.; Huang, S.; Qiao, L.; Peng, X.; Li, C.; Lin, K.; Xie, G.; Li, J.; Lin, L.; Yin, Y.; et al. Characterization of protein, long noncoding RNA and microRNA signatures in extracellular vesicles derived from resting and degranulated mast cells. J. Extracell. Vesicles 2020, 9, 1697583. [Google Scholar] [CrossRef] [PubMed]
- Canlorbe, G.; Wang, Z.; Laas, E.; Bendifallah, S.; Castela, M.; Lefevre, M.; Chabbert-Buffet, N.; Darai, E.; Aractingi, S.; Mehats, C.; et al. Identification of microRNA expression profile related to lymph node status in women with early-stage grade 1-2 endometrial cancer. Mod. Pathol. 2016, 29, 391–401. [Google Scholar] [CrossRef] [PubMed] [Green Version]
- Pu, Q.; Huang, Y.; Lu, Y.; Peng, Y.; Zhang, J.; Feng, G.; Wang, C.; Liu, L.; Dai, Y. Tissue-specific and plasma microRNA profiles could be promising biomarkers of histological classification and TNM stage in non-small cell lung cancer. Thorac. Cancer 2016, 7, 348–354. [Google Scholar] [CrossRef] [PubMed]
- Yan, S.; Han, B.; Gao, S.; Wang, X.; Wang, Z.; Wang, F.; Zhang, J.; Xu, D.; Sun, B. Exosome-encapsulated microRNAs as circulating biomarkers for colorectal cancer. Oncotarget 2017, 8, 60149–60158. [Google Scholar] [CrossRef] [PubMed] [Green Version]
- Lu, X.; Xu, C.; Xu, Z.; Lu, C.; Yang, R.; Zhang, F.; Zhang, G. Piperlongumine inhibits the growth of non-small cell lung cancer cells via the miR-34b-3p/TGFBR1 pathway. BMC Complement. Med. Ther. 2021, 21, 15. [Google Scholar] [CrossRef]
- Endzelins, E.; Berger, A.; Melne, V.; Bajo-Santos, C.; Sobolevska, K.; Abols, A.; Rodriguez, M.; Santare, D.; Rudnickiha, A.; Lietuvietis, V.; et al. Detection of circulating miRNAs: Comparative analysis of extracellular vesicle-incorporated miRNAs and cell-free miRNAs in whole plasma of prostate cancer patients. BMC Cancer 2017, 17, 730. [Google Scholar] [CrossRef]
- Liu, Z.; Liu, X.; Li, Y.; Ren, P.; Zhang, C.; Wang, L.; Du, X.; Xing, B. miR-6716-5p promotes metastasis of colorectal cancer through downregulating NAT10 expression. Cancer Manag. Res. 2019, 11, 5317–5332. [Google Scholar] [CrossRef] [PubMed] [Green Version]
- Bhagirath, D.; Yang, T.L.; Tabatabai, Z.L.; Shahryari, V.; Majid, S.; Dahiya, R.; Tanaka, Y.; Saini, S. Role of a novel race-related tumor suppressor microRNA located in frequently deleted chromosomal locus 8p21 in prostate cancer progression. Carcinogenesis 2019, 40, 633–642. [Google Scholar] [CrossRef] [PubMed]
- Bucay, N.; Sekhon, K.; Majid, S.; Yamamura, S.; Shahryari, V.; Tabatabai, Z.L.; Greene, K.; Tanaka, Y.; Dahiya, R.; Deng, G.; et al. Novel tumor suppressor microRNA at frequently deleted chromosomal region 8p21 regulates epidermal growth factor receptor in prostate cancer. Oncotarget 2016, 7, 70388–70403. [Google Scholar] [CrossRef] [PubMed] [Green Version]
- Guo, J.; Liu, C.; Wang, W.; Liu, Y.; He, H.; Chen, C.; Xiang, R.; Luo, Y. Identification of serum miR-1915-3p and miR-455-3p as biomarkers for breast cancer. PLoS ONE 2018, 13, e0200716. [Google Scholar] [CrossRef]
- Jin, M.L.; Kim, Y.W.; Jin, H.L.; Kang, H.; Lee, E.K.; Stallcup, M.R.; Jeong, K.W. Aberrant expression of SETD1A promotes survival and migration of estrogen receptor alpha-positive breast cancer cells. Int. J. Cancer 2018, 143, 2871–2883. [Google Scholar] [CrossRef] [Green Version]
- Ohno, M.; Matsuzaki, J.; Kawauchi, J.; Aoki, Y.; Miura, J.; Takizawa, S.; Kato, K.; Sakamoto, H.; Matsushita, Y.; Takahashi, M.; et al. Assessment of the Diagnostic Utility of Serum MicroRNA Classification in Patients with Diffuse Glioma. JAMA Netw. Open 2019, 2, e1916953. [Google Scholar] [CrossRef]
- Cui, H.W.; Han, W.Y.; Hou, L.N.; Yang, L.; Li, X.; Su, X.L. miR-1915-3p inhibits Bcl-2 expression in the development of gastric cancer. Biosci. Rep. 2019, 39. [Google Scholar] [CrossRef] [Green Version]
- Borrelli, N.; Denaro, M.; Ugolini, C.; Poma, A.M.; Miccoli, M.; Vitti, P.; Miccoli, P.; Basolo, F. miRNA expression profiling of ’noninvasive follicular thyroid neoplasms with papillary-like nuclear features’ compared with adenomas and infiltrative follicular variants of papillary thyroid carcinomas. Mod. Pathol. 2017, 30, 39–51. [Google Scholar] [CrossRef]
- Wan, Y.; Cui, R.; Gu, J.; Zhang, X.; Xiang, X.; Liu, C.; Qu, K.; Lin, T. Identification of Four Oxidative Stress-Responsive MicroRNAs, miR-34a-5p, miR-1915-3p, miR-638, and miR-150-3p, in Hepatocellular Carcinoma. Oxid. Med. Cell. Longev. 2017, 2017, 5189138. [Google Scholar] [CrossRef] [Green Version]
- Kilpinen, L.; Parmar, A.; Greco, D.; Korhonen, M.; Lehenkari, P.; Saavalainen, P.; Laitinen, S. Expansion induced microRNA changes in bone marrow mesenchymal stromal cells reveals interplay between immune regulation and cell cycle. Aging 2016, 8, 2799–2813. [Google Scholar] [CrossRef] [Green Version]
- Xu, C.; Li, H.; Zhang, L.; Jia, T.; Duan, L.; Lu, C. MicroRNA19153p prevents the apoptosis of lung cancer cells by downregulating DRG2 and PBX2. Mol. Med. Rep. 2016, 13, 505–512. [Google Scholar] [CrossRef] [Green Version]
- Nakazawa, K.; Dashzeveg, N.; Yoshida, K. Tumor suppressor p53 induces miR-1915 processing to inhibit Bcl-2 in the apoptotic response to DNA damage. FEBS J. 2014, 281, 2937–2944. [Google Scholar] [CrossRef]
- Farran, B.; Dyson, G.; Craig, D.; Dombkowski, A.; Beebe-Dimmer, J.L.; Powell, I.J.; Podgorski, I.; Heilbrun, L.; Bolton, S.; Bock, C.H. A study of circulating microRNAs identifies a new potential biomarker panel to distinguish aggressive prostate cancer. Carcinogenesis 2018, 39, 556–561. [Google Scholar] [CrossRef]
- Kumar, S.; Sharawat, S.K.; Ali, A.; Gaur, V.; Malik, P.S.; Pandey, M.; Kumar, S.; Mohan, A.; Guleria, R. Differential expression of circulating serum miR-1249-3p, miR-3195, and miR-3692-3p in non-small cell lung cancer. Hum. Cell. 2020, 33, 839–849. [Google Scholar] [CrossRef] [PubMed]
- Wu, D.; Tang, R.; Qi, Q.; Zhou, X.; Zhou, H.; Mao, Y.; Li, R.; Liu, C.; Wang, W.; Hua, D.; et al. Five functional polymorphisms of B7/CD28 co-signaling molecules alter susceptibility to colorectal cancer. Cell. Immunol. 2015, 293, 41–48. [Google Scholar] [CrossRef] [PubMed]
- Stuopelyte, K.; Daniunaite, K.; Jankevicius, F.; Jarmalaite, S. Detection of miRNAs in urine of prostate cancer patients. Medicina 2016, 52, 116–124. [Google Scholar] [CrossRef]
- Bhagirath, D.; Yang, T.L.; Bucay, N.; Sekhon, K.; Majid, S.; Shahryari, V.; Dahiya, R.; Tanaka, Y.; Saini, S. microRNA-1246 Is an Exosomal Biomarker for Aggressive Prostate Cancer. Cancer Res. 2018, 78, 1833–1844. [Google Scholar] [CrossRef] [PubMed] [Green Version]
- Richardsen, E.; Andersen, S.; Melbo-Jorgensen, C.; Rakaee, M.; Ness, N.; Al-Saad, S.; Nordby, Y.; Pedersen, M.I.; Donnem, T.; Bremnes, R.M.; et al. MicroRNA 141 is associated to outcome and aggressive tumor characteristics in prostate cancer. Sci. Rep. 2019, 9, 386. [Google Scholar] [CrossRef] [Green Version]
- Yekula, A.; Muralidharan, K.; Kang, K.M.; Wang, L.; Balaj, L.; Carter, B.S. From laboratory to clinic: Translation of extracellular vesicle based cancer biomarkers. Methods 2020. [Google Scholar] [CrossRef]
- Wu, S.; Luo, M.; To, K.K.W.; Zhang, J.; Su, C.; Zhang, H.; An, S.; Wang, F.; Chen, D.; Fu, L. Intercellular transfer of exosomal wild type EGFR triggers osimertinib resistance in non-small cell lung cancer. Mol. Cancer 2021, 20, 17. [Google Scholar] [CrossRef]
- Vagner, T.; Spinelli, C.; Minciacchi, V.R.; Balaj, L.; Zandian, M.; Conley, A.; Zijlstra, A.; Freeman, M.R.; Demichelis, F.; De, S.; et al. Large extracellular vesicles carry most of the tumour DNA circulating in prostate cancer patient plasma. J. Extracell. Vesicles 2018, 7, 1505403. [Google Scholar] [CrossRef] [PubMed] [Green Version]
- Abd Elmageed, Z.Y.; Yang, Y.; Thomas, R.; Ranjan, M.; Mondal, D.; Moroz, K.; Fang, Z.; Rezk, B.M.; Moparty, K.; Sikka, S.C.; et al. Neoplastic reprogramming of patient-derived adipose stem cells by prostate cancer cell-associated exosomes. Stem Cells 2014, 32, 983–997. [Google Scholar] [CrossRef] [Green Version]
- Vlachos, I.S.; Zagganas, K.; Paraskevopoulou, M.D.; Georgakilas, G.; Karagkouni, D.; Vergoulis, T.; Dalamagas, T.; Hatzigeorgiou, A.G. DIANA-miRPath v3.0: Deciphering microRNA function with experimental support. Nucleic Acids Res. 2015, 43, W460–W466. [Google Scholar] [CrossRef]


| # | microRNA | FC | p-Value | FDR-Val | # | microRNA | FC | p-Value | FDR-Val |
|---|---|---|---|---|---|---|---|---|---|
| PCa Compared to Normal Subjects | |||||||||
| 1 | miR-4529-3p | 354.7 | 0.0000 | 0.0001 | 44 | miR-8060 | 2.6 | 0.0006 | 0.1526 |
| 2 | miR-3201 | 30.6 | 0.0000 | 0.0013 | 45 | miR-4644 | 2.6 | 0.0093 | 0.6487 |
| 3 | miR-8084 | 28.5 | 0.0000 | 0.0001 | 46 | let-7c-5p | 2.6 | 0.0004 | 0.1242 |
| 4 | miR-486-5p | 21.5 | 0.0002 | 0.0801 | 47 | miR-606 | 2.5 | 0.0002 | 0.0801 |
| 5 | miR-26a-5p | 21.4 | 0.0000 | 0.007 | 48 | miR-4454 | 2.5 | 0.0181 | 0.8231 |
| 6 | miR-92a-3p | 14.5 | 0.0001 | 0.0502 | 49 | HBII-85-6 | 2.5 | 0.0183 | 0.8272 |
| 7 | miR-23a-3p | 13.8 | 0.0008 | 0.1727 | 50 | miR-330-3p | 2.4 | 0.0024 | 0.3581 |
| 8 | let-7b-5p | 13.7 | 0.0174 | 0.8032 | 51 | HBII-85-2 | 2.4 | 0.0003 | 0.0857 |
| 9 | mir-7515 | 12.5 | 0.0000 | 0.0037 | 52 | miR-6752-5p | 2.4 | 0.0028 | 0.3737 |
| 10 | miR-16-5p | 12.3 | 0.0000 | 0.0014 | 53 | miR-3910 | 2.4 | 0.017 | 0.7934 |
| 11 | miR-6716-3p | 12.0 | 0.0148 | 0.7721 | 54 | miR-1275 | 2.4 | 0.0033 | 0.3971 |
| 12 | miR-126-3p | 10.9 | 0.0000 | 0.0111 | 55 | miR-1288-5p | 2.3 | 0.0226 | 0.8767 |
| 13 | miR-320c | 10.1 | 0.0001 | 0.0694 | 56 | miR-4690-5p | 2.3 | 0.0001 | 0.0502 |
| 14 | miR-3128 | 9.7 | 0.0002 | 0.0801 | 57 | miR-423-5p | 2.3 | 0.0103 | 0.6708 |
| 15 | miR-320a | 8.2 | 0.0017 | 0.2835 | 58 | miR-6780b-5p | 2.3 | 0.0263 | 0.8767 |
| 16 | miR-8075 | 7.5 | 0.0003 | 0.0937 | 59 | miR-2392 | 2.2 | 0.0041 | 0.4217 |
| 17 | miR-320b | 7.2 | 0.0018 | 0.3023 | 60 | miR-6801-5p | 2.2 | 0.0206 | 0.8767 |
| 18 | miR-23b-3p | 6.8 | 0.0000 | 0.0108 | 61 | miR-3074-3p | 2.2 | 0.0345 | 0.8924 |
| 19 | miR-103a-3p | 6.1 | 0.0000 | 0.0067 | 62 | miR-6807-5p | 2.1 | 0.0024 | 0.3581 |
| 20 | let-7a-5p | 5.4 | 0.0001 | 0.0502 | 63 | U3 | 2.1 | 0.0007 | 0.158 |
| 21 | miR-619-5p | 5.3 | 0.0000 | 0.0067 | 64 | miR-19b-3p | 2.1 | 0.0115 | 0.6907 |
| 22 | miR-320d | 5.2 | 0.0004 | 0.1242 | 65 | mir-338 | 2.1 | 0.003 | 0.3928 |
| 23 | mir-6798 | 5.2 | 0.0374 | 0.8924 | 66 | miR-4423-3p | 2.0 | 0.0055 | 0.514 |
| 24 | SNORD59BL2 | 4.5 | 0.0464 | 0.9493 | 67 | miR-548ac | 2.0 | 0.0041 | 0.4217 |
| 25 | miR-4445-3p | 4.4 | 0.0033 | 0.3971 | 68 | SNORA1 | 2.0 | 0.0307 | 0.8767 |
| 26 | mir-520g | 4.2 | 0.0002 | 0.0743 | 69 | SNORA1B | 2.0 | 0.0307 | 0.8767 |
| 27 | mir-520h | 4.2 | 0.0002 | 0.0743 | 70 | miR-4739 | −2.1 | 0.0128 | 0.7386 |
| 28 | miR-107 | 4.1 | 0.0016 | 0.2835 | 71 | mir-6722 | −2.1 | 0.0285 | 0.8767 |
| 29 | miR-6514-3p | 3.8 | 0.0404 | 0.8933 | 72 | miR-6511b-5p | −2.2 | 0.0413 | 0.8981 |
| 30 | SNORD116-29L1 | 3.7 | 0.0146 | 0.7721 | 73 | miR-1281 | −2.4 | 0.0008 | 0.1623 |
| 31 | mir-4275 | 3.6 | 0.0094 | 0.6487 | 74 | miR-6511a-5p | −2.4 | 0.0463 | 0.9493 |
| 32 | miR-150-5p | 3.6 | 0.0014 | 0.2697 | 75 | miR-4745-5p | −2.5 | 0.0136 | 0.7621 |
| 33 | miR-24-3p | 3.5 | 0.0058 | 0.5311 | 76 | miR-6791-5p | −2.6 | 0.0336 | 0.8877 |
| 34 | SNORD113-30 | 3.4 | 0.0391 | 0.8924 | 77 | miR-6732-5p | −2.8 | 0.0479 | 0.9574 |
| 35 | HBII-85-8 | 3.3 | 0.0055 | 0.514 | 78 | miR-6800-5p | −3.2 | 0.0072 | 0.6192 |
| 36 | mir-365a | 3.2 | 0.0365 | 0.8924 | 79 | miR-6789-5p | −3.8 | 0.0109 | 0.6765 |
| 37 | mir-365a | 3.2 | 0.0305 | 0.8767 | 80 | miR-4516 | −4.6 | 0.0144 | 0.7718 |
| 38 | miR-342-3p | 2.9 | 0.0015 | 0.2827 | 81 | miR-6869-5p | −6.4 | 0.0304 | 0.8767 |
| 39 | miR-335-5p | 2.9 | 0.0051 | 0.5024 | 82 | miR-6068 | −8.2 | 0.0036 | 0.4123 |
| 40 | SNORD116-21 | 2.7 | 0.0038 | 0.4123 | 83 | miR-4487 | −8.5 | 0.0213 | 0.8767 |
| 41 | let-7d-5p | 2.7 | 0.0063 | 0.5624 | 84 | miR-5001-5p | −12.6 | 0.0026 | 0.3615 |
| 42 | miR-1182 | 2.7 | 0.0214 | 0.8767 | 85 | miR-4467 | −25.5 | 0.0127 | 0.7374 |
| 43 | miR-3151-5p | 2.6 | 0.0087 | 0.6403 | - | - | - | - | - |
| AA compared to CA men with PCa | |||||||||
| 1 | miR-6716-5p | 3.41 | 0.0004 | 0.9126 | 11 | miR-6729-5p | −2.13 | 0.0247 | 0.9527 |
| 2 | miR-6510-5p | 2.57 | 0.0469 | 0.9527 | 12 | mir-6776 | −2.14 | 0.0376 | 0.9527 |
| 3 | miR-3175 | 2.42 | 0.0147 | 0.9527 | 13 | miR-6782-5p | −2.21 | 0.0063 | 0.9527 |
| 4 | miR-6743-5p | 2.26 | 0.0341 | 0.9527 | 14 | miR-1273g-3p | −2.27 | 0.0156 | 0.9527 |
| 5 | miR-5004-5p | 2.23 | 0.0314 | 0.9527 | 15 | miR-99b-5p | −2.27 | 0.0431 | 0.9527 |
| 6 | miR-4723-5p | 2.21 | 0.0157 | 0.9527 | 16 | miR-4725-3p | −2.34 | 0.0138 | 0.9527 |
| 7 | miR-6076 | 2.08 | 0.0103 | 0.9527 | 17 | miR-1915-3p | −2.57 | 0.0071 | 0.9527 |
| 8 | miR-3944-5p | 2.02 | 0.0029 | 0.9527 | 18 | miR-6821-5p | −2.63 | 0.0322 | 0.9527 |
| 9 | snoU13 | −2.01 | 0.0072 | 0.9527 | 19 | miR-6500-5p | −3.09 | 0.0131 | 0.9527 |
| 10 | miR-3619-5p | −2.04 | 0.0091 | 0.9527 | - | - | - | - | - |
| High Gleason Score (HGS) compared to low GS (LGS) PCa patients | |||||||||
| 1 | miR-6727-5p | 5.2 | 0.0134 | 0.9643 | 23 | miR-7975 | 2.2 | 0.0374 | 0.9643 |
| 2 | miR-6125 | 4.1 | 0.0036 | 0.9643 | 24 | miR-3939 | 2.2 | 0.0017 | 0.9643 |
| 3 | miR-6869-5p | 4.0 | 0.031 | 0.9643 | 25 | miR-635 | 2.2 | 0.0086 | 0.9643 |
| 4 | miR-3621 | 3.9 | 0.0261 | 0.9643 | 26 | miR-3126-3p | 2.2 | 0.0049 | 0.9643 |
| 5 | miR-6858-5p | 3.4 | 0.0262 | 0.9643 | 27 | miR-770-5p | 2.1 | 0.0044 | 0.9643 |
| 6 | miR-5189-5p | 3.2 | 0.0017 | 0.9643 | 28 | snoU13 | 2.1 | 0.0247 | 0.9643 |
| 7 | mir-4737 | 2.9 | 0.0023 | 0.9643 | 29 | miR-140-3p | 2.0 | 0.0418 | 0.9643 |
| 8 | miR-5094 | 2.8 | 0.0011 | 0.9643 | 30 | miR-4454 | 2.0 | 0.0161 | 0.9643 |
| 9 | miR-3692-3p | 2.8 | 0.0019 | 0.9643 | 31 | mir-5092 | 2.0 | 0.0266 | 0.9643 |
| 10 | snoU13 | 2.8 | 0.0188 | 0.9643 | 32 | mir-3154 | 2.0 | 0.0397 | 0.9643 |
| 11 | miR-4269 | 2.8 | 0.0189 | 0.9643 | 33 | miR-758-5p | −2 | 0.0464 | 0.9643 |
| 12 | miR-6741-5p | 2.7 | 0.0089 | 0.9643 | 34 | miR-4504 | −2.1 | 0.0047 | 0.9643 |
| 13 | miR-1469 | 2.7 | 0.013 | 0.9643 | 35 | miR-6837-5p | −2.2 | 0.0387 | 0.9643 |
| 14 | mir-4737 | 2.7 | 0.0032 | 0.9643 | 36 | miR-107 | −2.2 | 0.0036 | 0.9643 |
| 15 | miR-574-3p | 2.5 | 0.0025 | 0.9643 | 37 | mir-658 | −2.3 | 0.0009 | 0.9643 |
| 16 | miR-6723-5p | 2.5 | 0.0075 | 0.9643 | 38 | miR-3174 | −2.4 | 0.0478 | 0.9643 |
| 17 | miR-196b-3p | 2.5 | 0.0058 | 0.9643 | 39 | miR-320a | −2.4 | 0.0053 | 0.9643 |
| 18 | miR-378h | 2.4 | 0.0018 | 0.9643 | 40 | miR-320b | −3.1 | 0.0043 | 0.9643 |
| 19 | miR-6786-5p | 2.3 | 0.0203 | 0.9643 | 41 | miR-642a-3p | −3.3 | 0.0134 | 0.9643 |
| 20 | miR-3935 | 2.3 | 0.0339 | 0.9643 | 42 | let-7b-5p | −5.0 | 0.0392 | 0.9643 |
| 21 | miR-187-5p | 2.3 | 0.0035 | 0.9643 | 43 | miR-106b-5p | −5.8 | 0.0296 | 0.9643 |
| 22 | miR-5703 | 2.3 | 0.003 | 0.9643 | - | - | - | - | - |
| sEV-Associated miRs | PCa (N = 150) | Normal (N = 30) | Trend | p-Value |
|---|---|---|---|---|
| Mean ΔCT ± SEM | Mean ΔCT ± SEM | |||
| miR-6068 (ΔCT) | −0.556 ± 0.125 | −2.03 ± 0.138 | Down | <0.001 |
| miR-1915-3p (ΔCT) | −0.709 ± 0.09 | 0.5675 ± 0.085 | Up | 0.001 |
| miR-3201 (ΔCT) | −16.38 ± 0.163 | −16.60 ± 0.139 | NS | 0.315 |
| miR-3692-3p (ΔCT) | 1.368 ± 0.068 | 0.813 ± 0.103 | Down | 0.004 |
| miR-3939 (ΔCT) | 0.377 ± 0.124 | −1.046 ± 0.151 | Down | <0.001 |
| miR-3944-5p (ΔCT) | −7.438 ± 0.119 | −7.349 ± 0.107 | NS | 0.787 |
| miR-5001-5p (ΔCT) | 0.754 ± 0.101 | 0.684 ± 0.100 | NS | 0.623 |
| miR-5189-5p (ΔCT) | −2.279 ± 0.099 | −3.309 ± 0.197 | Down | <0.001 |
| miR-6716-5p (ΔCT) | −1.037 ± 0.076 | −1.864 ± 0.119 | Down | <0.001 |
| Comparison | Predictor | miRs | Cutoff Value | Sensitivity | Specificity | AUC | 95% CI | p-Value | |
|---|---|---|---|---|---|---|---|---|---|
| Lower | Upper | ||||||||
| PCa vs. Normal | Single miR | miR-5189-5p | −2.84 | 70% | 65% | 0.753 | 0.661 | 0.845 | <0.001 |
| miR-3939 | −0.975 | 84% | 65% | 0.809 | 0.736 | 0.881 | <0.001 | ||
| miR-6068 | −1.785 | 76% | 70% | 0.806 | 0.733 | 0.880 | <0.001 | ||
| miR-1915-3p | 0.505 | 70% | 70% | 0.713 | 0.637 | 0.788 | 0.002 | ||
| miR-3692-3p | 0.985 | 71% | 65% | 0.726 | 0.638 | 0.815 | 0.001 | ||
| miR-6716-5p | −1.5400 | 74% | 70% | 0.795 | 0.710 | 0.879 | <0.001 | ||
| Combined miRs | miR-1915-3p and miR-6716 | 0.883 | 0.830 | 0.937 | <0.001 | ||||
| miR-1915-3p, miR-3692-3p, miR-3939, miR-6068 and miR-6716-5p | 0.904 | 0.853 | 0.954 | <0.001 | |||||
| AA vs. CA (W) | Single miR | miR-5189-5p | −0.130 | 67% | 64% | 0.649 | 0.508 | 0.790 | 0.048 |
| miR-3939 | −0.135 | 64% | 70% | 0.705 | 0.572 | 0.838 | 0.007 | ||
| miR-6716-5p | −0.740 | 71% | 65% | 0.697 | 0.539 | 0.820 | 0.021 | ||
| Combined miRs | miR-3939 and miR-6716 | 0.754 | 0.623 | 0.885 | 0.001 | ||||
| miR-3939, miR-5189 and miR-6716 | 0.761 | 0.632 | 0.890 | 0.001 | |||||
| AA vs. CA (NIH) | Single miR | miR-3692-3p | −0.705 | 68% | 62% | 0.706 | 0.597 | 0.814 | 0.001 |
| miR-6716-5p | −0.8700 | 70% | 56% | 0.665 | 0.552 | 0.779 | 0.008 | ||
| Combined miRs | miR-3692-3p and miR-6716-5p | 0.752 | 0.649 | 0.855 | <0.001 | ||||
| GS>7 vs. GS<7 (W) | Single miR | miR-1915-3p | −0.0805 | 73% | 50% | 0.662 | 0.523 | 0.801 | 0.031 |
| miR-3692-3p | −0.5600 | 61% | 61% | 0.661 | 0.519 | 0.805 | 0.037 | ||
| Combined miRs | miR-1915-3p and miR-3692-3p | 0.683 | 0.544 | 0.822 | 0.019 | ||||
| GS ≥ 7 vs. GS < 7 (NIH) | Single miR | miR-1915-3p | 1.3900 | 70% | 50% | 0.700 | 0.585 | 0.814 | 0.003 |
| miR-3692-3p | −0.3050 | 66% | 52% | 0.661 | 0.482 | 0.740 | 0.092 | ||
| miR-5001-5p | 0.4900 | 65% | 67% | 0.697 | 0.588 | 0.806 | 0.002 | ||
| Combined miRs | miR-1915-3p, miR-3692-3p and miR-5001-5p | 0.818 | 0.725 | 0.911 | <0.001 | ||||
| Expression of miRs According to the Race | ||||||||
|---|---|---|---|---|---|---|---|---|
| Washington Cohort | NIH Cohort | |||||||
| miRs | AA | CA | Expression | p-Value | AA | CA | Expression | p-Value |
| Log2FC ± SEM | Log2FC ± SEM | Log2FC ± SEM | Log2FC ± SEM | |||||
| miR-1915-3p | −0.069 ± 0.120 | −0.292 ± 0.10 | NS | 0.168 | 1.527 ± 0.12 | 1.533 ± 0.13 | NS | 0.971 |
| miR-3201 | −0.228 ± 0.378 | 0.237 ± 0.32 | NS | 0.352 | −0.031 ± 0.30 | −0.699 ± 0.31 | NS | 0.123 |
| miR-3692-3p | −0.476 ± 0.135 | −0.577 ± 0.07 | NS | 0.516 | −0.210 ± 0.14 | −0.921 ± 0.14 | Up | <0.001 * |
| miR-3939 | 0.225 ± 0.160 | −0.421 ± 0.15 | Up | 0.005 * | −2.037 ± 0.16 | −2.483 ± 0.21 | NS | 0.121 |
| miR-3944-5p | 0.581 ± 0.222 | 0.376 ± 0.22 | NS | 0.510 | −0.074 ± 0.22 | −0.266 ± 0.25 | NS | 0.562 |
| miR-5001-5p | −0.960 ± 0.199 | −1.055 ± 0.19 | NS | 0.726 | 0.724 ± 0.13 | 0.384 ± 0.15 | NS | 0.085 |
| miR-5189-5p | 0.075 ± 0.175 | −0.051 ± 0.20 | Up | 0.033 * | −1.546 ± 0.12 | −1.604 ± 0.17 | NS | 0.780 |
| miR-6716-5p | −0.052 ± 0.146 | −1.106 ± 0.15 | Up | 0.007 * | −0.543 ± 0.11 | −1.100 ± 0.14 | Up | 0.003 * |
| Expression of miRs according to Gleason score | ||||||||
| Washington cohort | NIH cohort | |||||||
| miRs | GS | Log2FC ± SEM | p-value | Log2FC ± SEM | ANOVA p-value | |||
| miR-1915-3p | <7 | 0.012 ± 0.13 | 0.015 * | 1.219 ± 0.14 | 0.008 * | |||
| =7 | 1.792 ± 0.15 | |||||||
| >7 | −0.373 ± 0.0.08 | 1.683 ± 0.12 | ||||||
| miR-3201 | <7 | −0.081 ± 0.41 | 0.733 | −0.303 ± 0.34 | 0.948 | |||
| =7 | −0.465 ± 0.44 | |||||||
| >7 | 0.090 ± 0.28 | −0.327 ± 0.35 | ||||||
| miR-3692-3p | <7 | −0.344 ± 0.11 | 0.015 * | −0.266 ± 0.19 | 0.010 * | |||
| =7 | −0.442 ± 0.16 | |||||||
| >7 | −0.710 ± 0.10 | −0.993 ± 0.16 | ||||||
| miR-3939 | <7 | 0.000 ± 0.20 | 0.361 | −2.351 ± 0.20 | 0.783 | |||
| =7 | −2.147 ± 0.28 | |||||||
| >7 | −0.217 ± 0.13 | −2.338 ± 0.21 | ||||||
| miR-3944-5p | <7 | 0.572 ± 0.21 | 0.549 | −0.234 ± 0.26 | 0.918 | |||
| =7 | −0.075 ± 0.33 | |||||||
| >7 | 0.385 ± 0.23 | −0.200 ± 0.27 | ||||||
| miR-5001-5p | <7 | −0.912 ± 0.20 | 0.485 | 0.236 ± 0.12 | 0.032 * | |||
| =7 | 0.866 ± 0.22 | |||||||
| >7 | −1.103 ± 0.19 | 0.561 ± 0.15 | ||||||
| miR-5189-5p | <7 | −0.107 ± 0.20 | 0.437 | −1.780 ± 0.17 | 0.253 | |||
| =7 | −1.362 ± 0.20 | |||||||
| >7 | −0.322 ± 0.19 | −1.585 ± 0.16 | ||||||
| miR-6716-5p | <7 | −0.712 ± 0.14 | 0.350 | −1.041 ± 0.14 | 0.187 | |||
| =7 | −0.609 ± 0.19 | |||||||
| >7 | −0.923 ± 0.14 | −0.844 ± 0.15 | ||||||
| miR-6068 | <7 | −1.48 ± 0.34 | 0.772 | −2.64 ± 0.39 | 0.015 * | |||
| =7 | −1.37 ± 0.32 | |||||||
| >7 | −1.63 ± 0.36 | −1.38 ± 0.32 | ||||||
| Parameters | Categories | Univariate | Multivariate | ||||||
|---|---|---|---|---|---|---|---|---|---|
| HR | 95.0% CI for HR | p-Value | HR | 95.0% CI for HR | p-Value | ||||
| Lower | Upper | Lower | Upper | ||||||
| Age | <mean vs. ≥mean | 2.157 | 0.812 | 5.733 | 0.123 | 3.663 | 1.066 | 12.585 | 0.039 * |
| Race | AA vs. CA | 1.373 | 0.549 | 3.434 | 0.498 | 3.169 | 1.082 | 9.278 | 0.035 * |
| Gleason Score | GS < 7 vs. ≥7 | 1.022 | 0.383 | 2.728 | 0.965 | 0.718 | 0.206 | 2.499 | 0.602 |
| PSA | <median vs. ≥median | 1.562 | 0.604 | 4.038 | 0.357 | 1.506 | 0.145 | 2.191 | 0.408 |
| Stage | I, II vs. III, IV | 0.659 | 0.191 | 2.279 | 0.51 | 0.564 | 0.601 | 2.935 | 0.483 |
| Smoke Status | Smoker vs. non-smoker | 1.166 | 0.658 | 2.065 | 0.512 | 1.328 | 0.547 | 4.147 | 0.428 |
| miR-5189-3p | <mean Log2FC vs. ≥mean Log2FC | 0.694 | 0.272 | 1.77 | 0.455 | 3.884 | 0.932 | 16.177 | 0.062 |
| miR-1915-5p | <mean Log2FC vs. ≥mean Log2FC | 0.264 | 0.103 | 0.682 | 0.006 * | 0.217 | 0.053 | 0.877 | 0.033 * |
| miR-3692-3p | <mean Log2FC vs. ≥mean Log2FC | 0.366 | 0.13 | 1.026 | 0.056 | 0.222 | 0.064 | 0.77 | 0.018 * |
| miR-5001-5p | <mean Log2FC vs. ≥mean Log2FC | 0.399 | 0.155 | 1.025 | 0.056 | 0.609 | 0.151 | 2.457 | 0.486 |
| Parameter | Categories | Univariate | Multivariate | ||||||
|---|---|---|---|---|---|---|---|---|---|
| HR | 95% CI for HR | p-Value | HR | 95% CI for HR | p-Value | ||||
| Lower | Upper | Lower | Upper | ||||||
| Age | <mean vs. ≥mean | 1.023 | 0.381 | 2.751 | 0.963 | 0.951 | 0.321 | 2.82 | 0.982 |
| Race | AA vs. CA | 1.617 | 0.586 | 4.46 | 0.354 | 2.136 | 0.793 | 6.172 | 0.161 |
| Gleason Score | GS < 7 vs. ≥7 | 1.478 | 0.499 | 4.381 | 0.481 | 1.472 | 0.383 | 5.661 | 0.573 |
| PSA | <median vs. ≥median | 2.543 | 0.852 | 7.587 | 0.094 | 2.772 | 0.757 | 10.142 | 0.123 |
| Stage | I, II vs. III, IV | 1.533 | 0.48 | 4.892 | 0.47 | 1.031 | 0.288 | 3.69 | 0.693 |
| Smoke Status | Smoker vs. non-smoker | 1.422 | 0.763 | 2.652 | 0.268 | 1.242 | 0.624 | 2.471 | 0.536 |
| miR-1915-5p (Log2FC) | <mean Log2FC vs. ≥mean Log2FC | 0.286 | 0.099 | 0.828 | 0.021 * | 0.288 | 0.067 | 0.788 | 0.018 * |
Publisher’s Note: MDPI stays neutral with regard to jurisdictional claims in published maps and institutional affiliations. |
© 2021 by the authors. Licensee MDPI, Basel, Switzerland. This article is an open access article distributed under the terms and conditions of the Creative Commons Attribution (CC BY) license (https://creativecommons.org/licenses/by/4.0/).
Share and Cite
Ali, H.E.A.; Gaballah, M.S.A.; Gaballa, R.; Mahgoub, S.; Hassan, Z.A.; Toraih, E.A.; Drake, B.F.; Abd Elmageed, Z.Y. Small Extracellular Vesicle-Derived microRNAs Stratify Prostate Cancer Patients According to Gleason Score, Race and Associate with Survival of African American and Caucasian Men. Cancers 2021, 13, 5236. https://0-doi-org.brum.beds.ac.uk/10.3390/cancers13205236
Ali HEA, Gaballah MSA, Gaballa R, Mahgoub S, Hassan ZA, Toraih EA, Drake BF, Abd Elmageed ZY. Small Extracellular Vesicle-Derived microRNAs Stratify Prostate Cancer Patients According to Gleason Score, Race and Associate with Survival of African American and Caucasian Men. Cancers. 2021; 13(20):5236. https://0-doi-org.brum.beds.ac.uk/10.3390/cancers13205236
Chicago/Turabian StyleAli, Hamdy E. A., Mohamed S. A. Gaballah, Rofaida Gaballa, Shahenda Mahgoub, Zeinab A. Hassan, Eman A. Toraih, Bettina F. Drake, and Zakaria Y. Abd Elmageed. 2021. "Small Extracellular Vesicle-Derived microRNAs Stratify Prostate Cancer Patients According to Gleason Score, Race and Associate with Survival of African American and Caucasian Men" Cancers 13, no. 20: 5236. https://0-doi-org.brum.beds.ac.uk/10.3390/cancers13205236