Article

1H-NMR Plasma Lipoproteins Profile Analysis Reveals Lipid Metabolism Alterations in HER2-Positive Breast Cancer Patients

1
Immunopathology and Cancer Biomarkers Unit, IRCCS Centro di Riferimento Oncologico di Aviano (CRO), 33081 Aviano, Italy
2
Department of Molecular Science and Nano Systems, Ca’ Foscari University of Venice, Via Torino 155, Venezia Mestre, 30172 Venice, Italy
3
Magnetic Resonance Center (CERM), Department of Chemistry “Ugo Schiff”, University of Florence, Via Luigi Sacconi 6, 50019 Sesto Fiorentino, Italy
4
Consorzio Interuniversitario Risonanze Magnetiche di Metallo Proteine, 50019 Sesto Fiorentino, Italy
5
Medical Oncology and Cancer Prevention Unit, IRCCS Centro di Riferimento Oncologico di Aviano (CRO), 33081 Aviano, Italy
*
Author to whom correspondence should be addressed.
Equal contributions.
Cancers 2021, 13(22), 5845; https://doi.org/10.3390/cancers13225845
Submission received: 21 October 2021 / Revised: 17 November 2021 / Accepted: 20 November 2021 / Published: 21 November 2021

Abstract

:

Simple Summary

Lipids’ metabolism deregulation is an established mark of breast cancer, however, no conclusive results have been reported on its effective role in disease development and progression. In this study, we applied straightforward 1H-NMR analysis to deeply explore alterations in circulating lipoproteins in HER2-positive breast cancer patients. The results support the key role played by lipids in the development of this breast cancer histotype and point out a specific lipid trait, characterized by a high plasma level of VLDL subfractions, potentially useful for diagnostic purposes. Moreover, the monitoring of plasma lipoproteins profile changes along the therapeutic interventions was found valuable to predict the clinical outcome.

Abstract

The lipid tumour demand may shape the host metabolism adapting the circulating lipids composition to its growth and progression needs. This study aims to exploit the straightforward 1H-NMR lipoproteins analysis to investigate the alterations of the circulating lipoproteins’ fractions in HER2-positive breast cancer and their modulations induced by treatments. The baseline 1H-NMR plasma lipoproteins profiles were measured in 43 HER2-positive breast cancer patients and compared with those of 28 healthy women. In a subset of 32 patients, longitudinal measurements were also performed along neoadjuvant chemotherapy, after surgery, adjuvant treatment, and during the two-year follow-up. Differences between groups were assessed by multivariate PLS-DA and by univariate analyses. The diagnostic power of lipoproteins subfractions was assessed by ROC curve, while lipoproteins time changes along interventions were investigated by ANOVA analysis. The PLS-DA model distinguished HER2-positive breast cancer patients from the control group with a sensitivity of 96.4% and specificity of 90.7%, mainly due to the differential levels of VLDLs subfractions that were significantly higher in the patients’ group. Neoadjuvant chemotherapy-induced a significant drop in the HDLs after the first three months of treatment and a specific decrease in the HDL-3 and HDL-4 subfractions were found significantly associated with the pathological complete response achievement. These results indicate that HER2-positive breast cancer is characterized by a significant host lipid mobilization that could be useful for diagnostic purposes. Moreover, the lipoproteins profiles alterations induced by the therapeutic interventions could predict the clinical outcome supporting the application of 1H-NMR lipoproteins profiles analysis for longitudinal monitoring of HER2-positive breast cancer in large clinical studies.

Graphical Abstract

1. Introduction

Cellular lipid metabolism reprogramming is a well-recognized hallmark of cancer disease [1,2,3] generally characterized by an increased lipogenesis and lipid storage, needful for the rapid tumour growth and metastatic spread [4,5,6,7]. Although de novo lipogenesis is a common marker of precursor lesions, cancer cells are also able to uptake lipids from the tumour microenvironment [8,9]. In this context, the main extra-tumour source of lipids is represented by triglycerides (TGs) derived from the surrounding adipose tissues and lipoproteins from the bloodstream [8,10]. These latter are supramolecular protein–lipids complex with a hydrophobic core of TGs and esterified cholesterol (Chol), surrounded by a double layer of phospholipids (PLs), free-Chol, and apolipoproteins (Apo) that drive their final structure and function [11]. According to density and composition, lipoproteins are classified into very-low-density (VLDL), low-density (LDL), and high-density (HDL) lipoproteins with distinct roles in lipid metabolism [12]. The VLDLs and LDLs are mainly responsible for the delivery of TGs and Chol to peripheral tissues while HDLs have a scavenger function transporting Chol and lipids from peripheral tissues to the liver [13,14,15,16,17,18].
Tumour histological types and stages can have different lipid metabolism needs and potentially can affect the levels of circulating lipoproteins [19,20,21,22,23]. So far, numerous studies have been reported to elucidate differential blood lipoproteins’ profiles in distinct cancer types [24,25,26,27]; however, heterogeneous and no conclusive findings were reported indicating that the role of lipoproteins in cancer metabolism is still far to be defined [28,29,30]. The controversial results can be partially ascribed to the commonly used clinical blood lipid profile test that is limited to the total TGs, total-Chol, Chol-HDL, and Chol-LDL. These generic classes of lipoproteins do not cover the complexity of the circulatory lipids that involve many subfractions with different lipids compositions and functions. The deep knowledge of the blood lipoproteins distribution could instead contribute to better deciphering the complex biochemical mechanisms at the base of cancer lipids metabolism deregulation occurring in cancer patients [21,30,31,32,33]. Information of such level of complexity is commonly accessible by serum/plasma lipoprotein density gradient ultracentrifugation separation followed by lipids profile analysis [34,35,36]. However, this methodological approach is very cumbersome and time-consuming and its application in clinical settings is very limited. Conversely, the proton nuclear magnetic resonance (1H-NMR) spectroscopy represents a high-throughput technology to study the comprehensive plasma lipoprotein profile. The 1H-NMR enables to distinguish the different lipoproteins subfractions by detecting changes in the magnetic chemical shift of the methyl (-CH3) and the methylene (-CH2) groups of fatty acids (FA), which is dependent on the different particle sizes as well as on the chemical heterogeneity of lipoproteins [37,38,39]. The quantification of the lipoproteins subfractions by 1H-NMR is currently based on the use of a validated partial least-squares regression (PLS) model obtained from the lipid region of the 1H-NMR spectra and ultracentrifugation lipoproteins reference data [39,40]. This emerging bioanalytical approach is an extraordinary opportunity to proficiently study the key role played by lipoprotein metabolism in cancer development and progression.
The present study aimed to explore the potential of 1H-NMR lipoproteins and lipids profile analysis for the discovery of potential novel diagnostic and prognostic biomarkers of HER2-positive breast cancer (BC). The preliminary results suggest that high levels of VLDL subfractions may be an important feature of HER2-positive BC patients useful for diagnostic purposes. Moreover, therapeutic interventions such as targeted neoadjuvant chemotherapy (NACT) were found to induce profound alterations in the circulating HDL lipoproteins subfractions that may be implicated in determining the response to the pharmacological treatment.

2. Materials and Methods

2.1. Patients’ Population
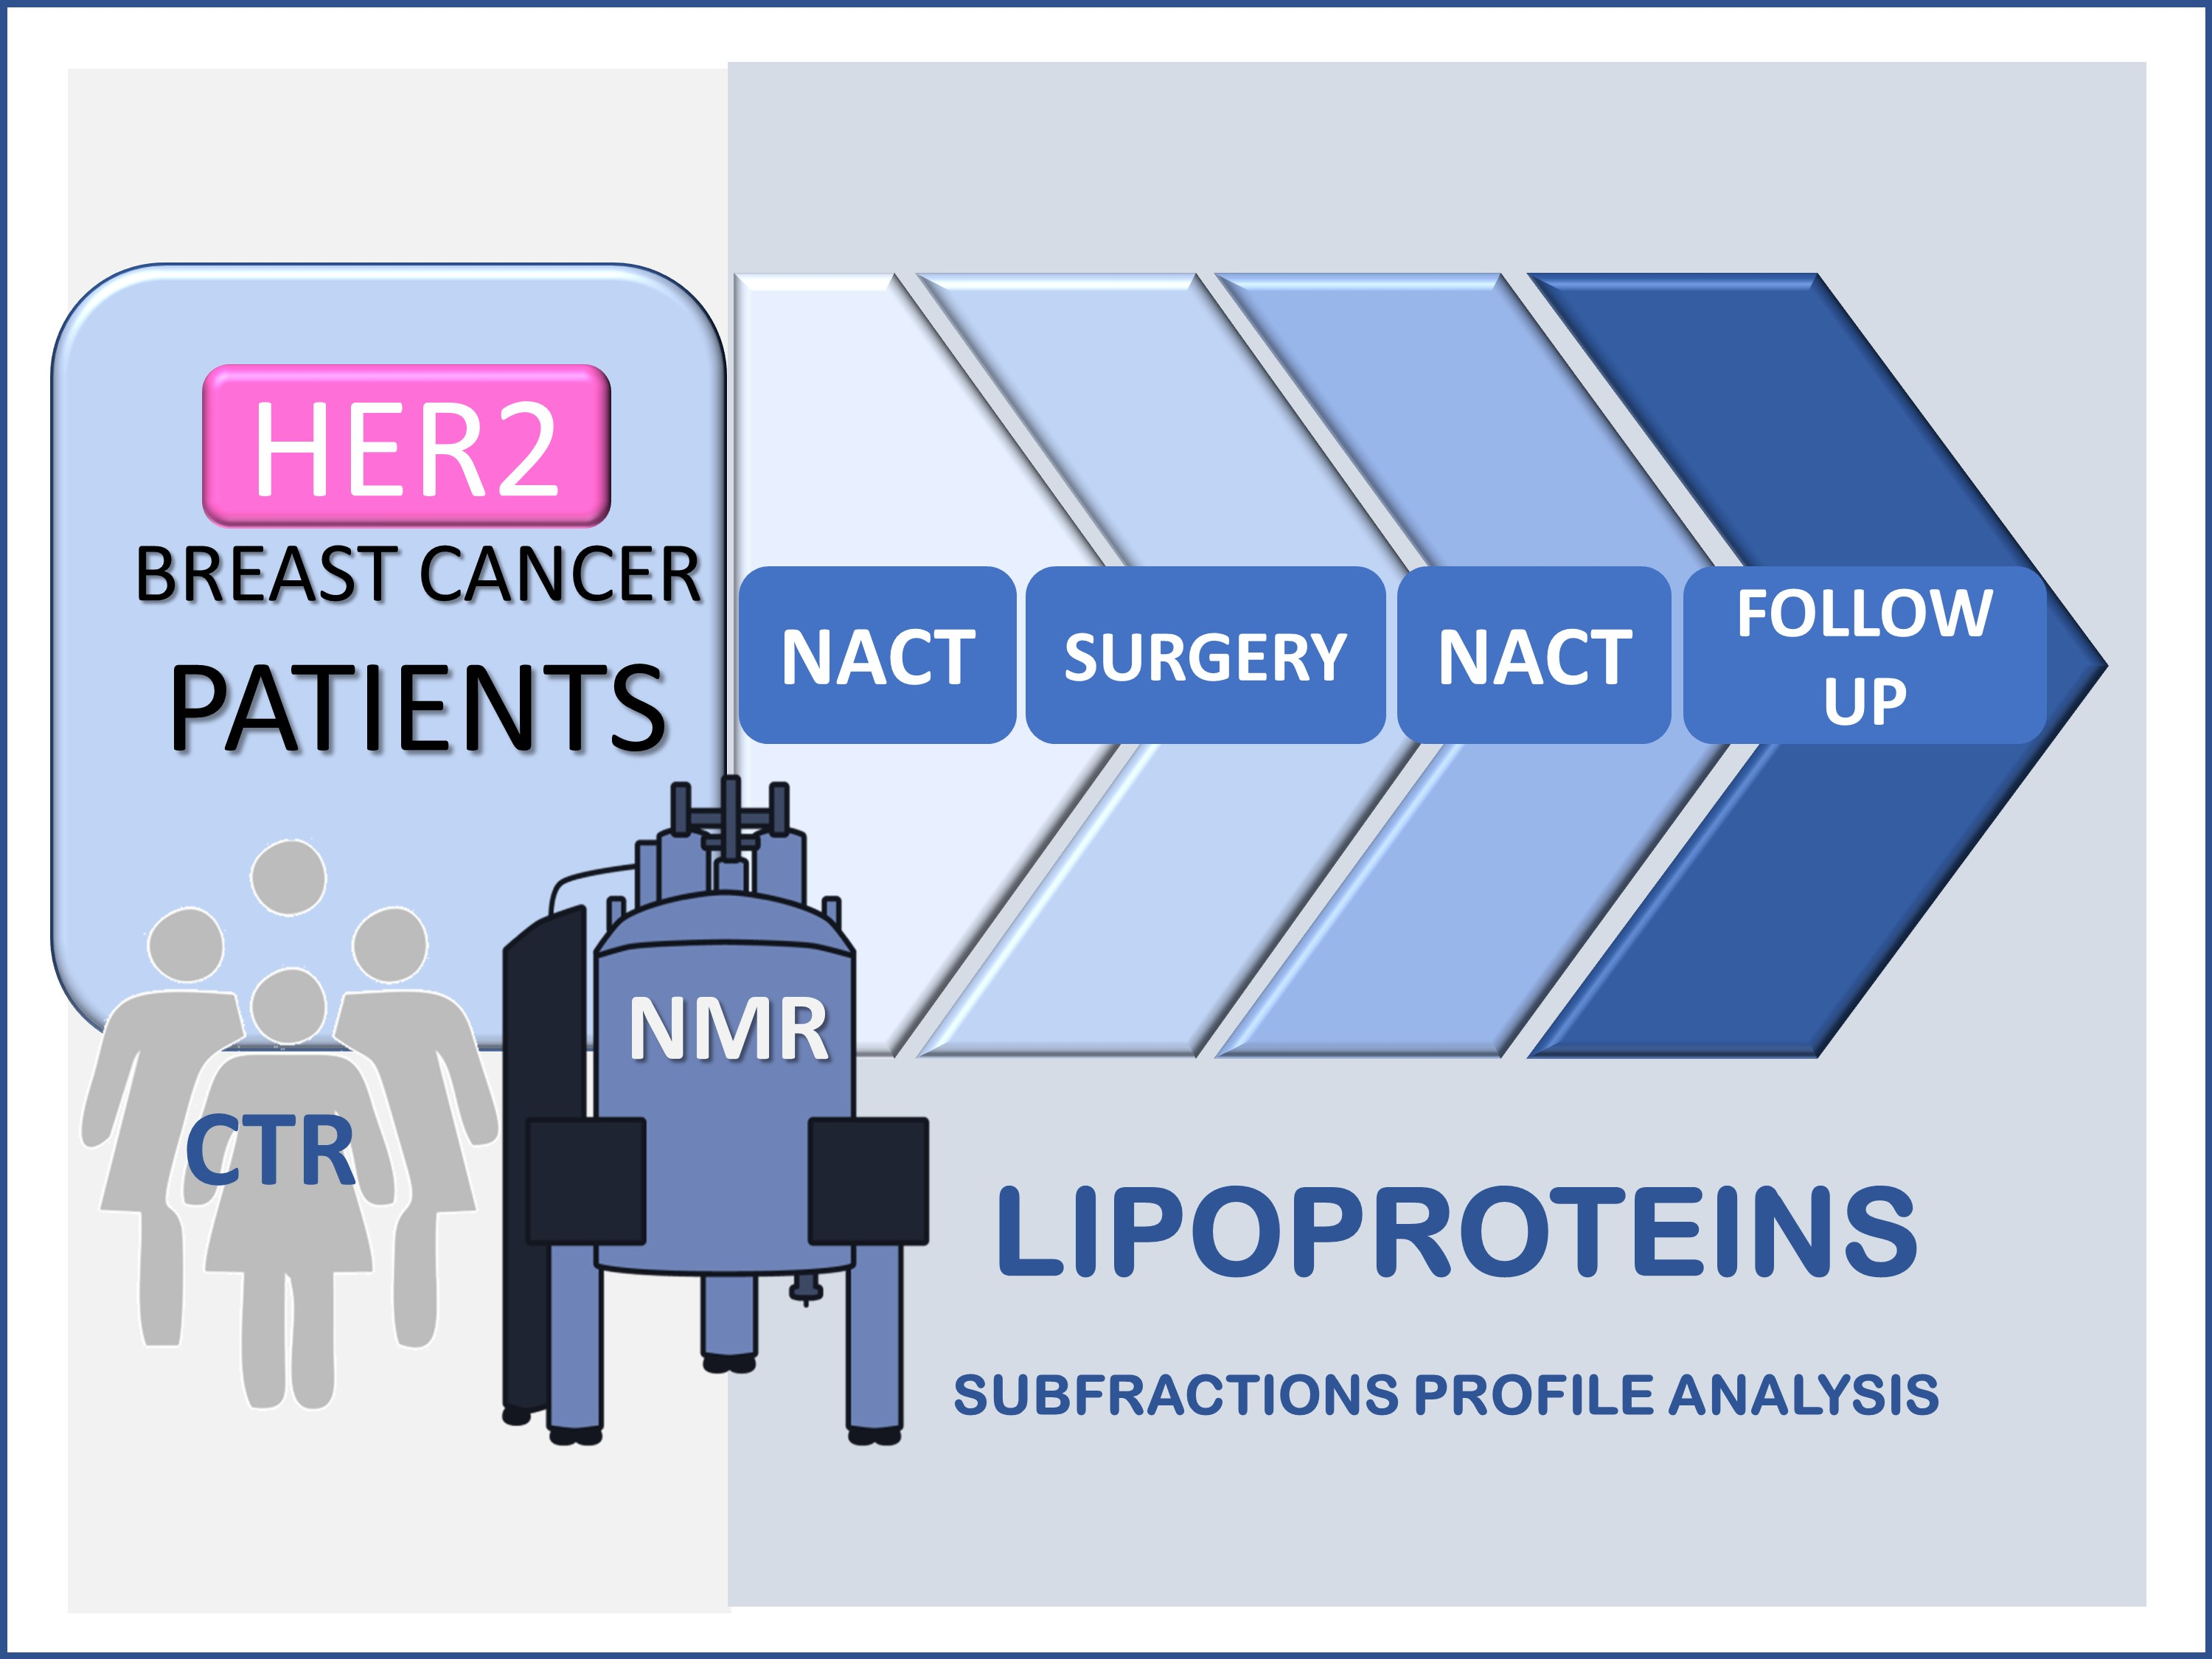
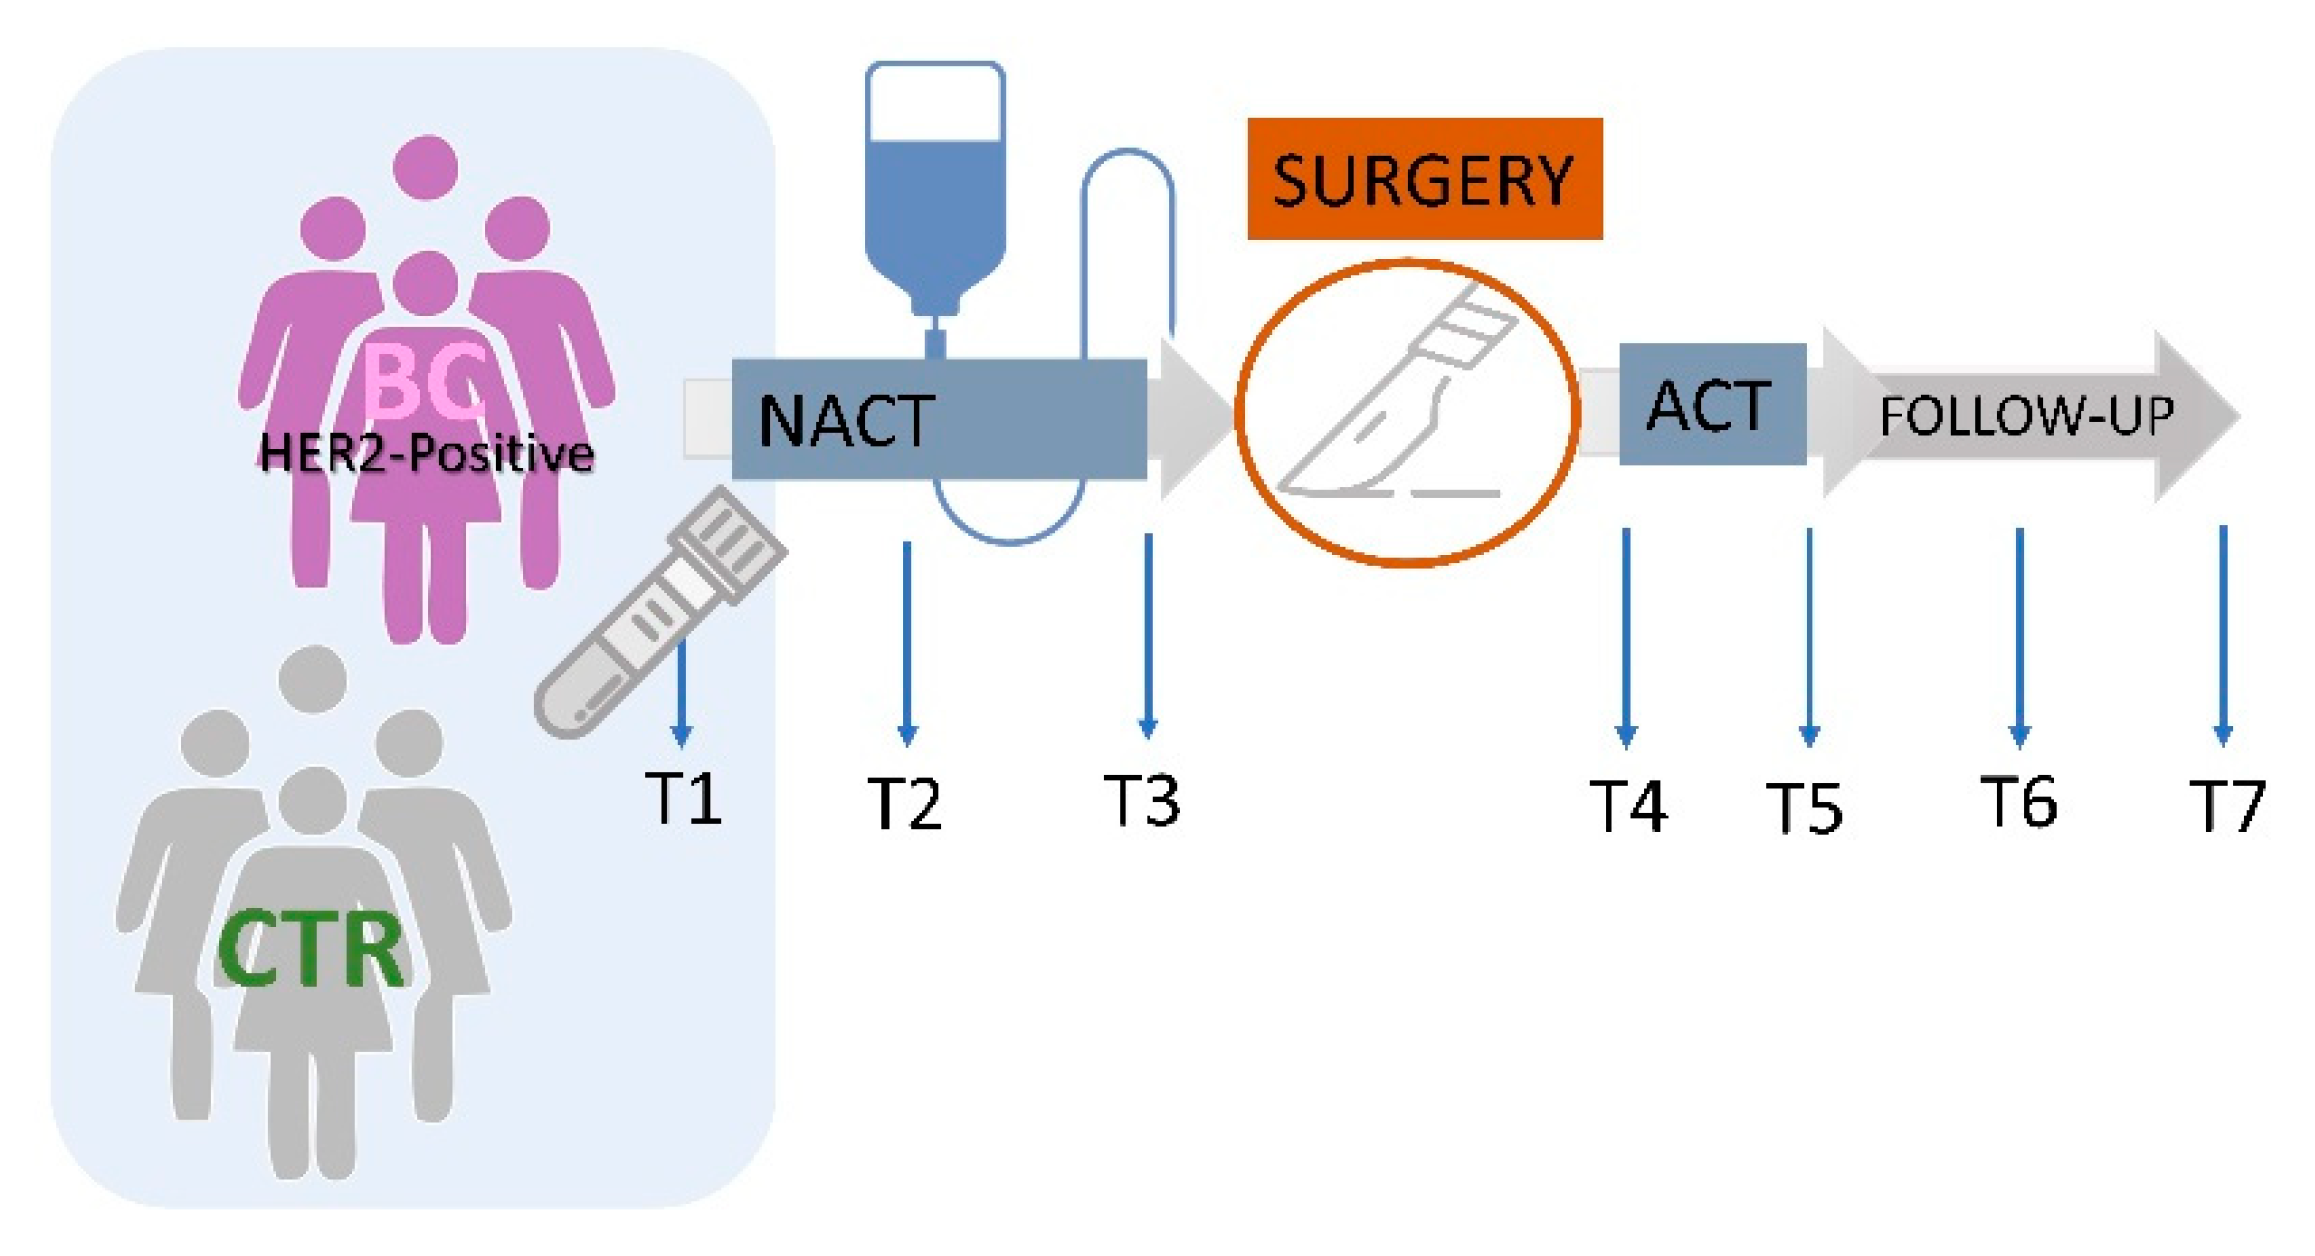
The study population included 43 BC patients and 28 age-matched healthy women as a control group (CTR). A subset of 32 patients was monitored during NACT, surgery, adjuvant chemotherapy treatments (ACT), and up to two-year follow-up. Participants were recruited from July 2006 to October 2010 at Centro di Riferimento Oncologico of Aviano, Italy. All the patients were diagnosed with locally advanced HER2-positive BC confirmed by histology, and all were suitable to undergo NACT consisting of six cycles of trastuzumab, loading dose 4 mg/kg intravenously, then 2 mg/kg weekly, with concomitant weekly administration of paclitaxel (80 mg/m2) every 21 days. The targeted pharmacological therapy was followed by surgical removal of the tumour and axillary node dissection whether sentinel lymph nodes were involved. All patients after surgery received adjuvant chemotherapy (ACT) consisting of three cycles of the paclitaxel-trastuzumab regimen followed by three months of trastuzumab administered alone at a dose of 2 mg/kg weekly.
The investigation was carried out in accordance with the principles of the Declaration of Helsinki and approved by the Ethics Committee of Centro di Riferimento Oncologico di Aviano. All subjects gave written informed consent (Clinical trial gov ID: NCT 02307227).

2.2. Study Design

This translational trial aimed at investigating the baseline status of circulatory lipoproteins in HER2-positive BC patients in comparison with an age-matched healthy group of women as well as the plasma lipoproteins profile changes along the therapeutic interventions and follow-up. Venous blood samples were collected under fasting conditions: at the diagnosis (T1), after three (T2) and six months (T3) from the NACT treatment, at two (T4) and six (T5) months from the surgery and in the first (T6) and second-year follow-up (T7) (Figure 1). The overtime variations in plasma lipoproteins fractions were investigated as a function of the achievement of the pathological complete response to NACT and to describe the differences of lipid trajectories associated with disease relapse within the 10 years of follow-ups.

2.3. Sample Collection

Plasma was acquired from whole blood samples collected under fasting conditions from each patient and volunteer enrolled. After collection in 5 mL tubes with anticoagulant citrate dextrose (ACD), blood samples were centrifuged at 2100 rpm for 15 min at 4 °C. The plasma in the supernatant was transferred to clean cryovials and stored at −80 °C until 1H-NMR analysis.

2.4. 1H-NMR Lipoproteins Analyses

Plasma lipoproteins profiles were measured by one dimensional (1D) proton 1H-NMR spectroscopy. All plasma samples were analysed following the standard operating procedures developed by our laboratory. Briefly, after thawing, 350 µL of each plasma sample were mixed with the same volume of a sodium phosphate buffer (70 mM Na2HPO4·7H2O; 6.1 mM NaN3; 4.6 mM sodium trimethylsilyl [2,2,3,3-2H4]-propionate (TMSP), 20% (v/v) 2H2O in H2O; pH 7.4). The mixture was homogenized by vortexing for 30 s. A total of 600 µL of this mixture was transferred into a 5 mm NMR tube for the NMR analysis. The 1H-NMR spectra were acquired at 310 K using a Bruker 600 MHz NMR spectrometer operating at 600.13 MHz proton Larmor frequency.
Lipoproteins’ subclassification and lipid quantification was performed using the Bruker IVDr Lipoprotein Subclass Analysis platform™ (B.I.-LISA, Bruker BioSpin, Singapore) that applies a validated prediction algorithm based on the PLS regression model [39,40]. The lipoproteins panel encompasses, besides the total HDL, LDL, IDL, and VLDL, 16 different subfractions numerically sort by increasing density and decreasing size: four HDL-subfractions (HDL-1 to HDL-4), six LDL subfractions (LDL-1 to LDL-6), six VLDL subfractions (VLDL-1 to VLDL-6). For each subfraction, Chol, free-Chol, PLs, TGs, Apo A1, A2, B100 fractions were quantified together with 10 particle numbers and Chol-LDL/Chol-HDL and Apo-B100/Apo-A1 ratios for a total of 112 parameters (Table S1).

2.5. Statistical Analyses

Quantitative lipoproteins profile data from 1H-NMR spectra were pre-processed by log transformation and Pareto-scaled before statistical analyses. Multiparametric supervised PLS-DA was used to determine differences in lipoproteins subtractions parameters between HER2-positive BC and CTR groups as well as to find associations with the pathological complete response to the NACT. The PLS-DA models were validated using K-fold cross-validation (CV), splitting the dataset into seven different subsets and using the six subsets as a training set and the left single subset for testing the model. The quality parameters R2 and Q2 were used to evaluate the goodness of fit and the predictive ability of the model, respectively. A permutation test was carried out to exclude data over-fitting while the cross-validated residuals ANOVA was performed to assess PLS-DA model reliability. Significant different lipoprotein subfractions were selected by variable Importance in Projection (VIP) and by univariate Student’s t-test. False discovery rate (q) based on multiple comparison procedures was assessed to control simultaneous statistical inferences. A statistically significant variable was considered for a q < 0.05 unless otherwise specified. Receiver operating characteristic (ROC) analyses were applied to determine the diagnostic power of the selected plasma lipoproteins concentrations for differentiating the groups of interest. The time-related trends in the lipoprotein subfractions along therapeutic interventions and follow-up were investigated by one-way analysis of variance (ANOVA) followed by Tukey’s post hoc. Time-dependent plasma lipoproteins trajectories were obtained for patients with and without recurrence, plotting the mean scores of the first two components of the principal component analysis (PCA) model of plasma lipoproteins evaluated at each time-point from T4 to T7 [41]. Data statistical analyses were carried out using SIMCA (Umetrics, v. 14.1) software and Metaboanalyst v. 4.0 [42].

3. Results

3.1. Study Populations’ Characteristics

The 43 HER2-positive BC and 28 healthy women enrolled in the study showed homogeneous demographic characteristics (Table 1). The median age of the patients and CTR group was 49 years (range: 23–70) and 50 years (range: 28–70), respectively (p = 0.905). The two groups did not differ for the body mass index (BMI) (p = 0.801) with a prevalence of normal weight (BMI < 25) in both groups corresponding to 64.7% of the BC patients and 70.1% in the CTR population, respectively. Pre-menopausal women accounted for 58.1% of BC patients and for 57.1% of controls, respectively, while the remaining 41.9% of BC patients and 42.9 of controls were in post-menopausal status (p = 1, Fisher exact test). At the diagnosis, 76.7% of the HER2-positive BC presented stage II disease, while the remaining were classified at stage III. Over half (53.5%) of BC tumours were characterized by a highly proliferative tumour index with a Ki67 ≥ 20, while 46.5% had a less aggressive phenotype. A little more than half (51.2%) of patients carried oestrogen receptor (ER) positive tumours. All patients underwent NACT based on trastuzumab-paclitaxel followed by surgery. The 56.2% of patients achieved pathological complete response (CR) after treatments while the remaining ones reported only a partial response (PR). Over the 10 years of follow-ups, the disease relapse occurred in 28.1% of the patients, where the majority belonged to the ER-positive subtype (89%).

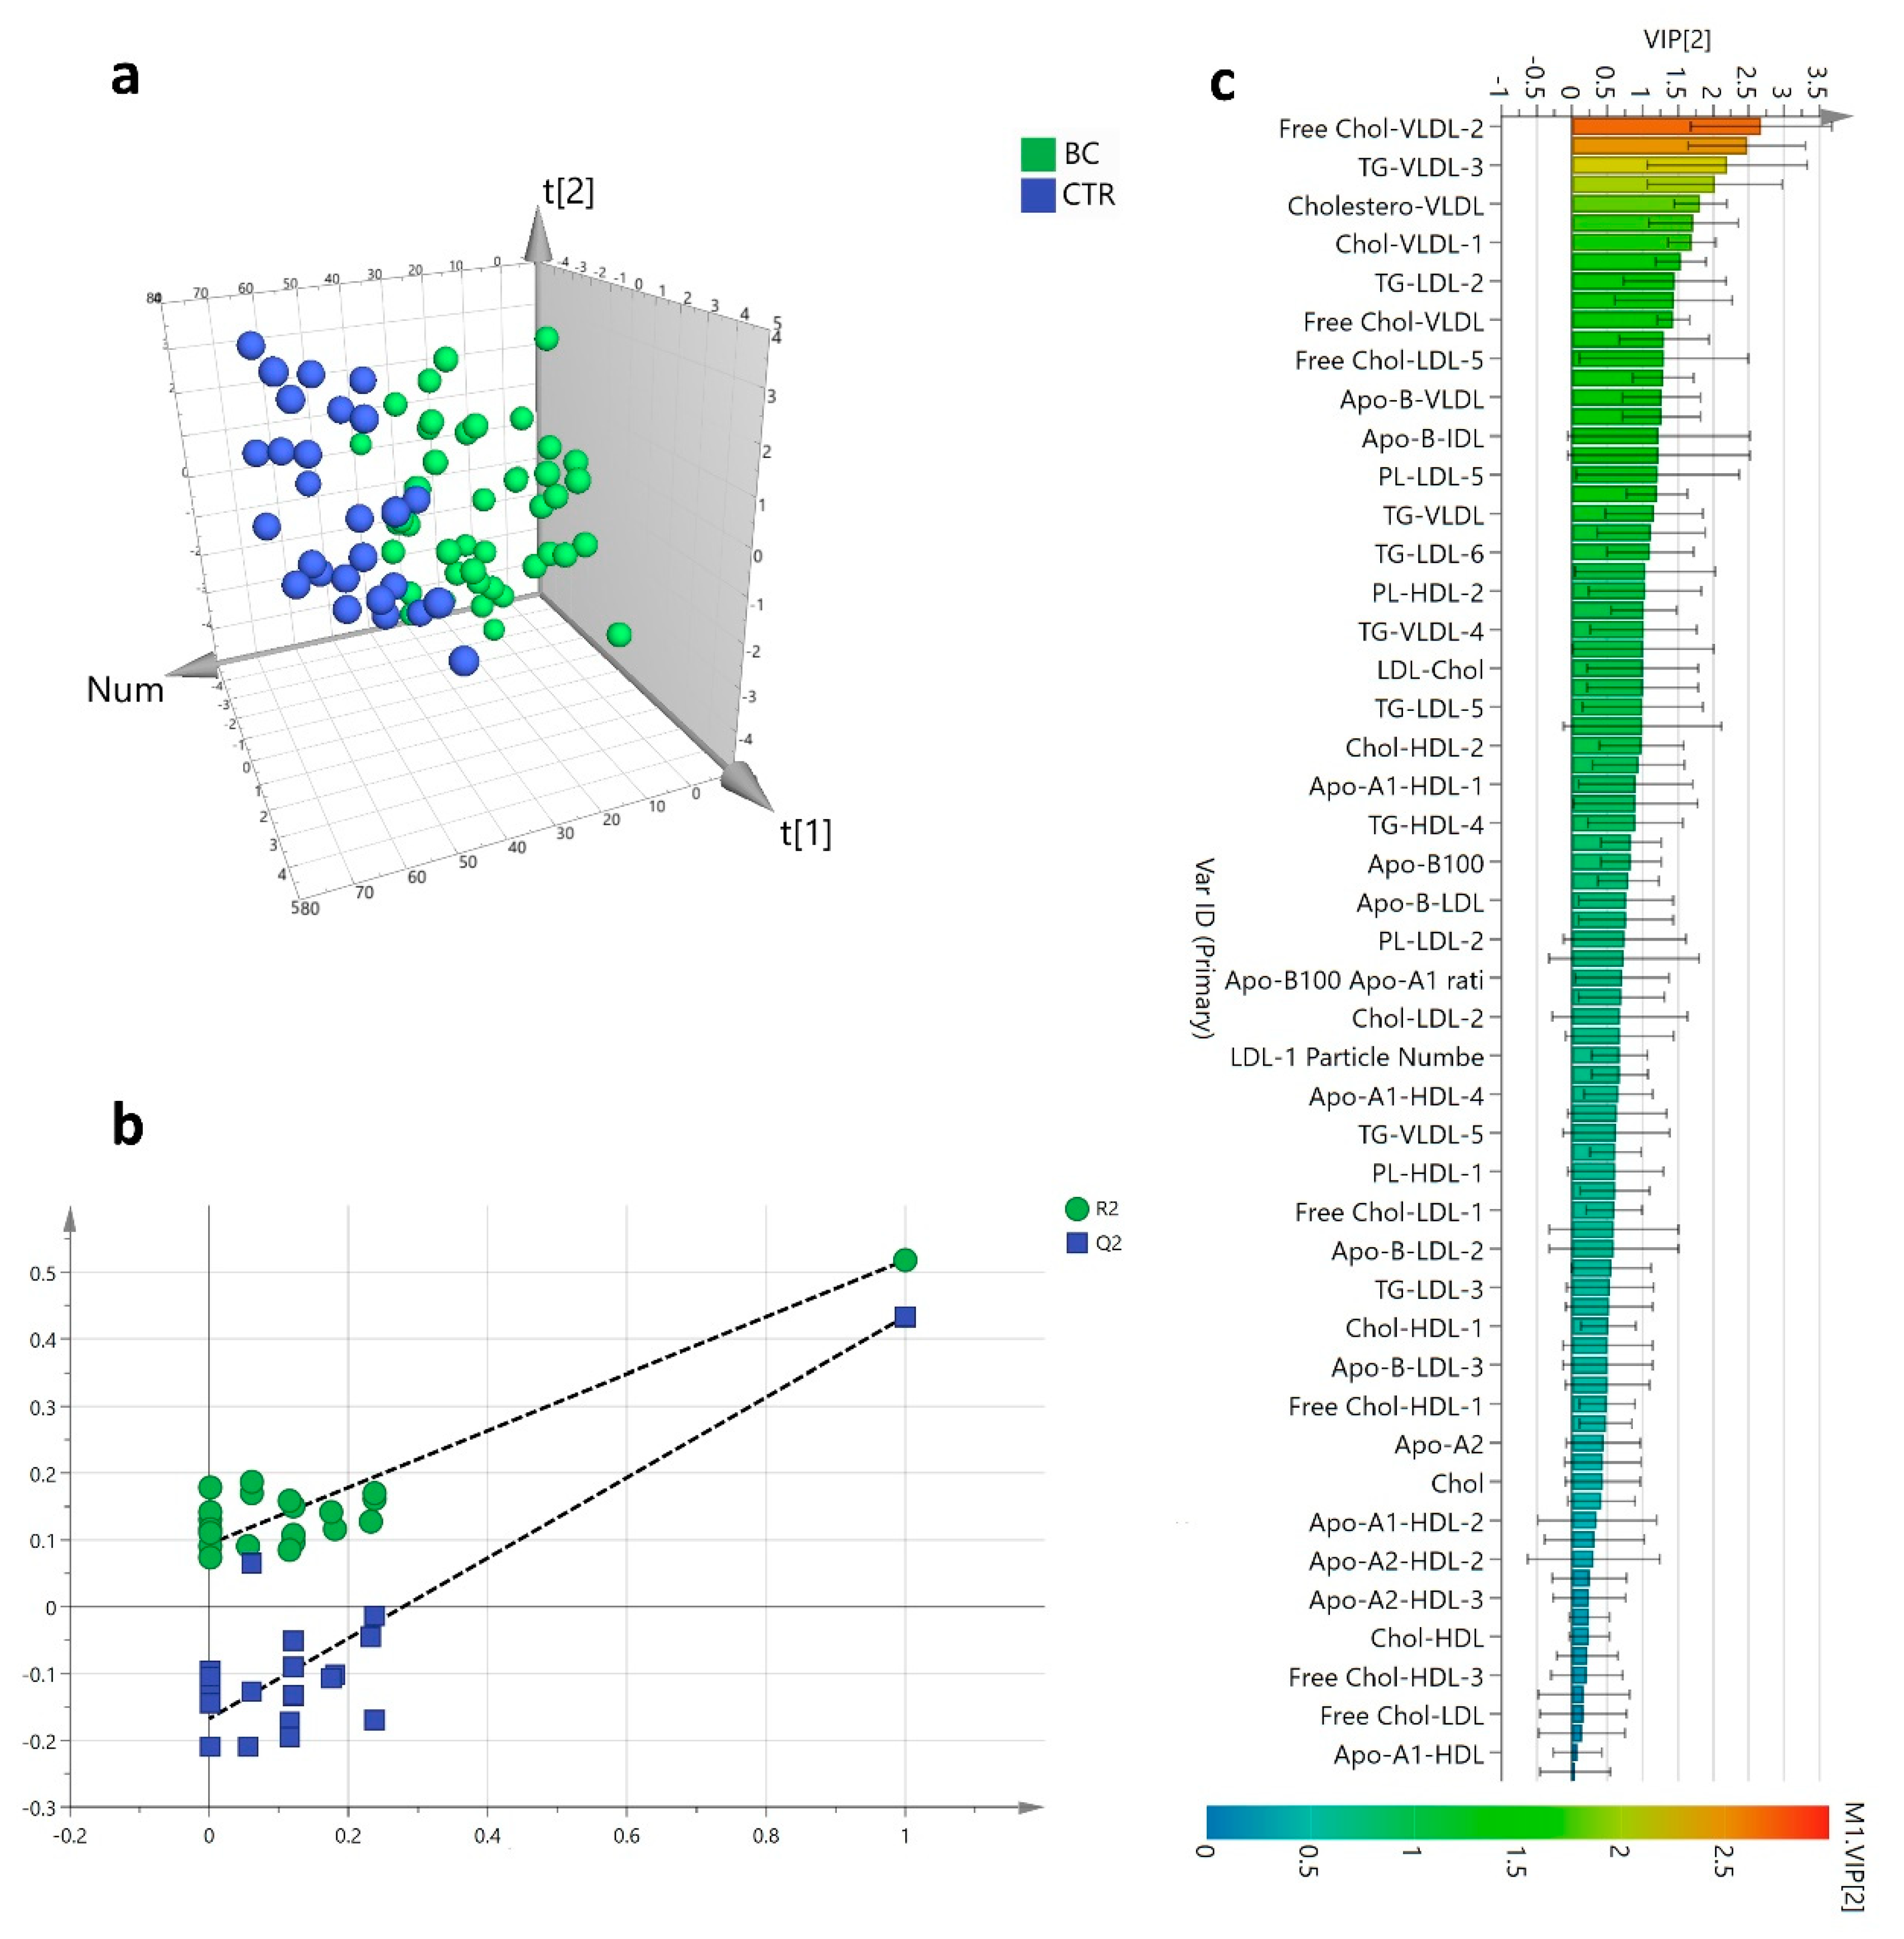
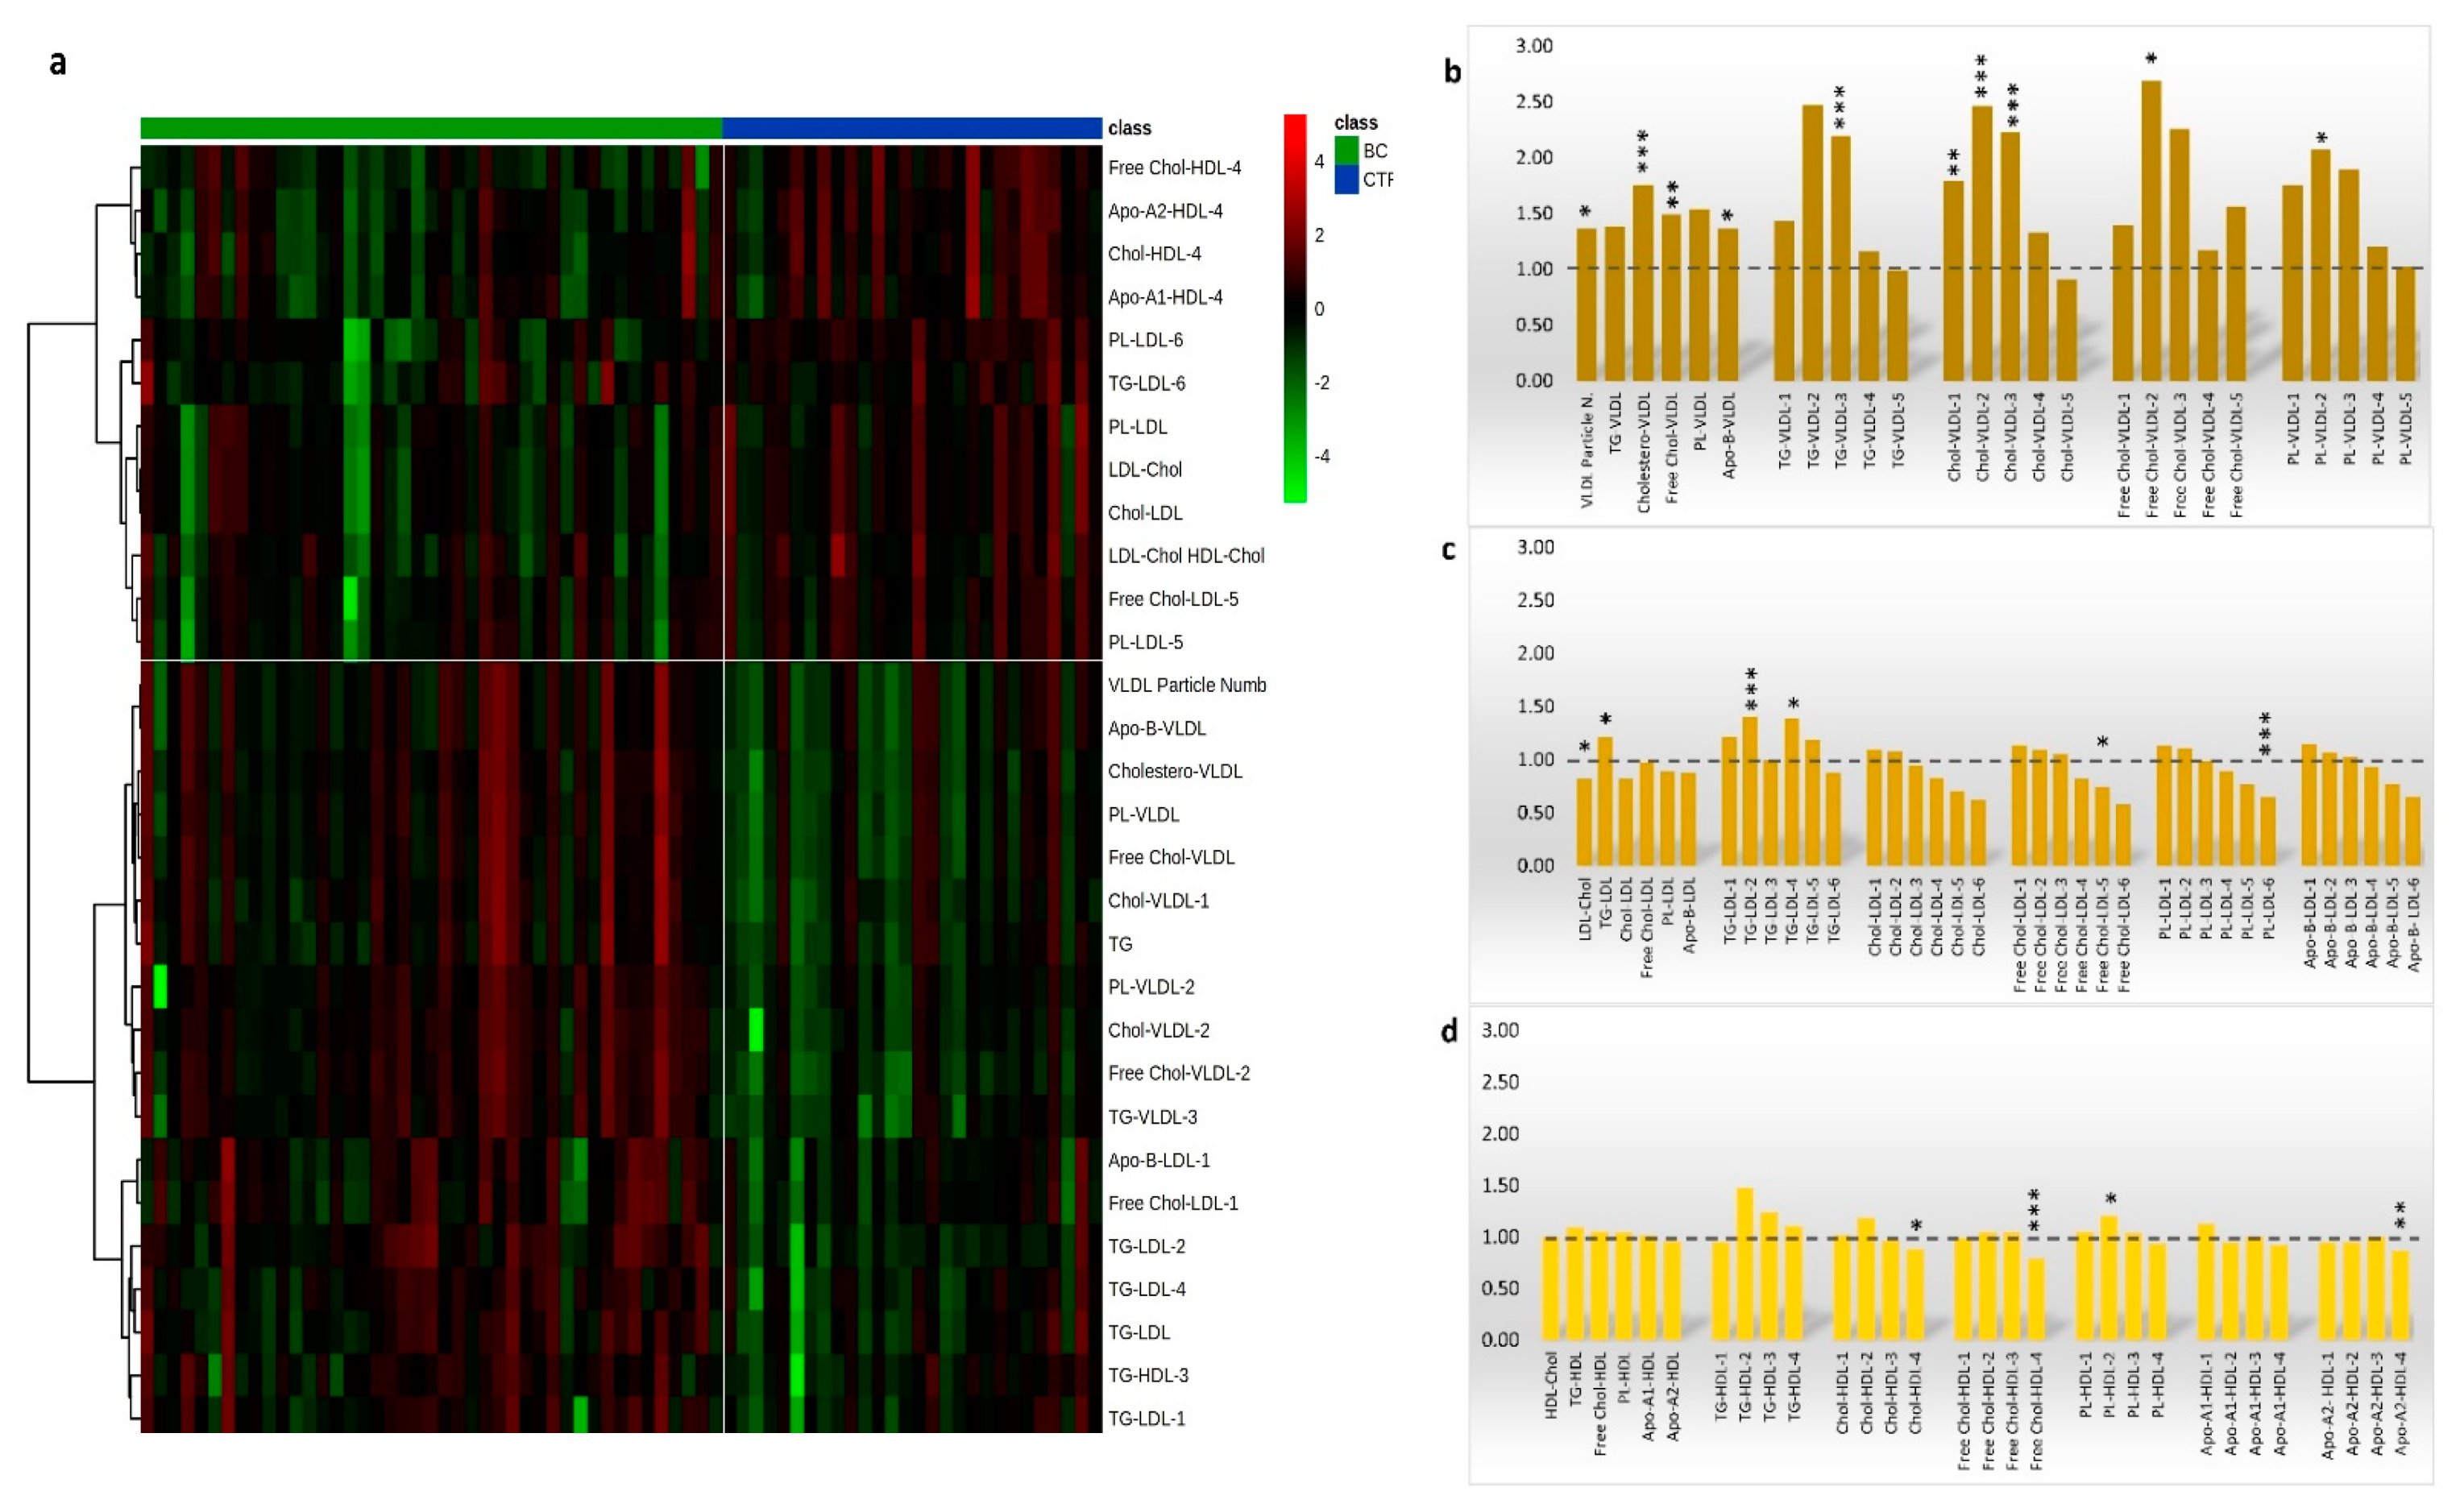
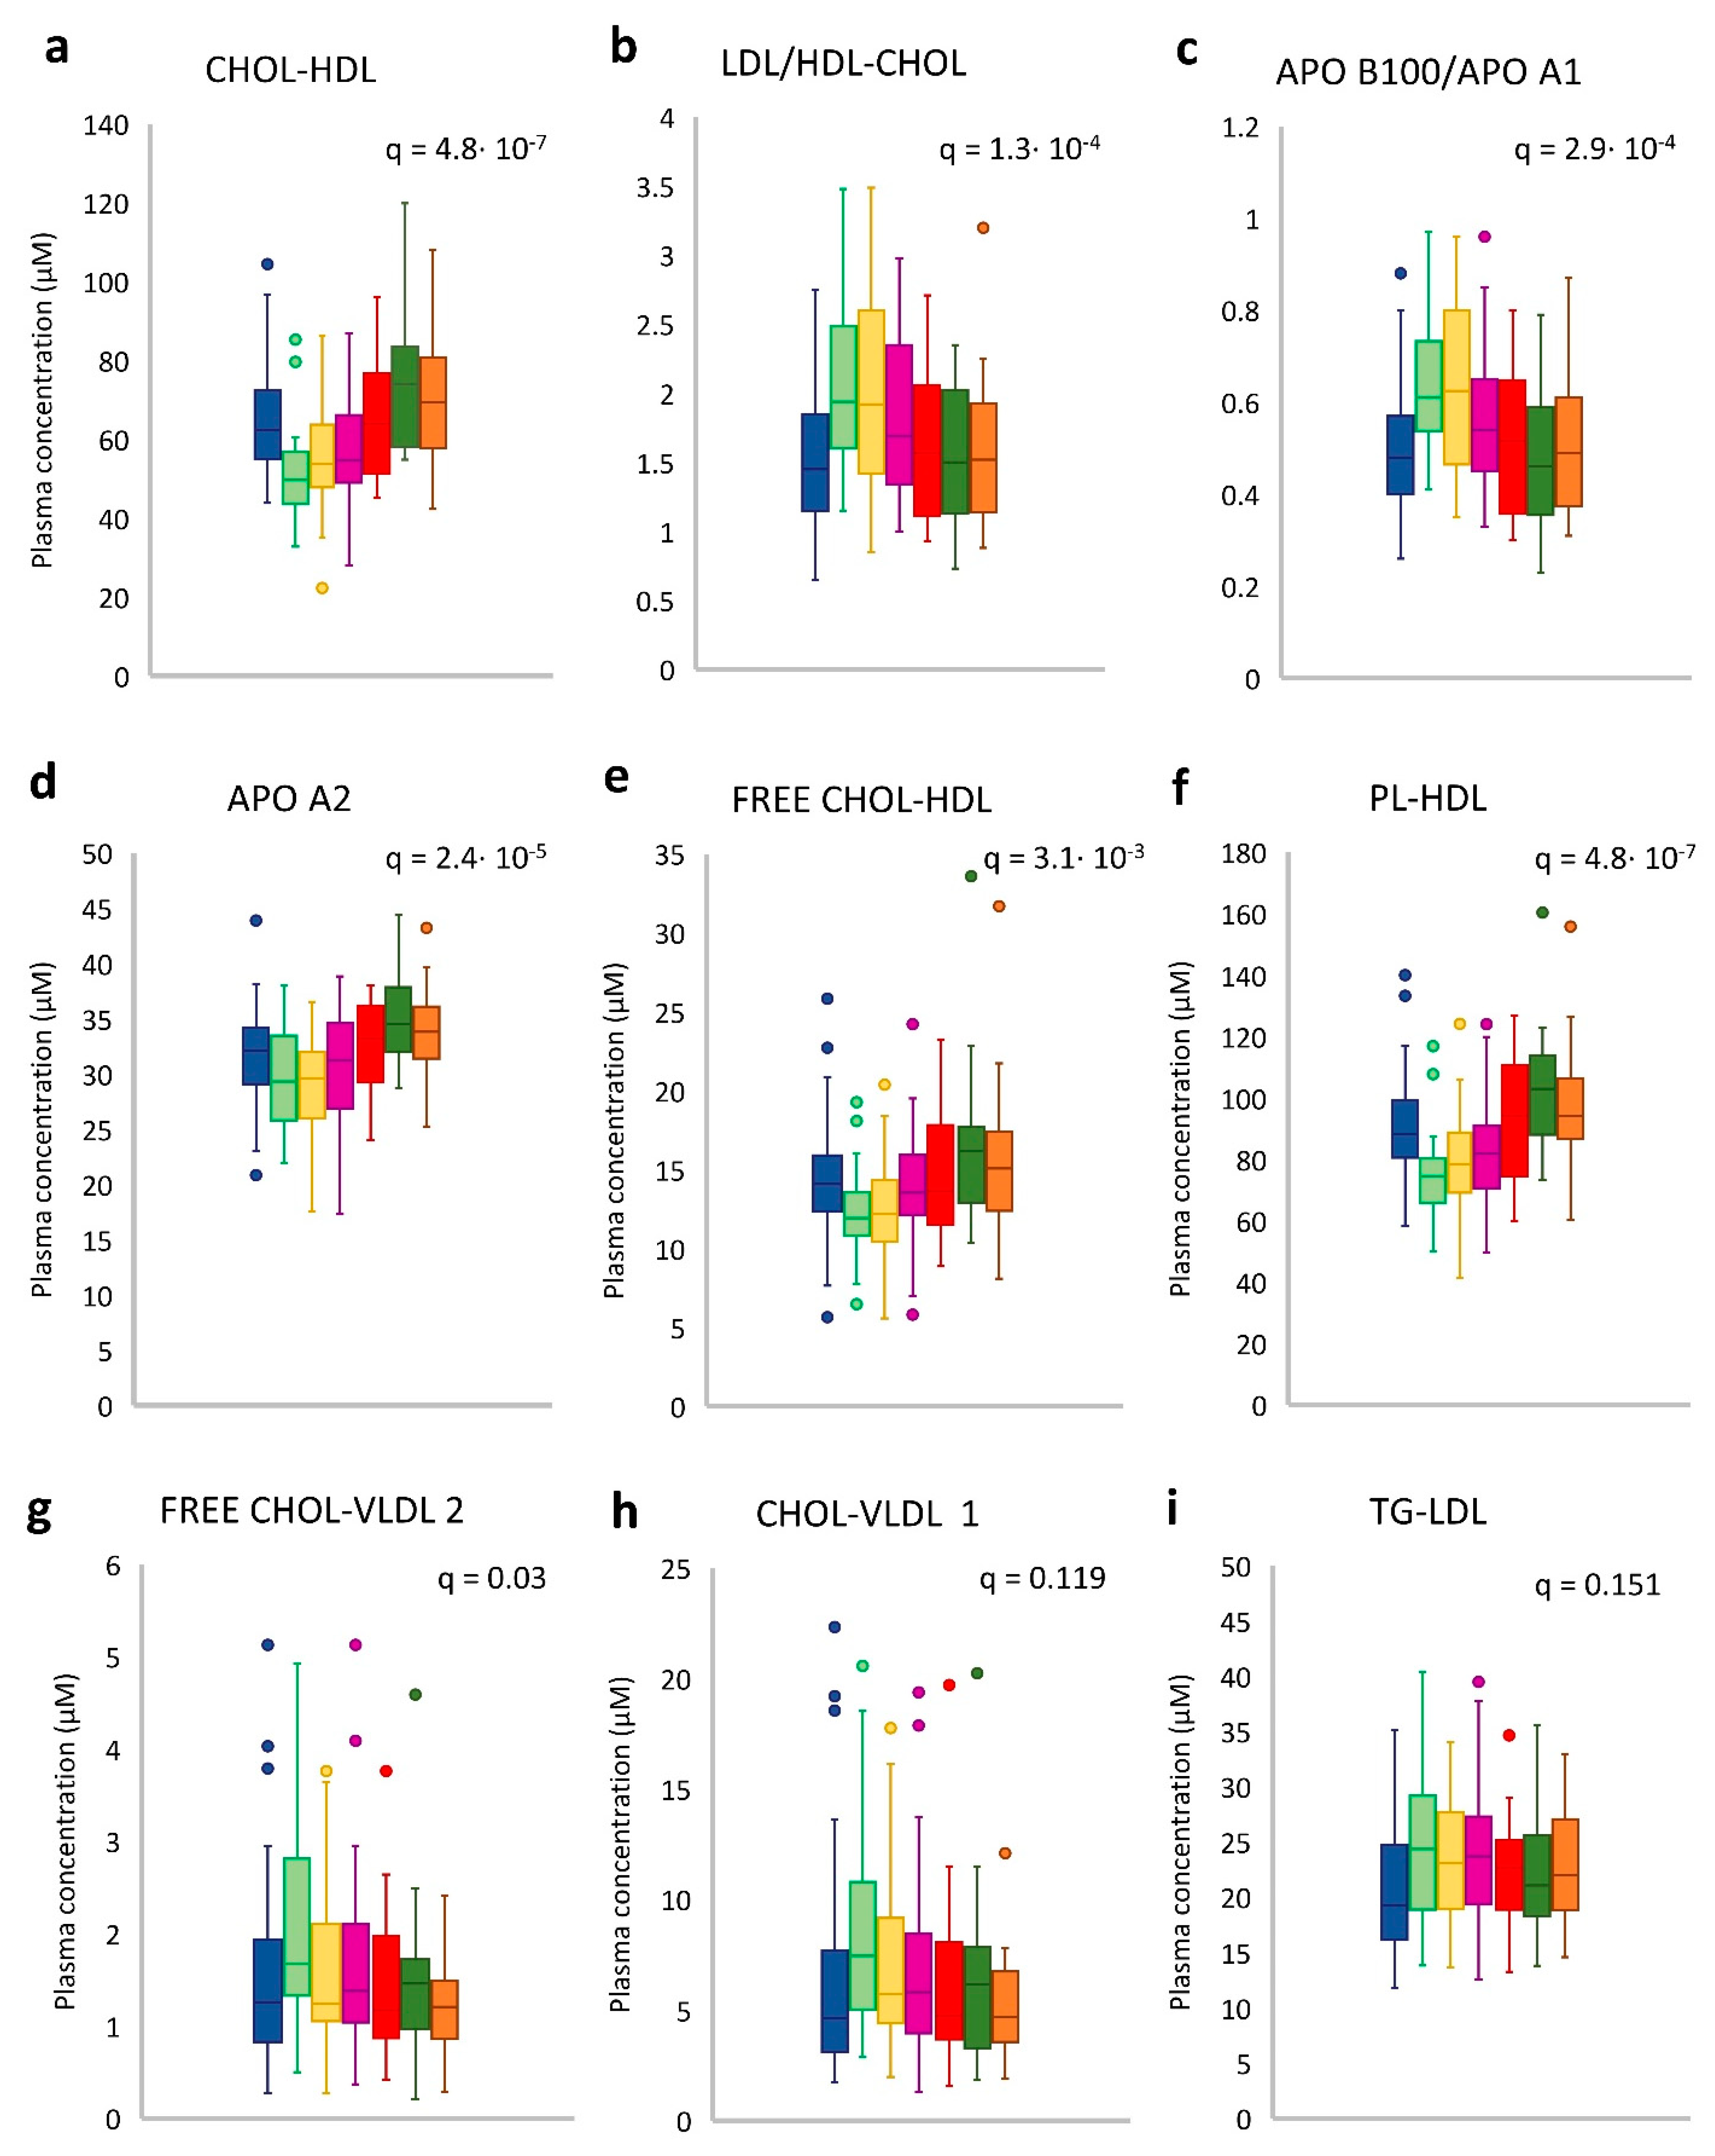
3.2. Lipoproteins Subfractions Profile in HER2-Positive BC Patients vs. CTR Group

The 1H-NMR plasma lipoproteins profile targeted 112 lipoproteins’ parameters of which 101 (90%) were quantified while 11 (10%) were excluded being out of range of the validated assay (Table S1). The supervised partial least squares discrimination analysis (PLS-DA) showed that HER2-positive BC patients had a spatial distribution significantly different from that of the CTR group (Figure 2a) The classification model had good reliability (R2 = 0.79, Q2 = 0.47) yielding 90.7% of sensitivity and 92.9% of specificity without any potential risk of over-fitting (Figure 2b). The lipoproteins’ subfractions that significantly contributed to group separation (VIP ≥ 1) belonged mainly to the VLDLs and LDLs (Figure 2c). The relative concentration distributions of such lipoproteins between the two groups are reported in a heatmap (Figure 3a) together with the fold-change referred to the CTR group (Figure 3b–d).
The plasma level of overall VLDL resulted significantly increased in HER2-positive BC patients, in particular for their total Chol-VLDL (p = 6.9 × 10⁻⁵; q = 0.001), free-Chol (p = 0.001; q = 0.006) and PLs (p = 3.7 × 10⁻⁴; q = 0.004) contents (Table S2). Among VLDL subfractions, significant differences were observed in particular for the VLDL-1, VLDL-2, and VLDL-3 whose Chol contents resulted in 1.8, 2.5, and 2.2-fold higher in BC compared with the CTR group respectively (Figure 3b, Table S2). The LDLs were found slightly low in HER2-positive BC patients especially the LDL-4, LDL-5, and LDL-6 carrying free-Chol, PL, and ApoB (Figure 3c, Table S2) while a significant decrease was observed for the PL-LDL-6 (p = 4.9 × 10⁻⁶; q = 2.1 × 10⁻⁴) and the free- Chol-LDL-5 (p = 0.012; q = 0.049) subfractions (Table S2). Conversely, the TGs contents of LDL-2 and LDL-4 resulted in significant increases in BC patients as well as the total TGs (p = 0.005; q = 0.023). Unlike VLDLs and LDLs the plasma HDLs were generally poorly affected by the presence of the HER2-positive BC (Figure 3d), except for the content of free Chol (p = 6.5 × 10⁻⁵; q = 0.001), Chol (p = 0.002; q = 0.013) and Apo A2 (p = 0.001; q = 0.008) in HDL-4 that resulted significantly decreased in BC patients (Table S2). The plasma lipoproteins profile was also investigated according to menopausal status. Within the BC group, the post-menopausal patients showed higher baseline HDL and LDL subfractions compared with pre-menopausal ones, while for the VLDLs subfractions no differences were observed (Figure S1). Moreover, no alterations in baseline circulatory lipoproteins were found associated with the tumour’ ER status since the PLS-DA showed many overlaps between ER-positive and ER-negative patients (Figure S2).

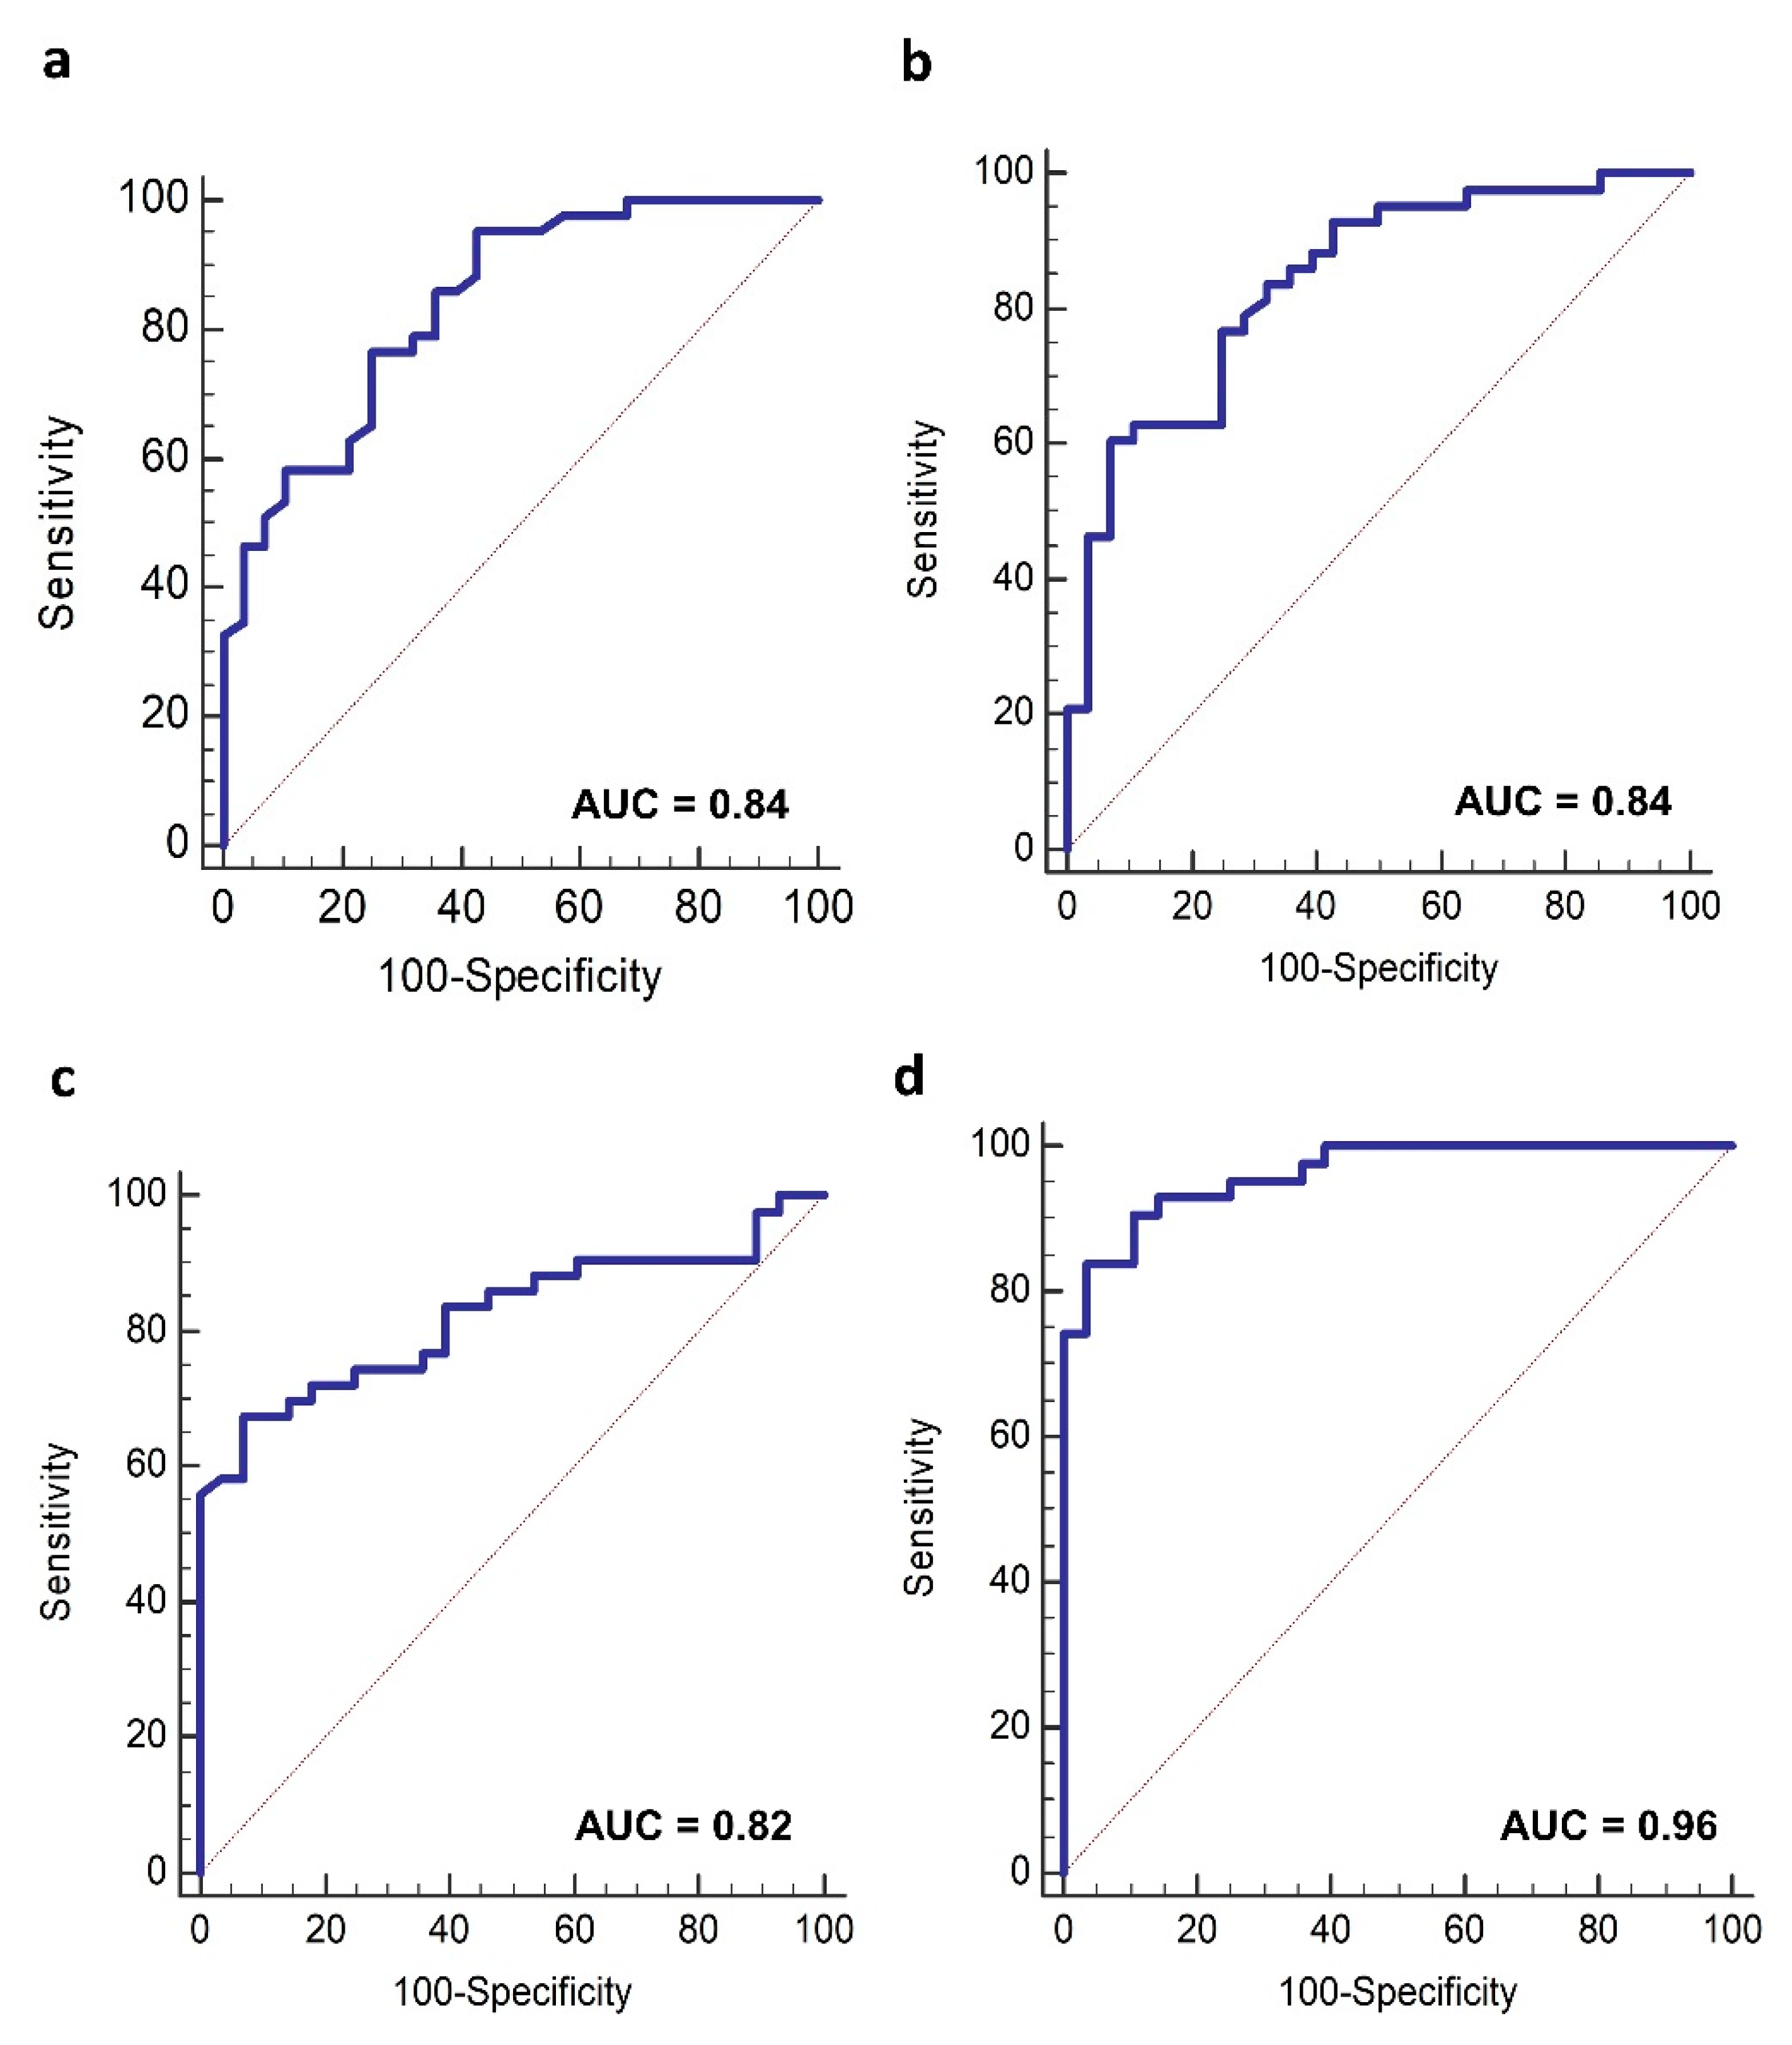
3.3. Lipoproteins Profile and HER2-Positive BC Diagnosis

The potential diagnostic value of baseline levels of VLDL lipoproteins subfractions for distinguishing HER2-positive BC patients from healthy CTR was investigated by ROC analyses. The highest AUC was obtained for the free Chol-VLDL-2 (AUROC = 0.84, 95% CI 0.75–0.93), Chol-VLDL-2 (AUROC = 0.84, 95% CI 0.73–0.92), and PL-LDL-6 (AUROC = 0.82, 95% CI 0.71–0.90) (Figure 4a–c). The combination of these lipoproteins subtractions was found to increase the AUC to 0.96 (95% CI 0.89–0.99) with a sensitivity and specificity of 83.72% and 96.43%, respectively (Figure 4d).

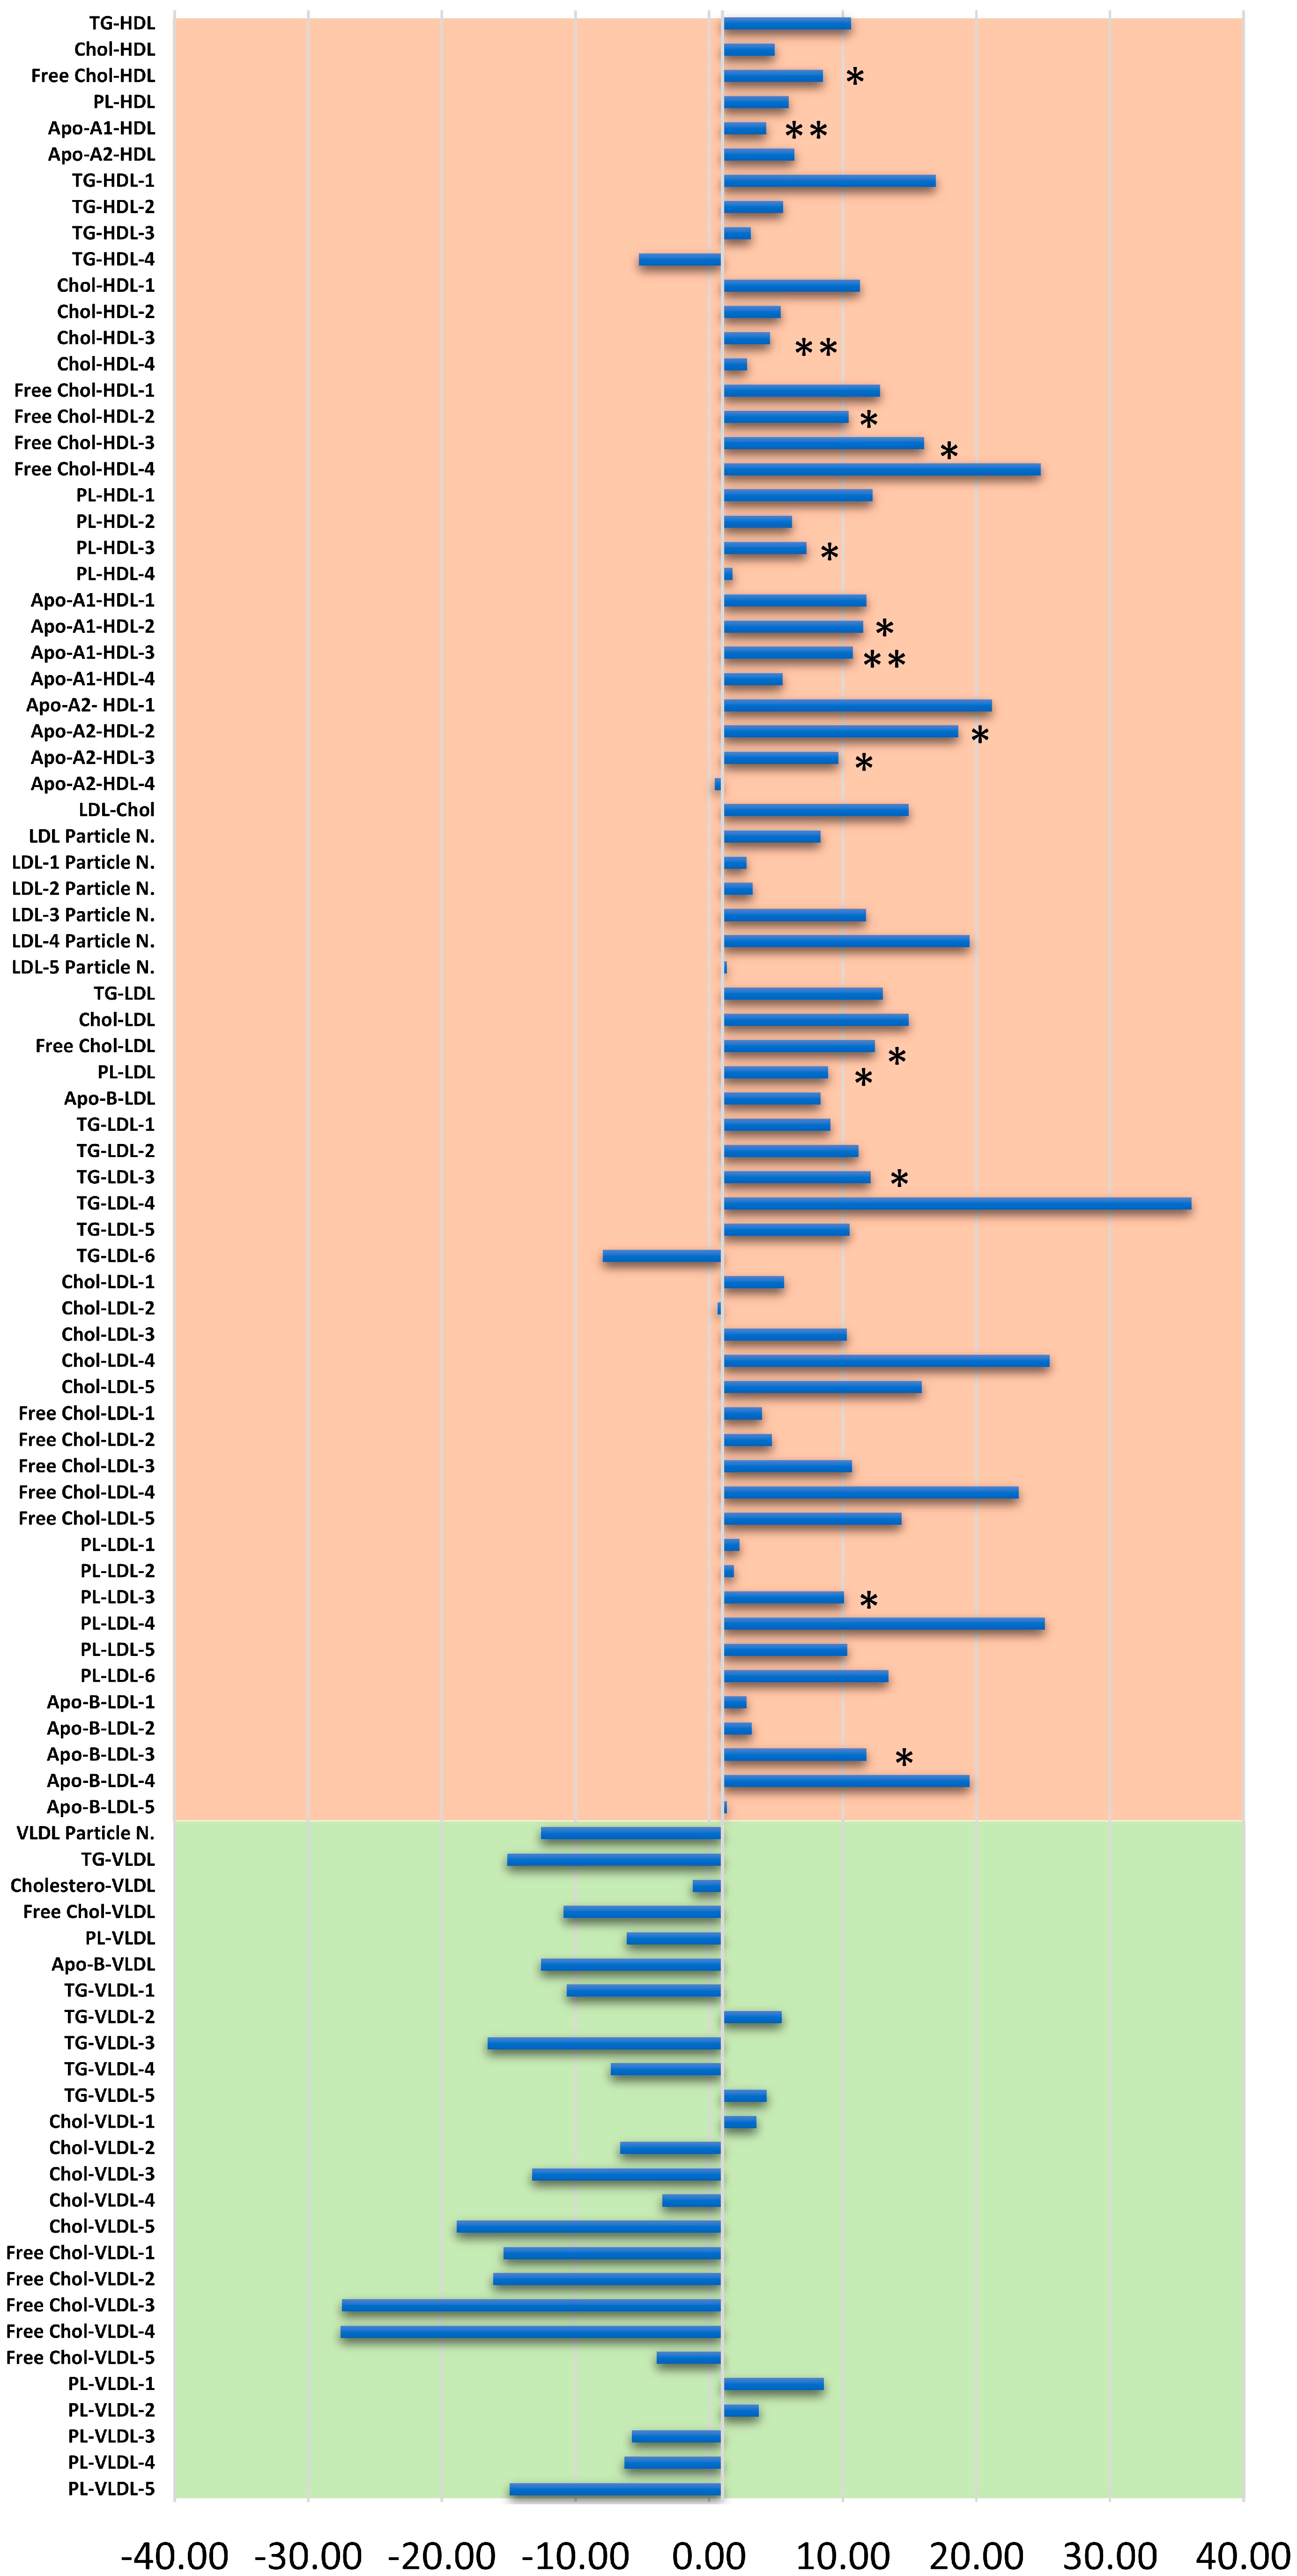
3.4. Lipoproteins Profiles Time Changes

The plasma 1H-NMR lipoproteins profiles were monitored over time in a subgroup of 32 HER2-positive BC patients to highlight the effect of treatments on circulatory lipids and lipoproteins status. The ANOVA analysis showed that the HDL was the class mainly affected by the pharmacological intervention (Table S3). Almost all the lipids and apolipoproteins belonging to the HDL class underwent a significant drop during the first 3 months (T2) of NACT. The principal alterations regarded the Chol-HDL (p = 1.4 × 10⁻⁸; q = 4.8 × 10⁻⁷), Apo A2 (p = 2.5 × 10⁻⁶; q = 2.4 × 10⁻⁵), free Chol-HDL (p = 6.2 × 10⁻⁴; q = 3.1 × 10⁻³) and PLs-HDL (p = 8.8 × 10⁻⁹; q = 4.8 × 10⁻⁷) (Table S3). In agreement with such specific and selective HDLs drop, the Chol-LDL/Chol-HDL ratio, as well as their respective Apo B100/ApoA1 ratio, showed marked increases during the first 6 months of NACT that were restored to baseline levels only at the end of the two-year follow-up (Figure 5b,c). Among the other lipoproteins classes, only the free Chol-VLDL-2 (p = 0.008; q = 0.033) increased during paclitaxel–trastuzumab treatment (Figure 5g) together with the Chol-VLDL-1 (p = 0.031; q = 0.119) (Figure 5h), and total TG-LDL (p = 0.042; q = 1.372), (Figure 5i), however these latter did not retain the statistically significance after the correction for multiple tests. Surgery only partially affected the lipoproteins profile since non-significative differences can be reported from T3 and T4 time points. Interestingly, the same dose of paclitaxel-trastuzumab during the first two months of ACT (T4) does not replicate the HDLs drops early observed during NACT but from T2 up to T7, it was instead reported a gradual increase above the baseline levels (Figure 5a,d–f).
At the end of the two years of follow-ups (T7), almost all the HDL and LDL subfractions resulted in a slight increase of about 6.9% (range, −5.3–24.9%) and 10.3% (range, −7.9–30.1%), respectively as compared with baseline levels; conversely, the majority of the VLDL subfractions had lower results than the initial condition with a relative percentage difference of −9.01% (range, −27.59–8.58%) though not reaching statistical significance (Figure 6).

3.5. Lipoproteins Changes and Clinical Outcome

The response to the NACT treatment was not homogeneous among patients. The best response consisted in the achievement of pathological CR which was reported in 18 patients while the remaining 14 experienced a PR with the residual presence of cancer cells. The main alterations of plasma lipoproteins occurred after the first three months of NACT treatment and were found associated with the pharmacological outcome. The PLS-DA of lipoproteins changes at three months clearly differentiated the CR from the PR groups (p = 0.05, CV-ANOVA) (Figure 7a).
The PLS-DA model showed acceptable performance (R2 = 0.75, Q2 = 0.27) without any potential risk of over-fitting (Figure 7b). The most relevant lipoproteins involved in the group separation (VIP ≥ 1) belonged mainly to the HDL class which had significantly lower results in the PR group compared with the CR (Figure 7c). In particular, the plasma reduction interested HDL-3 and HDL-4 subfractions and their Apo-A1, Apo-A2, and as well as their lipid contents with the exclusion of TGs. The mean overall fold change at three months of NACT treatment when referred to the baseline was 0.83 (range, 0.69–0.95) in PR patients, significantly lower than 0.98 (range, 0.82–1.13) (p = 2.9 × 10⁻⁵) reported in CR patients (Figure 8).

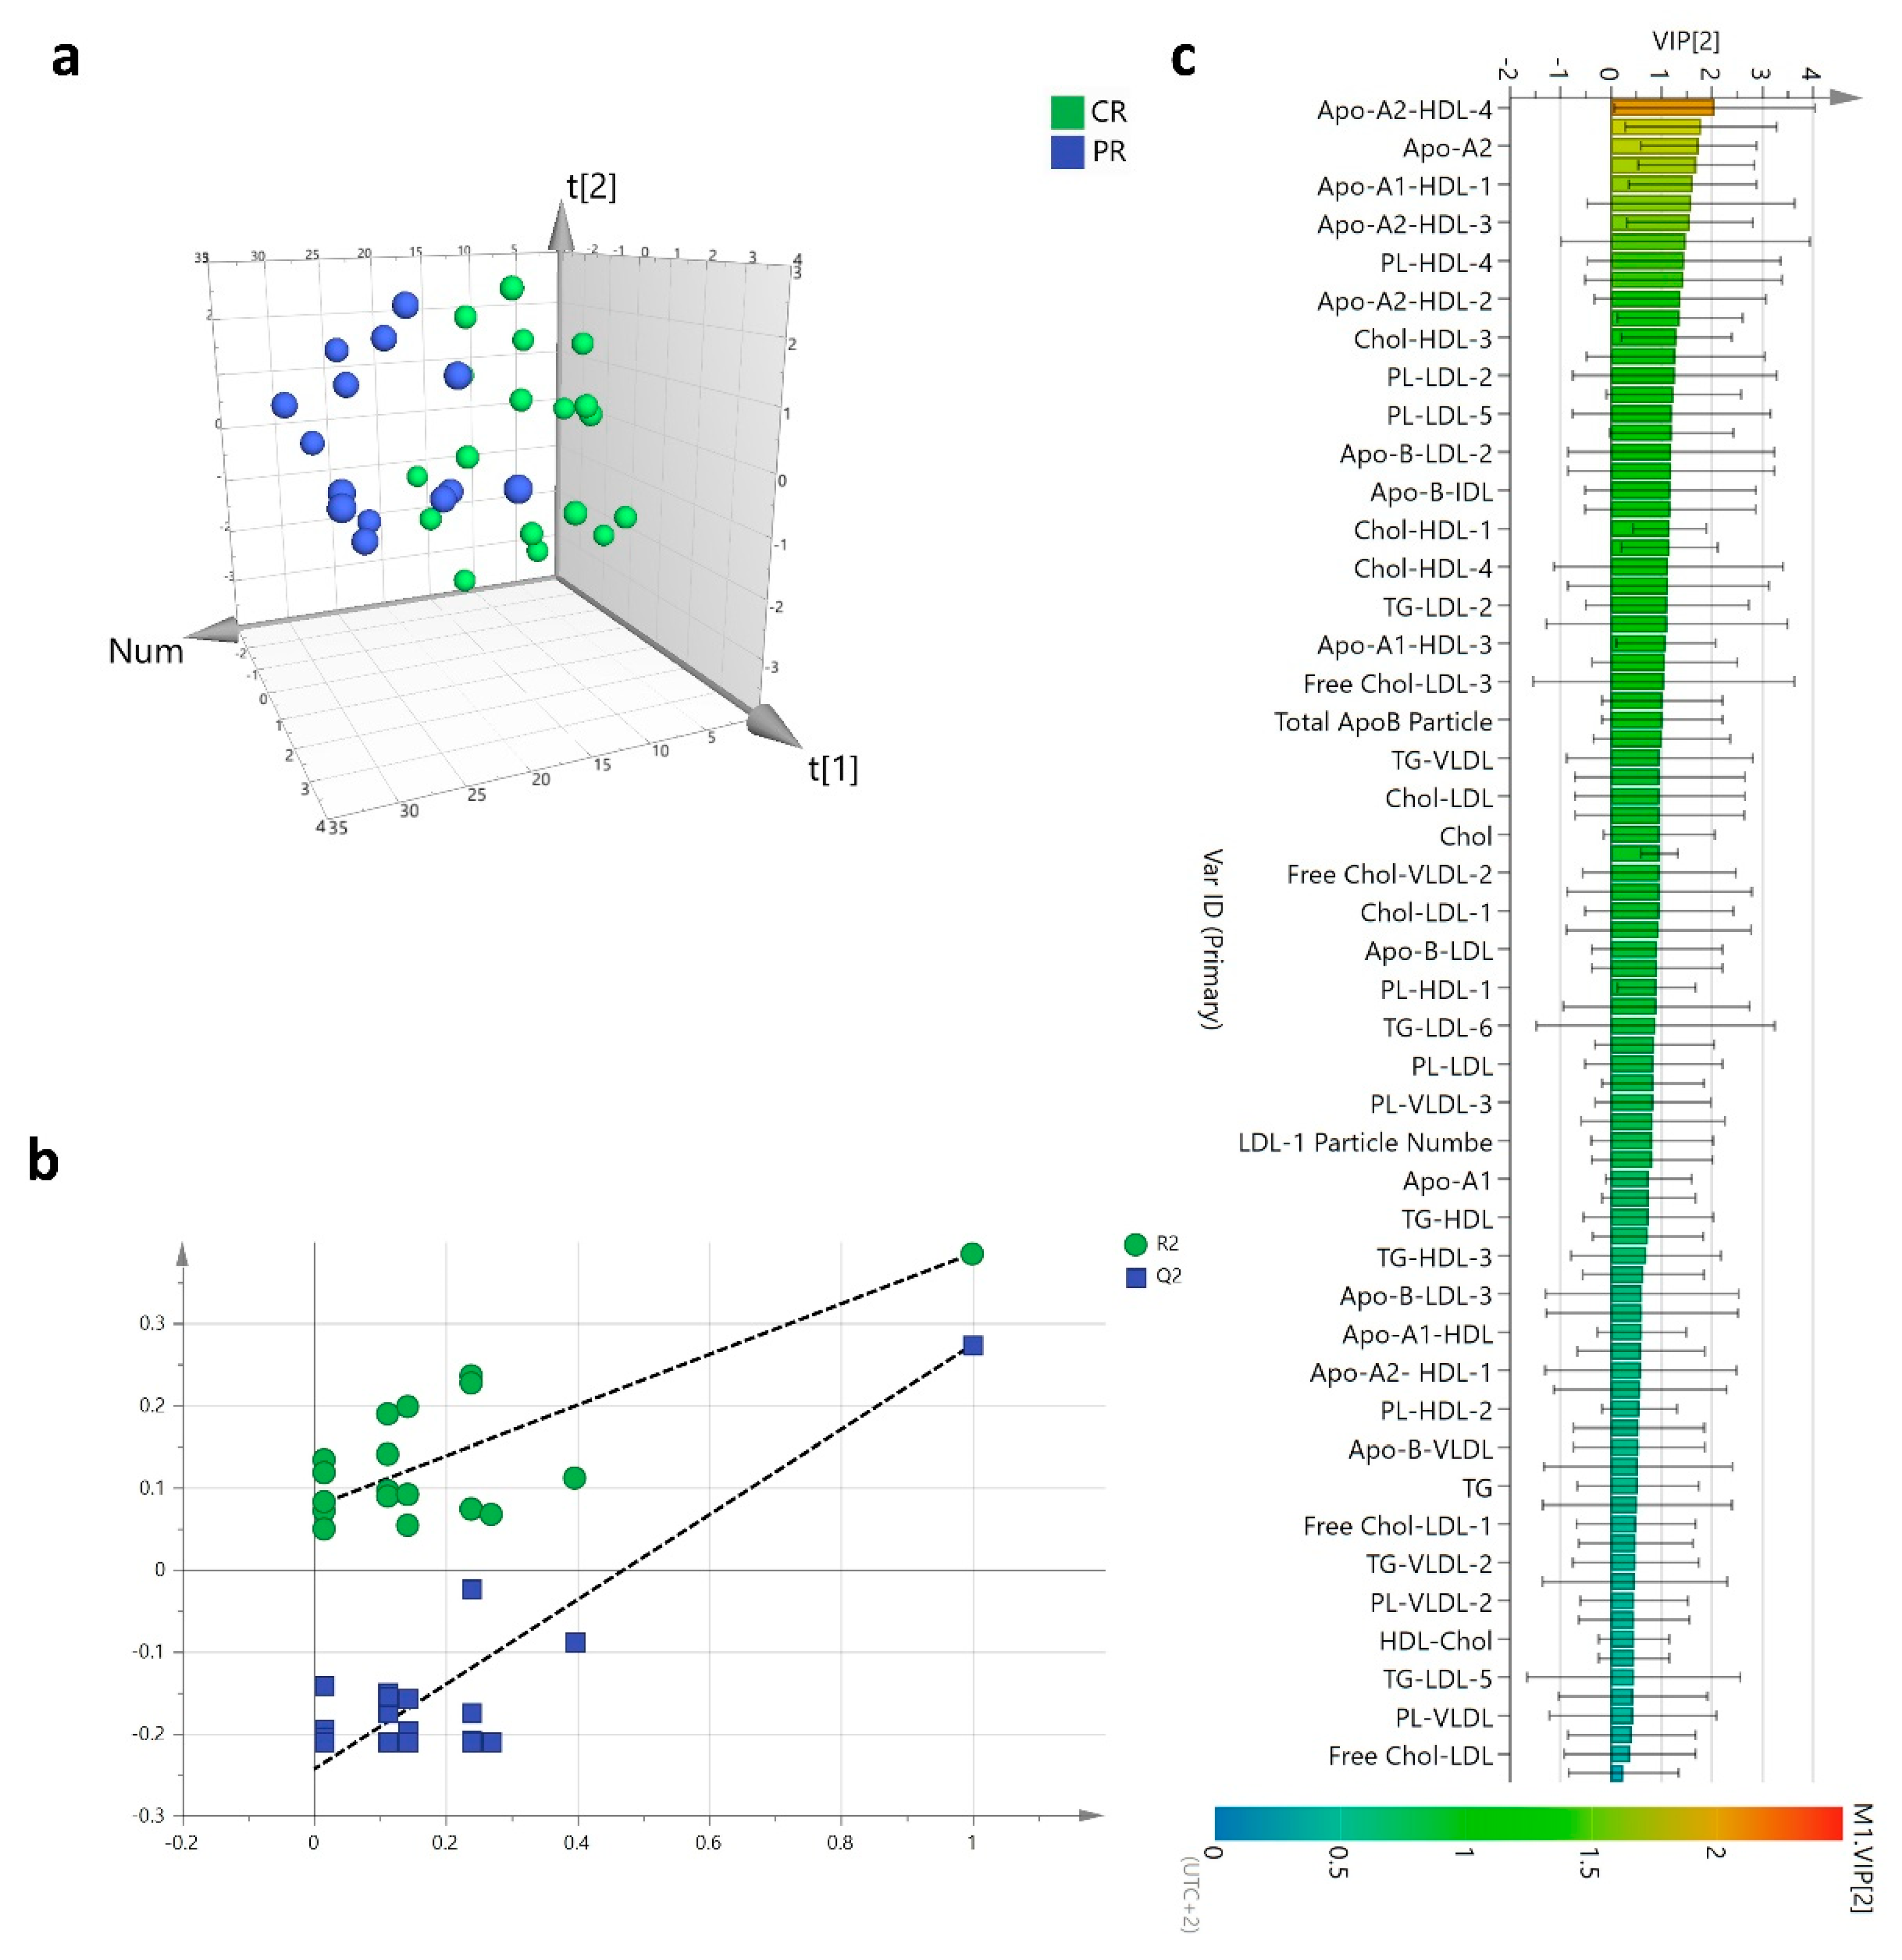
3.6. Plasma Lipoproteins Trajectories and Recurrence

In over 10 years of clinical follow-ups, disease recurrence was reported in 9 (28%) patients. All the events occurred after the two years of the study’s timeframe. Among the relapsed patients, eight had an ER-positive BC subtype, thus, to avoid any potential confounding effect due to ER status, only ER-positive patients were considered in the analysis. The plasma lipid trajectories of relapsed patients (n = 8)—evaluated by PCA from T4 to T7 timeframe—were characterized by an opposite direction to those of disease-free patients (n = 10) (Figure 9).

4. Discussion

In this study, we explored the 1H-NMR potential to characterize the plasma lipoproteins profiles of a population of BC patients homogeneous for HER2-hystotype. The comparison with a CTR group pointed out that the HER2-positive BC patients showed at diagnosis significant higher plasma concentrations of specific VLDL subfractions carrying Chol and free-Chol (Figure 3). Previous epidemiological studies have shown a relationship between BC and lipid disorders that included elevated Chol-VLDL [29,43] and Chol-LDL [29,44,45,46] as well as total Chol [44,47,48], often associated with decreased Chol-HDL [44,47,48,49] all characteristics of obesity. In the present investigation, no specific physical and clinical data were available to precisely estimate the individual visceral adiposity or the presence of metabolic syndromes. However, BMI values of all patients were in the normal range, suggesting that the increase of their circulatory VLDL levels might be likely associated with the tumour lipid reprogramming metabolism. This hypothesis finds support from previous studies where blood Chol level was reported to increase in BC patients irrespective of their BMI or metabolic syndrome [50,51]. On this basis, BC per se may cause the blood Chol rise, although other studies reported opposed evidence [22,52]. These inconsistent results could be due to the lack of knowledge about the Chol distribution among the different lipoproteins subfractions that limit the conclusive interpretation. In the present investigation, the deep and straightforward lipid analysis allowed by the 1H-NMR platform has revealed that HER2-positive BC may induce lipid alterations of specific Chol-VLDL subfractions such as the low size VLDL-1,2,3 which are commonly disregarded by routine clinical lipid tests. The increased Chol mobilization through the specific VLDL-1,2,3 subfractions may represent a distinctive feature of HER2-positive BC underlining the potential key role played by circulation lipoproteins in the disease development. Interestingly, the best diagnostic ROC model was based only on such specific VLDL subfractions excluding the conventional total Chol, Chol-VLDL, Chol-LDL, and Chol-HDL incorporated in clinical practice, further supporting the potentiality of specific lipoproteins subfractions for diagnostic purposes.
The HER2-positive BC group accounts for approximately 15–25% of all BCs, and it is characterized by high tumour growth rates and aggressive clinical behaviour [53] linked also to cellular lipids deregulation [44,54,55]. The HER2 expression-mediated signalling enhances the activation of specific metabolic networks such as the PI3K/AKT/mTOR pathway hyperactivation, which leads to the up-regulation of both glycolysis and FA synthase enzymes [6,54,55,56,57,58]. Besides this lipogenesis phenotype, HER2-tumour cells are also characterized by an increased exogenous FA uptake from the surrounding microenvironment by lipoprotein lipase activity and by the membrane expression of CD36 and LDL receptors (LDLR) [10,59,60,61]. LDLR hyperexpression in HER2-positive tumour cells and triple-negative BC phenotypes were found associated with increased invasion [62,63], while the LDLR downregulation in BC cells was reported to enhance cancer cell death and reduce the tumour growth in the BC hyperlipidaemia model [64,65].
The VLDL subfractions are mainly involved in the lipid delivery to peripheral tissues and their high availability in the plasma of HER2-positive BC patients may represent a specific high-risk phenotype independently of the menopausal status. This hypothesis is in agreement with the findings of some previous investigations which reported serum TGs and Chol-VLDL significantly increased in advanced HER2-positive and triple-negative BC [21,22,29,55]. Conversely, a recent study reported an inverse association between some VLDL subfractions and the BC developing risk suggesting a potential protective effect of such lipoproteins class especially in pre-menopausal BC patients [66]. However, it is worth noting that this finding arises from a study involving heterogeneous BC subtypes thus not excluding that VLDLs, in HER2-positive BC, may play a different role.
The VLDL subfraction rise in HER2-positive BC could be related to the tumour effect on the host lipid metabolism. An elegant research study in animal models demonstrated that cancer itself is effectively able to induce hyperlipidaemia by enhancing VLDL production and impairing VLDL/LDL turnover [67]. Thus, the observed high systemic level of almost all VLDL subfractions in the HER2-positive BC patients may be the result of a liver biosynthetic rebound induced by tumour lipid shortage shifting circulating lipoproteins homeostasis. Beyond VLDLs, also the total TGs and some TGs enriched lipoproteins subfractions were significantly higher in HER2-positive BC patients in agreement with a recent investigation where elevated blood TGs concentrations were linked to an inflammatory status and a greater BC risk [68]. All these results taken together, appear to sustain the hypothesis that a greater host lipid mobilization may have a noteworthy effect on tumour proliferation. Deviations from plasma lipoproteins homeostasis were also observed along the therapeutic interventions consisting of the NACT followed by the surgical removal of the residual tumour. After three months from treatment, the HDL lipoproteins, in particular, subfractions Apo-A1 and Apo-A2, PLs, Chol, and free-Chol underwent a significant plasma drop (Figure 5). Such specific ApoA-HDL shortage induced by NACT was also reported in other investigations during both neoadjuvant and adjuvant BC treatments that incorporated cytotoxic drugs such as anthracycline and paclitaxel [45,69,70,71]. The HDL subfractions decrease seems to be linked to the drug’s insult at the liver site where HDL biosynthesis occurs. This hypothesis is supported by in vitro studies that report chemotherapy agents able to down-regulate the cellular liver expression of the peroxisomal proliferator-activated receptor γ (PPARγ), liver X receptor α (LXRα), and the ATP binding cassette transporter A1 (ABCA1) [70,72], all involved in lipoproteins metabolism. The chemotherapy effect on HDL Apo-A1, Apo-A2, and lipid subfractions was transient since their levels were almost restored after the chemotherapy cycles. However, the extent variation of HDL-3 and HDL-4 subfractions at three months resulted interestingly associated with a poor pharmacological outcome (Figure 8). The HDL-3 subfraction, besides its common function as reverse cholesterol transporter mediated by ABCA1 carrier [73], was found to prevent lipid oxidation by the redox activity of Apo-A and other enzymes [74,75] present in small dense HDL-3 and HDL-4 subfractions [76,77,78]. Such antioxidant properties could be relevant to protect against the chemotherapy-associated oxidative stress since the patients that experienced wide HDL-3 subfractions loss, may have a minor ability to contrast the drug’s side effects, compromising optimal response to NACT. Moreover, specific HDL-Apos are involved in the innate and adaptive immune responses primarily through the modulation of lipid raft components in monocytes/macrophages, dendritic cells, and T and B lymphocytes [79,80,81]. Such function is important in determining the antibody-dependent cellular cytotoxicity triggered by the binding of trastuzumab to HER2-Receptor [82] and in this context, the low plasma HDL-3 and HDL-4 levels could reflect a compromised immunophenotype unable to respond to the immune stimulation of the treatment.
After two months from surgery and ACT with paclitaxel-trastuzumab, the plasma concentrations of almost all lipoproteins’ subfractions did not significantly differ from those measured at the end of NACT. The lack of the HDLs drop along the ACT can be likely ascribed to the maintenance of the homeostasis biochemical mechanisms altered by the previous NACT treatment. Thus, from T2, after surgery and adjuvant treatments, an overall slight increase trend for HDL was observed up to the two years follow-up similar to that reported in other studies [83,84]. Interestingly, conversely to HDLs, at the end of the two-year follow-up, the VLDLs (Figure 6) were found all almost reduced as compared with the baseline levels suggesting that the therapeutic intervention could partially reset the high cancer VLDL phenotype observed at diagnosis. However, the VLDL reduction resulted only partially, not reaching the level observed in the CTR indicating that the abnormal lipids mobilization induced by the HER2-positive BC may require much more time for its normalization, thus, indicating that cancer may strongly modify the host metabolism far away from its homeostasis status.
During 10 years of follow-ups, eight ER-positive BC patients relapsed. These patients, representing about 89% of disease recurrences, showed different and divergent lipoprotein subfractions profile trajectories compared with disease-free patients (Figure 9). The divergent lipid trajectories observed in this study may be suggestive of a distinctive dynamic lipid pattern for the relapsed patients. This hypothesis was similarly reported by Shah et al. [54] where different trends for total Chol, Chol-LDL, TG, and Chol-VLDL were observed in relapsed/metastatic patients and in disease-free patients.
To our knowledge, the present study represents the first investigation attempted to examine the role of circulating lipoprotein profile in a uniform BC population of HER2-positive patients and all undergoing the same NACT treatment.
Despite this strong point, the study still presents the limitation of the low sample size due to the rarity of the HER2-positive BC histotype. Such low numerosity along with the lack of information about patients’ lifestyle and comorbidities, limits to drawing definitive conclusions about the role of VLDL subfractions in combination with other cancer risk factors and impose further clinical validation of the results in an independent and larger population of patients.

5. Conclusions

The results of this explorative study sustain the presence of lipids dysregulation trait in HER2-positive BC. The level of knowledge on circulatory lipoproteins subfractions offered by 1H-NMR allowed for pointing out specific high levels of VLDL subfractions in HER2-positive BC patients. This specific VLDL signature may be relevant to shed new light on the reprogramming process of the host lipid metabolism induced by HER2-positive BC development and it can be useful to enhance the early detection of this disease. The longitudinal monitoring of plasma lipoproteins profile can be useful to predict the outcome of the therapeutic interventions supporting the application of 1H-NMR lipoproteins analysis to better identify specific lipid trajectories of released patients in large longitudinal clinical investigations.

Supplementary Materials

The following are available online at https://0-www-mdpi-com.brum.beds.ac.uk/article/10.3390/cancers13225845/s1, Table S1: List of lipoproteins measured by 1H NRM, Table S2: Lipoproteins significantly altered in BC patients and in the CTR group baseline plasma, Table S3: Significant time-related changes of lipoproteins by ANOVA, Figure S1: Plasma lipoproteins profiles PLS-DA score plot of HER2-positive BC patients in pre-menopause and post-menopause, Figure S2: PLS-DA of the plasma baseline lipoproteins’ profile for BC patients stratified according to the ER status.

Author Contributions

Conceptualization, G.C.; methodology, G.C., E.D.G. and E.M.; formal analysis, A.V., E.D.G. and G.C.; investigation, G.C., E.D.G., G.M., E.M. and A.V.; resources, G.M. and E.M.; data curation, E.D.G., G.C. and G.M.; writing—original draft preparation, G.C., E.D.G. and G.M.; writing—review and editing, G.C., E.D.G., G.M., E.M., A.V. and A.S.; supervision, G.C.; project administration, G.C.; funding acquisition, G.C. and A.S. All authors have read and agreed to the published version of the manuscript.

Funding

This work was supported by the Italian Ministry of Health (Ricerca Corrente).

Institutional Review Board Statement

The study was conducted according to the guidelines of the Declaration of Helsinki, and approved by the Ethics Committee of Centro di Riferimento Oncologico di Aviano (CRO 18-2006, 26 May 2006).

Informed Consent Statement

Informed consent was obtained from all subjects involved in the study.

Data Availability Statement

The data presented in this study are available on request from the corresponding author. The data are not publicly available due to privacy.

Acknowledgments

The authors thank Pietro Bulian for the insightful comments and suggestions.

Conflicts of Interest

The authors declare no conflict of interest.

References

  1. Cheng, C.; Geng, F.; Cheng, X.; Guo, D. Lipid metabolism reprogramming and its potential targets in cancer. Cancer Commun. 2018, 38, 27. [Google Scholar] [CrossRef] [PubMed]
  2. Hanahan, D.; Weinberg, R.A. Hallmarks of Cancer: The next Generation. Cell 2011, 144, 646–674. [Google Scholar] [CrossRef] [PubMed] [Green Version]
  3. Koundouros, N.; Poulogiannis, G. Reprogramming of fatty acid metabolism in cancer. Br. J. Cancer 2020, 122, 4–22. [Google Scholar] [CrossRef] [Green Version]
  4. Carbonetti, G.; Wilpshaar, T.; Kroonen, J.; Studholme, K.; Converso, C.; D’Oelsnitz, S.; Kaczocha, M. FABP5 coordinates lipid signaling that promotes prostate cancer metastasis. Sci. Rep. 2019, 9, 18944. [Google Scholar] [CrossRef] [Green Version]
  5. Li, P.; Lu, M.; Shi, J.; Gong, Z.; Hua, L.; Li, Q.; Lim, B.; Zhang, X.H.-F.; Chen, X.; Li, S.; et al. Lung mesenchymal cells elicit lipid storage in neutrophils that fuel breast cancer lung metastasis. Nat. Immunol. 2020, 21, 1444–1455. [Google Scholar] [CrossRef]
  6. Song, L.; Liu, Z.; Hu, H.-H.; Yang, Y.; Li, T.Y.; Lin, Z.-Z.; Ye, J.; Chen, J.; Huang, X.; Liu, D.-T.; et al. Proto-oncogene Src links lipogenesis via lipin-1 to breast cancer malignancy. Nat. Commun. 2020, 11, 5842. [Google Scholar] [CrossRef] [PubMed]
  7. Yoon, S.; Lee, M.-Y.; Park, S.W.; Moon, J.-S.; Koh, Y.-K.; Ahn, Y.H.; Park, B.-W.; Kim, K.-S. Up-regulation of Acetyl-CoA Carboxylase α and Fatty Acid Synthase by Human Epidermal Growth Factor Receptor 2 at the Translational Level in Breast Cancer Cells. J. Biol. Chem. 2007, 282, 26122–26131. [Google Scholar] [CrossRef] [PubMed] [Green Version]
  8. Balaban, S.; Shearer, R.F.; Lee, L.S.; Van Geldermalsen, M.; Schreuder, M.; Shtein, H.C.; Cairns, R.; Thomas, K.C.; Fazakerley, D.; Grewal, T.; et al. Adipocyte lipolysis links obesity to breast cancer growth: Adipocyte-derived fatty acids drive breast cancer cell proliferation and migration. Cancer Metab. 2017, 5, 1–14. [Google Scholar] [CrossRef] [Green Version]
  9. Kuemmerle, N.B.; Rysman, E.; Lombardo, P.S.; Flanagan, A.J.; Lipe, B.C.; Wells, W.A.; Pettus, J.R.; Froehlich, H.M.; Memoli, V.A.; Morganelli, P.M.; et al. Lipoprotein Lipase Links Dietary Fat to Solid Tumor Cell Proliferation. Mol. Cancer Ther. 2011, 10, 427–436. [Google Scholar] [CrossRef] [Green Version]
  10. Lupien, L.; Bloch, K.; Dehairs, J.; Traphagen, N.A.; Feng, W.; Davis, W.L.; Dennis, T.; Swinnen, J.V.; Wells, W.A.; Smits, N.C.; et al. Endocytosis of very low-density lipoproteins: An unexpected mechanism for lipid acquisition by breast cancer cells. J. Lipid Res. 2020, 61, 205–218. [Google Scholar] [CrossRef] [PubMed]
  11. Mahley, R.W.; Innerarity, T.L.; Rall, S.C.; Weisgraber, K.H. Plasma lipoproteins: Apolipoprotein structure and function. J. Lipid Res. 1984, 25, 1277–1294. [Google Scholar] [CrossRef]
  12. Ramasamy, I. Recent advances in physiological lipoprotein metabolism. Clin. Chem. Lab. Med. 2014, 52, 1695–1727. [Google Scholar] [CrossRef]
  13. Anastasius, M.; Luquain-Costaz, C.; Kockx, M.; Jessup, W.; Kritharides, L. A critical appraisal of the measurement of serum ‘cholesterol efflux capacity’ and its use as surrogate marker of risk of cardiovascular disease. Biochim. Biophys. Acta (BBA) Mol. Cell Biol. Lipids 2018, 1863, 1257–1273. [Google Scholar] [CrossRef] [PubMed]
  14. Barter, P.J.; Nicholls, S.; Rye, K.-A.; Anantharamaiah, G.M.; Navab, M.; Fogelman, A.M. Antiinflammatory Properties of HDL. Circ. Res. 2004, 95, 764–772. [Google Scholar] [CrossRef] [PubMed]
  15. Hunjadi, M.; Lamina, C.; Kahler, P.; Bernscherer, T.; Viikari, J.; Lehtimäki, T.; Kähönen, M.; Hurme, M.; Juonala, M.; Taittonen, L.; et al. HDL cholesterol efflux capacity is inversely associated with subclinical cardiovascular risk markers in young adults: The cardiovascular risk in Young Finns study. Sci. Rep. 2020, 10, 1–12. [Google Scholar] [CrossRef]
  16. Kontush, A. HDL particle number and size as predictors of cardiovascular disease. Front. Pharmacol. 2015, 6, 218. [Google Scholar] [CrossRef] [Green Version]
  17. Kontush, A.; Chapman, M.J. Antiatherogenic function of HDL particle subpopulations: Focus on antioxidative activities. Curr. Opin. Lipidol. 2010, 21, 312–318. [Google Scholar] [CrossRef]
  18. Parthasarathy, S.; Barnett, J.; Fong, L.G. High-density lipoprotein inhibits the oxidative modification of low-density lipoprotein. Biochim. Biophys. Acta (BBA) Lipids Lipid Metab. 1990, 1044, 275–283. [Google Scholar] [CrossRef]
  19. Bruno, D.S.; White, P.S.; Thompson, C.L.; Adebisi, M.; Berger, N.A. Lipid profile and breast cancer characteristics: A retrospective correlational study. J. Clin. Oncol. 2015, 33, e12659. [Google Scholar] [CrossRef]
  20. Carr, B.I.; Giannelli, G.; Guerra, V.; Giannini, E.G.; Farinati, F.; Rapaccini, G.L.; Di Marco, M.; Zoli, M.; Caturelli, E.; Masotto, A.; et al. Plasma cholesterol and lipoprotein levels in relation to tumor aggressiveness and survival in HCC patients. Int. J. Biol. Markers 2018, 33, 423–431. [Google Scholar] [CrossRef] [Green Version]
  21. Flote, V.G.; Vettukattil, R.; Bathen, T.F.; Egeland, T.; McTiernan, A.; Frydenberg, H.; Husøy, A.; Finstad, S.E.; Lømo, J.; Garred, Ø.; et al. Lipoprotein subfractions by nuclear magnetic resonance are associated with tumor characteristics in breast cancer. Lipids Health Dis. 2016, 15, 1–12. [Google Scholar] [CrossRef] [Green Version]
  22. Jung, S.M.; Kang, D.; Guallar, E.; Yu, J.; Lee, J.E.; Kim, S.W.; Nam, S.J.; Cho, J.; Lee, S.K. Impact of Serum Lipid on Breast Cancer Recurrence. J. Clin. Med. 2020, 9, 2846. [Google Scholar] [CrossRef]
  23. Yang, H.-H.; Chen, X.-F.; Hu, W.; Lv, D.-Q.; Ding, W.-J.; Tang, L.-J.; Jiang, J.-J.; Ye, M.-H. Lipoprotein(a) level and its association with tumor stage in male patients with primary lung cancer. Clin. Chem. Lab. Med. 2009, 47, 452–457. [Google Scholar] [CrossRef]
  24. Ghahremanfard, F.; Mirmohammadkhani, M.; Shahnazari, B.; Gholami, G.; Mehdizadeh, J. The Valuable Role of Measuring Serum Lipid Profile in Cancer Progression. Oman Med. J. 2015, 30, 353–357. [Google Scholar] [CrossRef]
  25. Kumie, G.; Melak, T.; Baynes, H.W. The Association of Serum Lipid Levels with Breast Cancer Risks Among Women with Breast Cancer at Felege Hiwot Comprehensive Specialized Hospital, Northwest Ethiopia. Breast Cancer Targets Ther. 2020, 12, 279–287. [Google Scholar] [CrossRef]
  26. Probert, F.; Ruiz-Rodado, V.; Vruchte, D.T.; Nicoli, E.-R.; Claridge, T.D.W.; Wassif, C.A.; Farhat, N.; Porter, F.D.; Platt, F.; Grootveld, M. NMR analysis reveals significant differences in the plasma metabolic profiles of Niemann Pick C1 patients, heterozygous carriers, and healthy controls. Sci. Rep. 2017, 7, 6320. [Google Scholar] [CrossRef] [PubMed]
  27. Raittinen, P.; Niemistö, K.; Pennanen, E.; Syvälä, H.; Auriola, S.; Riikonen, J.; Lehtimäki, T.; Ilmonen, P.; Murtola, T. Circulatory and prostatic tissue lipidomic profiles shifts after high-dose atorvastatin use in men with prostate cancer. Sci. Rep. 2020, 10, 12016. [Google Scholar] [CrossRef] [PubMed]
  28. Guan, X.; Liu, Z.; Zhao, Z.; Zhang, X.; Tao, S.; Yuan, B.; Zhang, J.; Wang, D.; Liu, Q.; Ding, Y. Emerging roles of low-density lipoprotein in the development and treatment of breast cancer. Lipids Health Dis. 2019, 18, 137. [Google Scholar] [CrossRef] [PubMed] [Green Version]
  29. Lu, C.-W.; Lo, Y.-H.; Chen, C.-H.; Lin, C.-Y.; Tsai, C.-H.; Chen, P.-J.; Yang, Y.-F.; Wang, C.-H.; Tan, C.-H.; Hou, M.-F.; et al. VLDL and LDL, but not HDL, promote breast cancer cell proliferation, metastasis and angiogenesis. Cancer Lett. 2017, 388, 130–138. [Google Scholar] [CrossRef] [PubMed]
  30. Michalaki, V.; Koutroulis, G.; Syrigos, K.; Piperi, C.; Kalofoutis, A. Evaluation of serum lipids and high-density lipoprotein subfractions (HDL2, HDL3) in postmenopausal patients with breast cancer. Mol. Cell. Biochem. 2005, 268, 19–24. [Google Scholar] [CrossRef]
  31. Otvos, J.D.; Jeyarajah, E.J.; Cromwell, W. Measurement issues related to lipoprotein heterogeneity. Am. J. Cardiol. 2002, 90, 22–29. [Google Scholar] [CrossRef]
  32. Shiffman, D.; Louie, J.Z.; Caulfield, M.P.; Nilsson, P.M.; Devlin, J.J.; Melander, O. LDL subfractions are associated with incident cardiovascular disease in the Malmö Prevention Project Study. Atherosclerosis 2017, 263, 287–292. [Google Scholar] [CrossRef] [Green Version]
  33. Soedamah-Muthu, S.S.; Chang, Y.-F.; Otvos, J.; Evans, R.W.; Orchard, T. Lipoprotein subclass measurements by nuclear magnetic resonance spectroscopy improve the prediction of coronary artery disease in Type 1 Diabetes. A prospective report from the Pittsburgh Epidemiology of Diabetes Complications Study. Diabetology 2003, 46, 674–682. [Google Scholar] [CrossRef] [PubMed] [Green Version]
  34. Chapman, M.J.; Goldstein, S.; Lagrange, D.; Laplaud, P.M. A density gradient ultracentrifugal procedure for the isolation of the major lipoprotein classes from human serum. J. Lipid Res. 1981, 22, 339–358. [Google Scholar] [CrossRef]
  35. Potts, J.; Fisher, R.; Humphreys, S.; Gibbons, G.; Frayn, K. Separation of lipoprotein fractions by ultracentrifugation: Investigation of analytical recovery with sequential flotation and density gradient procedures. Clin. Chim. Acta 1994, 230, 215–220. [Google Scholar] [CrossRef]
  36. Redgrave, T.; Roberts, D.; West, C. Separation of plasma lipoproteins by density-gradient ultracentrifugation. Anal. Biochem. 1975, 65, 42–49. [Google Scholar] [CrossRef]
  37. Aru, V.; Lam, C.; Khakimov, B.; Hoefsloot, H.C.; Zwanenburg, G.; Lind, M.V.; Schäfer, H.; van Duynhoven, J.; Jacobs, D.M.; Smilde, A.K.; et al. Quantification of lipoprotein profiles by nuclear magnetic resonance spectroscopy and multivariate data analysis. TrAC Trends Anal. Chem. 2017, 94, 210–219. [Google Scholar] [CrossRef]
  38. Balder, Y.; Vignoli, A.; Tenori, L.; Luchinat, C.; Saccenti, E. Exploration of Blood Lipoprotein and Lipid Fraction Profiles in Healthy Subjects through Integrated Univariate, Multivariate, and Network Analysis Reveals Association of Lipase Activity and Cholesterol Esterification with Sex and Age. Metabolites 2021, 11, 326. [Google Scholar] [CrossRef]
  39. Jiménez, B.; Holmes, E.; Heude, C.; Tolson, R.F.; Harvey, N.; Lodge, S.L.; Chetwynd, A.J.; Cannet, C.; Fang, F.; Pearce, J.T.M.; et al. Quantitative Lipoprotein Subclass and Low Molecular Weight Metabolite Analysis in Human Serum and Plasma by 1H NMR Spectroscopy in a Multilaboratory Trial. Anal. Chem. 2018, 90, 11962–11971. [Google Scholar] [CrossRef]
  40. Monsonis Centelles, S.; Hoefsloot, H.C.J.; Khakimov, B.; Ebrahimi, P.; Lind, M.V.; Kristensen, M.; de Roo, N.; Jacobs, D.M.; van Duynhoven, J.; Cannet, C.; et al. Toward Reliable Lipoprotein Particle Predictions from NMR Spectra of Human Blood: An Interlaboratory Ring Test. Anal. Chem. 2017, 89, 8004–8012. [Google Scholar] [CrossRef] [PubMed] [Green Version]
  41. Dai, D.; Gao, Y.; Chen, J.; Huang, Y.; Zhang, Z.; Xu, F. Time-resolved metabolomics analysis of individual differences during the early stage of lipopolysaccharide-treated rats. Sci. Rep. 2016, 6, 34136. [Google Scholar] [CrossRef] [PubMed] [Green Version]
  42. Chong, J.; Wishart, D.S.; Xia, J. Using MetaboAnalyst 4.0 for Comprehensive and Integrative Metabolomics Data Analysis. Curr. Protoc. Bioinform. 2019, 68, e86. [Google Scholar] [CrossRef] [PubMed]
  43. Chang, S.-J.; Hou, M.-F.; Tsai, S.-M.; Wu, S.-H.; Hou, L.; Ma, H.; Shann, T.-Y.; Tsai, L.-Y. The association between lipid profiles and breast cancer among Taiwanese women. Clin. Chem. Lab. Med. 2007, 45, 1219–1223. [Google Scholar] [CrossRef] [PubMed]
  44. Chowdhury, F.A.; Islam, F.; Prova, M.T.; Khatun, M.; Sharmin, I.; Islam, K.M.; Hassan, K.; Khan, A.S.; Rahman, M.M. Association of hyperlipidemia with breast cancer in Bangladeshi women. Lipids Health Dis. 2021, 20, 52. [Google Scholar] [CrossRef] [PubMed]
  45. Li, X.; Liu, Z.-L.; Wu, Y.-T.; Wu, H.; Dai, W.; Arshad, B.; Xu, Z.; Li, H.; Wu, K.-N.; Kong, L.-Q. Status of lipid and lipoprotein in female breast cancer patients at initial diagnosis and during chemotherapy. Lipids Health Dis. 2018, 17, 91. [Google Scholar] [CrossRef] [Green Version]
  46. Nowak, C.; Ärnlöv, J. A Mendelian randomization study of the effects of blood lipids on breast cancer risk. Nat. Commun. 2018, 9, 3957. [Google Scholar] [CrossRef] [PubMed] [Green Version]
  47. Kucharska-Newton, A.M.; Rosamond, W.D.; Mink, P.J.; Alberg, A.J.; Shahar, E.; Folsom, A.R. HDL-Cholesterol and Incidence of Breast Cancer in the ARIC Cohort Study. Ann. Epidemiol. 2008, 18, 671–677. [Google Scholar] [CrossRef]
  48. Li, X.; Tang, H.; Wang, J.; Xie, X.; Liu, P.; Kong, Y.; Ye, F.; Shuang, Z.; Xie, Z.; Xie, X. The effect of preoperative serum triglycerides and high-density lipoprotein-cholesterol levels on the prognosis of breast cancer. Breast 2017, 32, 1–6. [Google Scholar] [CrossRef]
  49. Zhou, P.; Li, B.; Liu, B.; Chen, T.; Xiao, J. Prognostic role of serum total cholesterol and high-density lipoprotein cholesterol in cancer survivors: A systematic review and meta-analysis. Clin. Chim. Acta 2018, 477, 94–104. [Google Scholar] [CrossRef]
  50. Garcia-Estevez, L.; Moreno-Bueno, G. Updating the role of obesity and cholesterol in breast cancer. Breast Cancer Res. 2019, 21, 35. [Google Scholar] [CrossRef] [Green Version]
  51. Kim, Y.; Park, S.K.; Han, W.; Kim, D.-H.; Hong, Y.-C.; Ha, E.H.; Ahn, S.-H.; Noh, D.-Y.; Kang, D.; Yoo, K.-Y. Serum High-Density Lipoprotein Cholesterol and Breast Cancer Risk by Menopausal Status, Body Mass Index, and Hormonal Receptor in Korea. Cancer Epidemiol. Biomark. Prev. 2009, 18, 508–515. [Google Scholar] [CrossRef] [Green Version]
  52. Sharma, V.; Sharma, A. Serum cholesterol levels in carcinoma breast. Indian J. Med. Res. 1991, 94, 193–196. [Google Scholar] [PubMed]
  53. Howlader, N.; Altekruse, S.F.; Li, C.I.; Chen, V.W.; Clarke, C.A.; Ries, L.A.; Cronin, K.A. US Incidence of Breast Cancer Subtypes Defined by Joint Hormone Receptor and HER2 Status. J. Natl. Cancer Inst. 2014, 106, 106. [Google Scholar] [CrossRef] [PubMed] [Green Version]
  54. Miricescu, D.; Totan, A.; Stanescu-Spinu, I.-I.; Badoiu, S.C.; Stefani, C.; Greabu, M. PI3K/AKT/MTOR Signaling Pathway in Breast Cancer: From Molecular Landscape to Clinical Aspects. Int. J. Mol. Sci. 2020, 22, 173. [Google Scholar] [CrossRef] [PubMed]
  55. Paul, M.R.; Pan, T.; Pant, D.K.; Shih, N.N.C.; Chen, Y.; Harvey, K.L.; Solomon, A.; Lieberman, D.; Morrissette, J.J.D.; Soucier-Ernst, D.; et al. Genomic Landscape of Metastatic Breast Cancer Identifies Preferentially Dysregulated Pathways and Targets. J. Clin. Investig. 2020, 130, 4252–4265. [Google Scholar] [CrossRef] [PubMed]
  56. Holloway, R.; Marignani, P. Targeting mTOR and Glycolysis in HER2-Positive Breast Cancer. Cancers 2021, 13, 2922. [Google Scholar] [CrossRef]
  57. Menendez, J.A.; Lupu, R. Fatty Acid Synthase Regulates Estrogen Receptor-α Signaling in Breast Cancer Cells. Oncogenesis 2017, 6, e299. [Google Scholar] [CrossRef]
  58. Zhang, J.; Song, F.; Zhao, X.; Jiang, H.; Wu, X.; Wang, B.; Zhou, M.; Tian, M.; Shi, B.; Wang, H.; et al. EGFR Modulates Monounsaturated Fatty Acid Synthesis through Phosphorylation of SCD1 in Lung Cancer. Mol. Cancer 2017, 16, 127. [Google Scholar] [CrossRef] [PubMed] [Green Version]
  59. Feng, W.W.; Wilkins, O.; Bang, S.; Ung, M.; Li, J.; An, J.; del Genio, C.; Canfield, K.; DiRenzo, J.; Wells, W.; et al. CD36-Mediated Metabolic Rewiring of Breast Cancer Cells Promotes Resistance to HER2-Targeted Therapies. Cell Rep. 2019, 29, 3405–3420.e5. [Google Scholar] [CrossRef] [Green Version]
  60. Gallagher, E.J.; Zelenko, Z.; Neel, B.A.; Antoniou, I.M.; Rajan, L.; Kase, N.; LeRoith, D. Elevated Tumor LDLR Expression Accelerates LDL Cholesterol-Mediated Breast Cancer Growth in Mouse Models of Hyperlipidemia. Oncogene 2017, 36, 6462–6471. [Google Scholar] [CrossRef] [Green Version]
  61. Zaoui, M.; Morel, M.; Ferrand, N.; Fellahi, S.; Bastard, J.-P.; Lamazière, A.; Larsen, A.K.; Béréziat, V.; Atlan, M.; Sabbah, M. Breast-Associated Adipocytes Secretome Induce Fatty Acid Uptake and Invasiveness in Breast Cancer Cells via CD36 Independently of Body Mass Index, Menopausal Status and Mammary Density. Cancers 2019, 11, 2012. [Google Scholar] [CrossRef] [Green Version]
  62. Catasus, L.; Gallardo, A.; Llorente-Cortes, V.; Escuin, D.; Muñoz, J.; Tibau, A.; Peiro, G.; Barnadas, A.; Lerma, E. Low-Density Lipoprotein Receptor-Related Protein 1 Is Associated with Proliferation and Invasiveness in Her-2/Neu and Triple-Negative Breast Carcinomas. Hum. Pathol. 2011, 42, 1581–1588. [Google Scholar] [CrossRef]
  63. Maubant, S.; Tahtouh, T.; Brisson, A.; Maire, V.; Némati, F.; Tesson, B.; Ye, M.; Rigaill, G.; Noizet, M.; Dumont, A.; et al. LRP5 Regulates the Expression of STK40, a New Potential Target in Triple-Negative Breast Cancers. Oncotarget 2018, 9, 22586–22604. [Google Scholar] [CrossRef] [PubMed] [Green Version]
  64. Lu, W.; Li, Y. Salinomycin Suppresses LRP6 Expression and Inhibits Both Wnt/β-Catenin and MTORC1 Signaling in Breast and Prostate Cancer Cells. J. Cell Biochem. 2014, 115, 1799–1807. [Google Scholar] [CrossRef] [PubMed] [Green Version]
  65. Ren, D.-N.; Chen, J.; Li, Z.; Yan, H.; Yin, Y.; Wo, D.; Zhang, J.; Ao, L.; Chen, B.; Ito, T.K.; et al. LRP5/6 directly bind to Frizzled and prevent Frizzled-regulated tumour metastasis. Nat. Commun. 2015, 6, 6906. [Google Scholar] [CrossRef] [PubMed] [Green Version]
  66. Debik, J.; Schaefer, H.; Andreassen, T.; Wang, F.; Fang, F.; Cannet, C.; Spraul, M.; Bathen, T.F.; Giskeødegård, G.F. Lipoprotein and Metabolite Associations to Breast Cancer Risk in the HUNT2 Study. medRxiv 2021. [Google Scholar] [CrossRef]
  67. Huang, J.; Li, L.; Lian, J.; Schauer, S.; Vesely, P.W.; Kratky, D.; Hoefler, G.; Lehner, R. Tumor-Induced Hyperlipidemia Contributes to Tumor Growth. Cell Rep. 2016, 15, 336–348. [Google Scholar] [CrossRef] [Green Version]
  68. Gumà, J.; Adriá-Cebrián, J.; Ruiz-Aguado, B.; Albacar, C.; Girona, J.; Rodríguez-Calvo, R.; Martínez-Micaelo, N.; Lam, E.W.F.; Masana, L.; Guaita-Esteruelas, S. Altered Serum Metabolic Profile Assessed by Advanced 1H-NMR in Breast Cancer Patients. Cancers 2021, 13, 4281. [Google Scholar] [CrossRef] [PubMed]
  69. Alexopoulos, C.G.; Pournaras, S.; Vaslamatzis, M.; Avgerinos, A.; Raptis, S. Changes in Serum Lipids and Lipoproteins in Cancer Patients during Chemotherapy. Cancer Chemother. Pharmacol. 1992, 30, 412–416. [Google Scholar] [CrossRef]
  70. Sharma, M.; Tuaine, J.; McLaren, B.; Waters, D.L.; Black, K.; Jones, L.M.; McCormick, S.P.A. Chemotherapy Agents Alter Plasma Lipids in Breast Cancer Patients and Show Differential Effects on Lipid Metabolism Genes in Liver Cells. PLoS ONE 2016, 11, e0148049. [Google Scholar] [CrossRef] [PubMed] [Green Version]
  71. Tian, W.; Yao, Y.; Fan, G.; Zhou, Y.; Wu, M.; Xu, D.; Deng, Y. Changes in Lipid Profiles during and after (Neo)Adjuvant Chemotherapy in Women with Early-Stage Breast Cancer: A Retrospective Study. PLoS ONE 2019, 14, e0221866. [Google Scholar] [CrossRef]
  72. Basso, F.; Freeman, L.; Knapper, C.L.; Remaley, A.; Stonik, J.; Neufeld, E.B.; Tansey, T.; Amar, M.J.A.; Fruchart-Najib, J.; Duverger, N.; et al. Role of the Hepatic ABCA1 Transporter in Modulating Intrahepatic Cholesterol and Plasma HDL Cholesterol Concentrations. J. Lipid Res. 2003, 44, 296–302. [Google Scholar] [CrossRef] [PubMed] [Green Version]
  73. Vaughan, A.M.; Oram, J.F. ABCA1 and ABCG1 or ABCG4 Act Sequentially to Remove Cellular Cholesterol and Generate Cholesterol-Rich HDL. J. Lipid Res. 2006, 47, 2433–2443. [Google Scholar] [CrossRef] [PubMed] [Green Version]
  74. Garner, B.; Waldeck, A.R.; Witting, P.K.; Rye, K.A.; Stocker, R. Oxidation of High Density Lipoproteins. II. Evidence for Direct Reduction of Lipid Hydroperoxides by Methionine Residues of Apolipoproteins AI and AII. J. Biol. Chem. 1998, 273, 6088–6095. [Google Scholar] [CrossRef] [PubMed] [Green Version]
  75. Panzenböck, U.; Stocker, R. Formation of Methionine Sulfoxide-Containing Specific Forms of Oxidized High-Density Lipoproteins. Biochim. Biophys. Acta 2005, 1703, 171–181. [Google Scholar] [CrossRef] [PubMed]
  76. Brites, F.; Martin, M.; Guillas, I.; Kontush, A. Antioxidative activity of high-density lipoprotein (HDL): Mechanistic insights into potential clinical benefit. BBA Clin. 2017, 8, 66–77. [Google Scholar] [CrossRef]
  77. Sakuma, N.; Yoshikawa, M.; Hibino, T.; Ohte, N.; Kamiya, T.; Kunimatsu, M.; Kimura, G.; Inoue, M. HDL3 Exerts a More Powerful Antiperoxidative and Protective Effect against Peroxidative Modification of LDL than HDL2 Does. J. Nutr. Sci. Vitaminol. 2002, 48, 278–282. [Google Scholar] [CrossRef] [Green Version]
  78. Yoshikawa, M.; Sakuma, N.; Hibino, T.; Sato, T.; Fujinami, T. HDL3 exerts more powerful anti-oxidative, protective effects against copper-catalyzed LDL oxidation than HDL2. Clin. Biochem. 1997, 30, 221–225. [Google Scholar] [CrossRef]
  79. Larbi, A.; Fortin, C.; Dupuis, G.; Berrougui, H.; Khalil, A.; Fulop, T. Immunomodulatory Role of High-Density Lipoproteins: Impact on Immunosenescence. AGE 2014, 36, 9712. [Google Scholar] [CrossRef] [Green Version]
  80. Vilahur, G. High-Density Lipoprotein Benefits beyond the Cardiovascular System: A Potential Key Role for Modulating Acquired Immunity through Cholesterol Efflux. Cardiovasc. Res. 2017, 113, e51–e53. [Google Scholar] [CrossRef] [Green Version]
  81. Wang, S.-H.; Yuan, S.-G.; Peng, D.-Q.; Zhao, S.-P. HDL and ApoA-I Inhibit Antigen Presentation-Mediated T Cell Activation by Disrupting Lipid Rafts in Antigen Presenting Cells. Atherosclerosis 2012, 225, 105–114. [Google Scholar] [CrossRef] [PubMed]
  82. Valabrega, G.; Montemurro, F.; Aglietta, M. Trastuzumab: Mechanism of action, resistance and future perspectives in HER2-overexpressing breast cancer. Ann. Oncol. 2007, 18, 977–984. [Google Scholar] [CrossRef] [PubMed]
  83. Ray, A.; Jain, D.; Yadav, R.; Naik, S.L.; Sharma, S.; Bahadur, A.K.; Sharma, B. Effect of cancer treatment modalities on serum lipids and lipoproteins among women with carcinoma of the breast. Indian J. Physiol. Pharmacol. 2001, 45, 337–344. [Google Scholar] [PubMed]
  84. Subramaniam, S.; Marar, T.; Devi, C.S. Studies on the Changes in Plasma Lipids and Lipoproteins in CMF Treated Breast Cancer Patients. Biochem. Int. 1991, 24, 1015–1024. [Google Scholar] [PubMed]
Figure 1. Schematic representation of the study. 1H-NMR lipoproteins analysis was investigated in HER2-positive BC patients (n = 43) at baseline (T1) and compared with those of the CTR group (n = 28). In a subset of patients (n = 32), plasma lipoproteins profiles were monitored during and after therapeutic interventions up to two-year follow-up: at baseline (T1), after three (T2) and six months (T3) from the start of NACT treatment, after two (T4) and six (T5) months from the surgery- ACT and at 1-year (T6) and two-year follow-up (T7).
Cancers 13 05845 g001
Figure 2. Plasma lipoproteins profiles PLS-DA score plot of HER2-positive BC patients (n = 43) and the CTR group (n = 28) (a); Permutation test plot showing R2 (green) and Q2 (blue) values from the permuted models (b); Variable importance plot for the projection (VIP) score of the PLS-DA model ranked by increasing values (c).
Cancers 13 05845 g002
Figure 3. Heat maps of 1H-NRM lipoproteins subfractions significantly differed between HER2-positive BC patients and the CTR group. High values are coloured in red while low values in green with a different brightness according to the magnitude of the difference when compared with the average value (a). Mean fold change in BC referred to CTR of the VLDL (b), LDL (c), HDL (d) main fractions, and subfractions. *** q < 0.001; ** q < 0.01; * q < 0.05.
Cancers 13 05845 g003
Figure 4. Receiver operating characteristic (ROC) curve analysis of the lipoproteins subfractions that best discriminate HER2-positive BC patient from CTR: free-Chol VLDL-2 (a); Chol-VLDL-2 (b); PL LDL-6 (c) single variables and their ROC model combination (d).
Cancers 13 05845 g004
Figure 5. Time-related changes of some representative plasma lipoproteins levels over the treatments and follow-up (n = 32). Boxes are coloured differently accordingly to the time point: the diagnosis (T1, blue), after three (T2, light green) and six months (T3, yellow) from the NACT starting, two months (T4, violet), and six (T5, red) months after the surgery, in the first-year (T6, dark green) and two-year follow-up (T7, orange). Horizontal lines indicated the median values that separated the lower 25th and the upper 75th quartile; vertical lines denote the highest and lowest whiskers; dots are observations outside the quartiles range.
Cancers 13 05845 g005
Figure 6. Changes in plasma lipoproteins concentrations after the two-year follow-up referred to baseline expressed as percentage relative differences. ** p < 0.01; * p < 0.05.
Cancers 13 05845 g006
Figure 7. PLS-DA discriminated plasma lipoproteins profiles of patients achieving a CR (n = 18), green) and a PR (n = 14, blue) (a); Permutation test plot showing R2 (green) and Q2 (blue) values from the permuted models (b); Variables importance for the projection (VIP) score plot of the PLS-DA model (c).
Cancers 13 05845 g007
Figure 8. Radar plot of plasma HDL subfractions’ changes after 3 months (T2) of NACT as compared with baseline (T1) in complete (CR, green) and partial response (PR, red) patients. ** p < 0.01; * p < 0.05.
Cancers 13 05845 g008
Figure 9. Lipoproteins profile trajectories during the two-year follow-up from T4 to T7 of relapsed and disease-free ER-positive patients. Trajectories were evaluated by using the first two components score from PCA analysis performed at each time point and normalized to T4 value. Trajectories of relapsed (n = 8) and disease-free (n = 10) patients are coloured in red and green, respectively.
Cancers 13 05845 g009
Table 1. Demographic and clinical characteristics of the HER2-positive BC patients and the CTR group.
CharacteristicsBC (n = 43)
Age, years (Median, range)49 (23–70)
BMI, kg/m2 (Mean ± SD)25.0 ± 5.3
Pre-menopause (n, %)25 (58.1)
Post-menopause (n, %)18 (41.9)
Stage (n, %)
II33 (76.7)
III10 (23.3)
Ki67 (n, %)
<2020 (46.5)
≥2023 (53.5)
ER status (n, %)
Positive22 (51.2)
Negative21 (48.8)
Pathological Response (n, %) *
Complete18 (56.2)
Partial14 (43.8)
Recurrence (n, %) *
Yes9 (28.1)
No23 (71.9)
* referred to n = 32 subset of patients in the longitudinal study.
Publisher’s Note: MDPI stays neutral with regard to jurisdictional claims in published maps and institutional affiliations.

