
AutoProstate: Towards Automated Reporting of Prostate MRI for Prostate Cancer Assessment Using Deep Learning

 , ,
, ,
Abstract
:Simple Summary
Abstract
1. Introduction
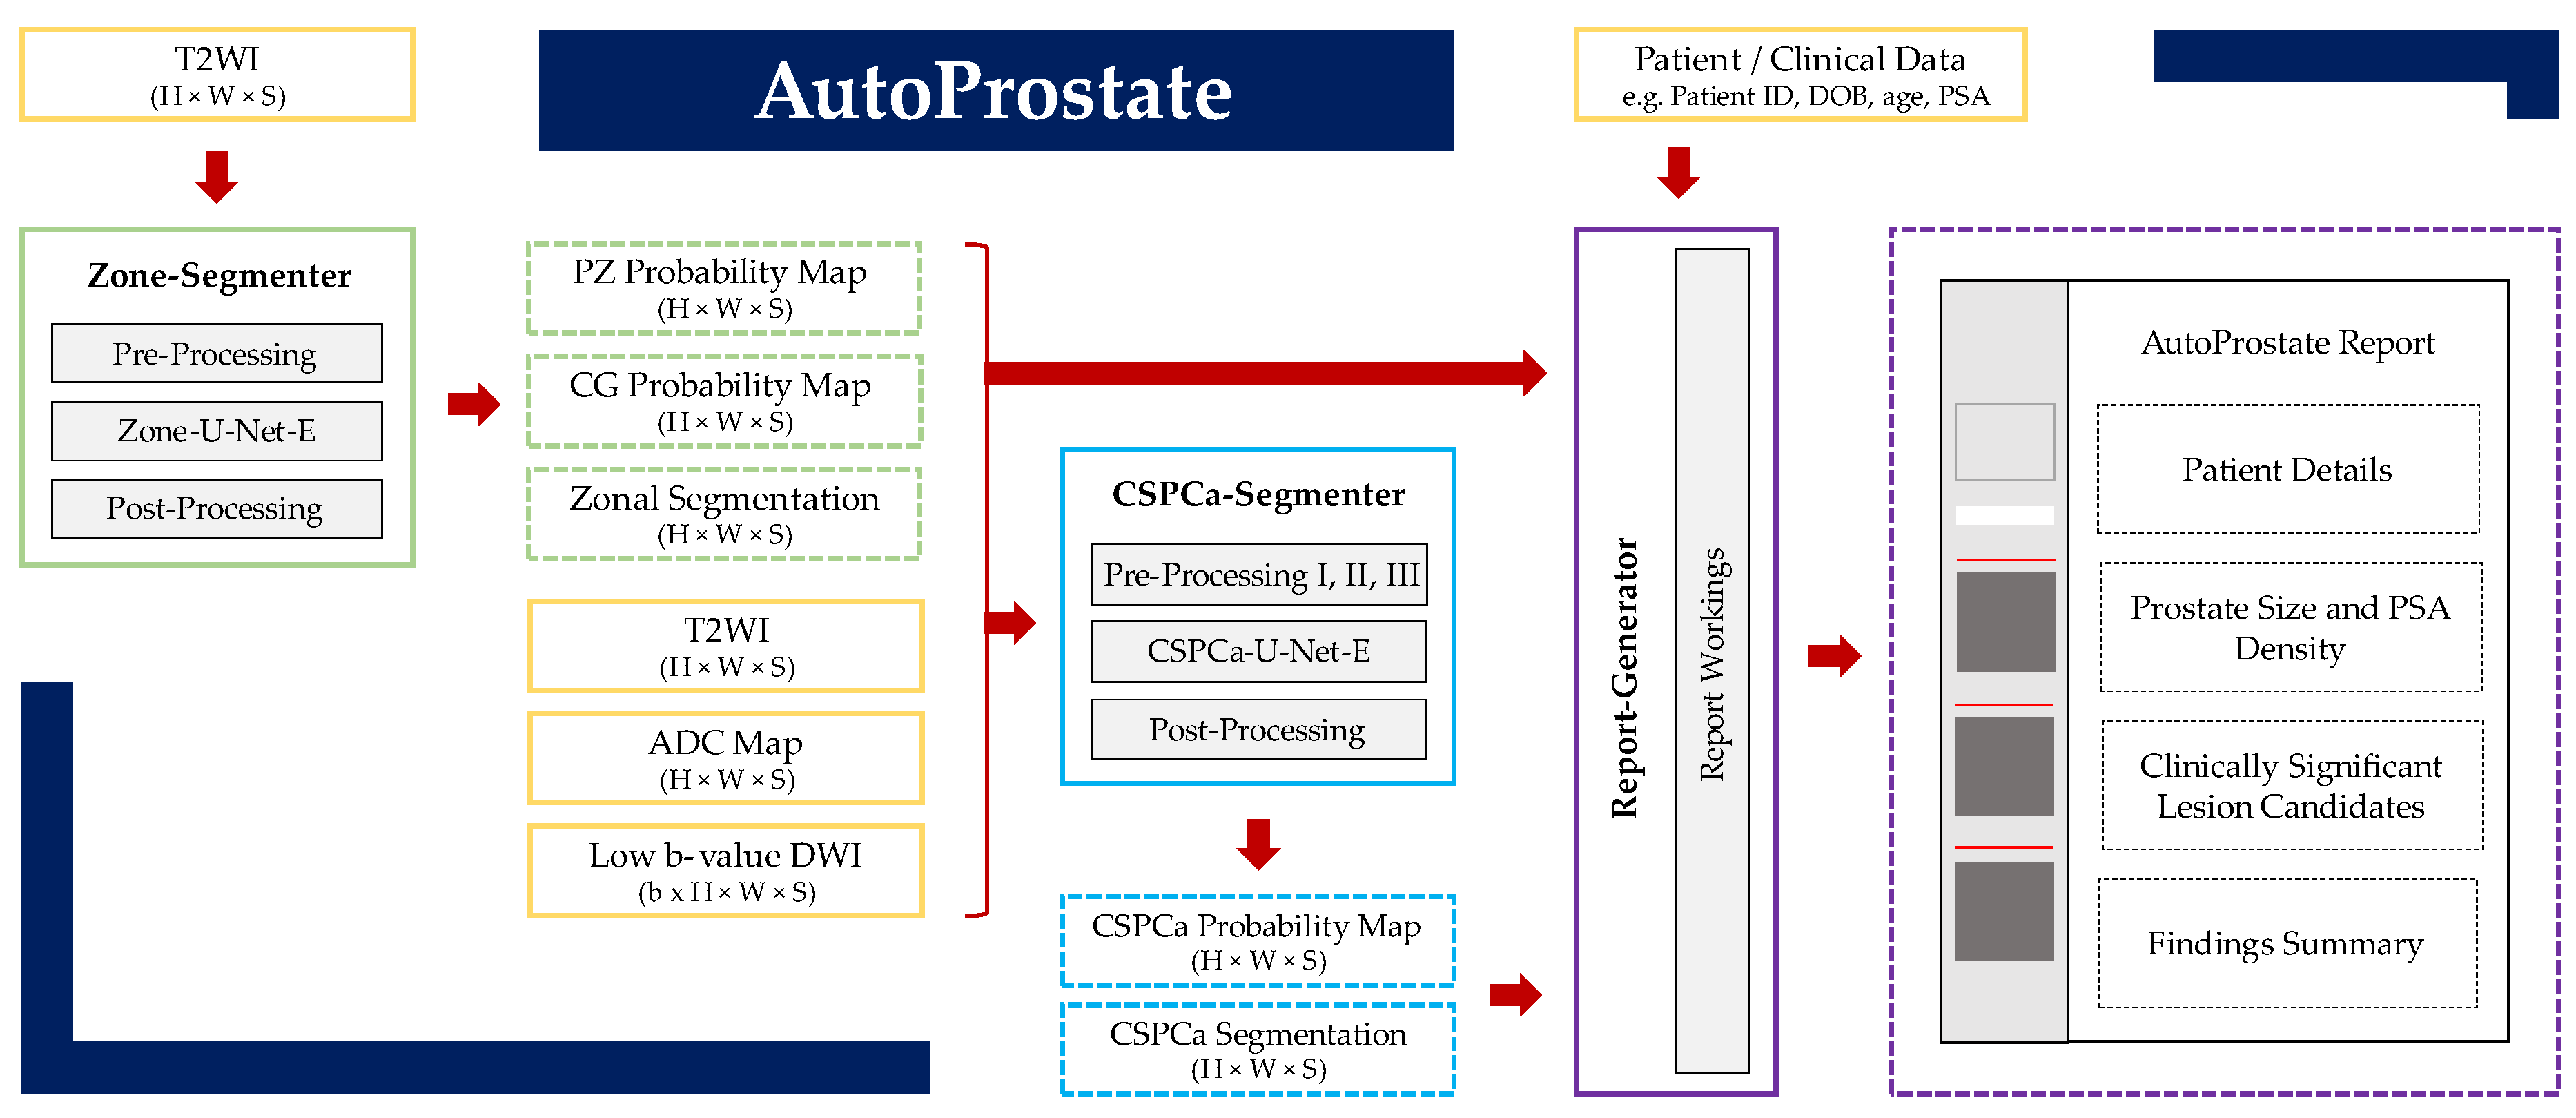
2. Methods
2.1. Zone-Segmenter Module
2.1.1. Pre-Processing
2.1.2. Zone-U-Net-E
2.1.3. Post-Processing
2.2. CSPCa-Segmenter Module
2.2.1. Pre-Processing I: Computed High b-Value DWI
2.2.2. Pre-Processing II: Registration
2.2.3. Pre-Processing III: Resampling, Cropping, and Normalization
2.2.4. CSPCa-U-Net-E
2.2.5. Post-Processing
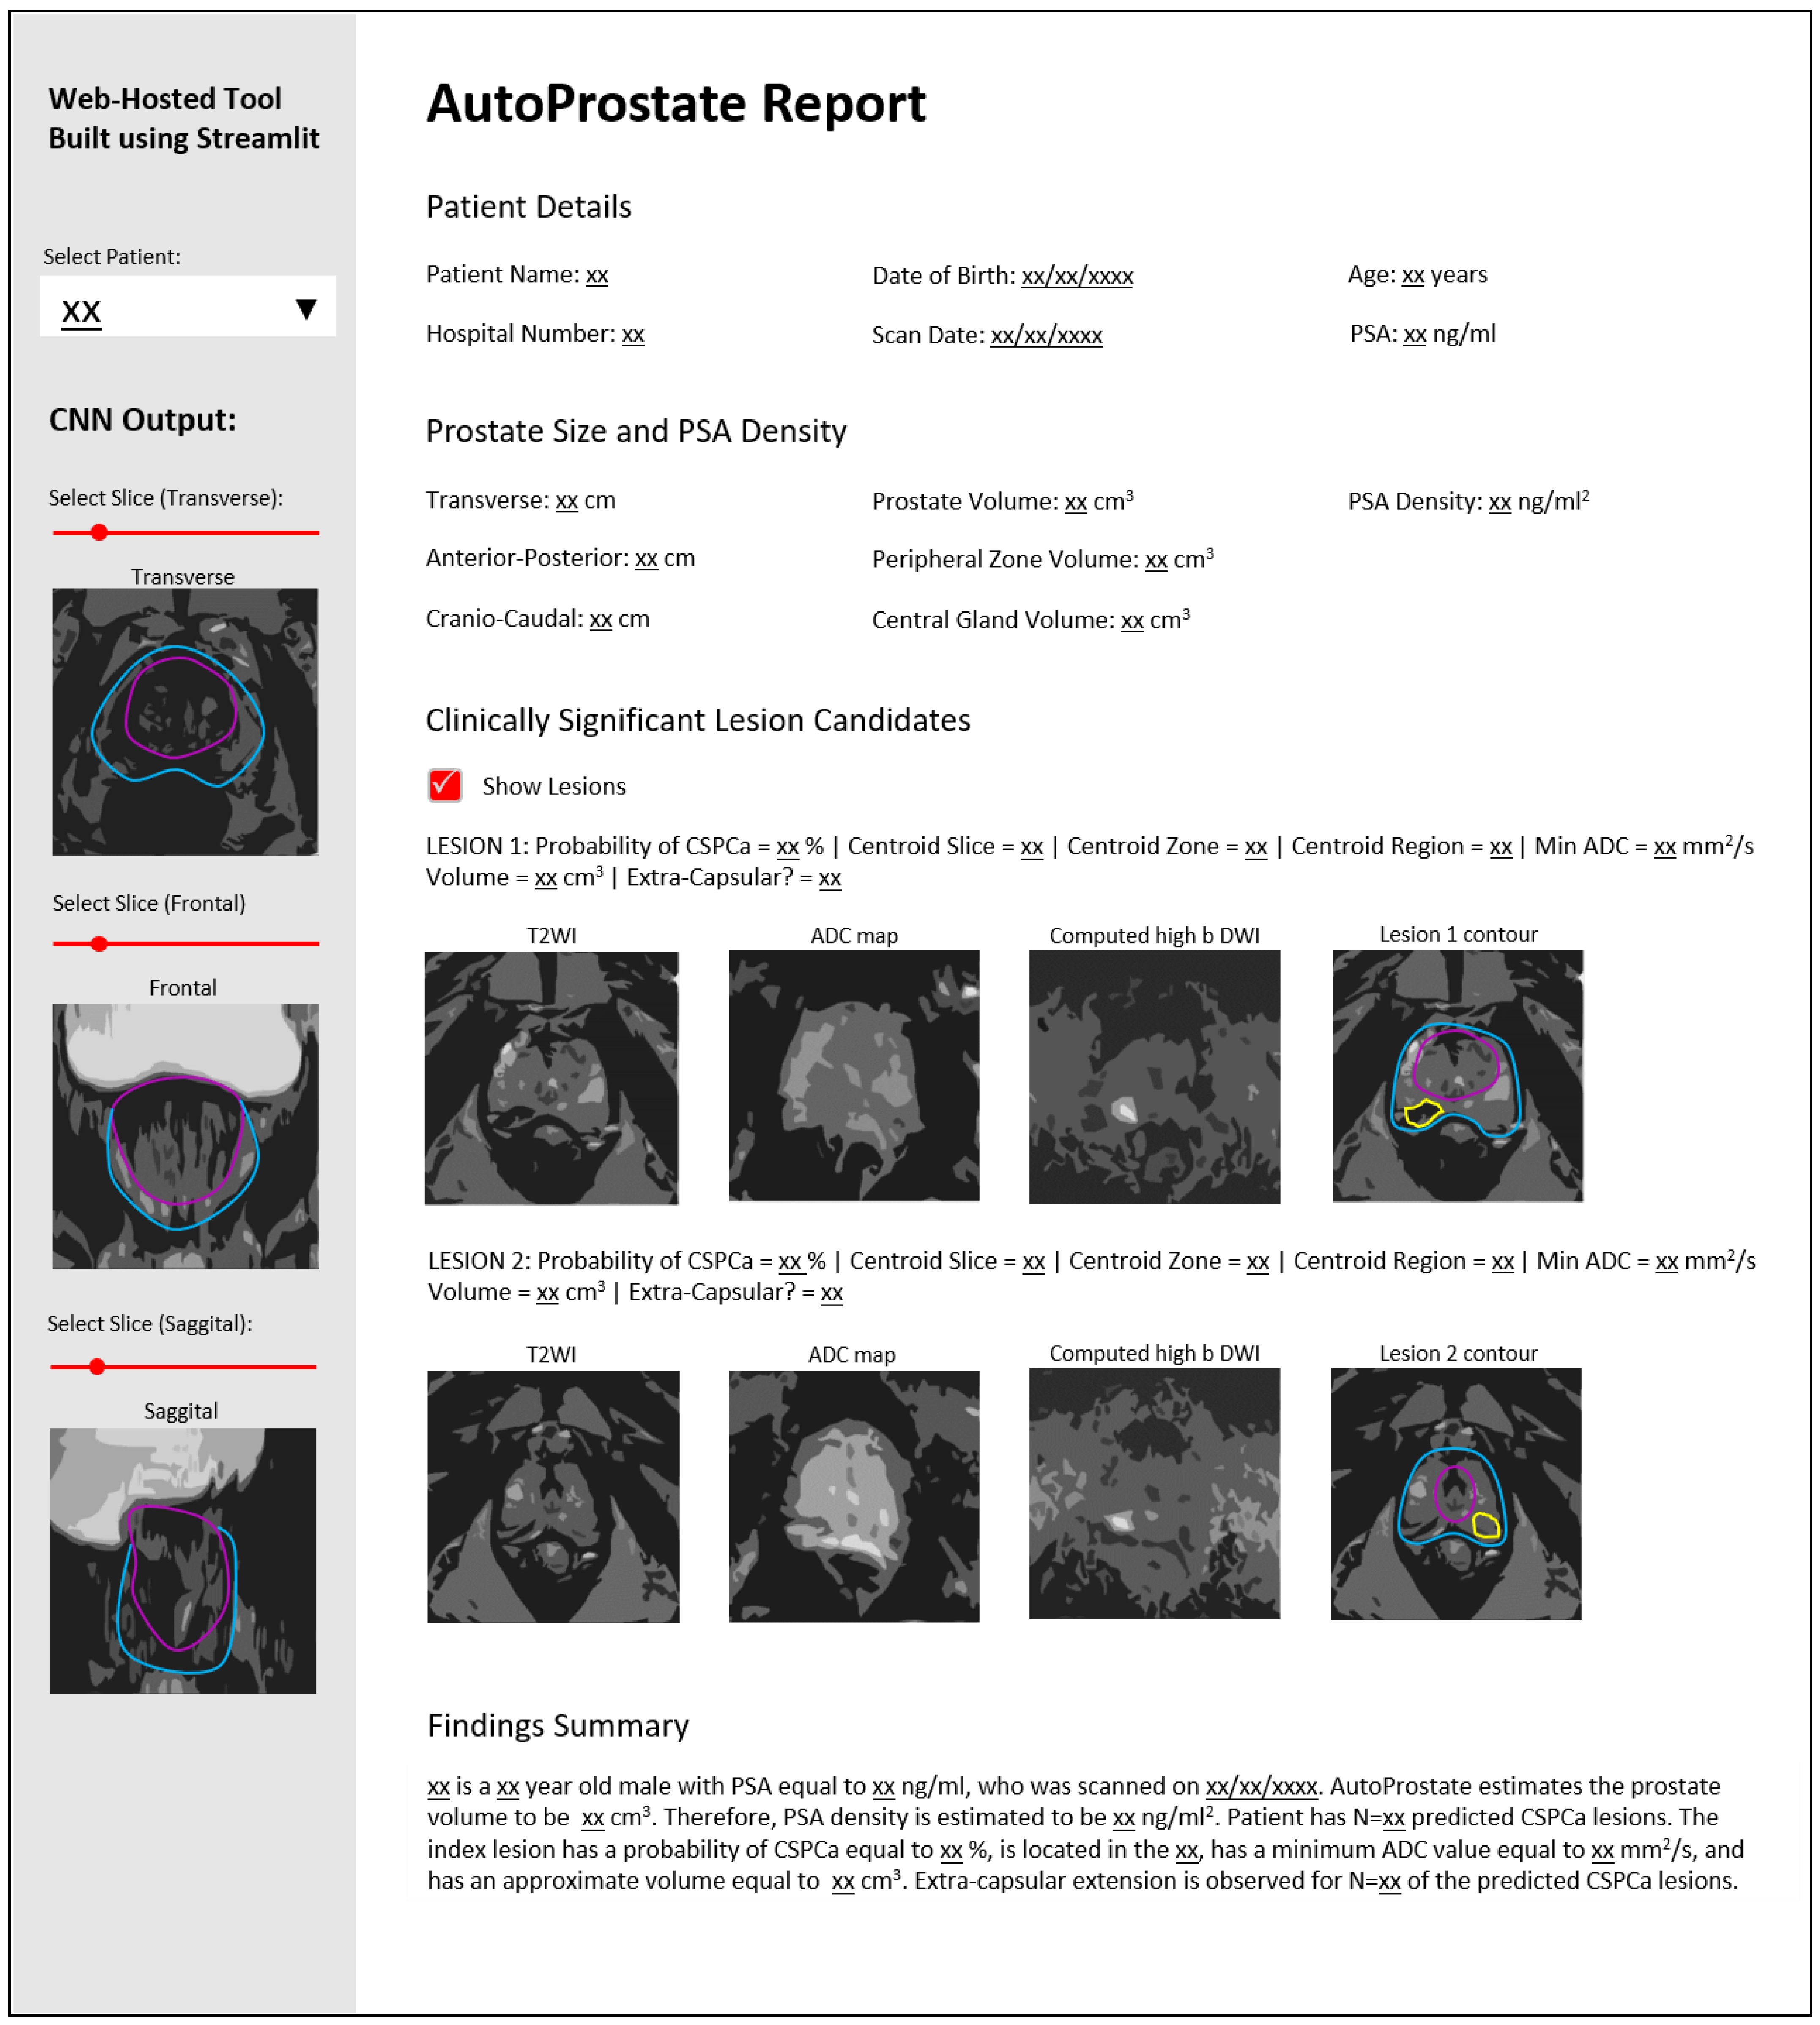
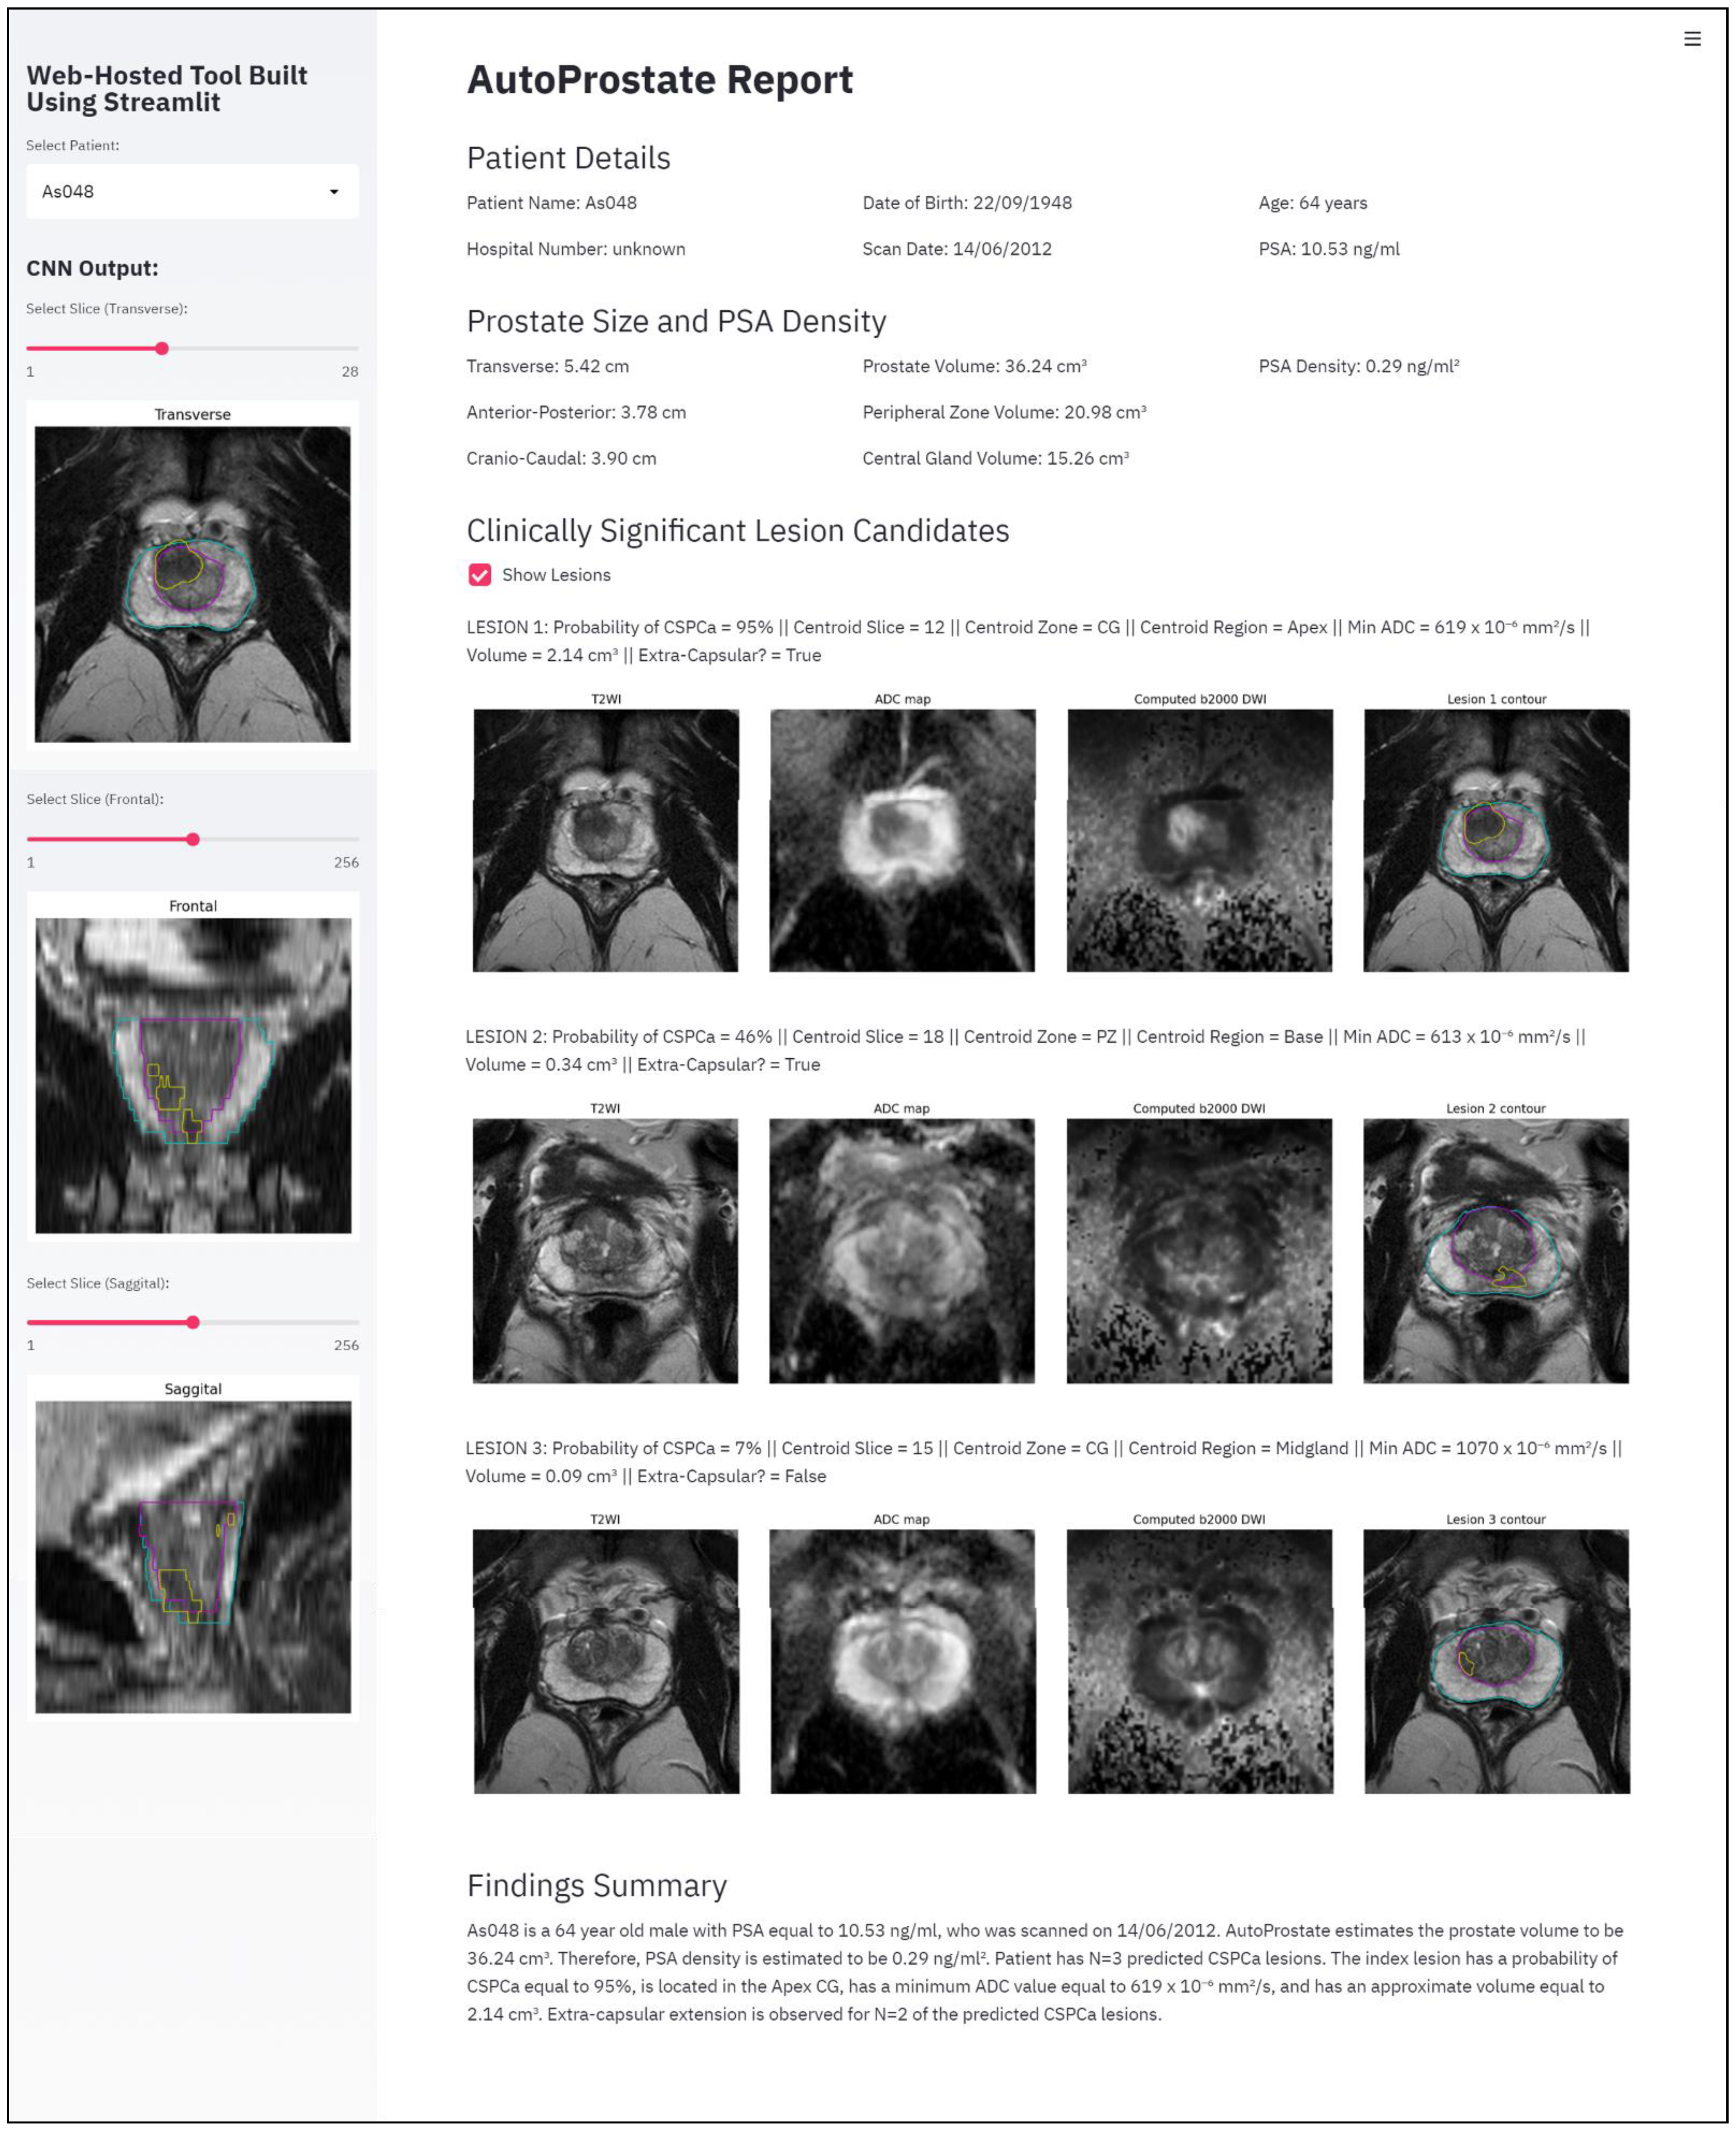
2.3. Report-Generator Module
3. Experimental Setup
3.1. Patient Datasets
3.1.1. PROSTATEx Dataset
3.1.2. PICTURE Dataset
3.2. Methodological Settings
3.2.1. Zone-Segmenter Module
3.2.2. CSPCa-Segmenter Module
3.3. AutoProstate External Validation Evaluation Measures
4. Results
4.1. Zone-U-Net and CSPCa-U-Net Tenfold Cross-Validation
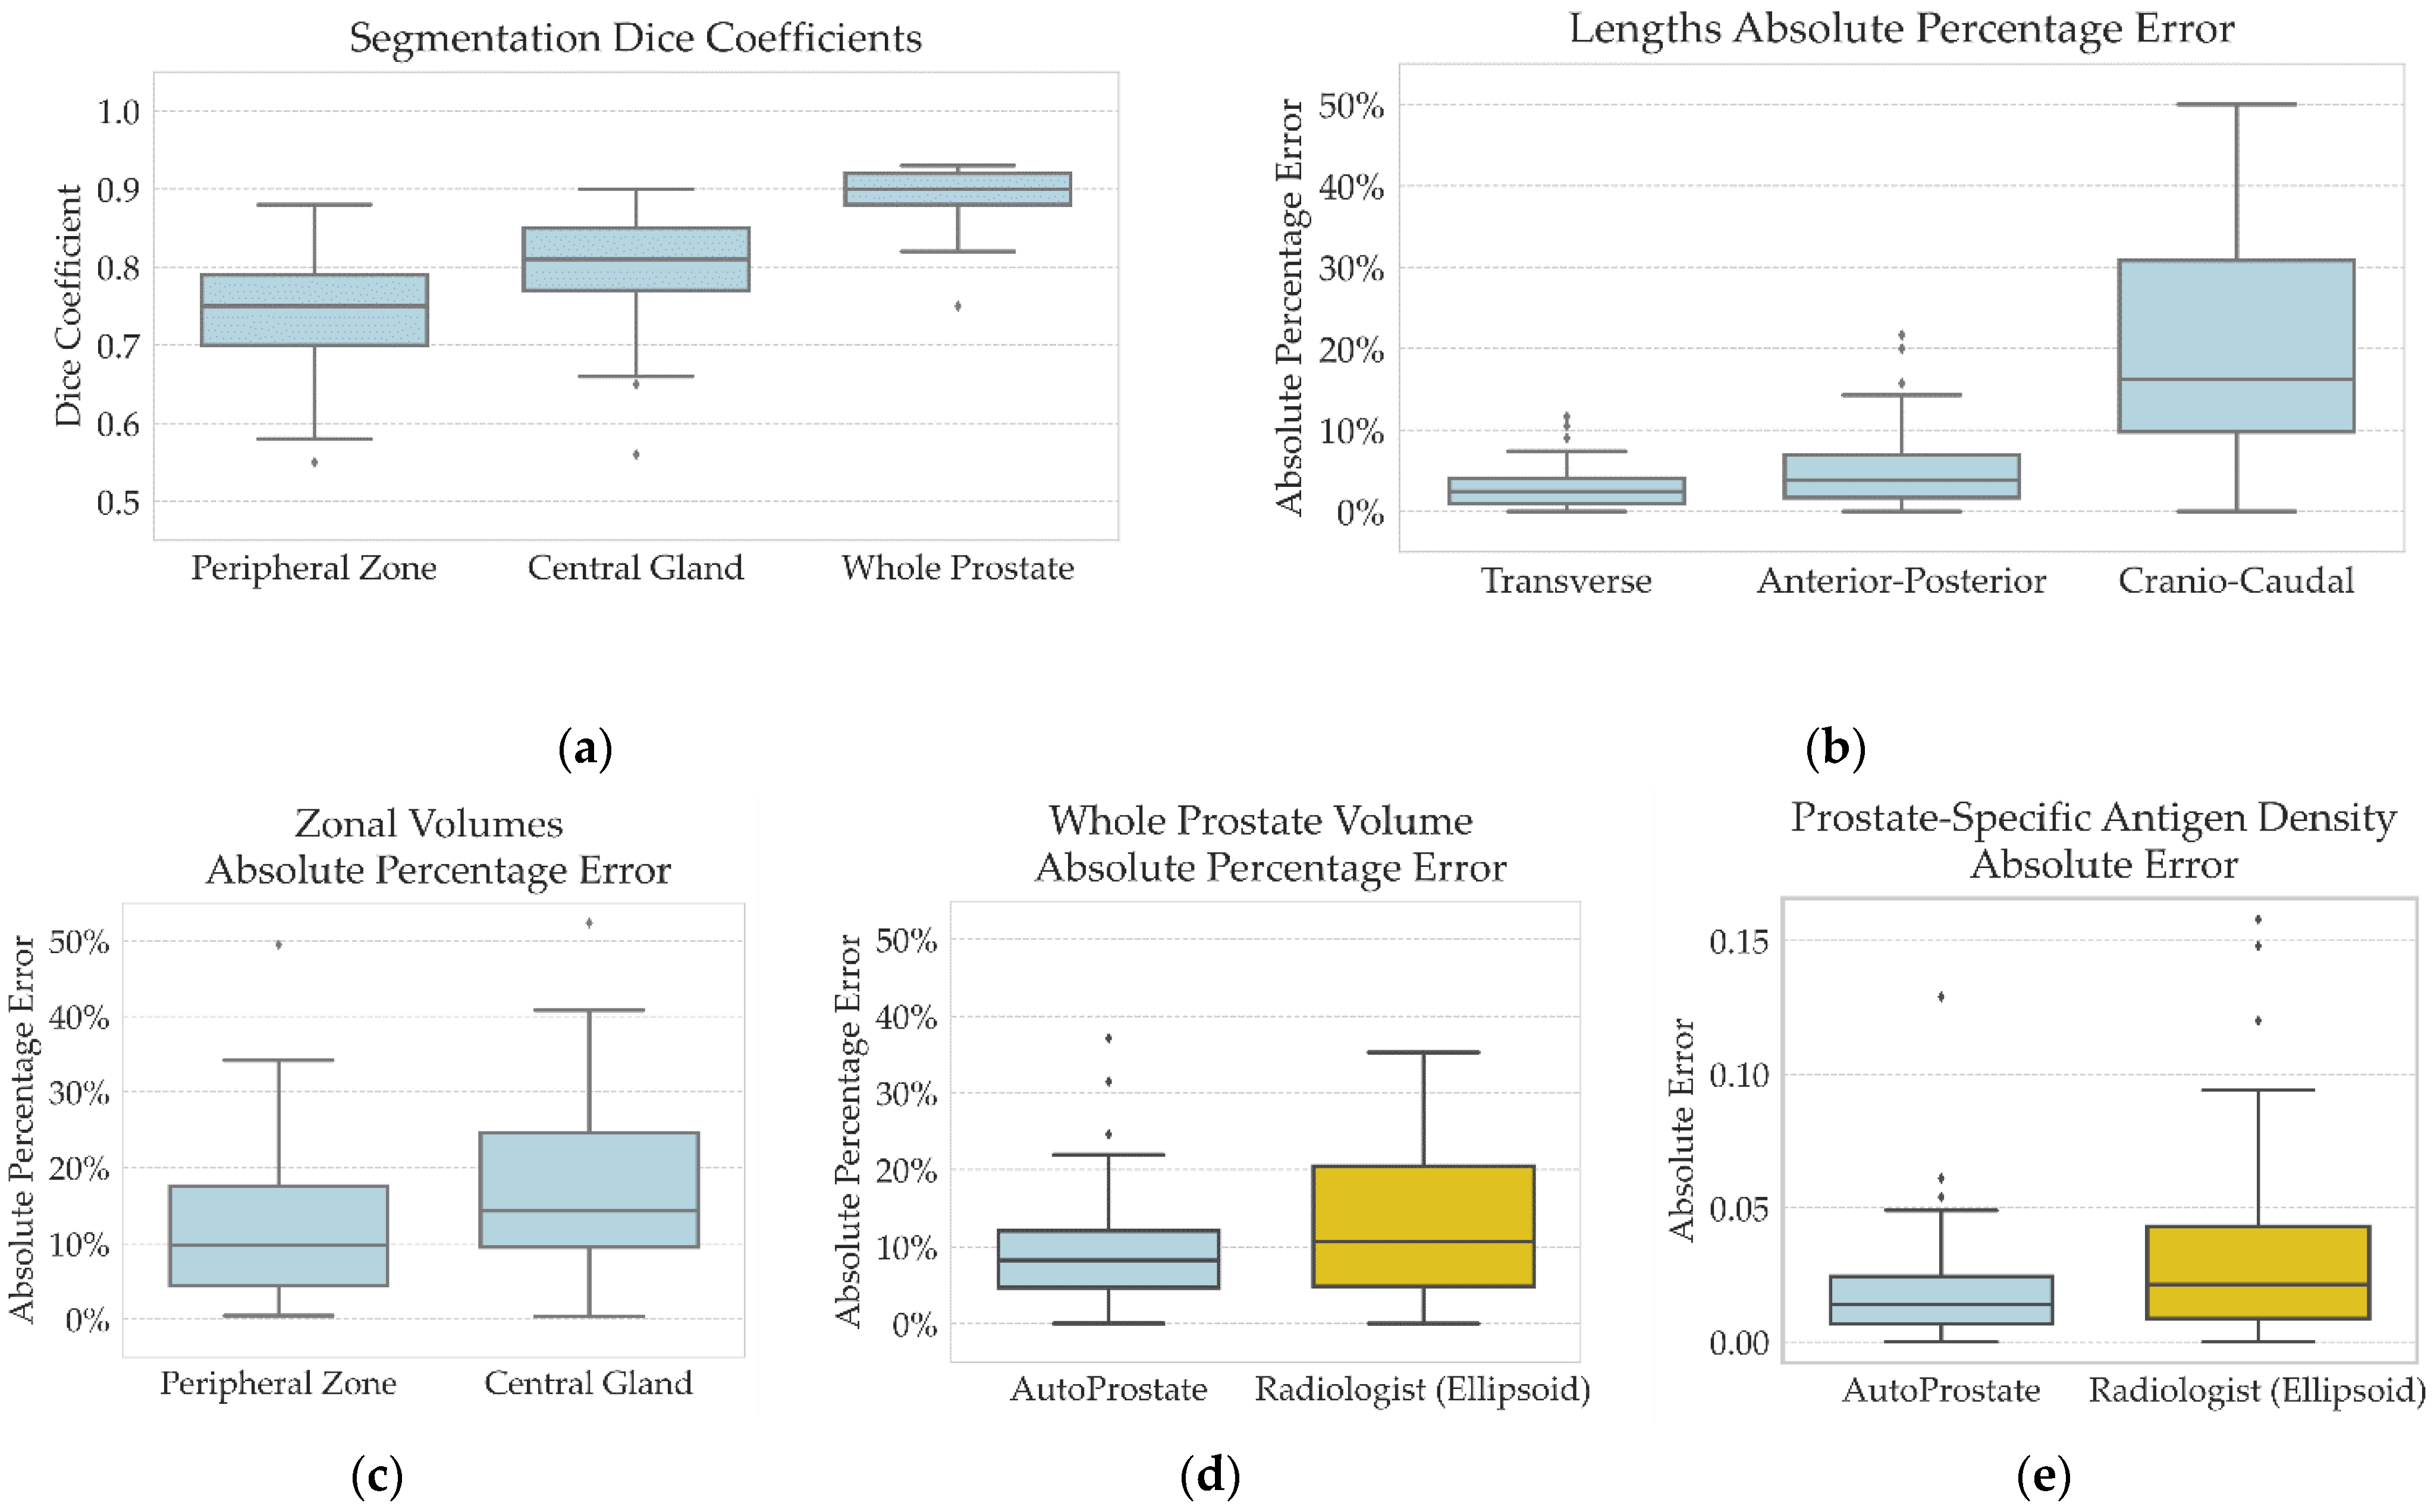
4.2. AutoProstate External Validation Analysis: Whole-Prostate and Zonal Segmentations, Prostate Size Measurements, and PSA Density
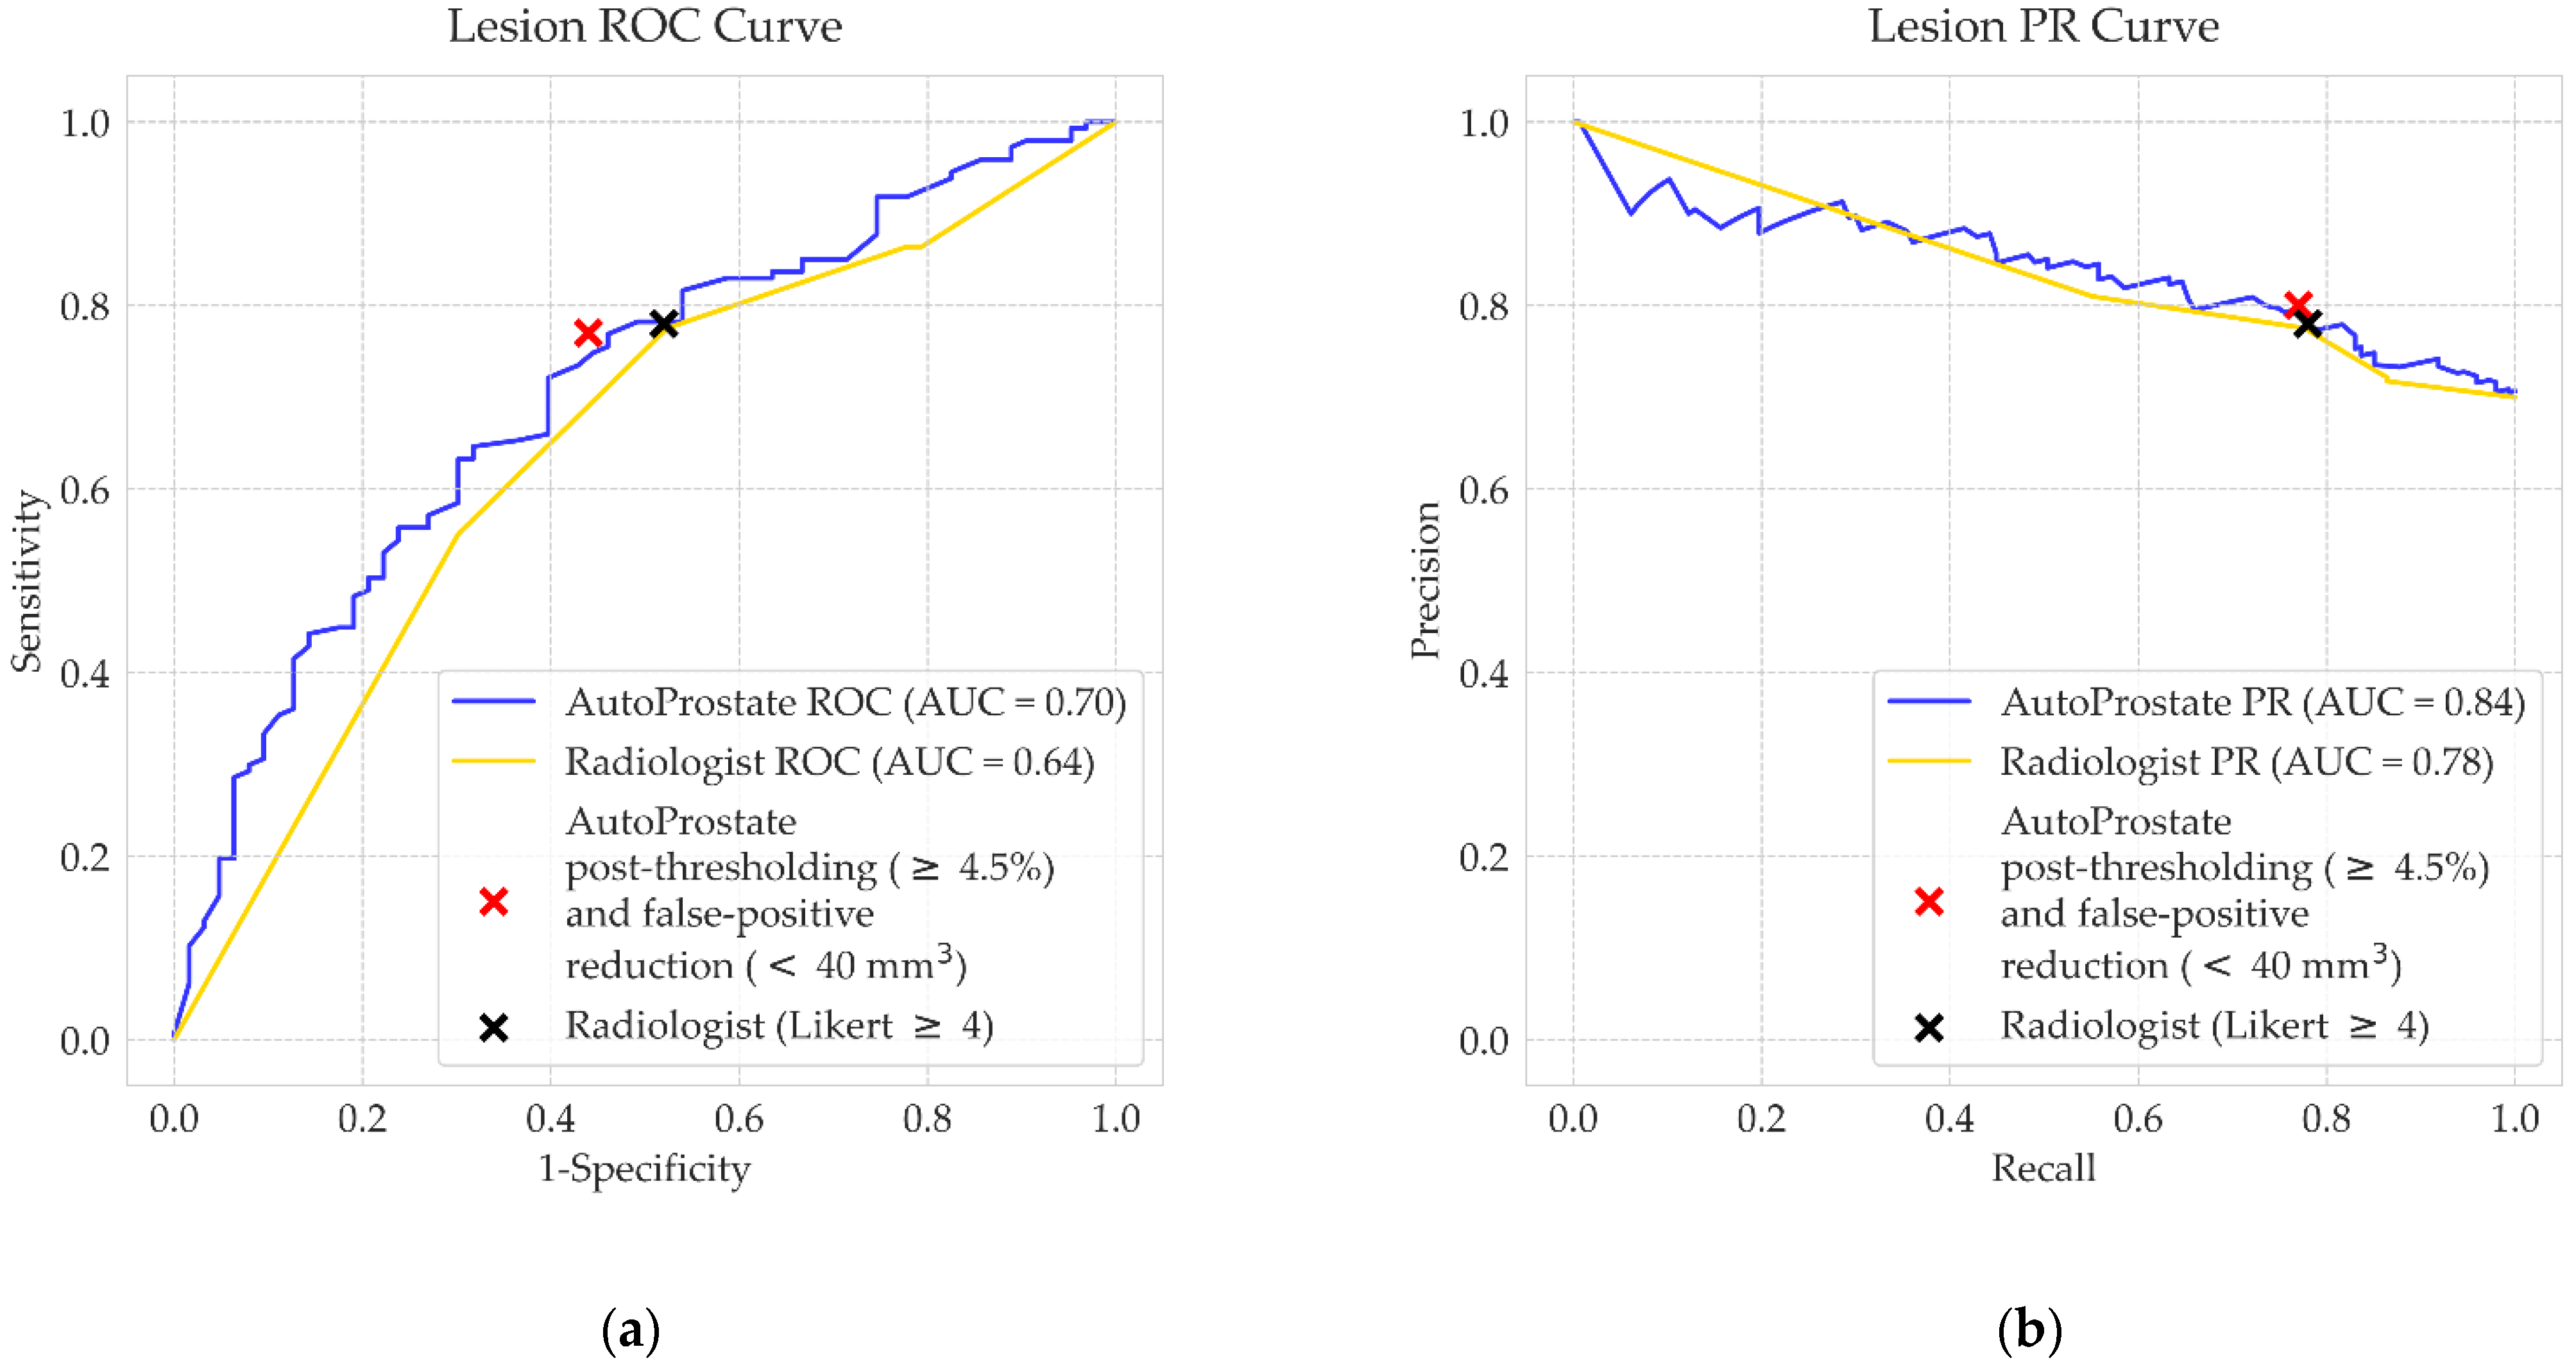
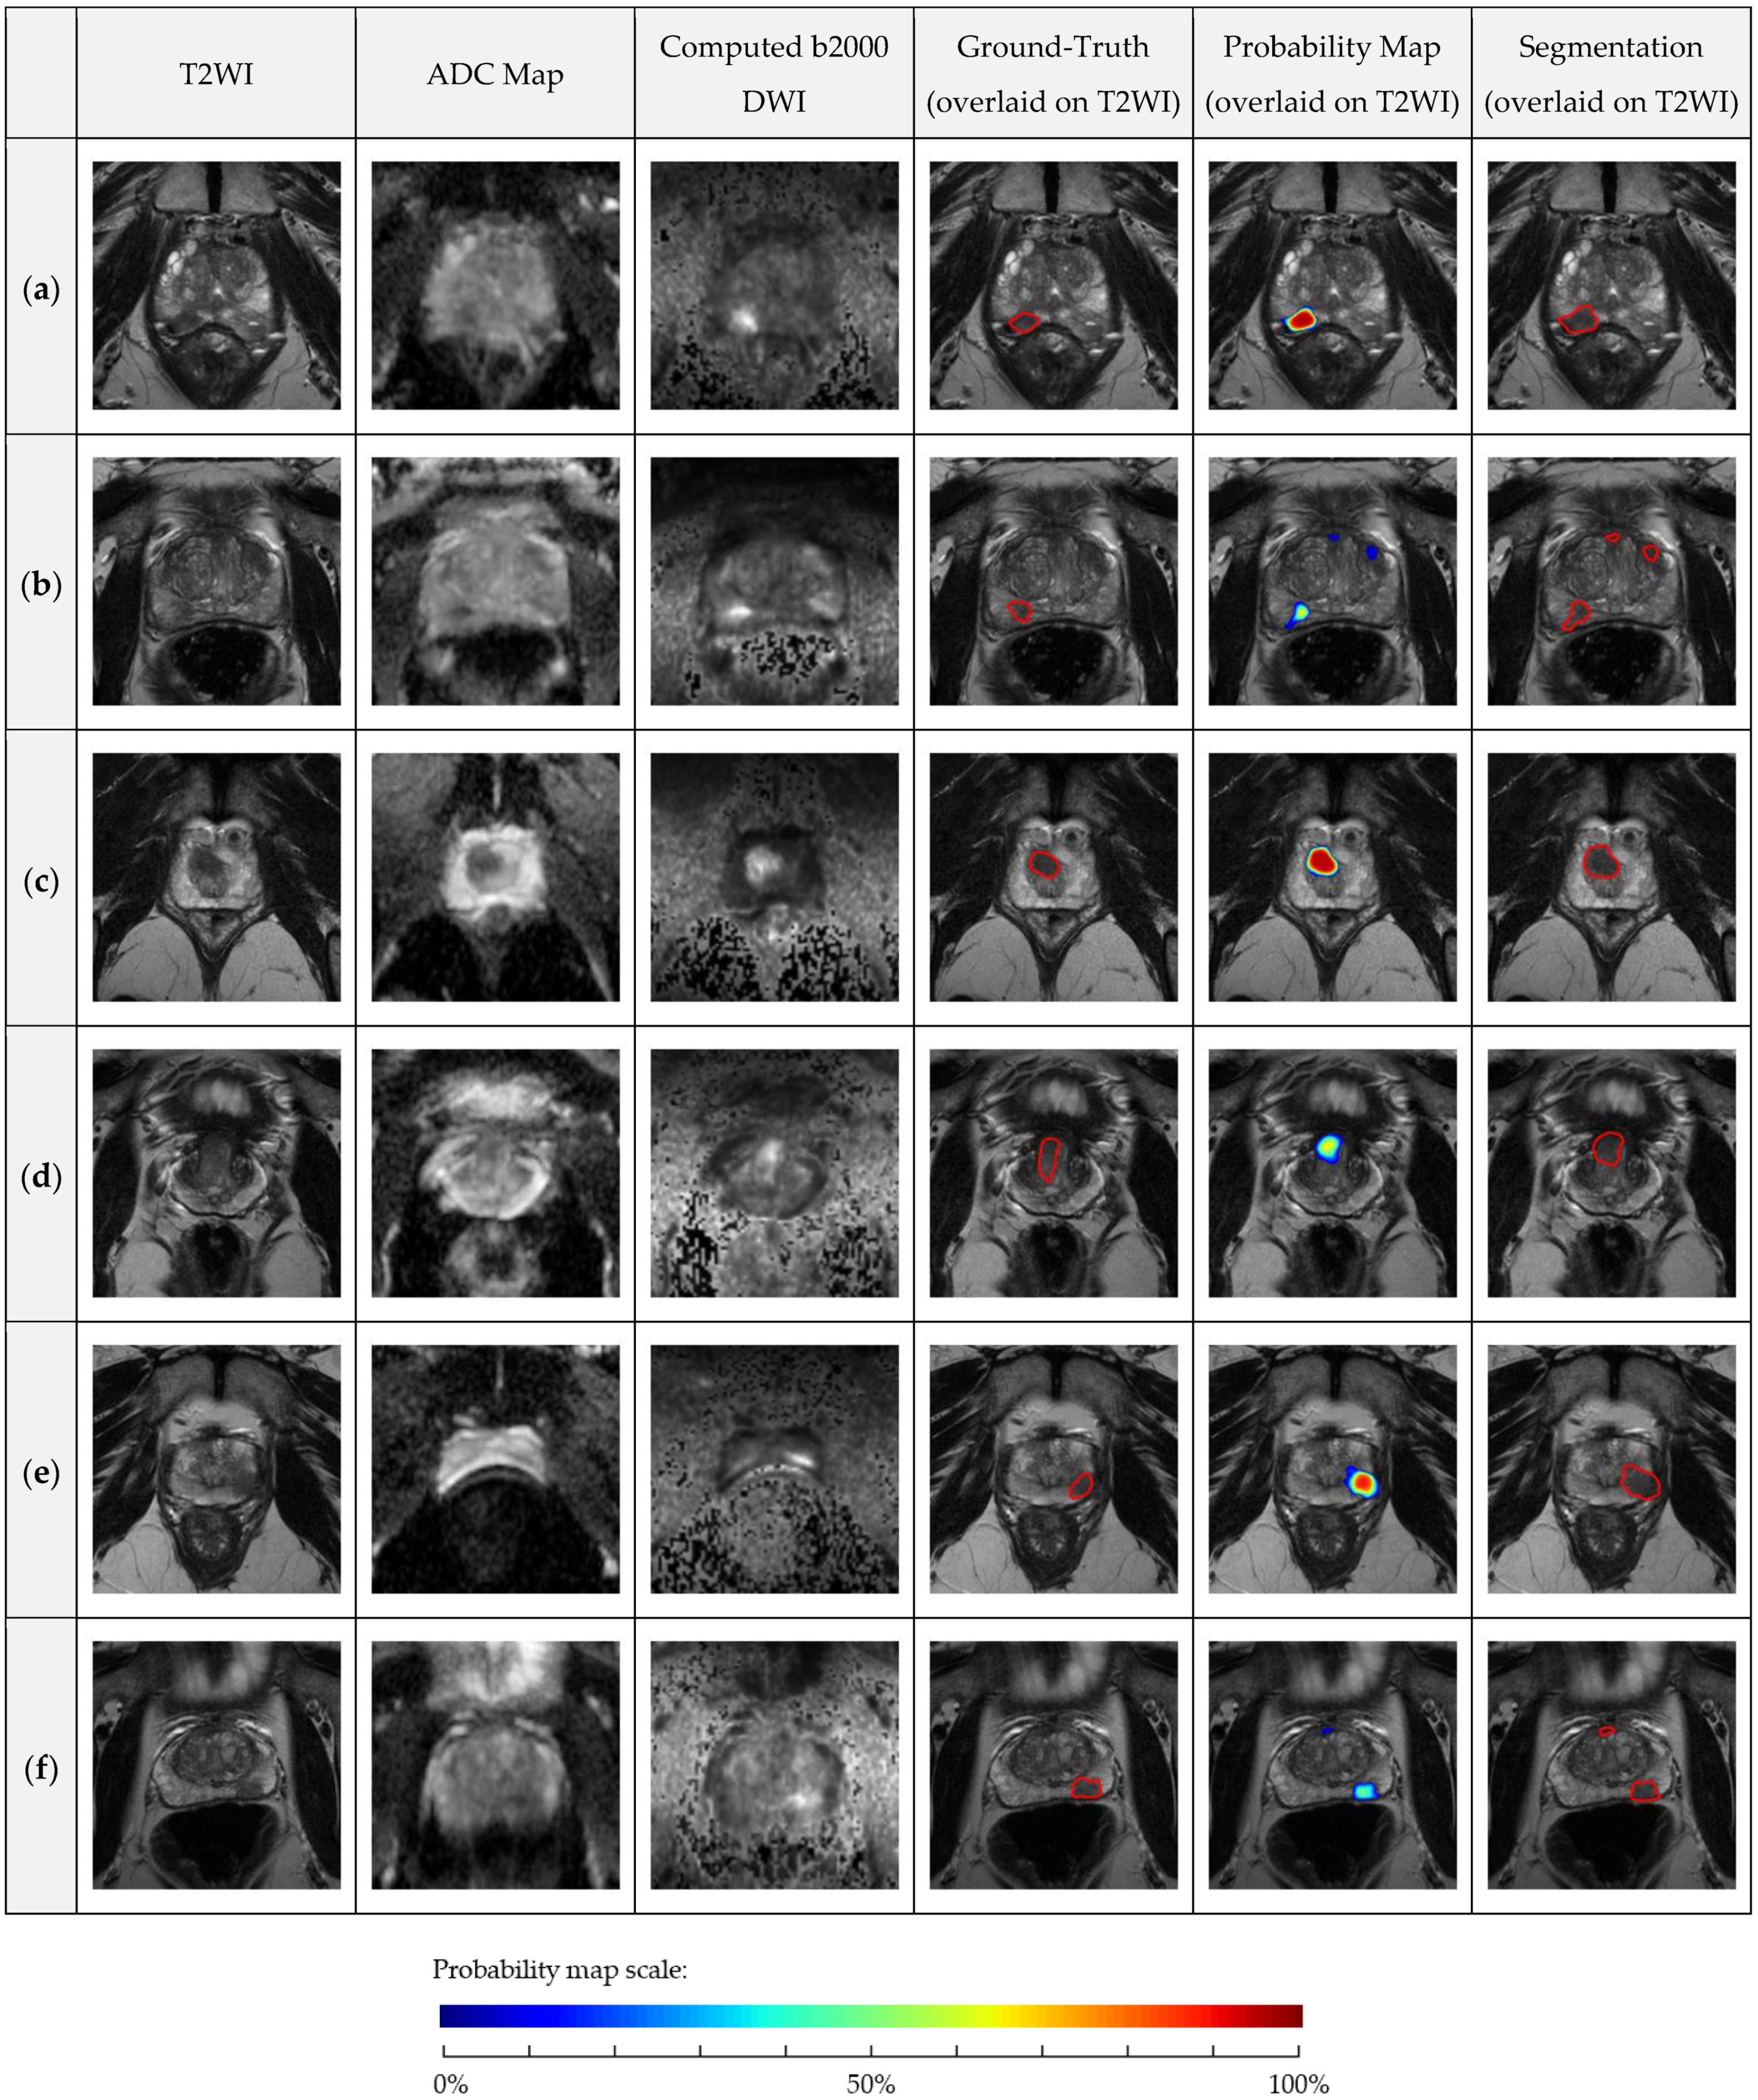
4.3. AutoProstate External Validation Analysis: Clinically Significant Prostate Cancer Lesion Detection and Segmentation
5. Discussion
6. Conclusions
Supplementary Materials
Author Contributions
Funding
Institutional Review Board Statement
Informed Consent Statement
Data Availability Statement
Acknowledgments
Conflicts of Interest
References
- Ahmed, H.U.; El-Shater Bosaily, A.; Brown, L.C.; Gabe, R.; Kaplan, R.; Parmar, M.K.; Collaco-Moraes, Y.; Ward, K.; Hindley, R.G.; Freeman, A.; et al. Diagnostic accuracy of multi-parametric MRI and TRUS biopsy in prostate cancer (PROMIS): A paired validating confirmatory study. Lancet 2017, 389, 815–822. [Google Scholar] [CrossRef] [Green Version]
- Brembilla, G.; Dell’Oglio, P.; Stabile, A.; Damascelli, A.; Brunetti, L.; Ravelli, S.; Cristel, G.; Schiani, E.; Venturini, E.; Grippaldi, D.; et al. Interreader variability in prostate MRI reporting using Prostate Imaging Reporting and Data System version 2.1. Eur. Radiol. 2020, 30, 3383–3392. [Google Scholar] [CrossRef] [PubMed]
- Stanzione, A.; Ponsiglione, A.; Di Fiore, G.A.; Picchi, S.G.; Di Stasi, M.; Verde, F.; Petretta, M.; Imbriaco, M.; Cuocolo, R. Prostate Volume Estimation on MRI: Accuracy and Effects of Ellipsoid and Bullet-Shaped Measurements on PSA Density. Acad. Radiol. 2021, 28, e219–e226. [Google Scholar] [CrossRef] [PubMed]
- Distler, F.A.; Radtke, J.P.; Bonekamp, D.; Kesch, C.; Schlemmer, H.-P.; Wieczorek, K.; Kirchner, M.; Pahernik, S.; Hohenfellner, M.; Hadaschik, B.A. The Value of PSA Density in Combination with PI-RADSTM for the Accuracy of Prostate Cancer Prediction. J. Urol. 2017, 198, 575–582. [Google Scholar] [CrossRef] [PubMed]
- Yang, X.; Lei, Y.; Wang, T.; Jiang, X.; Jani, A.; Mao, H.; Curran, W.; Patel, P.; Liu, T.; Wang, B. 3D prostate segmentation in MR image using 3D deeply supervised convolutional neural networks. Med. Phys. 2018, 45, e582–e583. [Google Scholar]
- Aldoj, N.; Biavati, F.; Michallek, F.; Stober, S.; Dewey, M. Automatic prostate and prostate zones segmentation of magnetic resonance images using DenseNet-like U-net. Sci. Rep. 2020, 10, 1–17. [Google Scholar] [CrossRef]
- Cuocolo, R.; Comelli, A.; Stefano, A.; Benfante, V.; Dahiya, N.; Stanzione, A.; Castaldo, A.; De Lucia, D.R.; Yezzi, A.; Imbriaco, M. Deep Learning Whole-Gland and Zonal Prostate Segmentation on a Public MRI Dataset. J. Magn. Reson. Imaging 2021, 1–8. [Google Scholar] [CrossRef]
- Milletari, F.; Navab, N.; Ahmadi, S. V-Net: Fully Convolutional Neural Networks for Volumetric Medical Image Segmentation. In Proceedings of the Fourth International Conference on 3D Vision (3DV), Stanford, CA, USA, 25–28 October 2016. [Google Scholar]
- Comelli, A.; Dahiya, N.; Stefano, A.; Vernuccio, F.; Portoghese, M.; Cutaia, G.; Bruno, A.; Salvaggio, G.; Yezzi, A. Deep Learning-Based Methods for Prostate Segmentation in Magnetic Resonance Imaging. Appl. Sci. 2021, 11, 782. [Google Scholar] [CrossRef]
- Lee, D.K.; Sung, D.J.; Kim, C.-S.; Heo, Y.; Lee, J.Y.; Park, B.J.; Kim, M.J. Three-Dimensional Convolutional Neural Network for Prostate MRI Segmentation and Comparison of Prostate Volume Measurements by Use of Artificial Neural Network and Ellipsoid Formula. Am. J. Roentgenol. 2020, 214, 1229–1238. [Google Scholar] [CrossRef] [PubMed]
- Litjens, G.; Toth, R.; van de Ven, W.; Hoeks, C.; Kerkstra, S.; van Ginneken, B.; Vincent, G.; Guillard, G.; Birbeck, N.; Zhang, J.; et al. Evaluation of prostate segmentation algorithms for MRI: The PROMISE12 challenge. Med. Image Anal. 2014, 18, 359–373. [Google Scholar] [CrossRef] [PubMed] [Green Version]
- Cao, R.; Mohammadian Bajgiran, A.; Afshari Mirak, S.; Shakeri, S.; Zhong, X.; Enzmann, D.; Raman, S.; Sung, K. Joint Prostate Cancer Detection and Gleason Score Prediction in mp-MRI via FocalNet. IEEE Trans. Med. Imaging 2019, 38, 2496–2506. [Google Scholar] [CrossRef] [PubMed] [Green Version]
- Giannini, V.; Mazzetti, S.; Armando, E.; Carabalona, S.; Russo, F.; Giacobbe, A.; Muto, G.; Regge, D. Multiparametric magnetic resonance imaging of the prostate with computer-aided detection: Experienced observer performance study. Eur. Radiol. 2017, 27, 4200–4208. [Google Scholar] [CrossRef]
- Schelb, P.; Kohl, S.; Radtke, J.P.; Wiesenfarth, M.; Kickingereder, P.; Bickelhaupt, S.; Kuder, T.A.; Stenzinger, A.; Hohenfellner, M.; Schlemmer, H.-P.; et al. Classification of Cancer at Prostate MRI: Deep Learning versus Clinical PI-RADS Assessment. Radiology 2019, 293, 607–617. [Google Scholar] [CrossRef] [PubMed]
- Thon, A.; Teichgraber, U.; Tennstedt-Schenk, C.; Hadjidemetriou, S.; Winzler, S.; Malich, A.; Papageorgiou, I. Computer aided detection in prostate cancer diagnostics: A promising alternative to biopsy? A retrospective study from 104 lesions with histological ground truth. PLoS ONE 2017, 12, e0185995. [Google Scholar] [CrossRef] [PubMed] [Green Version]
- Greer, M.D.; Lay, N.; Shih, J.H.; Barrett, T.; Bittencourt, L.K.; Borofsky, S.; Kabakus, I.; Law, Y.M.; Marko, J.; Shebel, H.; et al. Computer-aided diagnosis prior to conventional interpretation of prostate mpMRI: An international multi-reader study. Eur. Radiol. 2018, 28, 4407–4417. [Google Scholar] [CrossRef]
- Gaur, S.; Lay, N.; Harmon, S.A.; Doddakashi, S.; Mehralivand, S.; Argun, B.; Barrett, T.; Bednarova, S.; Girometti, R.; Karaarslan, E.; et al. Can computer-aided diagnosis assist in the identification of prostate cancer on prostate MRI? A multi-center, multi-reader investigation. Oncotarget 2018, 9, 33804–33817. [Google Scholar] [CrossRef] [Green Version]
- Zhu, L.; Gao, G.; Liu, Y.; Han, C.; Liu, J.; Zhang, X.; Wang, X. Feasibility of integrating computer-aided diagnosis with structured reports of prostate multiparametric MRI. Clin. Imaging 2020, 60, 123–130. [Google Scholar] [CrossRef]
- Ronneberger, O.; Fischer, P.; Brox, T. U-Net: Convolutional Networks for Biomedical Image Segmentation. In Proceedings of the International Conference on Medical Image Computing and Computer-Assisted Intervention, Munich, Germany, 5–9 October 2015; Springer: Cham, Switzerland, 2015; pp. 234–241. [Google Scholar]
- Zhu, W.; Huang, Y.; Zeng, L.; Chen, X.; Liu, Y.; Qian, Z.; Du, N.; Fan, W.; Xie, X. AnatomyNet: Deep learning for fast and fully automated whole-volume segmentation of head and neck anatomy. Med. Phys. 2019, 46, 576–589. [Google Scholar] [CrossRef] [Green Version]
- Gal, Y.; Ghahramani, Z. Dropout as a Bayesian approximation: Representing model uncertainty in deep learning. In Proceedings of the 33rd International Conference on Machine Learning, ICML 2016, New York, NY, USA, 20–22 June 2016; Volume 48, pp. 1651–1660. [Google Scholar]
- Wang, G.; Li, W.; Aertsen, M.; Deprest, J.; Ourselin, S.; Vercauteren, T. Aleatoric uncertainty estimation with test-time augmentation for medical image segmentation with convolutional neural networks. Neurocomputing 2019, 338, 34–45. [Google Scholar] [CrossRef]
- Litjens, G.; Debats, O.; Barentsz, J.; Karssemeijer, N.; Huisman, H. ProstateX Challenge data. Cancer Imaging Arch. 2017. [Google Scholar]
- Simmons, L.A.M.; Kanthabalan, A.; Arya, M.; Briggs, T.; Barratt, D.; Charman, S.C.; Freeman, A.; Gelister, J.; Hawkes, D.; Hu, Y.; et al. The PICTURE study: Diagnostic accuracy of multiparametric MRI in men requiring a repeat prostate biopsy. Br. J. Cancer 2017, 116, 1159–1165. [Google Scholar] [CrossRef]
- Bluemke, D.A.; Moy, L.; Bredella, M.A.; Ertl-Wagner, B.B.; Fowler, K.J.; Goh, V.J.; Halpern, E.F.; Hess, C.P.; Schiebler, M.L.; Weiss, C.R. Assessing radiology research on artificial intelligence: A brief guide for authors, reviewers, and readers-From the Radiology Editorial Board. Radiology 2020, 294, 487–489. [Google Scholar] [CrossRef] [PubMed] [Green Version]
- Verma, S.; Sarkar, S.; Young, J.; Venkataraman, R.; Yang, X.; Bhavsar, A.; Patil, N.; Donovan, J.; Gaitonde, K. Evaluation of the impact of computed high b-value diffusion-weighted imaging on prostate cancer detection. Abdom. Radiol. 2016, 41, 934–945. [Google Scholar] [CrossRef] [PubMed]
- Blackledge, M.D.; Leach, M.O.; Collins, D.J.; Koh, D.-M.; May, I.; Tumor, I.; Blackledge, M.D.; Leach, M.O.; Collins, D.J. Computed Diffusion-weighted MR Imaging May Improve Tumor Detection. Radiology 2011, 261, 573–581. [Google Scholar] [CrossRef]
- Ourselin, S.; Roche, A.; Subsol, G.; Pennec, X.; Ayache, N. Reconstructing a 3D structure from serial histological sections. Image Vis. Comput. 2001, 19, 25–31. [Google Scholar] [CrossRef]
- Modat, M.; Ridgway, G.R.; Taylor, Z.A.; Lehmann, M.; Barnes, J.; Hawkes, D.J.; Fox, N.C.; Ourselin, S. Fast free-form deformation using graphics processing units. Comput. Methods Programs Biomed. 2010, 98, 278–284. [Google Scholar] [CrossRef] [PubMed] [Green Version]
- Cachier, P.; Bardinet, E.; Dormont, D.; Pennec, X.; Ayache, N. Iconic feature based nonrigid registration: The PASHA algorithm. Comput. Vis. Image Underst. 2003, 89, 272–298. [Google Scholar] [CrossRef]
- Bonekamp, D.; Kohl, S.; Wiesenfarth, M.; Schelb, P.; Radtke, J.P.; Gotz, M.; Kickingereder, P.; Yaqubi, K.; Hitthaler, B.; Gahlert, N.; et al. Radiomic Machine Learning for Characterization of Prostate Lesions with MRI: Comparison to ADC Values. Radiology 2018, 289, 128–137. [Google Scholar] [CrossRef]
- Isensee, F.; Petersen, J.; Klein, A.; Zimmerer, D.; Jaeger, P.F.; Kohl, S.; Wasserthal, J.; Koehler, G.; Norajitra, T.; Wirkert, S.; et al. nnU-Net: Self-adapting Framework for U-Net-Based Medical Image Segmentation. arXiv 2018, arXiv:1809.10486. [Google Scholar] [CrossRef] [Green Version]
- Hosseinzadeh, M.; Brand, P.; Huisman, H. Effect of Adding Probabilistic Zonal Prior in Deep Learning-based Prostate Cancer Detection. In Proceedings of the Medical Imaging with Deep Learning (MIDL), London, UK, 8–10 July 2019. [Google Scholar]
- Kendall, A.; Badrinarayanan, V.; Cipolla, R. Bayesian SegNet: Model Uncertainty in Deep Convolutional Encoder-Decoder Architectures for Scene Understanding. In Proceedings of the Proceedings of the British Machine Vision Conference (BMVC), London, UK, 4–7 September 2017. [Google Scholar]
- Zadrozny, B.; Elkan, C. Transforming classifier scores into accurate multiclass probability estimates. In Proceedings of the Proceedings of the ACM SIGKDD International Conference on Knowledge Discovery and Data Mining, Edmonton, AB, Canada, 23–26 July 2002; pp. 694–699. [Google Scholar]
- Litjens, G.; Debats, O.; Barentsz, J.; Karssemeijer, N.; Huisman, H. Computer-aided detection of prostate cancer in MRI. IEEE Trans Med Imaging. 2014, 33, 1083–1092. [Google Scholar] [CrossRef]
- Cuocolo, R.; Stanzione, A.; Castaldo, A.; De Lucia, D.R.; Imbriaco, M. Quality control and whole-gland, zonal and lesion annotations for the PROSTATEx challenge public dataset. Eur. J. Radiol. 2021, 138, 120. [Google Scholar] [CrossRef] [PubMed]
- Emberton, M.; Simmons, L.A.M.; Ahmed, H.U.; Moore, C.M. PICTURE: Prostate Imaging (Multi-Sequence MRI and Prostate HistoScanning TM ) Compared to Transperineal Ultrasound Guided Biopsy for Significant Prostate Cancer Risk Evaluation CASE REPORT FORM; University College London Hospitals: London, UK, 2013. [Google Scholar]
- Dickinson, L.; Ahmed, H.U.; Allen, C.; Barentsz, J.O.; Carey, B.; Futterer, J.J.; Heijmink, S.W.; Hoskin, P.J.; Kirkham, A.; Padhani, A.R.; et al. Magnetic Resonance Imaging for the Detection, Localisation, and Characterisation of Prostate Cancer: Recommendations from a European Consensus Meeting. Eur. Urol. 2011, 59, 477–494. [Google Scholar] [CrossRef]
- Wang, N.N.; Fan, R.E.; Leppert, J.T.; Ghanouni, P.; Kunder, C.A.; Brooks, J.D.; Chung, B.I.; Sonn, G.A. Performance of multiparametric MRI appears better when measured in patients who undergo radical prostatectomy. Res. Rep. Urol. 2018, 10, 233–235. [Google Scholar] [CrossRef] [Green Version]
- Kingma, D.P.; Ba, J. Adam: A Method for Stochastic Optimization. In Proceedings of the International Conference on Learning Representations, San Diego, CA, USA, 7–9 May 2015. [Google Scholar]
- Litjens, G.J.; Barentsz, J.O.; Karssemeijer, N.; Huisman, H.J. Clinical evaluation of a computer-aided diagnosis system for determining cancer aggressiveness in prostate MRI. Eur. Radiol. 2015, 25, 3187–3199. [Google Scholar] [CrossRef] [PubMed] [Green Version]
- NICE Prostate cancer: Diagnosis and management. National Institute of Health and Care Excellence: Guidelines. 2019. Available online: https://www.nice.org.uk/guidance/ng131 (accessed on 5 September 2019).
- Wilcoxon, F. Individual Comparisons by Ranking Methods. Biom. Bull. 1945, 1, 80–83. [Google Scholar] [CrossRef]
- DeLong, E.R.; DeLong, D.M.; Clarke-Pearson, D.L. Comparing the Areas under Two or More Correlated Receiver Operating Characteristic Curves : A Nonparametric Approach. Biometrics 1988, 44, 837–845. [Google Scholar] [CrossRef]
- McNemar, Q. Note on the sampling error of the difference between correlated proportions or percentages. Psychometrika 1947, 12, 153–157. [Google Scholar] [CrossRef] [PubMed]
- Kosinski, A.S. A weighted generalized score statistic for comparison of predictive values of diagnostic tests. Stat. Med. 2013, 32, 1–20. [Google Scholar] [CrossRef] [Green Version]
- Paszke, A.; Chaurasia, A.; Kim, S.; Culurciello, E. ENet: A Deep Neural Network Architecture for Real-Time Semantic Segmentation. arXiv 2016, arXiv:1606.02147. [Google Scholar]
- Antonelli, M.; Cardoso, M.J.; Johnston, E.W.; Appayya, M.B.; Presles, B.; Modat, M.; Punwani, S.; Ourselin, S. GAS: A genetic atlas selection strategy in multi-atlas segmentation framework. Med. Image Anal. 2019, 52, 97–108. [Google Scholar] [CrossRef] [PubMed] [Green Version]
- Borofsky, S.; George, A.K.; Gaur, S.; Bernardo, M.; Greer, M.D.; Mertan, F.V.; Taffel, M.; Moreno, V.; Merino, M.J.; Wood, B.J.; et al. What Are We Missing? False-negative Cancers at Multiparametric MR Imaging of the Prostate. Radiology 2017, 286, 186–195. [Google Scholar] [CrossRef] [PubMed]
- Littrup, P.J.; Williams, C.R.; Egglin, T.K.; Kane, R.A. Determination of prostate volume with transrectal US for cancer screening: Part II. Accuracy of in vitro and in vivo techniques. Radiology 1991, 179, 49–53. [Google Scholar] [CrossRef] [PubMed]
- Brizmohun Appayya, M.; Adshead, J.; Ahmed, H.U.; Allen, C.; Bainbridge, A.; Barrett, T.; Giganti, F.; Graham, J.; Haslam, P.; Johnston, E.W.; et al. National implementation of multi-parametric magnetic resonance imaging for prostate cancer detection – recommendations from a UK consensus meeting. BJU Int. 2018, 122, 13–25. [Google Scholar] [CrossRef] [PubMed] [Green Version]
- Steenbergen, P.; Haustermans, K.; Lerut, E.; Oyen, R.; De Wever, L.; Van Den Bergh, L.; Kerkmeijer, L.G.W.; Pameijer, F.A.; Veldhuis, W.B.; Van Der Voort Van Zyp, J.R.N.; et al. Prostate tumor delineation using multiparametric magnetic resonance imaging: Inter-observer variability and pathology validation. Radiother. Oncol. 2015, 115, 186–190. [Google Scholar] [CrossRef] [PubMed] [Green Version]


| Evaluation Measure | Mean (SD) | Median (IQR) | Min–Max |
|---|---|---|---|
| Experienced Radiologist † | |||
| Whole-prostate volume Abs%Err | 13 (11) | 11 (5–20) | 0–66 |
| PSA density AbsErr | 0.031 (0.032) | 0.022 (0.008–0.043) | 0.000–0.158 |
| AutoProstate | |||
| Segmentation | |||
| Peripheral zone Dice coefficient | 0.75 (0.06) | 0.75 (0.70–0.79) | 0.55–0.88 |
| Central gland Dice coefficient | 0.80 (0.07) | 0.81 (0.77–0.85) | 0.56–0.90 |
| Whole-prostate Dice coefficient | 0.89 (0.03) | 0.90 (0.88–0.92) | 0.75–0.93 |
| Lengths | |||
| Transverse length Abs%Err | 3 (2) | 2 (1–4) | 0–12 |
| Anterior–posterior length Abs%Err | 5 (4) | 4 (2–7) | 0–22 |
| Cranio–caudal length Abs%Err | 20 (15) | 16 (10–31) | 0–100 |
| Volumes and PSA density | |||
| Peripheral zone volume Abs%Err | 12 (10) | 10 (4–18) | 0–49 |
| Central gland volume Abs%Err | 18 (15) | 14 (10–25) | 0–112 |
| Whole-prostate volume Abs%Err * | 9 (7) | 8 (5–12) | 0–37 |
| PSA density AbsErr * | 0.019 (0.020) | 0.014 (0.006–0.025) | 0.000–0.129 |
| Experienced Radiologist (Likert Scoring) | |
| ROC AUC | 0.64 (0.56–0.72) |
| PR AUC | 0.78 (0.71–0.84) |
| Post-thresholding (cut-off: Likert ≥4) | |
| Sensitivity/recall (%) | 78 (71–84) |
| Specificity (%) | 48 (35–60) |
| Precision (%) | 78 (71–84) |
| Mean false positives per patient | 0.3 (0.2–0.4) |
| AutoProstate | |
| ROC AUC | 0.70 (0.62–0.78) |
| PR AUC | 0.84 (0.77–0.90) |
| Post-thresholding (cut-off: ≥4.5%) | |
| Sensitivity/recall (%) | 78 (71–85) |
| Specificity (%) | 49 (37–62) |
| Precision (%) | 78 (71–85) |
| Mean false positives per patient * | 6.1 (5.5–6.8) |
| Post-thresholding (cut-off: ≥4.5%) and false-positive reduction (40 mm3) | |
| Sensitivity/recall (%) | 76 (68–82) |
| Specificity (%) | 57 (45–69) |
| Precision (%) | 80 (74–87) |
| Mean false positives per patient * | 2.5 (2.2–2.8) |
Publisher’s Note: MDPI stays neutral with regard to jurisdictional claims in published maps and institutional affiliations. |
© 2021 by the authors. Licensee MDPI, Basel, Switzerland. This article is an open access article distributed under the terms and conditions of the Creative Commons Attribution (CC BY) license (https://creativecommons.org/licenses/by/4.0/).
Share and Cite
Mehta, P.; Antonelli, M.; Singh, S.; Grondecka, N.; Johnston, E.W.; Ahmed, H.U.; Emberton, M.; Punwani, S.; Ourselin, S. AutoProstate: Towards Automated Reporting of Prostate MRI for Prostate Cancer Assessment Using Deep Learning. Cancers 2021, 13, 6138. https://0-doi-org.brum.beds.ac.uk/10.3390/cancers13236138
Mehta P, Antonelli M, Singh S, Grondecka N, Johnston EW, Ahmed HU, Emberton M, Punwani S, Ourselin S. AutoProstate: Towards Automated Reporting of Prostate MRI for Prostate Cancer Assessment Using Deep Learning. Cancers. 2021; 13(23):6138. https://0-doi-org.brum.beds.ac.uk/10.3390/cancers13236138
Chicago/Turabian StyleMehta, Pritesh, Michela Antonelli, Saurabh Singh, Natalia Grondecka, Edward W. Johnston, Hashim U. Ahmed, Mark Emberton, Shonit Punwani, and Sébastien Ourselin. 2021. "AutoProstate: Towards Automated Reporting of Prostate MRI for Prostate Cancer Assessment Using Deep Learning" Cancers 13, no. 23: 6138. https://0-doi-org.brum.beds.ac.uk/10.3390/cancers13236138