
A MYC-Driven Plasma Polyamine Signature for Early Detection of Ovarian Cancer

 , , and
Abstract
:Simple Summary
Abstract
1. Introduction
2. Materials and Methods
2.1. Blood Samples
2.2. Metabolomics Analysis
2.3. Measurement of CA125 Levels
2.4. Statistical Analyses
3. Results
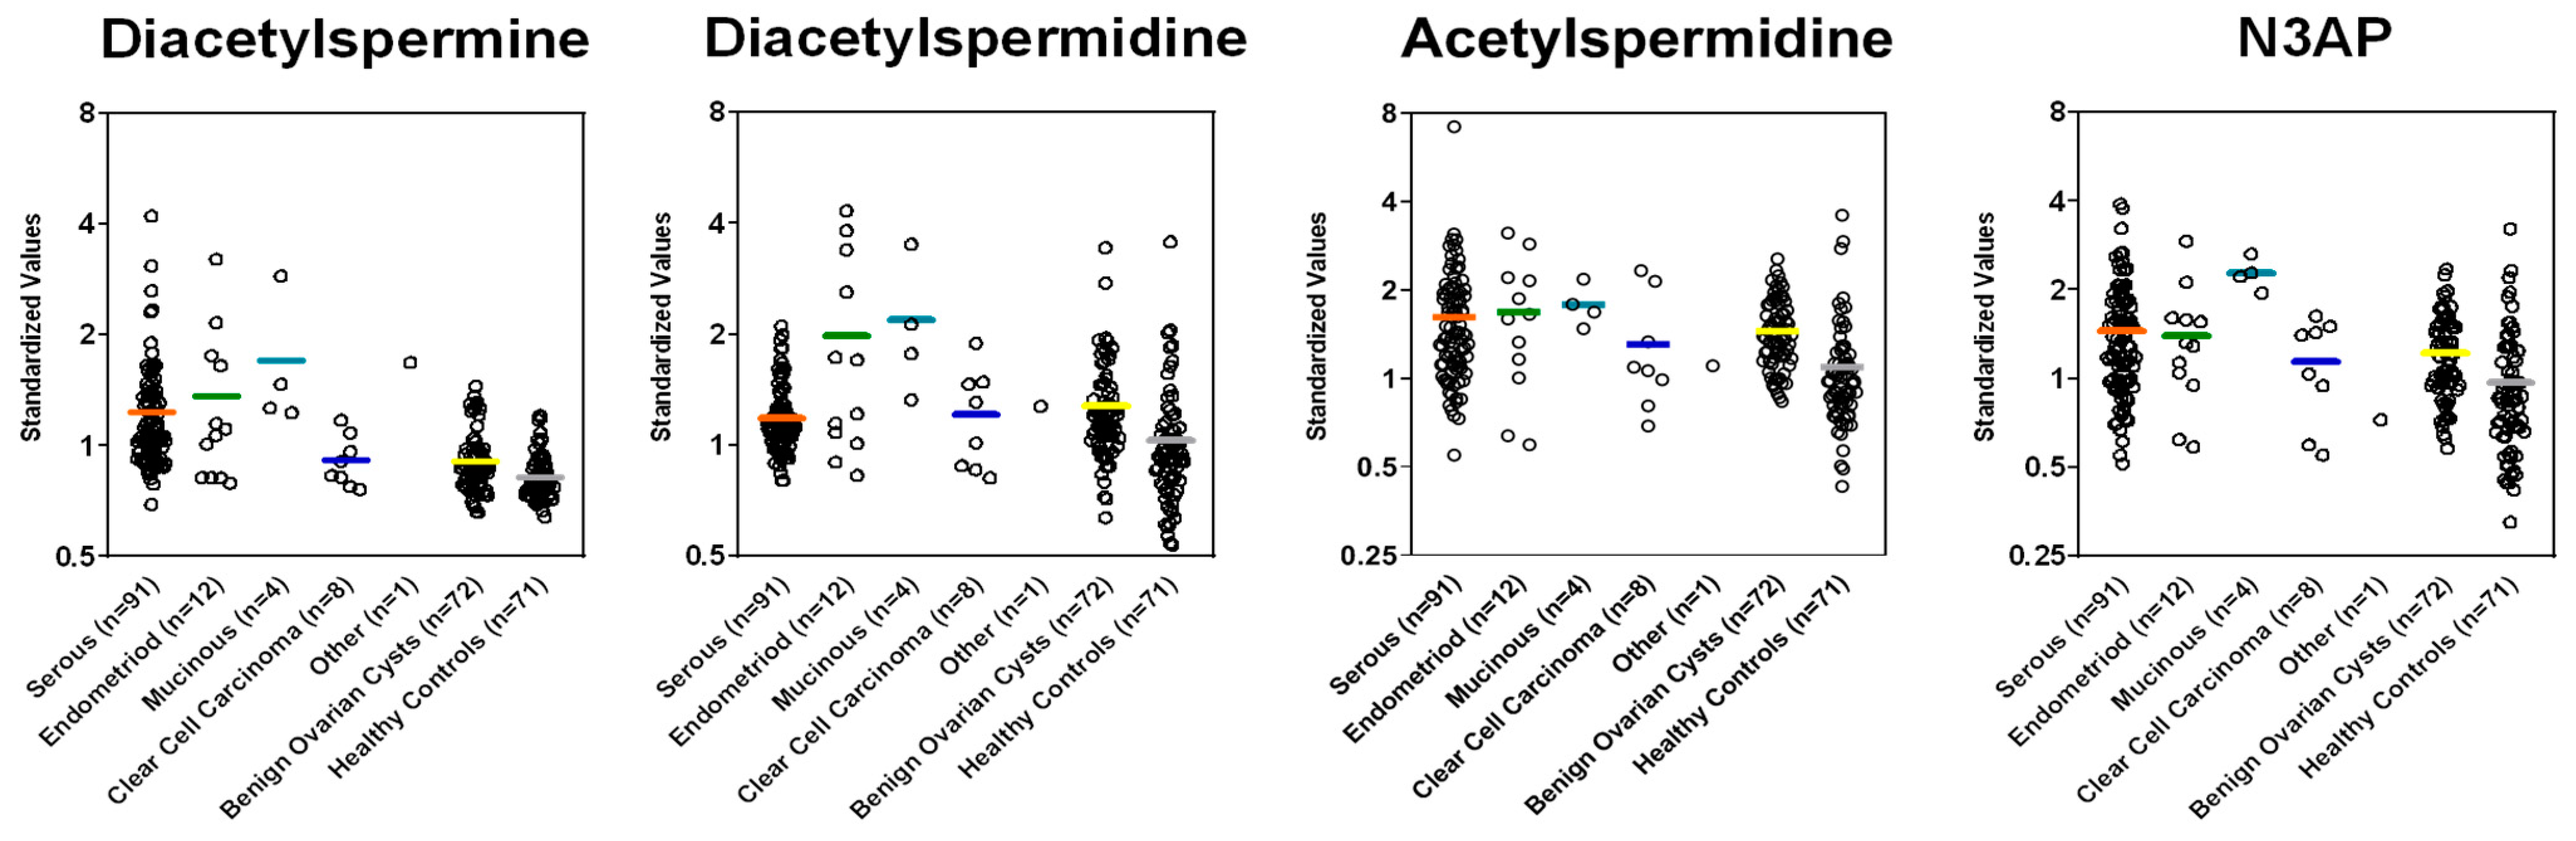
3.1. Polyamine Levels in Plasma of Ovarian Cancer Patients and Model Development
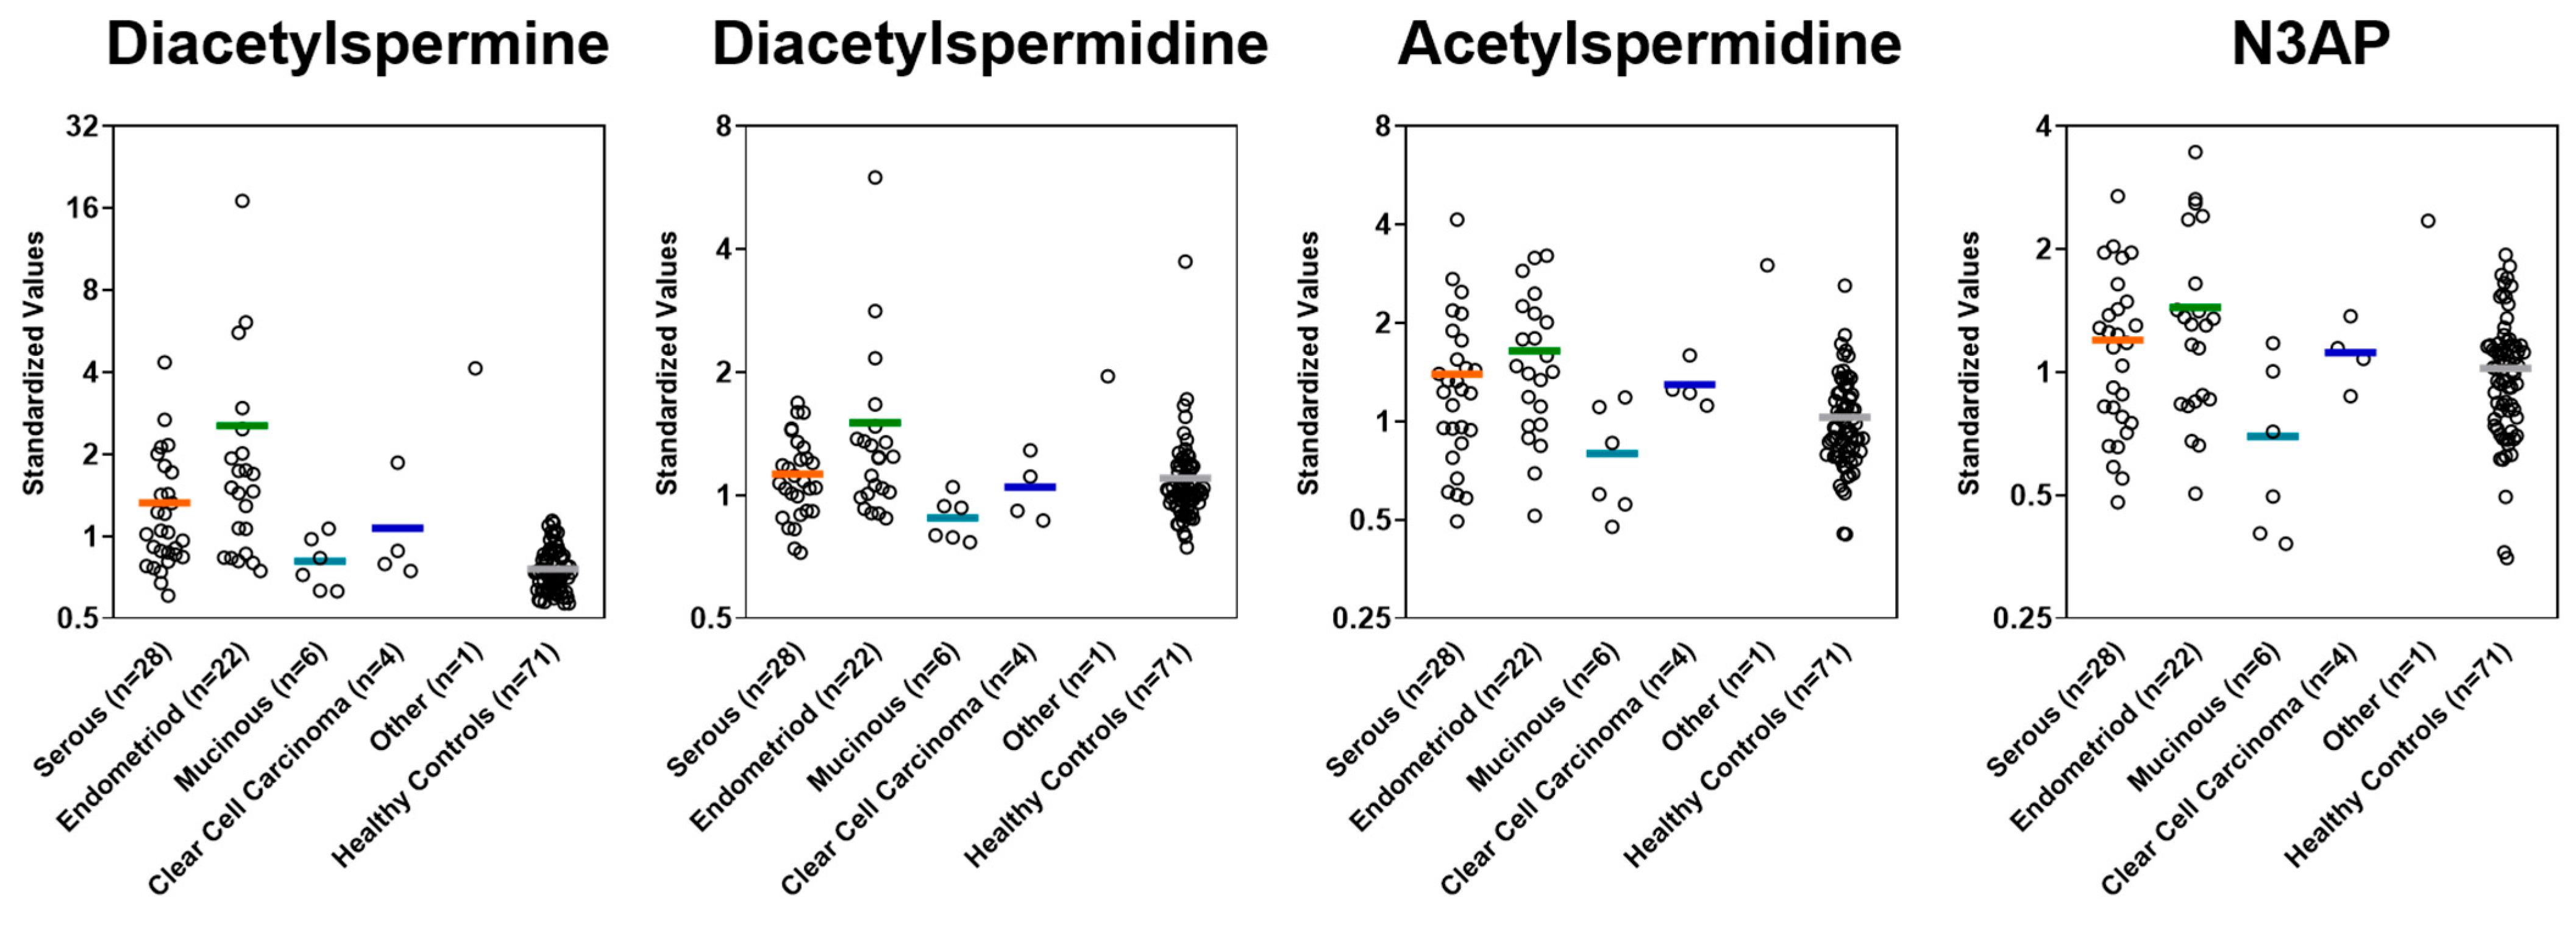
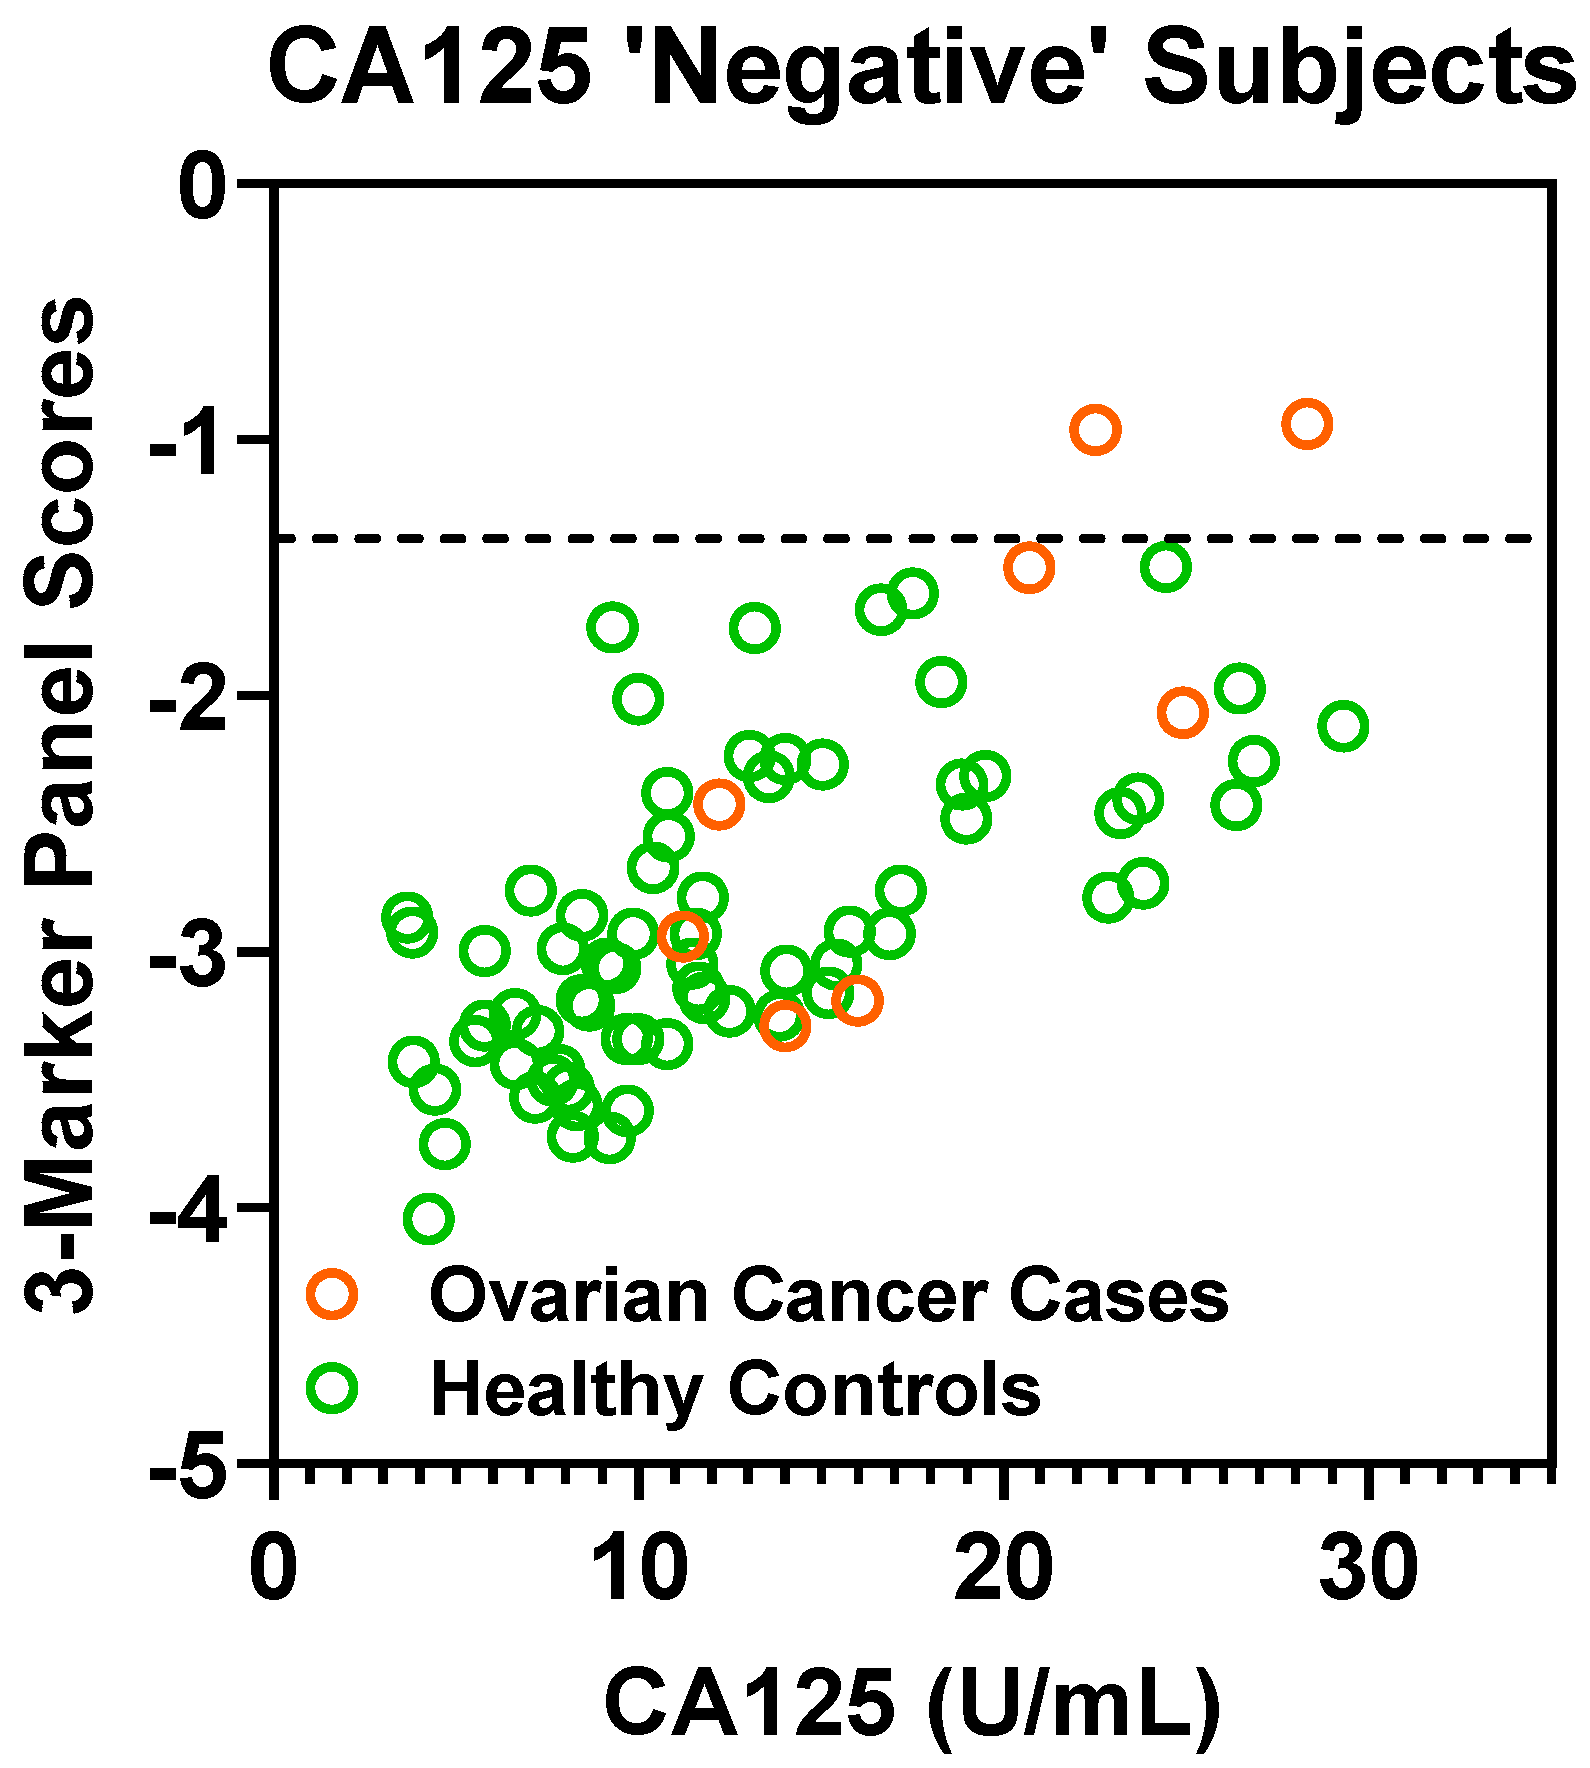
3.2. Model Validation in an Independent Cohort of Early Stage Ovarian Cancer Patients
4. Discussion
Author Contributions
Funding
Institutional Review Board Statement
Informed Consent Statement
Data Availability Statement
Conflicts of Interest
Appendix A
Appendix A.1. Metabolomics Analysis
Appendix A.2. Analysis of Polyamines
Appendix A.3. Mass Spectrometry Data Acquisition
Appendix A.4. Data Processing

| Condition | Description | Stage | GRADE | Set |
|---|---|---|---|---|
| Case | Mixed Broderline and Endometrioid Adenocarcinoma | 2A | II | Test Set |
| Case | Serous carcinoma | 2A | high | Test Set |
| Case | Clear Cell Carcinoma | 2B | high | Test Set |
| Case | Serous Carcinoma | 2B | high | Test Set |
| Case | Serous carcinoma | 2B | low | Test Set |
| Case | Serous Carcinoma | 2B | high | Test Set |
| Case | Clear Cell Carcinoma | 2C2 | high | Test Set |
| Case | Serous Carcinoma | 4B | low | Test Set |
| Case | Clear cell carcinoma | I | high | Test Set |
| Case | clear cell carcinoma (CCC) | IA | high | Test Set |
| Case | Endometrioid adenocarcinoma | IA | II | Test Set |
| Case | Endometrioid adenocarcinoma | IA | I | Test Set |
| Case | Endometrioid Adenocarcinoma | IA | II | Test Set |
| Case | Endometrioid Adenocarcinoma | IA | II | Test Set |
| Case | Endometrioid adenocarcinoma | IA | II | Test Set |
| Case | Endometrioid adenocarcinoma | IA | I | Test Set |
| Case | Mixed: endometrioid carcinoma, serous carcinoma | IA | low | Test Set |
| Case | Mucinous Adenocarcinoma | IA | n/a | Test Set |
| Case | Mucinous carcinoma | IA | I | Test Set |
| Case | Mucinous Carcinoma | IA | high | Test Set |
| Case | Transitional cell carcinoma | IA | high | Test Set |
| Case | Serous carcinoma | IA | low | Test Set |
| Case | serous carcinoma | IA | high | Test Set |
| Case | endometrioid adenocarcinoma | IB | II | Test Set |
| Case | serous carcinoma | IB | high | Test Set |
| Case | Serous Carcinoma | IB | high | Test Set |
| Case | Serous Carcinoma in background of mixed epithelial borderline tumor | IB | low | Test Set |
| Case | Clear cell carcinoma | IC | high | Test Set |
| Case | Clear Cell Carcinoma | IC | high | Test Set |
| Case | clear cell carcinoma (CCC) | IC | n/a | Test Set |
| Case | Endometrioid Adenocarcinoma | IC | II | Test Set |
| Case | Endometrioid adenocarcinoma | IC | II | Test Set |
| Case | Serous carcinoma | IC | high | Test Set |
| Case | Serous carcinoma | IC | high | Test Set |
| Case | Serous Carcinoma | IC | high | Test Set |
| Case | Clear Cell Carcinoma | IC1 | high | Test Set |
| Case | Carcinoma | IC1 | n/a | Test Set |
| Case | Serous Carcinoma | IC2 | high | Test Set |
| Case | Mixed: Serous Carcinoma & CCC | IC3 | high | Test Set |
| Case | mucinous adenocarcinoma | II | n/a | Test Set |
| Case | mixed: undifferentiated carcinoma, serous carcinoma | IIA | high | Test Set |
| Case | mixed: endometrioid carcinoma, serous carcinoma | IIB | high | Test Set |
| Case | high serous carcinoma_III | III | high | Test Set |
| Case | high serous carcinoma_III | III | high | Test Set |
| Case | high serous carcinoma_III | III | high | Test Set |
| Case | high serous carcinoma_III | III | high | Test Set |
| Case | high serous carcinoma_III | III | high | Test Set |
| Case | high serous carcinoma_III | III | high | Test Set |
| Case | high serous carcinoma_III | III | high | Test Set |
| Case | high serous carcinoma_III | III | high | Test Set |
| Case | high serous carcinoma_III | III | high | Test Set |
| Case | Serous Carcinoma | IIIA | high | Test Set |
| Case | Serous carcinoma with minor endometrioid component | IIIA | high | Test Set |
| Case | high Serous Carcinoma_IIIB | IIIB | high | Test Set |
| Case | high Serous Carcinoma_”Advanced” | IIIC | high | Test Set |
| Case | high serous carcinoma_IIIC | IIIC | high | Test Set |
| Case | high serous carcinoma_IIIC | IIIC | high | Test Set |
| Case | high serous carcinoma_IIIC | IIIC | high | Test Set |
| Case | high serous carcinoma_IIIC | IIIC | high | Test Set |
| Case | high serous carcinoma_IIIC | IIIC | high | Test Set |
| Case | high Serous Carcinoma_IIIC | IIIC | high | Test Set |
| Case | high Serous Carcinoma_IIIC | IIIC | high | Test Set |
| Case | high Serous Carcinoma_IIIC | IIIC | high | Test Set |
| Case | high Serous Carcinoma_IIIC | IIIC | high | Test Set |
| Case | high Serous Carcinoma_IIIC | IIIC | high | Test Set |
| Case | high serous carcinoma_IIII | IIIC | high | Test Set |
| Case | high serous carcinoma_IIII | IIIC | high | Test Set |
| Case | high serous carcinoma_IIII | IIIC | high | Test Set |
| Case | high serous carcinoma_IIII | IIIC | high | Test Set |
| Case | high serous carcinoma_IIII | IIIC | high | Test Set |
| Case | high serous carcinoma_IIII | IIIC | high | Test Set |
| Case | high serous carcinoma_IIII | IIIC | high | Test Set |
| Case | high serous carcinoma_IIII | IIIC | high | Test Set |
| Case | high serous carcinoma_IIII | IIIC | high | Test Set |
| Case | high serous carcinoma_IIII | IIIC | high | Test Set |
| Case | high serous carcinoma_IIII | IIIC | high | Test Set |
| Case | high serous carcinoma_IIII | IIIC | high | Test Set |
| Case | high serous carcinoma_IIII | IIIC | high | Test Set |
| Case | high serous carcinoma_IIII | IIIC | high | Test Set |
| Case | high serous carcinoma_IIII | IIIC | high | Test Set |
| Case | high serous carcinoma_IIII | IIIC | high | Test Set |
| Case | high serous carcinoma_IIII | IIIC | high | Test Set |
| Case | high serous carcinoma_IIII | IIIC | high | Test Set |
| Case | high serous carcinoma_IIII | IIIC | high | Test Set |
| Case | high serous carcinoma_IIII | IIIC | high | Test Set |
| Case | high serous carcinoma_IIII | IIIC | high | Test Set |
| Case | high serous carcinoma_IIII | IIIC | high | Test Set |
| Case | high serous carcinoma_IIII | IIIC | high | Test Set |
| Case | high serous carcinoma_IIII | IIIC | high | Test Set |
| Case | high serous carcinoma_IIII | IIIC | high | Test Set |
| Case | high serous carcinoma_IIII | IIIC | high | Test Set |
| Case | high serous carcinoma_IIII | IIIC | high | Test Set |
| Case | high serous carcinoma_IIII | IIIC | high | Test Set |
| Case | high serous carcinoma_IIII | IIIC | high | Test Set |
| Case | high serous carcinoma_IIII | IIIC | high | Test Set |
| Case | high serous carcinoma_IIII | IIIC | high | Test Set |
| Case | high serous carcinoma_IIII | IIIC | high | Test Set |
| Case | high serous carcinoma_IIII | IIIC | high | Test Set |
| Case | high serous carcinoma_IIII | IIIC | high | Test Set |
| Case | high serous carcinoma_IIII | IIIC | high | Test Set |
| Case | high serous carcinoma_IIII | IIIC | high | Test Set |
| Case | high serous carcinoma_IIII | IIIC | high | Test Set |
| Case | high serous carcinoma_IIII | IIIC | high | Test Set |
| Case | high serous carcinoma_IIII | IIIC | high | Test Set |
| Case | high serous carcinoma_IIII | IIIC | high | Test Set |
| Case | high serous carcinoma_IIII | IIIC | high | Test Set |
| Case | high serous carcinoma_IV | IV | high | Test Set |
| Case | high serous carcinoma_IV | IV | high | Test Set |
| Case | high serous carcinoma_IV | IV | high | Test Set |
| Case | high serous carcinoma_IV | IV | high | Test Set |
| Case | high serous carcinoma_IV | IV | high | Test Set |
| Case | high serous carcinoma_IV | IV | high | Test Set |
| Case | high serous carcinoma_IV | IV | high | Test Set |
| Case | high serous carcinoma_IV | IV | high | Test Set |
| Case | high serous carcinoma_IV | IV | high | Test Set |
| Case | high Serous Carcinoma_IV | IV | high | Test Set |
| Case | serous carcinoma | I | high | Validation Set |
| Case | endometrioid adenocarcinoma | I | I | Validation Set |
| Case | mixed: endometrioid carcinoma, serous borderline tumor | I | II | Validation Set |
| Case | Serous Carcinoma | I | high | Validation Set |
| Case | serous carcinoma | I | high | Validation Set |
| Case | endometrioid adenocarcinoma | I | I | Validation Set |
| Case | Endometrioid Adenocarcinoma | IA | II | Validation Set |
| Case | serous carcinoma | IA | high | Validation Set |
| Case | mixed: endometrioid adenocarcinoma, clear cell carcinoma (CCC) | IA | high | Validation Set |
| Case | endometrioid adenocarcinoma | IA | I | Validation Set |
| Case | mucinous adenocarcinoma | IA | n/a | Validation Set |
| Case | Serous Mucinous Carcinoma | IA | n/a | Validation Set |
| Case | Serous Carcinoma | IA | high | Validation Set |
| Case | serous carcinoma | IA | high | Validation Set |
| Case | mucinous adenocarcinoma | IA | II | Validation Set |
| Case | Endometrioid Adenocarcinoma, Mucinous Carcinoma, Clear Cell Carcinoma | IA | Mixed high and low | Validation Set |
| Case | mixed: papillary serous carcinoma, endometrioid carcinoma | IA | high | Validation Set |
| Case | clear cell carcinoma (CCC) | IA | high | Validation Set |
| Case | endometrioid adenocarcinoma | IA | high | Validation Set |
| Case | serous adenocarcinoma | IA | high | Validation Set |
| Case | serous carcinoma | IA | high | Validation Set |
| Case | clear cell carcinoma (CCC) | IA | high | Validation Set |
| Case | endometrioid adenocarcinoma | IB | II | Validation Set |
| Case | carcinoma | IB | high | Validation Set |
| Case | Mixed Serous and Endometrioid Carcinoma | IC | high | Validation Set |
| Case | endometrioid adenocarcinoma | IC | II | Validation Set |
| Case | endometrioid adenocarcinoma | IC | II | Validation Set |
| Case | endometrioid adenocarcinoma | IC | III | Validation Set |
| Case | Clear Cell Carcinoma | IC | high | Validation Set |
| Case | endometrioid adenocarcinoma | IC | I | Validation Set |
| Case | mixed: endometrioid carcinoma, ovarian carcinoma, peritoneal carcinoma | IC | II | Validation Set |
| Case | mucinous carcinoma | IC | low | Validation Set |
| Case | serous carcinoma | IC | low | Validation Set |
| Case | serous carcinoma | IC | high | Validation Set |
| Case | mixed: endometrioid carcinoma, clear cell carcinoma (CCC) | IC | high | Validation Set |
| Case | mucinous adenocarcinoma | IC | I | Validation Set |
| Case | mucinous carcinoma | IC | n/a | Validation Set |
| Case | Mucinous Carcinoma | IC | II | Validation Set |
| Case | endometrioid adenocarcinoma | II | II | Validation Set |
| Case | Endometroid Adenocarcinoma | II | n/a | Validation Set |
| Case | mixed: transitional carcinoma, squamous cell carcinoma | II | high | Validation Set |
| Case | Serous Carcinoma | II | high | Validation Set |
| Case | serous carcinoma | IIA | high | Validation Set |
| Case | endometrioid adenocarcinoma | IIA | III | Validation Set |
| Case | Serous Carcinoma | IIA | High | Validation Set |
| Case | mixed: undifferentiated carcinoma, serous carcinoma | IIA | high | Validation Set |
| Case | mixed: endometrioid carcinoma, serous carcinoma | IIB | high | Validation Set |
| Case | Serous Carcinoma, Adenocarcinoma | IIB | High | Validation Set |
| Case | endometrioid adenocarcinoma | IIB | II | Validation Set |
| Case | serous carcinoma | IIB | low | Validation Set |
| Case | mixed: serous carcinoma, endometrioid carcinoma | IIB | high | Validation Set |
| Case | serous carcinoma | IIB | high | Validation Set |
| Case | mixed: mucinous endometrioid carcinoma, clear cell carcinoma (CCC) | IIB | high | Validation Set |
| Case | serous carcinoma | IIB | high | Validation Set |
| Case | Serous Carcinoma | IIB | high | Validation Set |
| Case | Serous Carcinoma | IIB | high | Validation Set |
| Case | serous carcinoma | IIB | high | Validation Set |
| Case | serous carcinoma | IIC | high | Validation Set |
| Case | Serous Carcinoma | IIC | high | Validation Set |
| Case | Clear Cell Carcinoma | IIC | n/a | Validation Set |
| Case | Serous Carcinoma | IIC | Low | Validation Set |
| Benign Pelvic Mass | Serous adenofibroma | - | - | Test Set |
| Benign Pelvic Mass | Serous Cystadoma | - | - | Test Set |
| Benign Pelvic Mass | Mucinous Cystadenoma | - | - | Test Set |
| Benign Pelvic Mass | Mucinous Cystadenofribroma | - | - | Test Set |
| Benign Pelvic Mass | Endometriotic Cyst | - | - | Test Set |
| Benign Pelvic Mass | mucinous neoplasm | - | - | Test Set |
| Benign Pelvic Mass | serous cystadenomas | - | - | Test Set |
| Benign Pelvic Mass | Fibroma | - | - | Test Set |
| Benign Pelvic Mass | serous cystadenofibroma | - | - | Test Set |
| Benign Pelvic Mass | serous cystadenoma | - | - | Test Set |
| Benign Pelvic Mass | Mucinous Cystadenoma | - | - | Test Set |
| Benign Pelvic Mass | Fibroma | - | - | Test Set |
| Benign Pelvic Mass | Serous cystadenoma | - | - | Test Set |
| Benign Pelvic Mass | Cyst & Rete Cystadonoma | - | - | Test Set |
| Benign Pelvic Mass | Peritoneal Inclusion Cysts, Follicular Cysts, Corpus Luteal Cysts | - | - | Test Set |
| Benign Pelvic Mass | serous cystadenofibroma | - | - | Test Set |
| Benign Pelvic Mass | endometrioma, endometriosis | - | - | Test Set |
| Benign Pelvic Mass | cystadenoma and severe pelvic adhesive disease | - | - | Test Set |
| Benign Pelvic Mass | cystadenofibroma | - | - | Test Set |
| Benign Pelvic Mass | Endometriotic cyst | - | - | Test Set |
| Benign Pelvic Mass | cyst | - | - | Test Set |
| Benign Pelvic Mass | ovarian mass | - | - | Test Set |
| Benign Pelvic Mass | Mucinous Cystadenoma | - | - | Test Set |
| Benign Pelvic Mass | mucinous cystadenoma | - | - | Test Set |
| Benign Pelvic Mass | fibroma, cysts | - | - | Test Set |
| Benign Pelvic Mass | mucinous cystadenoma | - | - | Test Set |
| Benign Pelvic Mass | mucinous cystadenoma, intestinal | - | - | Test Set |
| Benign Pelvic Mass | Mucinous cystadenoma | - | - | Test Set |
| Benign Pelvic Mass | bilateral endometriomas | - | - | Test Set |
| Benign Pelvic Mass | Mucinous Cystadenoma | - | - | Test Set |
| Benign Pelvic Mass | Endometriotic Cyst | - | - | Test Set |
| Benign Pelvic Mass | cyst | - | - | Test Set |
| Benign Pelvic Mass | cystadenoma | - | - | Test Set |
| Benign Pelvic Mass | Mucinous cystadenoma | - | - | Test Set |
| Benign Pelvic Mass | cyst | - | - | Test Set |
| Benign Pelvic Mass | Endometriotic cyst | - | - | Test Set |
| Benign Pelvic Mass | Cysts | - | - | Test Set |
| Benign Pelvic Mass | serous ovarian cystadenofibroma of LOV | - | - | Test Set |
| Benign Pelvic Mass | benign mass | - | - | Test Set |
| Benign Pelvic Mass | Luteal Cyst | - | - | Test Set |
| Benign Pelvic Mass | mucinous cystadenoma | - | - | Test Set |
| Benign Pelvic Mass | serous cystadenoma | - | - | Test Set |
| Benign Pelvic Mass | Serous Cystadenofibroma | - | - | Test Set |
| Benign Pelvic Mass | Serous Cystadenofibroma | - | - | Test Set |
| Benign Pelvic Mass | serous cyst | - | - | Test Set |
| Benign Pelvic Mass | cystadenoma | - | - | Test Set |
| Benign Pelvic Mass | Mucinous Cystadenofribroma | - | - | Test Set |
| Benign Pelvic Mass | mucinous cystadenoma | - | - | Test Set |
| Benign Pelvic Mass | serous cystadenoma | - | - | Test Set |
| Benign Pelvic Mass | Cysts | - | - | Test Set |
| Benign Pelvic Mass | mucinous cystadenoma | - | - | Test Set |
| Benign Pelvic Mass | endometrioma | - | - | Test Set |
| Benign Pelvic Mass | Fibroma | - | - | Test Set |
| Benign Pelvic Mass | Sertoli-Leydig cell | - | - | Test Set |
| Benign Pelvic Mass | serous cystadenofibroma | - | - | Test Set |
| Benign Pelvic Mass | endometrioisis, atypia | - | - | Test Set |
| Benign Pelvic Mass | mucinous cystadenoma | - | - | Test Set |
| Benign Pelvic Mass | Benign Luteal Cyst | - | - | Test Set |
| Benign Pelvic Mass | Endometriosis | - | - | Test Set |
| Benign Pelvic Mass | Cystadenofibroma | - | - | Test Set |
| Benign Pelvic Mass | Cyst | - | - | Test Set |
| Benign Pelvic Mass | cysts | - | - | Test Set |
| Benign Pelvic Mass | (LOV) fibroma | - | - | Test Set |
| Benign Pelvic Mass | endometrioic cysts | - | - | Test Set |
| Benign Pelvic Mass | serous cystadenofibroma | - | - | Test Set |
| Benign Pelvic Mass | Serous Cystadenofibroma | - | - | Test Set |
| Benign Pelvic Mass | Mucinous Cystadenona | - | - | Test Set |
| Benign Pelvic Mass | Mucinous Cystadenoma | - | - | Test Set |
| Benign Pelvic Mass | corpus albicanocyst, fibrosis | - | - | Test Set |
| Benign Pelvic Mass | fibroma | - | - | Test Set |
| Benign Pelvic Mass | brenner tumor | - | - | Test Set |
| Benign Pelvic Mass | fibrothecoma of ROV | - | - | Test Set |
| Metabolite | Adduct | m/z | Retention Time (min) | Assay † |
|---|---|---|---|---|
| Acetylspermidine | [M + H] + | 188.1751 | 3.85 | P_HA |
| Diacetylspermidine | [M + H] + | 230.1858 | 3.11 | P_HA |
| Diacetylspermine | [M + H] + | 287.2418 | 3.72 | P_HA |
| N-(3-acetamidopropyl)pyrrolidin-2-one | [M + H] + | 185.1277 | 2.12 | P_CA |
| Coefficient of Variation Values for Measured Polyamines | Coefficient of Variation (CV) Values | |||||
|---|---|---|---|---|---|---|
| Test Set | Validation Set | |||||
| Batch 1 | Batch 2 | Batch 3 | ||||
| HQC | PQC | HQC | PQC | HQC | PQC | |
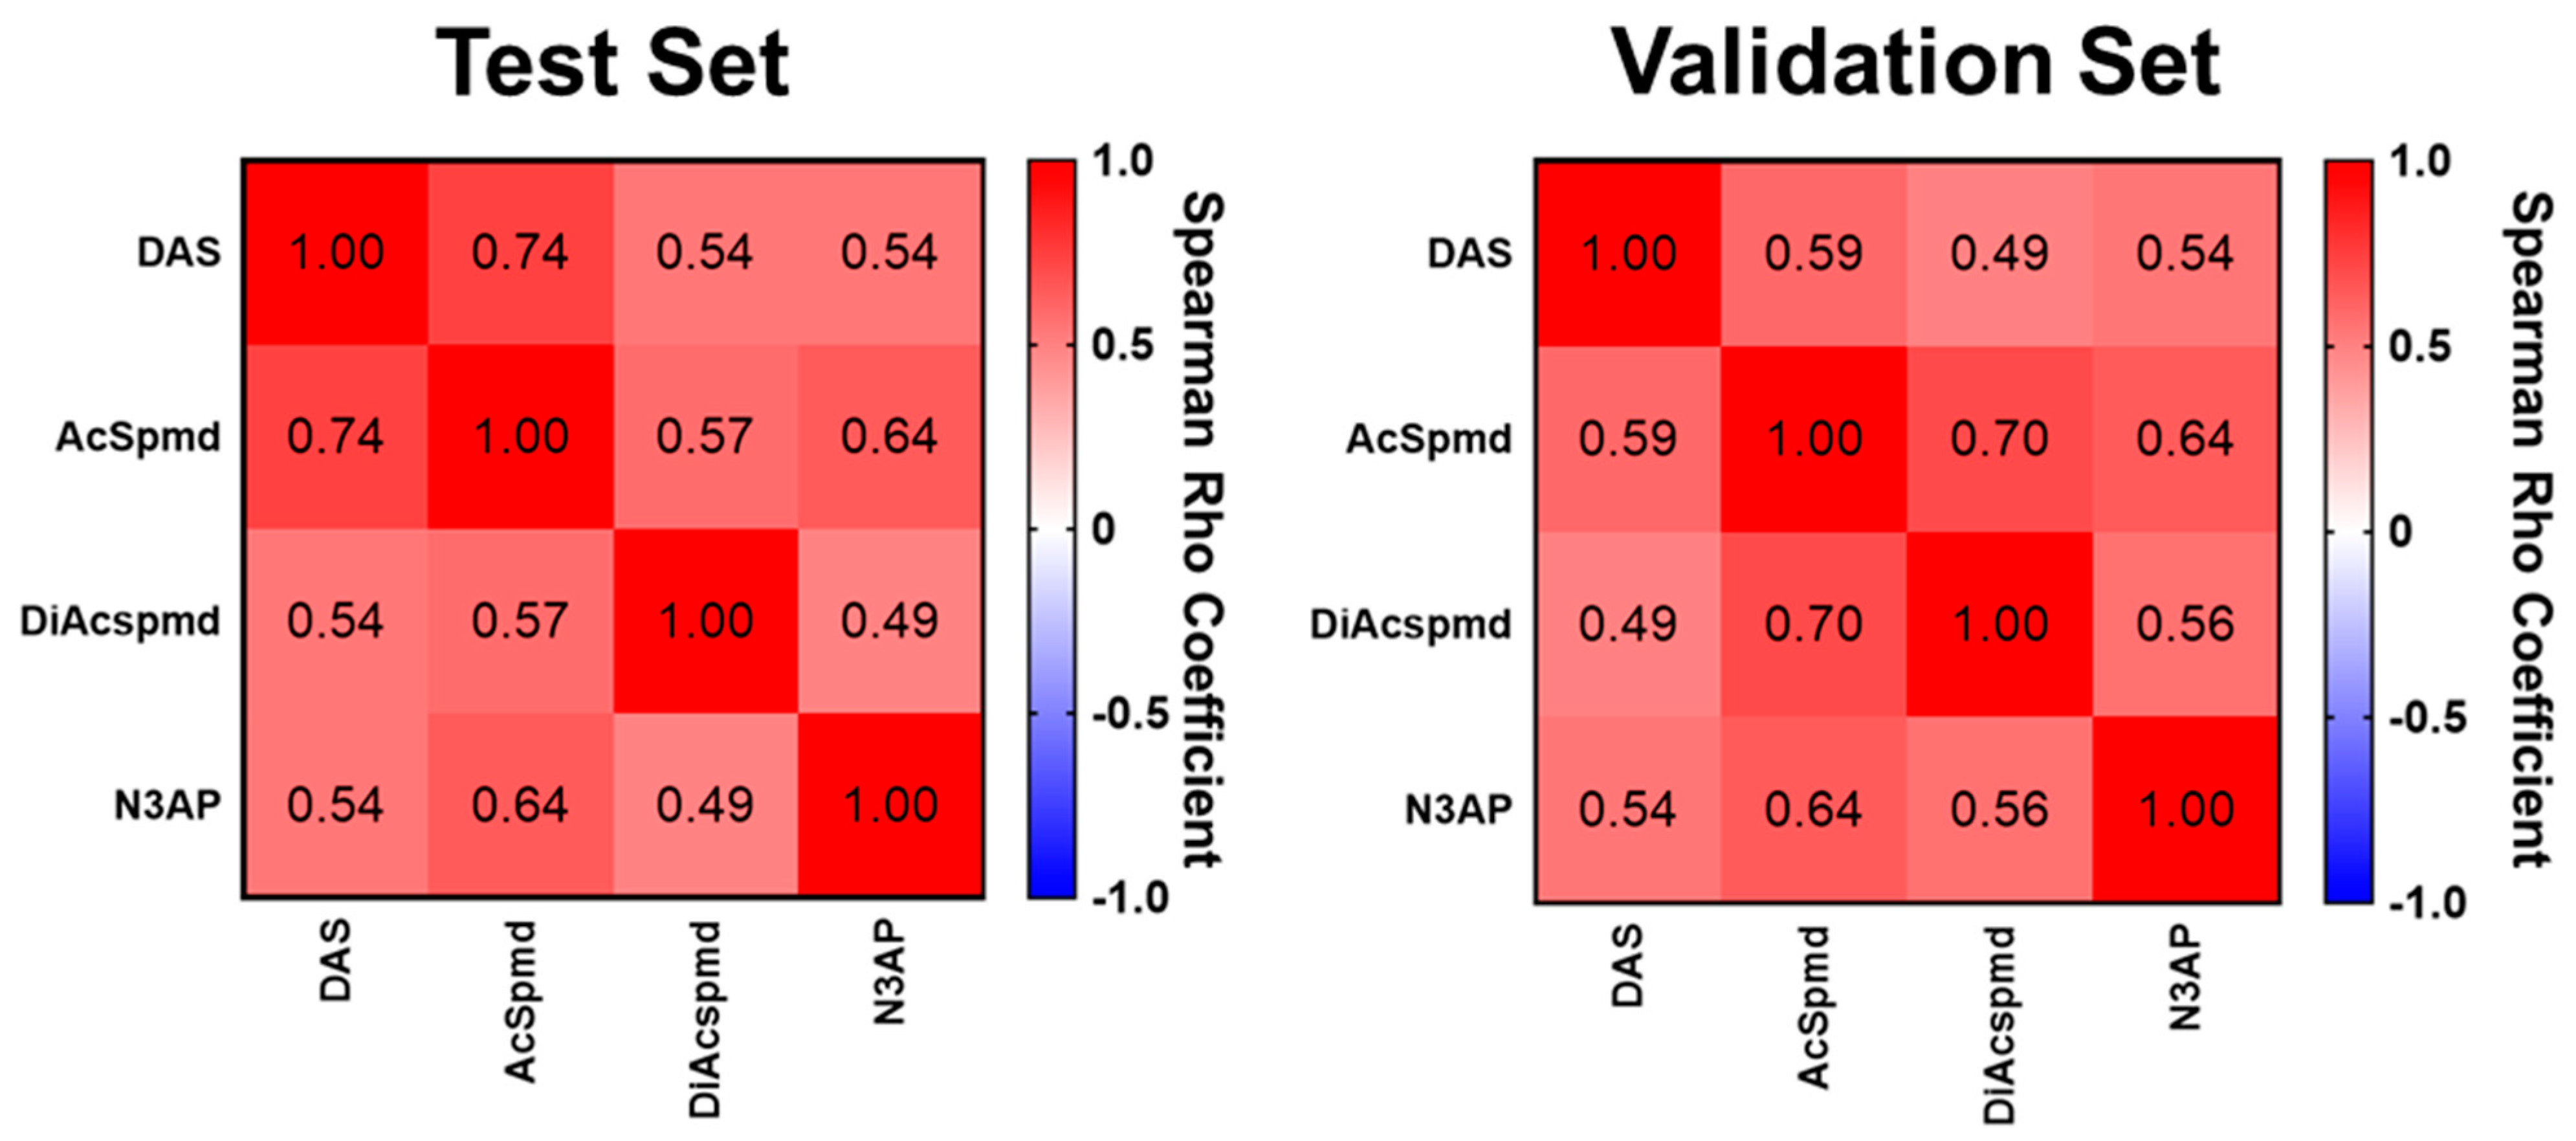
| DAS | 21.26 | 4.52 | 5.57 | 3.25 | 11.68 | 5.29 |
| AcSpmd | 4.61 | 3.25 | 5.19 | 2.02 | 21.29 | 2.58 |
| DiAcspmd | 6.56 | 6.66 | 5.61 | 4.08 | 15.21 | 4.86 |
| N3AP | 5.61 | 2.96 | 3.64 | 4.74 | 3.5 | 1.85 |
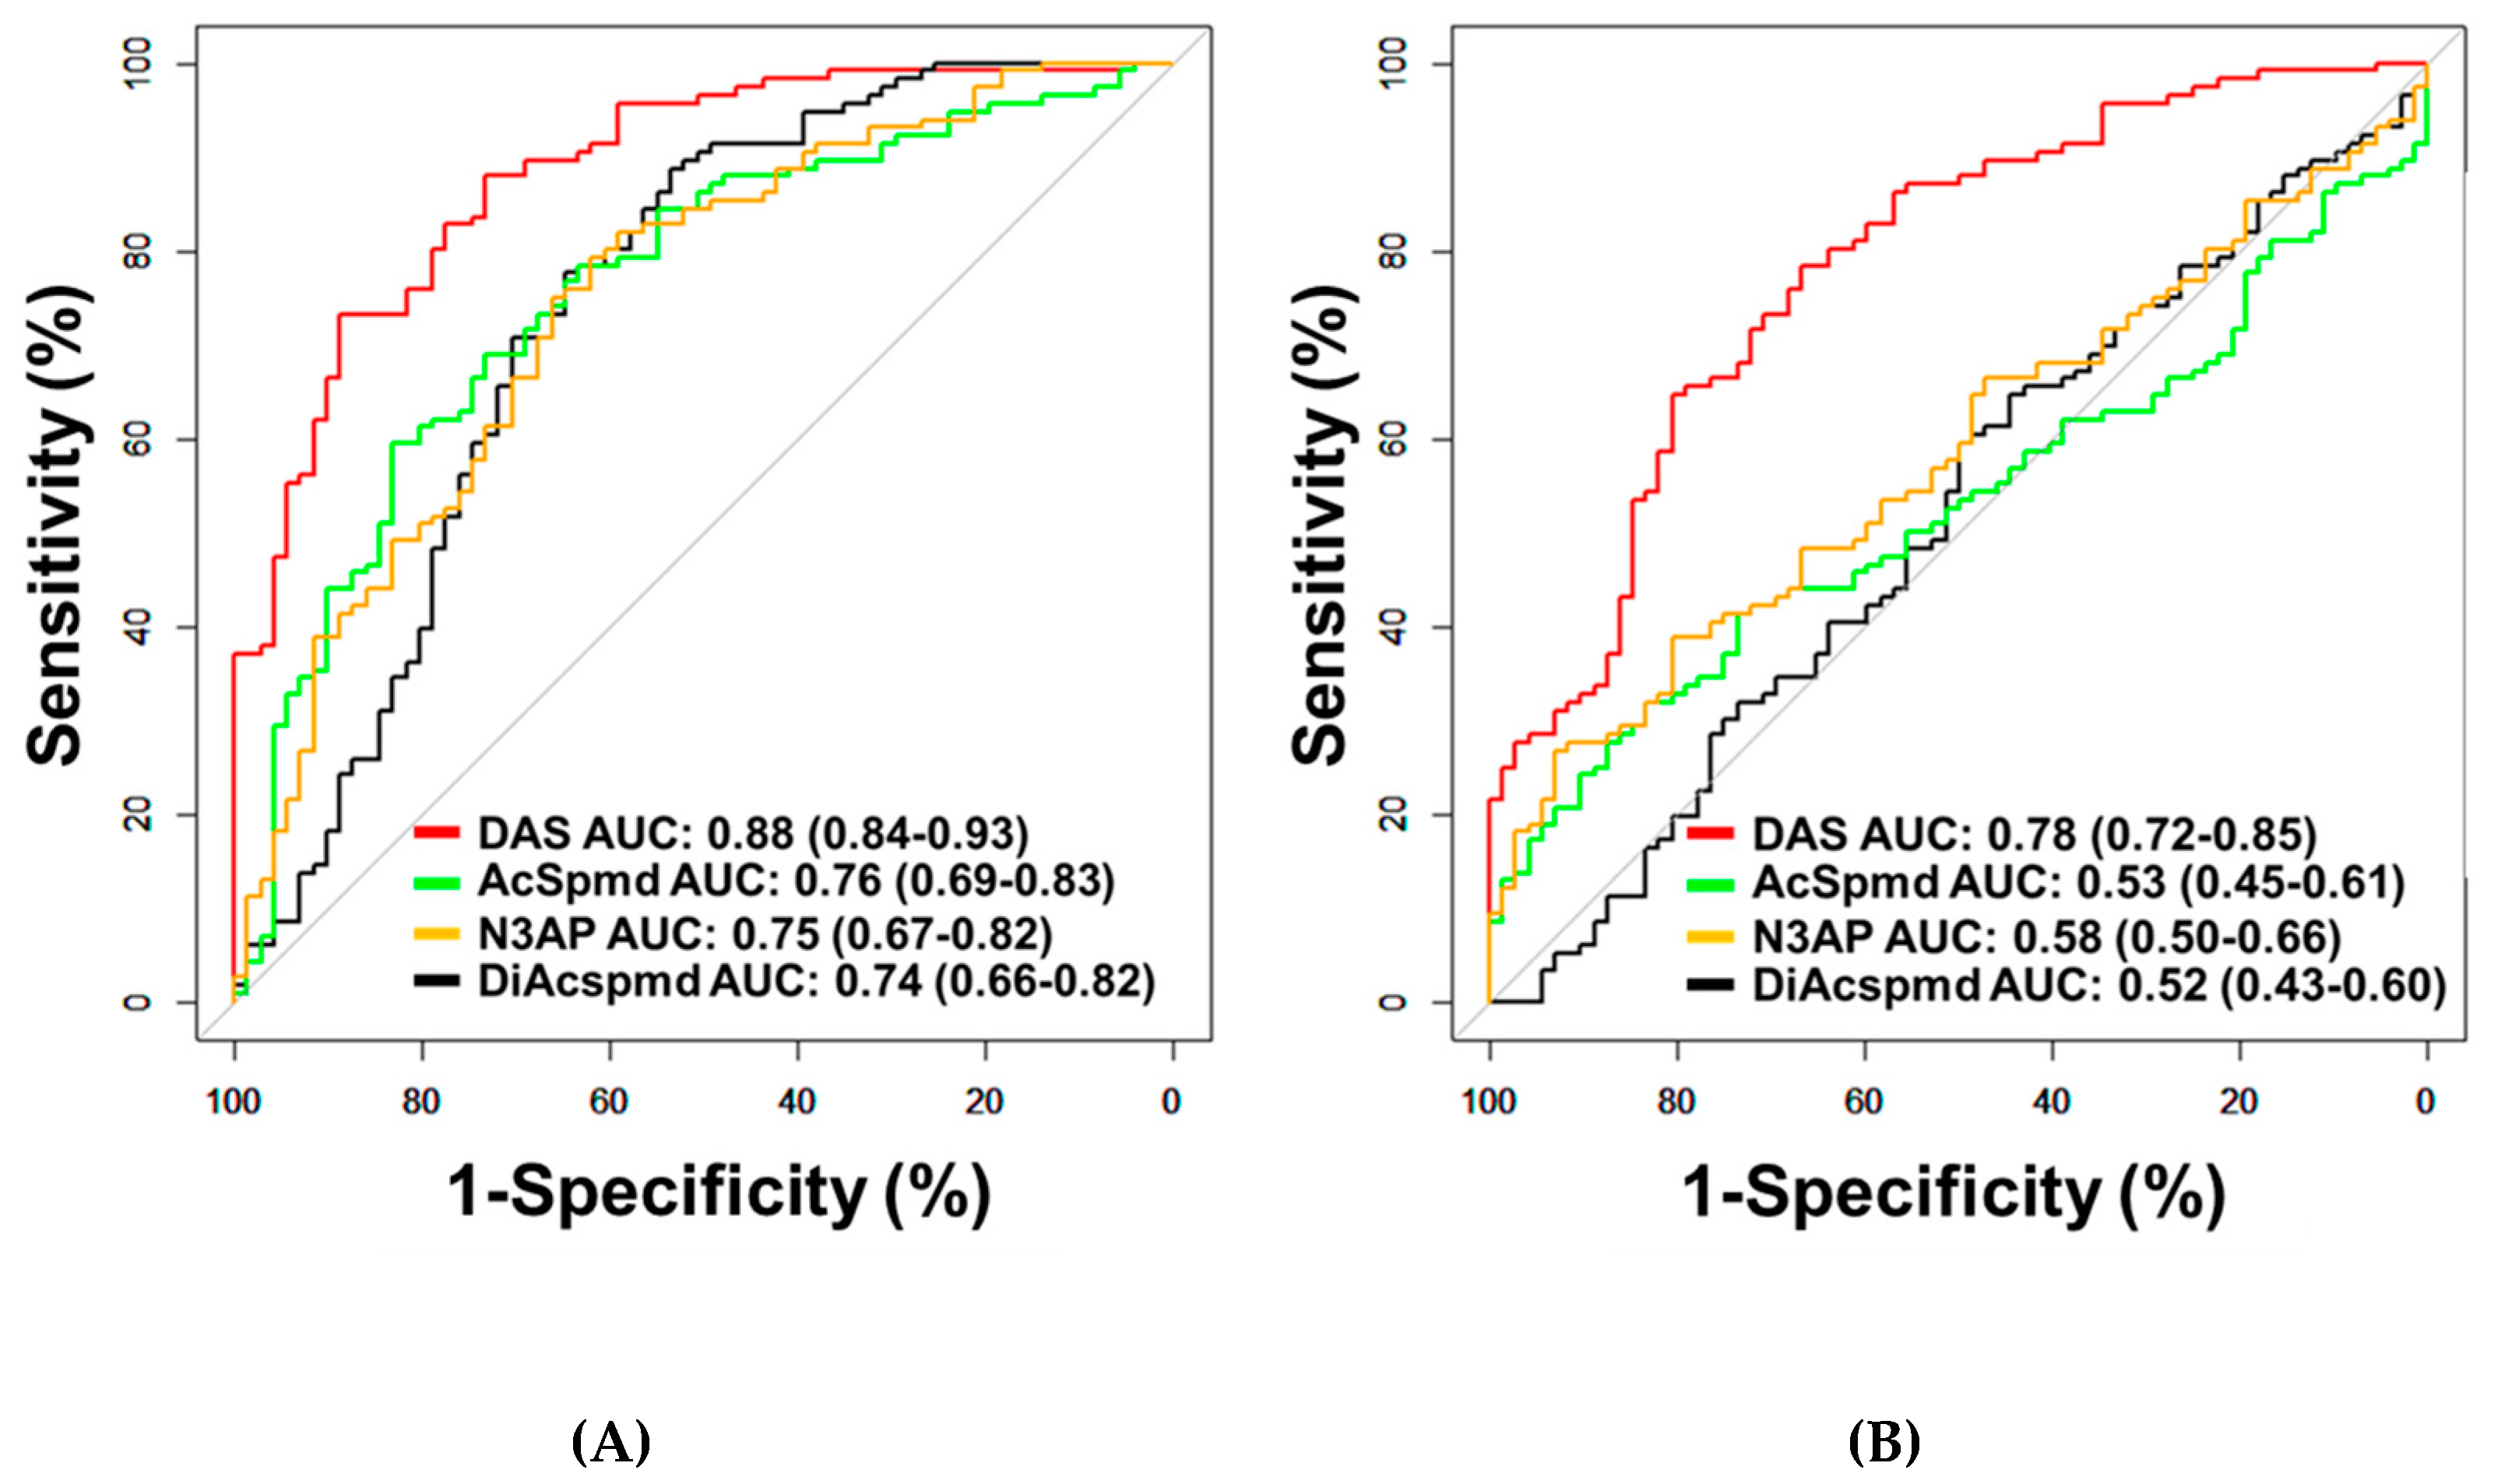
| All OvCa Cases (n = 116) vs. Healthy Controls (n = 71) | Early Stage OvCa Cases (n = 41) vs. Healthy Controls (n = 71) | Late Stage OvCa Cases (n = 75) vs. Healthy Controls (n = 71) | |||||||||||||
| Metabolite | AUC | 95% CI | p † | Sens @ 95% Spec | Spec @ 95% Sens | AUC | 95% CI | p † | Sens @ 95% Spec | Spec @ 95% Sens | AUC | 95% CI | p † | Sens @ 95% Spec | Spec @ 95% Sens |
| Diacetylspermine | 0.88 | 0.84–0.93 | <0.001 | 47.4 | 59.2 | 0.82 | 0.74–0.90 | <0.001 | 43.9 | 43.7 | 0.92 | 0.88–0.96 | <0.001 | 49.3 | 73.2 |
| Diacetylspermidine | 0.74 | 0.66–0.82 | <0.001 | 8.6 | 35.2 | 0.76 | 0.67–0.85 | <0.001 | 22.0 | 31.0 | 0.73 | 0.64–0.82 | <0.001 | 1.3 | 50.7 |
| Acetylspermidine | 0.76 | 0.69–0.83 | <0.001 | 29.3 | 19.7 | 0.70 | 0.59–0.81 | <0.001 | 29.3 | 5.6 | 0.79 | 0.72–0.87 | <0.001 | 29.3 | 38.0 |
| N3AP | 0.75 | 0.67–0.82 | <0.001 | 18.1 | 21.1 | 0.72 | 0.62–0.82 | <0.001 | 19.5 | 21.1 | 0.76 | 0.69–0.84 | <0.001 | 17.3 | 32.4 |
| All OvCa Cases (n = 116) vs. Subjects with Benign Cysts (n = 72) | Early Stage OvCa Cases (n = 41) vs. Subjects with Benign Cysts (n = 72) | Late Stage OvCa Cases (n = 75) vs. Subjects with Benign Cysts (n = 72) | |||||||||||||
| Metabolite | AUC | 95% CI | p † | Sens @ 95% Spec | Spec @ 95% Sens | AUC | 95% CI | p † | Sens @ 95% Spec | Spec @ 95% Sens | AUC | 95% CI | p † | Sens @ 95% Spec | Spec @ 95% Sens |
| Diacetylspermine | 0.78 | 0.72–0.85 | <0.001 | 28.4 | 34.7 | 0.70 | 0.60–0.81 | < 0.001 | 24.4 | 22.2 | 0.83 | 0.76–0.89 | <0.001 | 30.7 | 56.9 |
| Diacetylspermidine | 0.52 | 0.43–0.60 | 0.73 | 0 | 2.8 | 0.58 | 0.46–0.70 | 0.17 | 17.1 | 5.6 | 0.57 | 0.47–0.66 | 0.17 | 0 | 18.1 |
| Acetylspermidine | 0.53 | 0.45–0.61 | 0.50 | 17.2 | 0 | 0.50 | 0.38–0.63 | 0.98 | 22.0 | 0 | 0.55 | 0.45–0.64 | 0.33 | 16.0 | 2.8 |
| N3AP | 0.58 | 0.50–0.66 | 0.06 | 19.0 | 1.4 | 0.55 | 0.43–0.67 | 0.38 | 22.0 | 1.4 | 0.60 | 0.51–0.69 | 0.04 | 17.3 | 5.6 |
| All Serous Cases (n = 91) vs. Healthy Controls (n = 71) | All Serous Cases (n = 91) vs. Subjects with Benign Cysts (n = 72) | |||||||||
| Metabolite | AUC | 95% CI | p † | Sens @ 95% Spec | Spec @ 95% Sens | AUC | 95% CI | p † | Sens @ 95% Spec | Spec @ 95% Sens |
| Diacetylspermine | 0.9 | 0.85–0.95 | <0.001 | 47.3 | 69 | 0.8 | 0.74–0.87 | <0.001 | 28.6 | 47.2 |
| Diacetylspermidine | 0.73 | 0.64–0.81 | <0.001 | 3.3 | 39.4 | 0.55 | 0.46–0.64 | 0.28 | 0 | 9.7 |
| Acetylspermidine | 0.77 | 0.69–0.84 | <0.001 | 29.7 | 23.9 | 0.53 | 0.44–0.62 | 0.5 | 16.5 | 0 |
| N3AP | 0.75 | 0.68–0.83 | <0.001 | 17.6 | 32.4 | 0.58 | 0.50–0.67 | 0.07 | 17.6 | 5.6 |
| Early Stage Serous Cases (n = 16) vs. Healthy Controls (n = 71) | Early Stage Serous Cases (n = 16) vs. Subjects with Benign Disease (n = 72) | |||||||||
| Metabolite | AUC | 95% CI | p † | Sens @ 95% Spec | Spec @ 95% Sens | AUC | 95% CI | p † | Sens @ 95% Spec | Spec @ 95% Sens |
| Diacetylspermine | 0.81 | 0.69–0.94 | <0.001 | 37.5 | 4.2 | 0.7 | 0.56–0.84 | 0.01 | 18.8 | 5.6 |
| Diacetylspermidine | 0.74 | 0.62–0.87 | 0.003 | 12.5 | 25.4 | 0.47 | 0.30–0.64 | 0.74 | 0 | 2.8 |
| Acetylspermidine | 0.66 | 0.49–0.83 | 0.049 | 31.3 | 4.2 | 0.54 | 0.34–0.75 | 0.58 | 31.3 | 0 |
| N3AP | 0.7 | 0.56–0.84 | 0.01 | 18.8 | 18.3 | 0.51 | 0.34–0.68 | 0.94 | 18.8 | 0 |
| Late Stage Serous Cases (n = 75) vs. Healthy Controls (n = 71) | Late Stage Serous Cases (n = 75) vs. Subjects with Benign Disease (n = 72) | |||||||||
| Metabolite | AUC | 95% CI | p † | Sens @ 95% Spec | Spec @ 95% Sens | AUC | 95% CI | p † | Sens @ 95% Spec | Spec @ 95% Sens |
| Diacetylspermine | 0.92 | 0.88–0.96 | <0.001 | 49.3 | 73.2 | 0.83 | 0.76–0.89 | <0.001 | 30.7 | 56.9 |
| Diacetylspermidine | 0.73 | 0.64–0.82 | <0.001 | 1.3 | 50.7 | 0.57 | 0.47–0.66 | 0.17 | 0 | 18.1 |
| Acetylspermidine | 0.79 | 0.72–0.87 | <0.001 | 29.3 | 38 | 0.55 | 0.45–0.64 | 0.33 | 16 | 2.8 |
| N3AP | 0.76 | 0.69–0.84 | <0.001 | 17.3 | 32.4 | 0.6 | 0.51–0.69 | 0.04 | 17.3 | 5.6 |
| Non-Serous Cases (n = 25) vs. Healthy Controls (n = 71) | Non-Serous Cases (n = 25) vs. Subjects with Benign Disease (n = 72) | |||||||||
| Metabolite | AUC | 95% CI | p † | Sens @ 95% Spec | Spec @ 95% Sens | AUC | 95% CI | p † | Sens @ 95% Spec | Spec @ 95% Sens |
| Diacetylspermine | 0.83 | 0.73–0.92 | <0.001 | 48 | 43.7 | 0.71 | 0.58–0.83 | 0.002 | 28 | 22.2 |
| Diacetylspermidine | 0.77 | 0.67–0.88 | <0.001 | 28,0 | 31 | 0.61 | 0.46–0.76 | 0.1 | 24 | 5.6 |
| Acetylspermidine | 0.72 | 0.59–0.85 | 0.001 | 28 | 5.6 | 0.53 | 0.37–0.68 | 0.71 | 20 | 0 |
| N3AP | 0.73 | 0.61–0.85 | <0.001 | 20 | 21.1 | 0.58 | 0.43–0.73 | 0.25 | 24 | 1.4 |
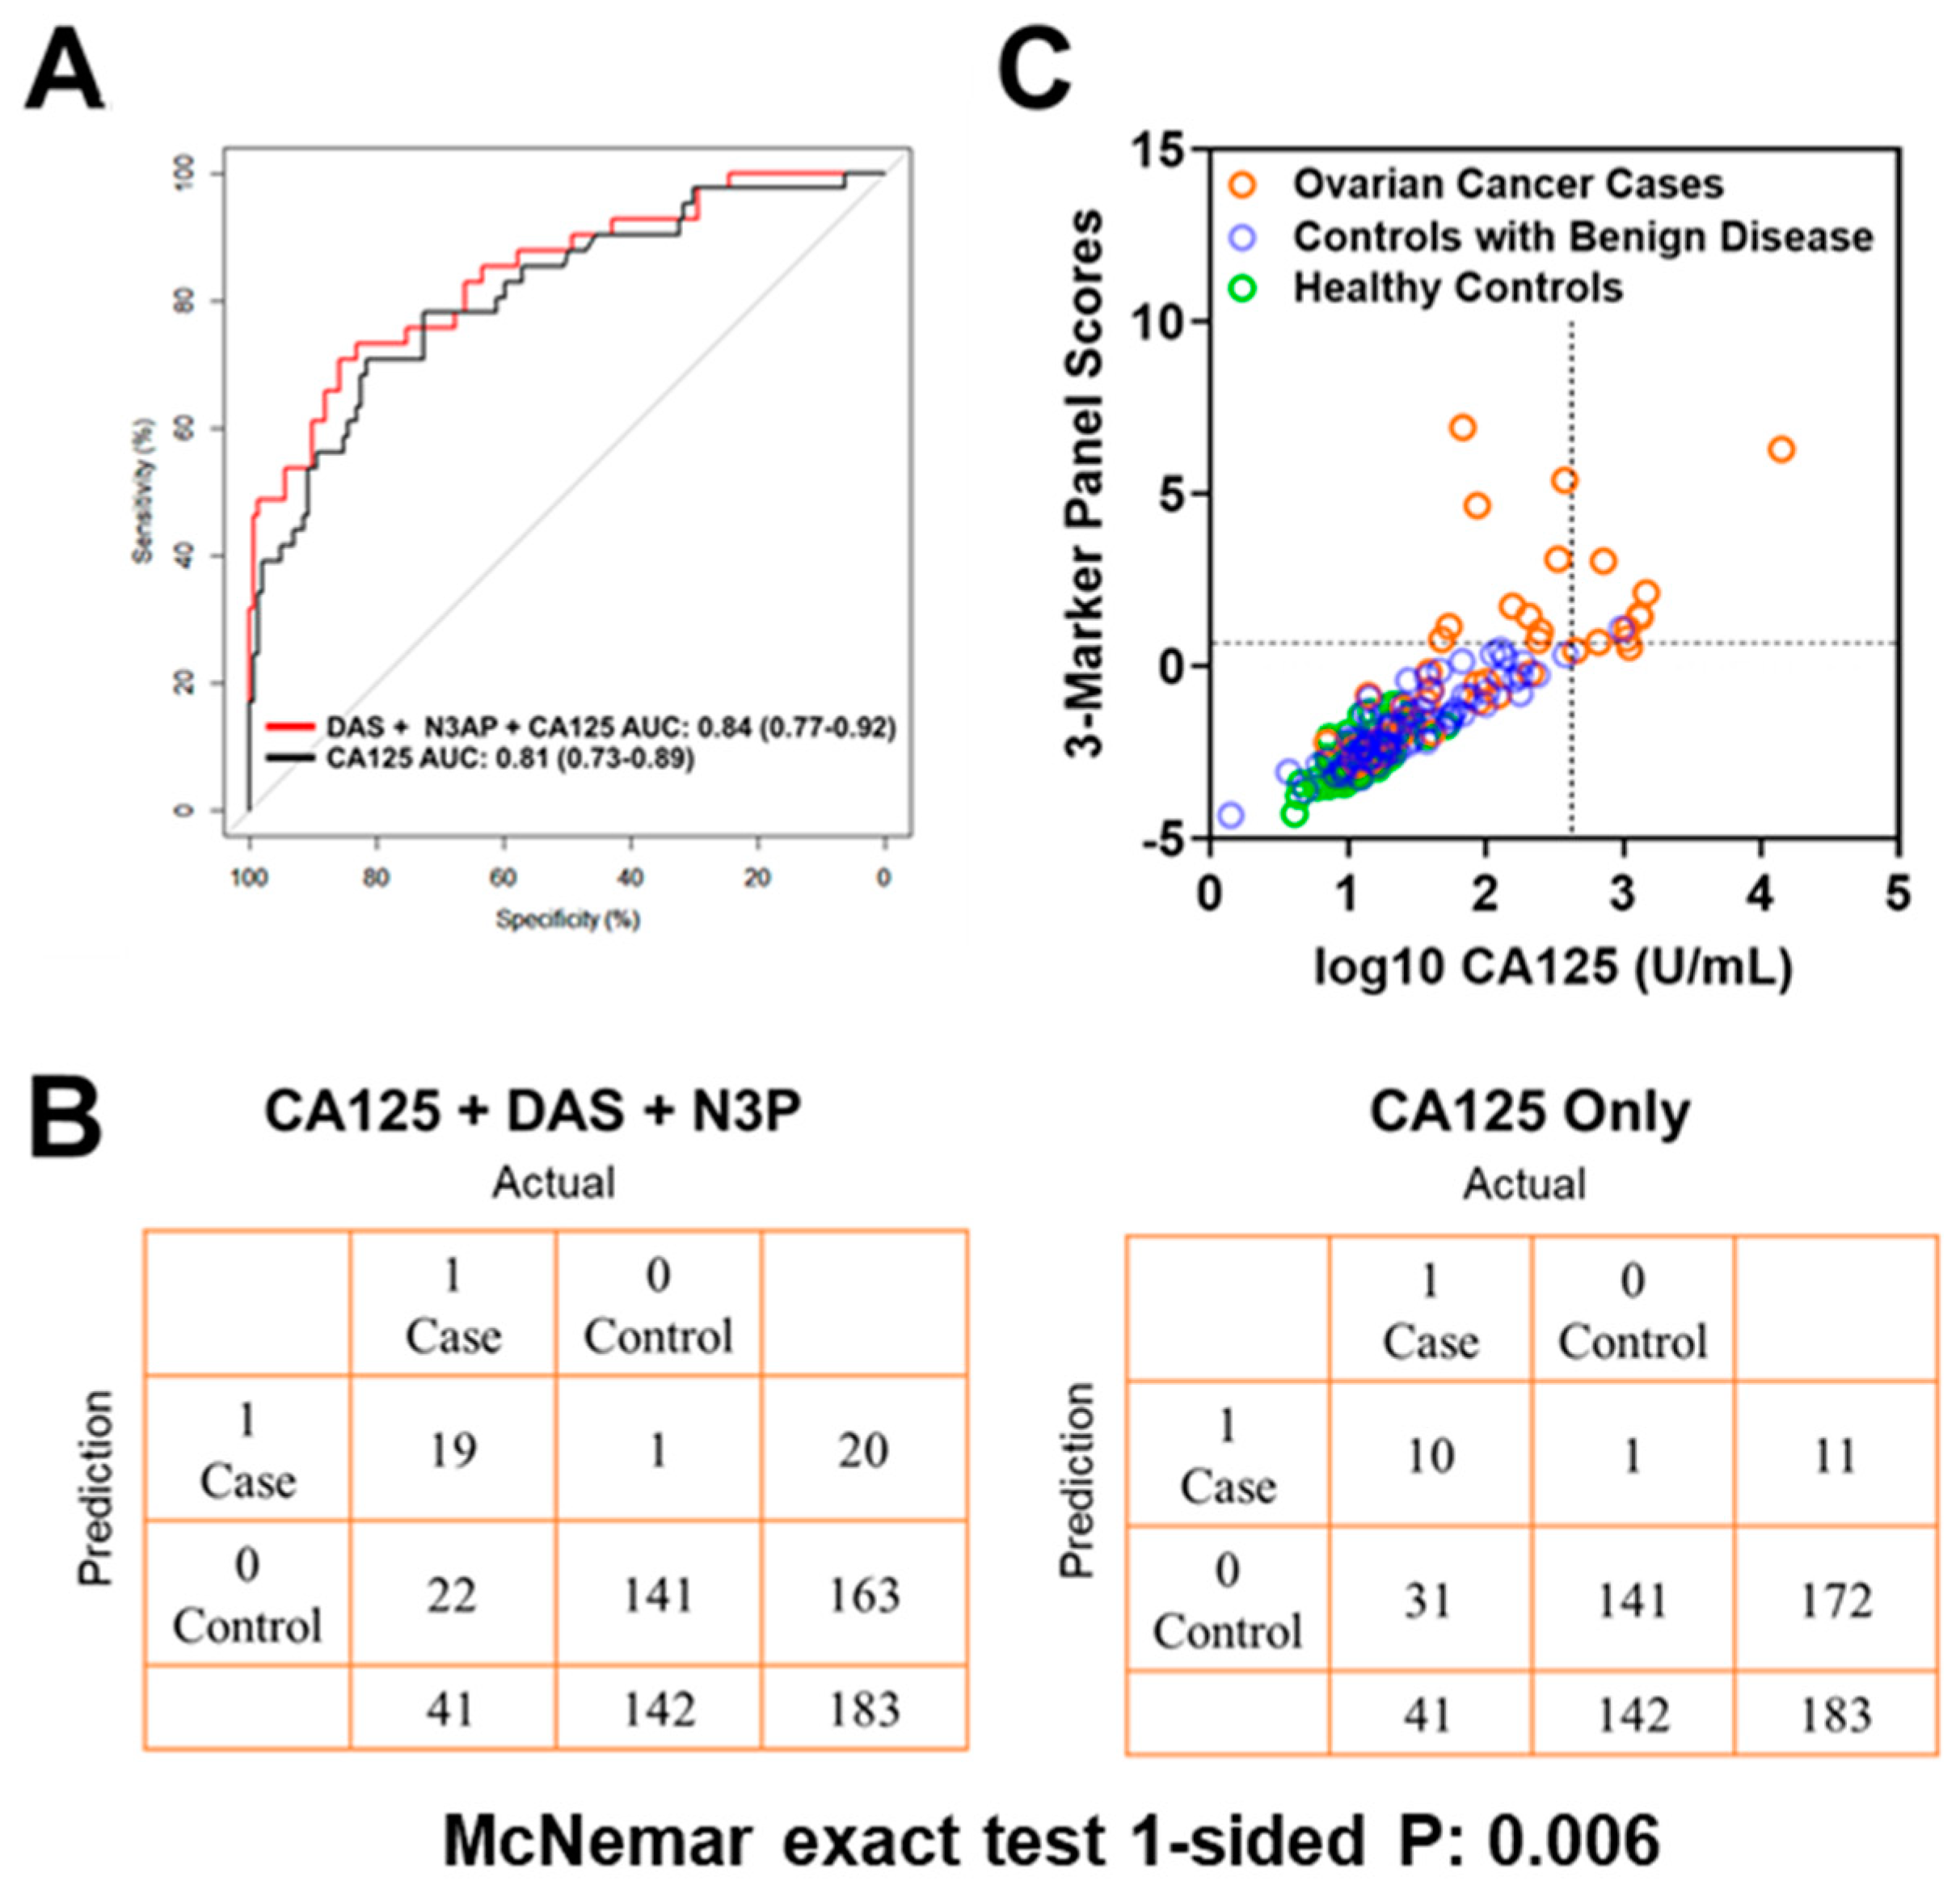
| Test Set | |||
| Cutoffs | DAS + N3AP + CA125 | CA125 | McNemar Exact Test 1-sided p-value |
| Sensivitiy @ 99% Specificity | 46.3 | 24.3 | 0.006 |
| Sensivitiy @ 98.5% Specificity | 48.8 | 34.1 | 0.04 |
| Sensivitiy @ 97% Specificity | 48.8 | 39.2 | 0.17 |
| Validation Set | |||
| Cutoffs | DAS + N3AP + CA125 | CA125 | McNemar Exact Test 1-sided p-value |
| Sensivitiy @ 99% Specificity | 73.7 | 62.2 | 0.02 |
| Sensivitiy @ 98.5% Specificity | 78.6 | 81.9 | 0.37 |
| Sensivitiy @ 97% Specificity | 83.6 | 86.8 | 0.38 |
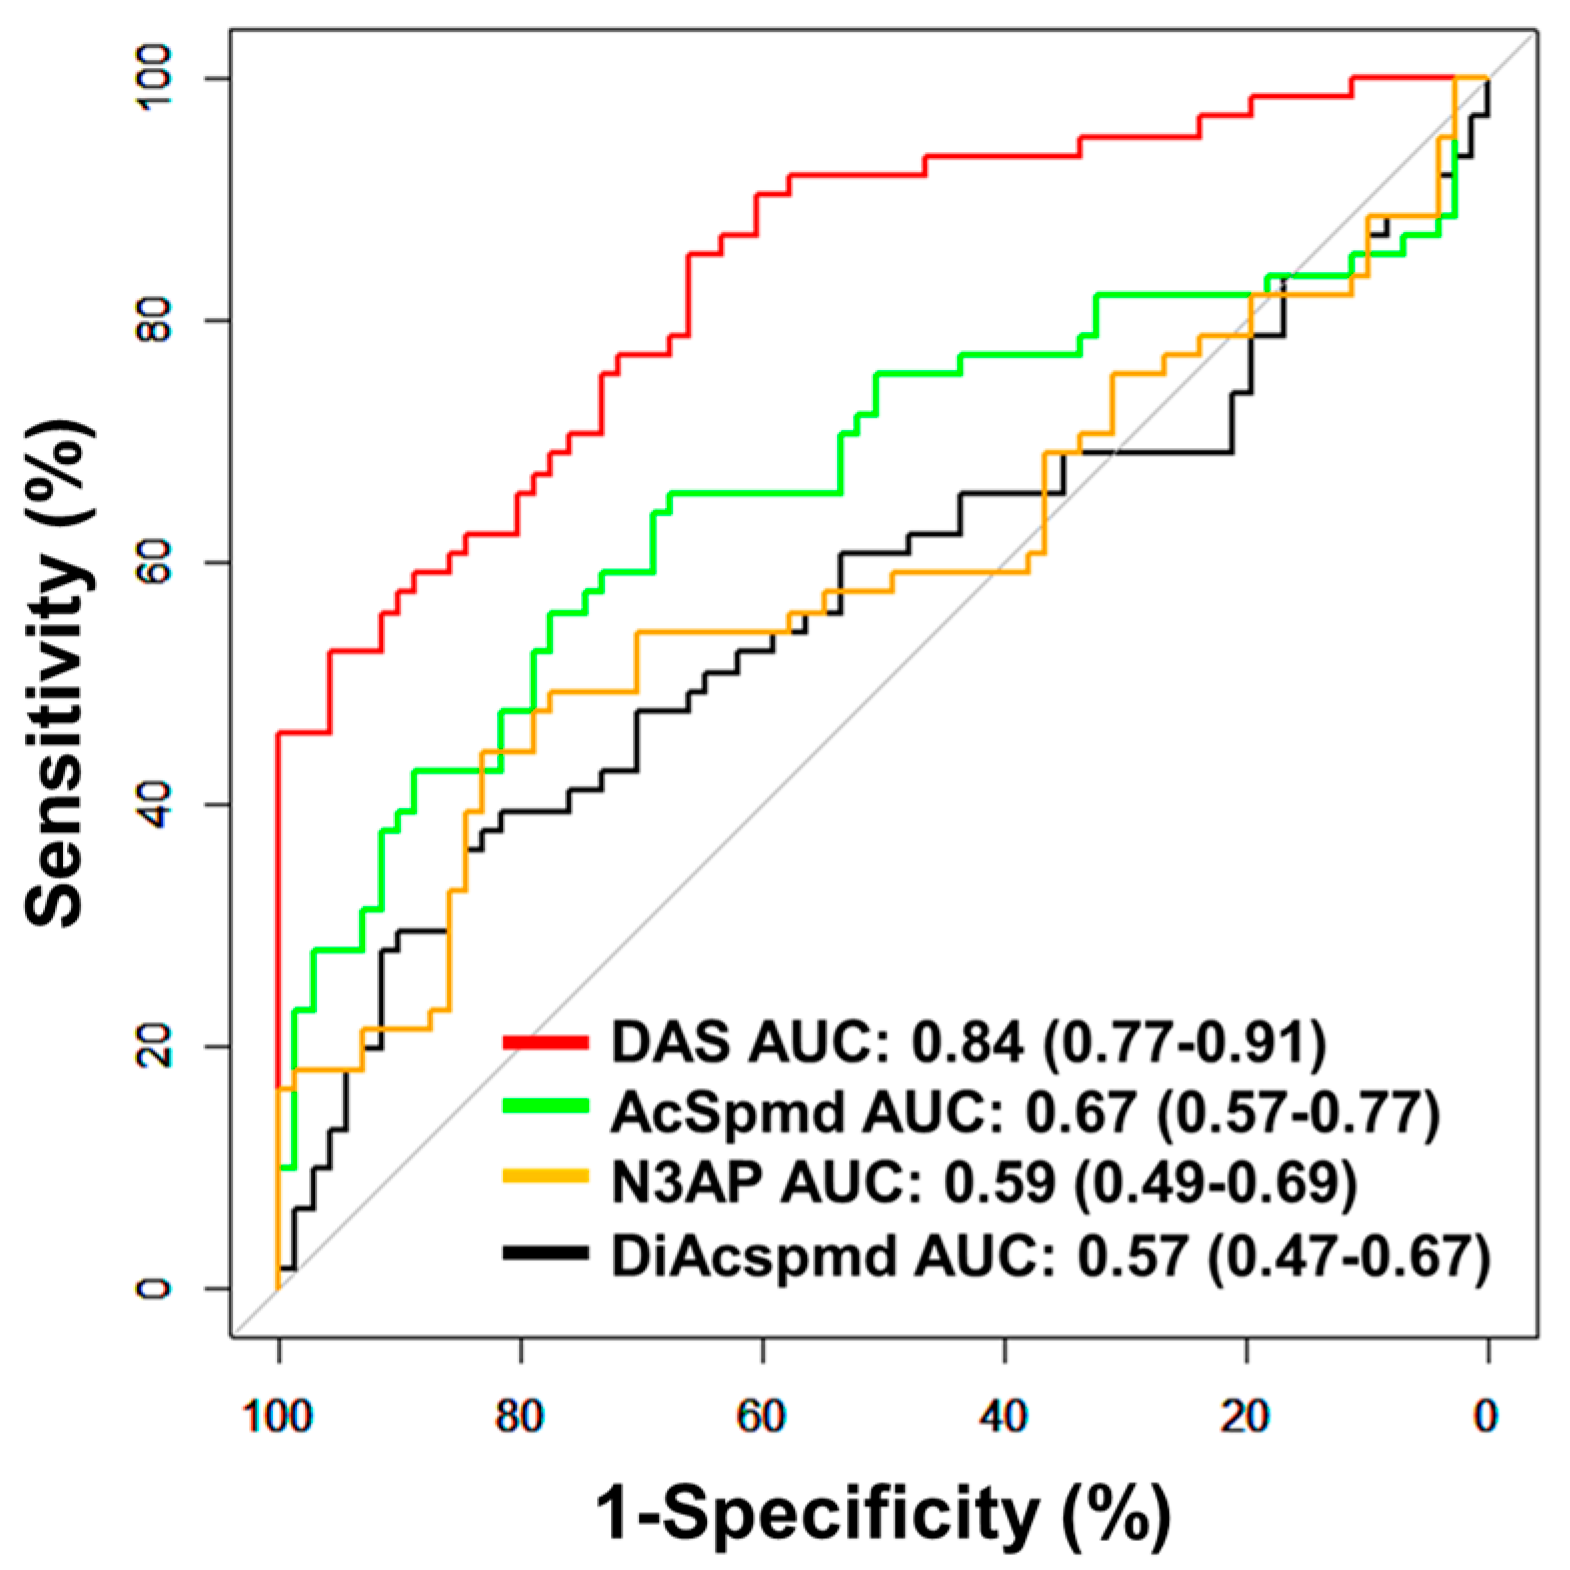
| All Cases (n = 61) vs. Controls (n = 71) | Serous Cases (n = 28) vs. Controls (n = 71) | Non-Serous Cases (n = 33) vs. Controls (n = 71) | |||||||||||||
|---|---|---|---|---|---|---|---|---|---|---|---|---|---|---|---|
| Metabolite | AUC | 95% CI | p † | Sens @ 95% Spec | Spec @ 95% Sens | AUC | 95% CI | p † | Sens @ 95% Spec | Spec @ 95% Sens | AUC | 95% CI | p † | Sens @ 95% Spec | Spec @ 95% Sens |
| Diacetylspermine | 0.84 | 0.77–0.91 | <0.001 | 52.5 | 33.8 | 0.84 | 0.75–0.93 | <0.001 | 46.4 | 33.8 | 0.84 | 0.75–0.92 | <0.001 | 57.6 | 23.9 |
| Diacetylspermidine | 0.57 | 0.47–0.67 | 0.18 | 13.1 | 1.4 | 0.56 | 0.42–0.70 | 0.33 | 10.7 | 0 | 0.57 | 0.44–0.70 | 0.25 | 15.2 | 1.4 |
| Acetylspermidine | 0.67 | 0.57–0.77 | <0.001 | 27.9 | 2.8 | 0.64 | 0.50–0.78 | 0.03 | 25.0 | 2.8 | 0.69 | 0.57–0.81 | 0.002 | 30.3 | 2.8 |
| N3AP | 0.59 | 0.49–0.69 | 0.08 | 18.0 | 4.2 | 0.58 | 0.44–0.72 | 0.21 | 17.9 | 4.2 | 0.59 | 0.46–0.72 | 0.12 | 18.2 | 2.8 |


References
- Badgwell, D.; Bast, R.C., Jr. Early detection of ovarian cancer. Dis. Markers 2007, 23, 397–410. [Google Scholar] [CrossRef] [Green Version]
- Siegel, R.L.; Miller, K.D.; Jemal, A. Cancer Statistics, 2017. CA Cancer J. Clin. 2017, 67, 7–30. [Google Scholar] [CrossRef] [PubMed] [Green Version]
- Fortner, R.T.; Schock, H.; Le Cornet, C.; Husing, A.; Vitonis, A.F.; Johnson, T.S.; Fichorova, R.N.; Fashemi, T.; Yamamoto, H.S.; Tjonneland, A.; et al. Ovarian cancer early detection by circulating CA125 in the context of anti-CA125 autoantibody levels: Results from the EPIC cohort. Int. J. Cancer 2018, 142, 1355–1360. [Google Scholar] [CrossRef]
- Lu, K.H.; Skates, S.; Hernandez, M.A.; Bedi, D.; Bevers, T.; Leeds, L.; Moore, R.; Granai, C.; Harris, S.; Newland, W.; et al. A 2-stage ovarian cancer screening strategy using the Risk of Ovarian Cancer Algorithm (ROCA) identifies early-stage incident cancers and demonstrates high positive predictive value. Cancer 2013, 119, 3454–3461. [Google Scholar] [CrossRef] [PubMed]
- Bast, R.C., Jr.; Xu, F.J.; Yu, Y.H.; Barnhill, S.; Zhang, Z.; Mills, G.B. CA 125: The past and the future. Int. J. Biol. Markers 1998, 13, 179–187. [Google Scholar] [CrossRef] [PubMed]
- The Cancer Genome Atlas Network. Comprehensive molecular portraits of human breast tumours. Nature 2012, 490, 61–70. [Google Scholar] [CrossRef] [PubMed] [Green Version]
- Li, C.; Bonazzoli, E.; Bellone, S.; Choi, J.; Dong, W.; Menderes, G.; Altwerger, G.; Han, C.; Manzano, A.; Bianchi, A.; et al. Mutational landscape of primary, metastatic, and recurrent ovarian cancer reveals c-MYC gains as potential target for BET inhibitors. Proc. Natl. Acad. Sci. USA 2019, 116, 619–624. [Google Scholar] [CrossRef] [Green Version]
- Chen, C.H.; Shen, J.; Lee, W.J.; Chow, S.N. Overexpression of cyclin D1 and c-Myc gene products in human primary epithelial ovarian cancer. Int. J. Gynecol. Cancer Off. J. Int. Gynecol. Cancer Soc. 2005, 15, 878–883. [Google Scholar] [CrossRef]
- Papp, E.; Hallberg, D.; Konecny, G.E.; Bruhm, D.C.; Adleff, V.; Noë, M.; Kagiampakis, I.; Palsgrove, D.; Conklin, D.; Kinose, Y.; et al. Integrated Genomic, Epigenomic, and Expression Analyses of Ovarian Cancer Cell Lines. Cell Rep. 2018, 25, 2617–2633. [Google Scholar] [CrossRef] [PubMed] [Green Version]
- Fahrmann, J.F.; Vykoukal, J.; Fleury, A.; Tripathi, S.; Dennison, J.B.; Murage, E.; Wang, P.; Yu, C.Y.; Capello, M.; Creighton, C.J.; et al. Association between plasma diacetylspermine and tumor spermine synthase with outcome in triple negative breast cancer. J. Natl. Cancer Inst. 2019. [Google Scholar] [CrossRef] [PubMed]
- Fahrmann, J.F.; Bantis, L.E.; Capello, M.; Scelo, G.; Dennison, J.B.; Patel, N.; Murage, E.; Vykoukal, J.; Kundnani, D.L.; Foretova, L.; et al. A Plasma-Derived Protein-Metabolite Multiplexed Panel for Early-Stage Pancreatic Cancer. J. Natl. Cancer Inst. 2018, 111, 372–379. [Google Scholar] [CrossRef]
- Tibshirani, R. Regression shrinkage and selection via the lasso. J. R. Stat. Soc. Ser. B Methodol. 1996, 58, 267–288. [Google Scholar] [CrossRef]
- Walker, G.; Jack Shostak. Common Statistical Methods for Clinical Research with SAS Examples; SAS Institute: Cary, NC, USA, 2010. [Google Scholar]
- Breslow, N.E.; Nicholas, E. Day, and Elisabeth Heseltine. In Statistical Methods in Cancer Research; IARC: Lyon, France, 1980; Volume 1. [Google Scholar]
- Dorigo, O.; Berek, J.S. Personalizing CA125 Levels for Ovarian Cancer Screening. Cancer Prev. Res. 2011, 4, 1356–1359. [Google Scholar] [CrossRef] [Green Version]
- Peres, L.C.; Cushing-Haugen, K.L.; Köbel, M.; Harris, H.R.; Berchuck, A.; Rossing, M.A.; Schildkraut, J.M.; Doherty, J.A. Invasive Epithelial Ovarian Cancer Survival by Histotype and Disease Stage. J. Natl. Cancer Inst. 2019, 111, 60–68. [Google Scholar] [CrossRef]
- Integrated genomic analyses of ovarian carcinoma. Nature 2011, 474, 609–615. [CrossRef]
- Darcy, K.M.; Brady, W.E.; Blancato, J.K.; Dickson, R.B.; Hoskins, W.J.; McGuire, W.P.; Birrer, M.J. Prognostic relevance of c-MYC gene amplification and polysomy for chromosome 8 in suboptimally-resected, advanced stage epithelial ovarian cancers: A Gynecologic Oncology Group study. Gynecol. Oncol. 2009, 114, 472–479. [Google Scholar] [CrossRef]
- Wang, Z.R.; Liu, W.; Smith, S.T.; Parrish, R.S.; Young, S.R. c-myc and chromosome 8 centromere studies of ovarian cancer by interphase FISH. Exp. Mol. Pathol. 1999, 66, 140–148. [Google Scholar] [CrossRef] [PubMed]
- Wu, R.; Lin, L.; Beer, D.G.; Ellenson, L.H.; Lamb, B.J.; Rouillard, J.M.; Kuick, R.; Hanash, S.; Schwartz, D.R.; Fearon, E.R.; et al. Amplification and overexpression of the L-MYC proto-oncogene in ovarian carcinomas. Am. J. Pathol. 2003, 162, 1603–1610. [Google Scholar] [CrossRef] [Green Version]
- Helland, Å.; Anglesio, M.S.; George, J.; Cowin, P.A.; Johnstone, C.N.; House, C.M.; Sheppard, K.E.; Etemadmoghadam, D.; Melnyk, N.; Rustgi, A.K.; et al. Deregulation of MYCN, LIN28B and LET7 in a molecular subtype of aggressive high-grade serous ovarian cancers. PLoS ONE 2011, 6, e18064. [Google Scholar] [CrossRef] [Green Version]
- Ohshima, K.; Hatakeyama, K.; Nagashima, T.; Watanabe, Y.; Kanto, K.; Doi, Y.; Ide, T.; Shimoda, Y.; Tanabe, T.; Ohnami, S.; et al. Integrated analysis of gene expression and copy number identified potential cancer driver genes with amplification-dependent overexpression in 1,454 solid tumors. Sci. Rep. 2017, 7, 641. [Google Scholar] [CrossRef]
- Bachmann, A.S.; Geerts, D. Polyamine synthesis as a target of MYC oncogenes. J. Biol. Chem. 2018, 293, 18757–18769. [Google Scholar] [CrossRef] [PubMed] [Green Version]
- Funakoshi-Tago, M.; Sumi, K.; Kasahara, T.; Tago, K. Critical roles of Myc-ODC axis in the cellular transformation induced by myeloproliferative neoplasm-associated JAK2 V617F mutant. PLoS ONE 2013, 8, e52844. [Google Scholar] [CrossRef] [PubMed]
- Hogarty, M.D.; Norris, M.D.; Davis, K.; Liu, X.; Evageliou, N.F.; Hayes, C.S.; Pawel, B.; Guo, R.; Zhao, H.; Sekyere, E.; et al. ODC1 is a critical determinant of MYCN oncogenesis and a therapeutic target in neuroblastoma. Cancer Res. 2008, 68, 9735–9745. [Google Scholar] [CrossRef] [PubMed] [Green Version]
- Niemi, R.J.; Roine, A.N.; Hakkinen, M.R.; Kumpulainen, P.S.; Keinanen, T.A.; Vepsalainen, J.J.; Lehtimaki, T.; Oksala, N.K.; Maenpaa, J.U. Urinary Polyamines as Biomarkers for Ovarian Cancer. Int. J. Gynecol. Cancer Off. J. Int. Gynecol. Cancer Soc. 2017, 27, 1360–1366. [Google Scholar] [CrossRef] [PubMed] [Green Version]
- Cheng, X.; Zhang, L.; Chen, Y.; Qing, C. Circulating cell-free DNA and circulating tumor cells, the “liquid biopsies” in ovarian cancer. J. Ovarian Res. 2017, 10, 75. [Google Scholar] [CrossRef] [Green Version]
- Buas, M.F.; Gu, H.; Djukovic, D.; Zhu, J.; Drescher, C.W.; Urban, N.; Raftery, D.; Li, C.I. Identification of novel candidate plasma metabolite biomarkers for distinguishing serous ovarian carcinoma and benign serous ovarian tumors. Gynecol. Oncol. 2016, 140, 138–144. [Google Scholar] [CrossRef] [PubMed] [Green Version]


| Patient Characteristics for Specimen Sets | Test Set | Validation Set | |||
|---|---|---|---|---|---|
| Cases | Controls #1 † | Controls #2 ‡ | Cases | Controls #1 † | |
| Number of Subjects | 116 | 71 | 72 | 61 | 71 |
| Age (mean +/− stdev) | 58 +/− 13 | 69 +/− 7 | 56 +/− 13 | 57 +/− 15 | 65 +/− 9 |
| CA125 (u/mL), median (25th/75th percentile) | 224 (87/561) | 12 (9/16) | 23 (13/59) | 102 (45/321) | 11 (8/17) |
| Serous | |||||
| Stage I, N (%) | 11 (9.5) | - | - | 13 (21.3) | - |
| Stage II, N (%) | 5 (4.3) | - | - | 15 (24.6) | - |
| Stage III, N (%) | 64 (55.2) | - | - | - | - |
| Stage IV, N (%) | 11 (9.5) | - | - | - | - |
| Non-Serous | |||||
| Endometrioid | |||||
| Stage I, N (%) | 10 (8.6) | - | - | 16 (26.2) | - |
| Stage II, N (%) | 2 (1.7) | - | - | 6 (9.8) | - |
| Mucinous | |||||
| Stage I, N (%) | 3 (2.6) | - | - | 6 (9.8) | - |
| Stage II, N (%) | 1 (0.9) | - | - | ||
| Clear Cell Carcinoma | |||||
| Stage I, N (%) | 6 (5.2) | - | - | 3 (4.9) | - |
| Stage II, N (%) | 2 (1.7) | - | - | 1 (1.6) | - |
| Other | |||||
| Transitional cell carcinoma (Stage I) | 1 (0.9) | - | - | 1 (1.6) | - |
Publisher’s Note: MDPI stays neutral with regard to jurisdictional claims in published maps and institutional affiliations. |
© 2021 by the authors. Licensee MDPI, Basel, Switzerland. This article is an open access article distributed under the terms and conditions of the Creative Commons Attribution (CC BY) license (http://creativecommons.org/licenses/by/4.0/).
Share and Cite
Fahrmann, J.F.; Irajizad, E.; Kobayashi, M.; Vykoukal, J.; Dennison, J.B.; Murage, E.; Wu, R.; Long, J.P.; Do, K.-A.; Celestino, J.; et al. A MYC-Driven Plasma Polyamine Signature for Early Detection of Ovarian Cancer. Cancers 2021, 13, 913. https://0-doi-org.brum.beds.ac.uk/10.3390/cancers13040913
Fahrmann JF, Irajizad E, Kobayashi M, Vykoukal J, Dennison JB, Murage E, Wu R, Long JP, Do K-A, Celestino J, et al. A MYC-Driven Plasma Polyamine Signature for Early Detection of Ovarian Cancer. Cancers. 2021; 13(4):913. https://0-doi-org.brum.beds.ac.uk/10.3390/cancers13040913
Chicago/Turabian StyleFahrmann, Johannes F., Ehsan Irajizad, Makoto Kobayashi, Jody Vykoukal, Jennifer B. Dennison, Eunice Murage, Ranran Wu, James P. Long, Kim-Anh Do, Joseph Celestino, and et al. 2021. "A MYC-Driven Plasma Polyamine Signature for Early Detection of Ovarian Cancer" Cancers 13, no. 4: 913. https://0-doi-org.brum.beds.ac.uk/10.3390/cancers13040913