
Multi-Phase, Contrast-Enhanced Computed Tomography-Based Radiomic Prognostic Marker of Non-Metastatic Pancreatic Ductal Adenocarcinoma

 , ,
, ,
Abstract
:Simple Summary
Abstract
1. Introduction
2. Materials and Methods
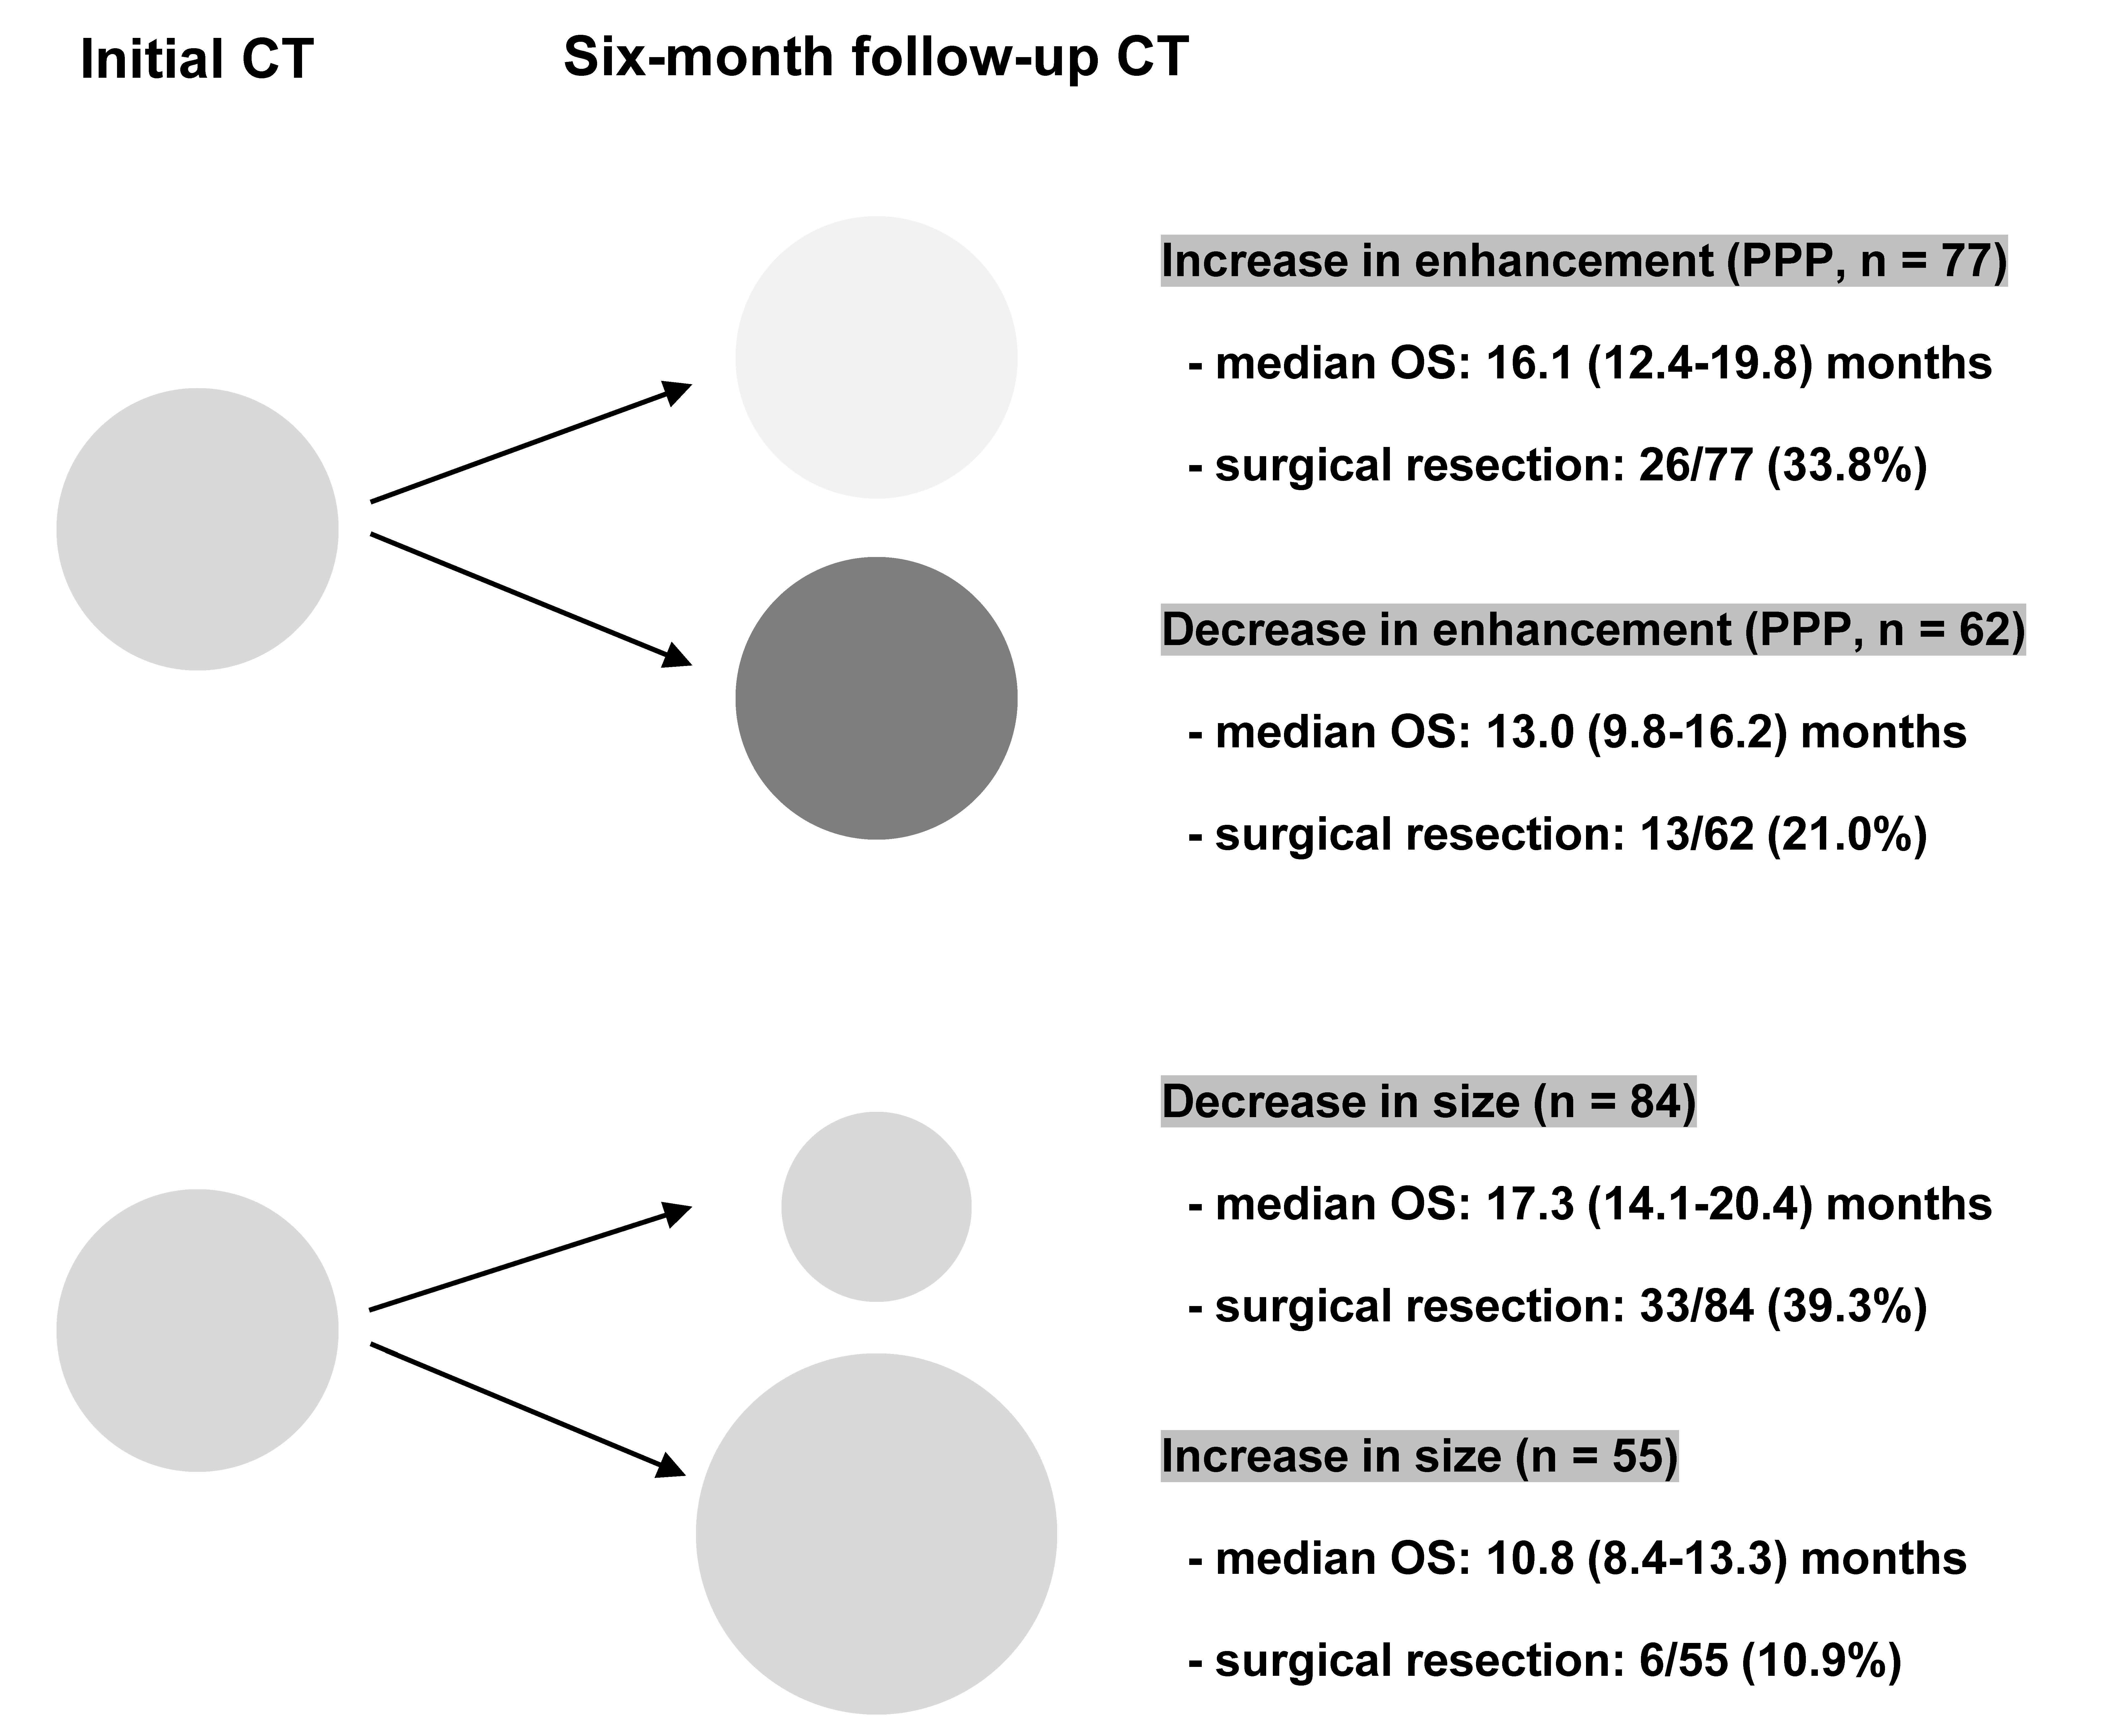
2.1. Study Population
2.2. CT Imaging Technique
2.3. Image Analysis
2.4. Statistical Analysis
3. Results
3.1. Patient Characteristics
3.2. Survival Analysis
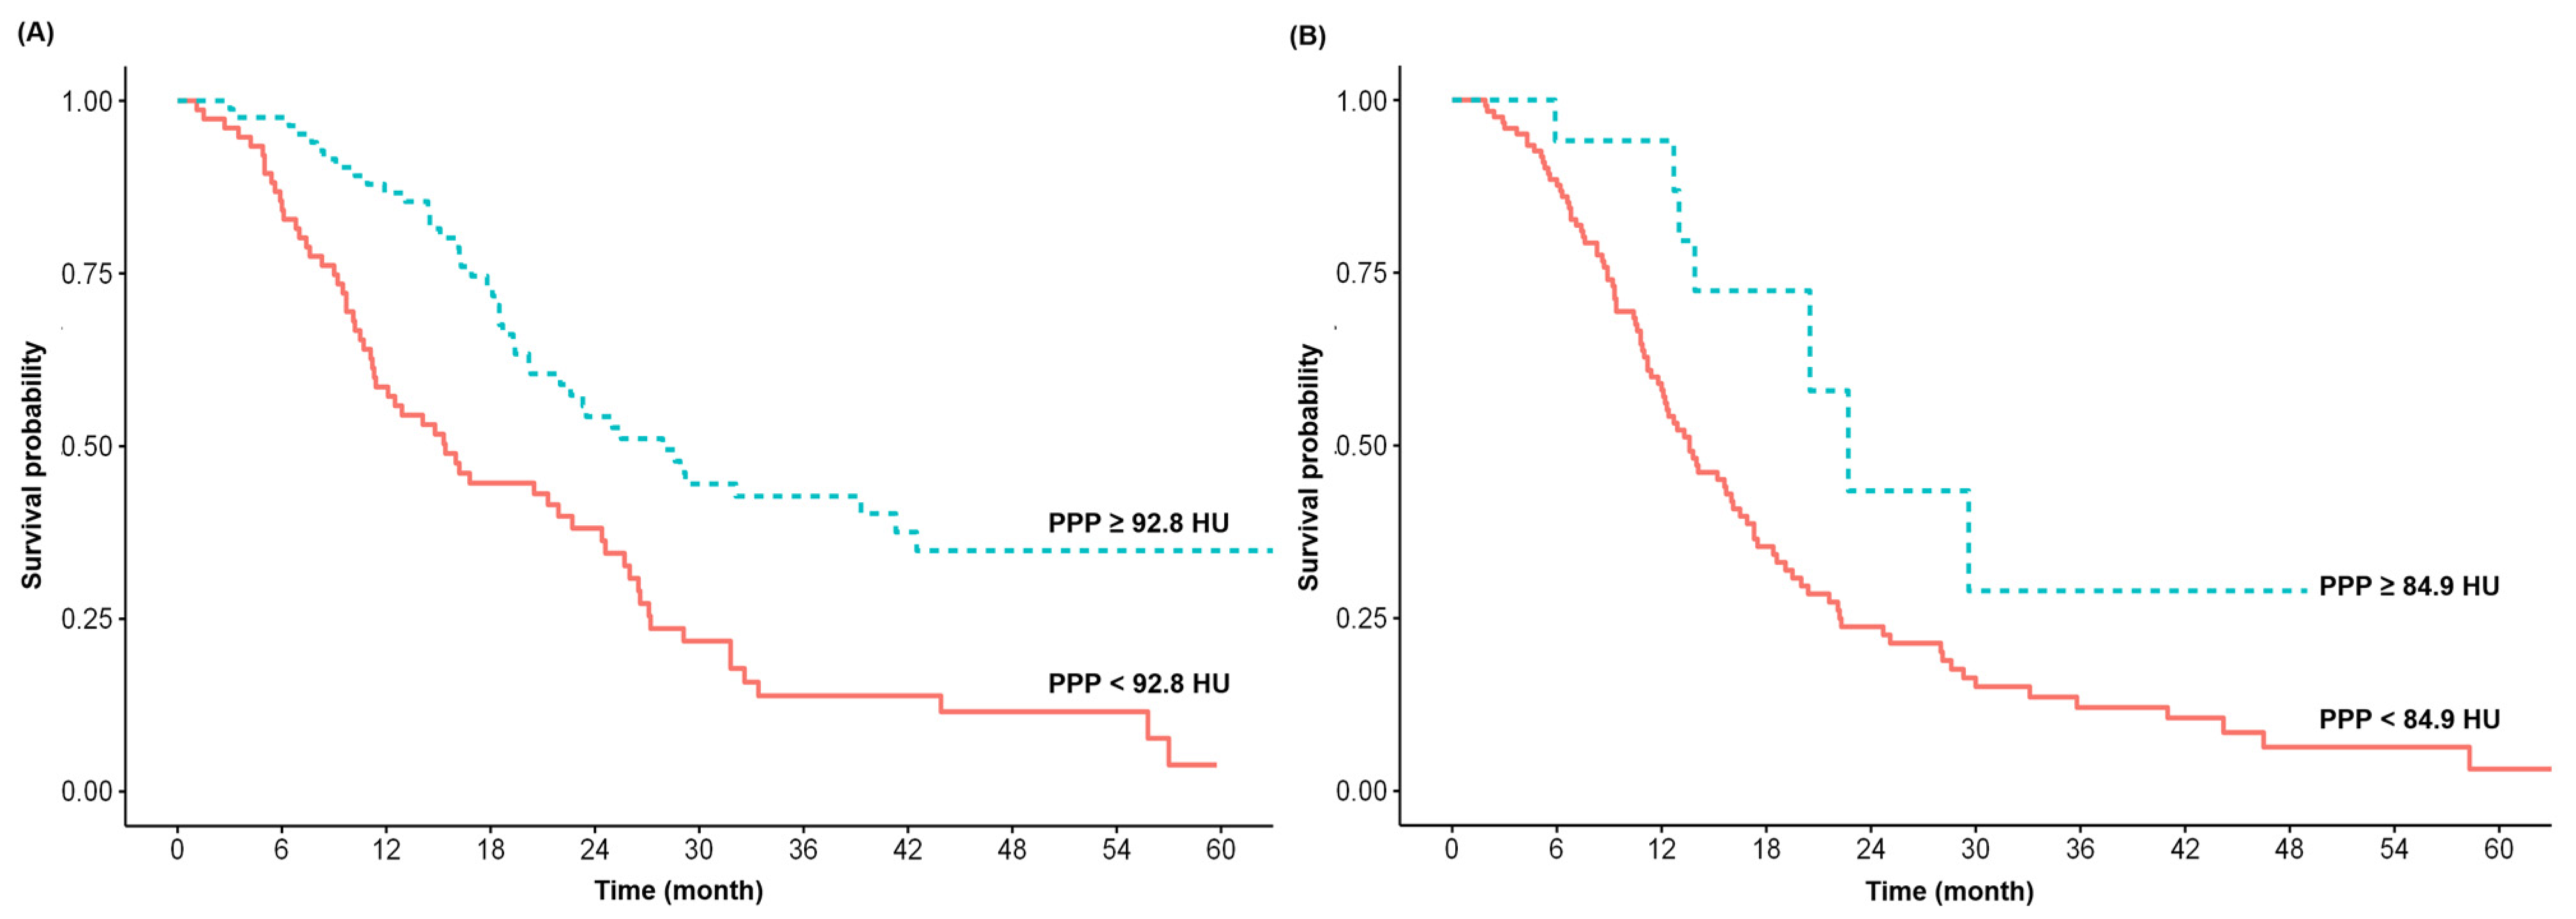
3.2.1. OS in Patients with RPC
3.2.2. OS in Patients with BRPC and LAPC
3.3. Correlation between T-Stage and Intra-Tumoral Enhancement
4. Discussion
5. Conclusions
Supplementary Materials
Author Contributions
Funding
Institutional Review Board Statement
Informed Consent Statement
Data Availability Statement
Conflicts of Interest
References
- Siegel, R.L.; Miller, K.D.; Fuchs, H.E.; Jemal, A. Cancer Statistics, 2021. CA A Cancer J. Clin. 2021, 71, 7–33. [Google Scholar] [CrossRef] [PubMed]
- National Cancer Center, Korea. Statistics on Cancer Registration 2017. Available online: https://ncc.re.kr/cancerStatsView.ncc?bbsnum=498&searchKey=total&searchValue=&pageNum=1 (accessed on 7 January 2020).
- Gillen, S.; Schuster, T.; Meyer Zum Büschenfelde, C.; Friess, H.; Kleeff, J. Preoperative/neoadjuvant therapy in pancreatic cancer: A systematic review and meta-analysis of response and resection percentages. PLoS Med. 2010, 7, e1000267. [Google Scholar] [CrossRef] [PubMed] [Green Version]
- Wagner, M.; Redaelli, C.; Lietz, M.; Seiler, C.A.; Friess, H.; Büchler, M.W. Curative resection is the single most important factor determining outcome in patients with pancreatic adenocarcinoma. Br. J. Surg. 2004, 91, 586–594. [Google Scholar] [CrossRef] [PubMed]
- Groot, V.P.; Rezaee, N.; Wu, W.; Cameron, J.L.; Fishman, E.K.; Hruban, R.H.; Weiss, M.J.; Zheng, L.; Wolfgang, C.L.; He, J. Patterns, timing, and predictors of recurrence following pancreatectomy for pancreatic ductal adenocarcinoma. Ann. Surg. 2018, 267, 936–945. [Google Scholar] [CrossRef] [PubMed]
- Jones, R.P.; Psarelli, E.E.; Jackson, R.; Ghaneh, P.; Halloran, C.M.; Palmer, D.H.; Campbell, F.; Valle, J.W.; Faluyi, O.; O’Reilly, D.A.; et al. Patterns of Recurrence After Resection of Pancreatic Ductal Adenocarcinoma: A Secondary Analysis of the ESPAC-4 Randomized Adjuvant Chemotherapy Trial. JAMA Surg. 2019, 154, 1038–1048. [Google Scholar] [CrossRef]
- Sakamoto, T.; Saito, H.; Uchinaka, E.I.; Morimoto, M.; Amisaki, M.; Tokuyasu, N.; Honjo, S.; Ashida, K.; Fujiwara, Y. The Combination of Neutrophil-to-lymphocyte Ratio and Serum Carbohydrate Antigen 19-9 Level as a Prognostic Indicator in Patients with Recurrent Pancreatic Cancer. Anticancer Res. 2018, 38, 5497–5503. [Google Scholar] [CrossRef]
- Giakoustidis, A.; Neofytou, K.; Costa Neves, M.; Giakoustidis, D.; Louri, E.; Cunningham, D.; Mudan, S. Identifying the role of neutrophil-to-lymphocyte ratio and platelets-to-lymphocyte ratio as prognostic markers in patients undergoing resection of pancreatic ductal adenocarcinoma. Ann. Hepato-Biliary-Pancreat. Surg. 2018, 22, 197–207. [Google Scholar] [CrossRef]
- Zhang, S.R.; Yao, L.; Wang, W.Q.; Xu, J.Z.; Xu, H.X.; Jin, W.; Gao, H.L.; Wu, C.T.; Qi, Z.H.; Li, H.; et al. Tumor-Infiltrating Platelets Predict Postsurgical Survival in Patients with Pancreatic Ductal Adenocarcinoma. Ann. Surg. Oncol. 2018, 25, 3984–3993. [Google Scholar] [CrossRef]
- Hlavsa, J.; Cecka, F.; Zaruba, P.; Zajak, J.; Gurlich, R.; Strnad, R.; Pavlik, T.; Kala, Z.; Lovecek, M. Tumor grade as significant prognostic factor in pancreatic cancer: Validation of a novel TNMG staging system. Neoplasma 2018, 65, 637–643. [Google Scholar] [CrossRef] [Green Version]
- Shin, D.W.; Lee, J.C.; Kim, J.; Woo, S.M.; Lee, W.J.; Han, S.S.; Park, S.J.; Choi, K.S.; Cha, H.S.; Yoon, Y.S.; et al. Validation of the American Joint Committee on Cancer 8th edition staging system for the pancreatic ductal adenocarcinoma. Eur. J. Surg. Oncol. 2019, 45, 2159–2165. [Google Scholar] [CrossRef]
- Egawa, S.; Toma, H.; Ohigashi, H.; Okusaka, T.; Nakao, A.; Hatori, T.; Maguchi, H.; Yanagisawa, A.; Tanaka, M. Japan Pancreatic Cancer Registry; 30th year anniversary: Japan Pancreas Society. Pancreas 2012, 41, 985–992. [Google Scholar] [CrossRef] [PubMed]
- Liao, X.; Wang, X.; Huang, K.; Yang, C.; Yu, T.; Han, C.; Zhu, G.; Su, H.; Huang, R.; Peng, T. Genome-scale analysis to identify prognostic microRNA biomarkers in patients with early stage pancreatic ductal adenocarcinoma after pancreaticoduodenectomy. Cancer Manag. Res. 2018, 10, 2537–2551. [Google Scholar] [CrossRef] [PubMed] [Green Version]
- Klauss, M.; Schobinger, M.; Wolf, I.; Werner, J.; Meinzer, H.P.; Kauczor, H.U.; Grenacher, L. Value of three-dimensional reconstructions in pancreatic carcinoma using multidetector CT: Initial results. World J. Gastroenterol. 2009, 15, 5827–5832. [Google Scholar] [CrossRef] [PubMed]
- Kim, S.I.; Shin, J.Y.; Park, J.S.; Jeong, S.; Jeon, Y.S.; Choi, M.H.; Choi, H.J.; Moon, J.H.; Hwang, J.C.; Yang, M.J.; et al. Vascular enhancement pattern of mass in computed tomography may predict chemo-responsiveness in advanced pancreatic cancer. Pancreatology 2017, 17, 103–108. [Google Scholar] [CrossRef]
- Takeshita, K.; Kutomi, K.; Haruyama, T.; Watanabe, A.; Furui, S.; Fukushima, J.; Asano, T. Imaging of early pancreatic cancer on multidetector row helical computed tomography. Br. J. Radiol. 2010, 83, 823–830. [Google Scholar] [CrossRef] [Green Version]
- Masamune, A.; Kikuta, K.; Watanabe, T.; Satoh, K.; Hirota, M.; Shimosegawa, T. Hypoxia stimulates pancreatic stellate cells to induce fibrosis and angiogenesis in pancreatic cancer. Am. J. Physiol. Gastrointest. Liver Physiol. 2008, 295, G709–G717. [Google Scholar] [CrossRef] [Green Version]
- Bergers, G.; Benjamin, L.E. Tumorigenesis and the angiogenic switch. Nat. Rev. Cancer 2003, 3, 401–410. [Google Scholar] [CrossRef]
- Komar, G.; Kauhanen, S.; Liukko, K.; Seppänen, M.; Kajander, S.; Ovaska, J.; Nuutila, P.; Minn, H. Decreased blood flow with increased metabolic activity: A novel sign of pancreatic tumor aggressiveness. Clin. Cancer Res. 2009, 15, 5511–5517. [Google Scholar] [CrossRef] [Green Version]
- Yoon, S.H.; Lee, J.M.; Cho, J.Y.; Lee, K.B.; Kim, J.E.; Moon, S.K.; Kim, S.J.; Baek, J.H.; Kim, S.H.; Kim, S.H.; et al. Small (≤20 mm) pancreatic adenocarcinomas: Analysis of enhancement patterns and secondary signs with multiphasic multidetector CT. Radiology 2011, 259, 442–452. [Google Scholar] [CrossRef] [Green Version]
- Cassinotto, C.; Chong, J.; Zogopoulos, G.; Reinhold, C.; Chiche, L.; Lafourcade, J.P.; Cuggia, A.; Terrebonne, E.; Dohan, A.; Gallix, B. Resectable pancreatic adenocarcinoma: Role of CT quantitative imaging biomarkers for predicting pathology and patient outcomes. Eur. J. Radiol. 2017, 90, 152–158. [Google Scholar] [CrossRef]
- Lee, J.C.; Woo, S.M.; Shin, D.W.; Kim, J.; Yang, S.Y.; Kim, M.J.; Kim, J.W.; Kim, J.W.; Lee, W.J.; Cha, H.S.; et al. Comparison of FOLFIRINOX and Gemcitabine Plus Nab-paclitaxel for Treatment of Metastatic Pancreatic Cancer: Using Korean Pancreatic Cancer (K-PaC) Registry. Am. J. Clin. Oncol. 2020, 43, 654–659. [Google Scholar] [CrossRef] [PubMed]
- Tempero, M.A.; Malafa, M.P.; Chiorean, E.G.; Czito, B.; Scaife, C.; Narang, A.K.; Fountzilas, C.; Wolpin, B.M.; Al-Hawary, M.; Asbun, H.; et al. Pancreatic Adenocarcinoma, Version 1.2019. J. Natl. Compr. Cancer Netw. 2019, 17, 202–210. [Google Scholar] [CrossRef] [PubMed] [Green Version]
- Camp, R.L.; Dolled-Filhart, M.; Rimm, D.L. X-tile: A new bio-informatics tool for biomarker assessment and outcome-based cut-point optimization. Clin. Cancer Res. 2004, 10, 7252–7259. [Google Scholar] [CrossRef] [PubMed] [Green Version]
- Eisenhauer, E.A.; Therasse, P.; Bogaerts, J.; Schwartz, L.H.; Sargent, D.; Ford, R.; Dancey, J.; Arbuck, S.; Gwyther, S.; Mooney, M.; et al. New response evaluation criteria in solid tumours: Revised RECIST guideline (version 1.1). Eur. J. Cancer 2009, 45, 228–247. [Google Scholar] [CrossRef]
- Prokesch, R.W.; Chow, L.C.; Beaulieu, C.F.; Bammer, R.; Jeffrey, R.B., Jr. Isoattenuating pancreatic adenocarcinoma at multi-detector row CT: Secondary signs. Radiology 2002, 224, 764–768. [Google Scholar] [CrossRef]
- Kim, J.H.; Park, S.H.; Yu, E.S.; Kim, M.H.; Kim, J.; Byun, J.H.; Lee, S.S.; Hwang, H.J.; Hwang, J.Y.; Lee, S.S.; et al. Visually isoattenuating pancreatic adenocarcinoma at dynamic-enhanced CT: Frequency, clinical and pathologic characteristics, and diagnosis at imaging examinations. Radiology 2010, 257, 87–96. [Google Scholar] [CrossRef]
- Hattori, Y.; Gabata, T.; Matsui, O.; Mochizuki, K.; Kitagawa, H.; Kayahara, M.; Ohta, T.; Nakanuma, Y. Enhancement patterns of pancreatic adenocarcinoma on conventional dynamic multi-detector row CT: Correlation with angiogenesis and fibrosis. World J. Gastroenterol. 2009, 15, 3114–3121. [Google Scholar] [CrossRef]
- Büchler, P.; Reber, H.A.; Lavey, R.S.; Tomlinson, J.; Büchler, M.W.; Friess, H.; Hines, O.J. Tumor hypoxia correlates with metastatic tumor growth of pancreatic cancer in an orthotopic murine model. J. Surg. Res. 2004, 120, 295–303. [Google Scholar] [CrossRef]
- Smalley, K.S.; Brafford, P.A.; Herlyn, M. Selective evolutionary pressure from the tissue microenvironment drives tumor progression. Semin. Cancer Biol. 2005, 15, 451–459. [Google Scholar] [CrossRef]
- Fukukura, Y.; Takumi, K.; Higashi, M.; Shinchi, H.; Kamimura, K.; Yoneyama, T.; Tateyama, A. Contrast-enhanced CT and diffusion-weighted MR imaging: Performance as a prognostic factor in patients with pancreatic ductal adenocarcinoma. Eur. J. Radiol. 2014, 83, 612–619. [Google Scholar] [CrossRef]
- Neophytou, C.M.; Panagi, M.; Stylianopoulos, T.; Papageorgis, P. The Role of Tumor Microenvironment in Cancer Metastasis: Molecular Mechanisms and Therapeutic Opportunities. Cancers 2021, 13, 2053. [Google Scholar] [CrossRef] [PubMed]
- Mitsunaga, S.; Hasebe, T.; Iwasaki, M.; Kinoshita, T.; Ochiai, A.; Shimizu, N. Important prognostic histological parameters for patients with invasive ductal carcinoma of the pancreas. Cancer Sci. 2005, 96, 858–865. [Google Scholar] [CrossRef] [PubMed]
- Hiraoka, N.; Ino, Y.; Sekine, S.; Tsuda, H.; Shimada, K.; Kosuge, T.; Zavada, J.; Yoshida, M.; Yamada, K.; Koyama, T.; et al. Tumour necrosis is a postoperative prognostic marker for pancreatic cancer patients with a high interobserver reproducibility in histological evaluation. Br. J. Cancer 2010, 103, 1057–1065. [Google Scholar] [CrossRef] [Green Version]
- Kong, B.; Cheng, T.; Wu, W.; Regel, I.; Raulefs, S.; Friess, H.; Erkan, M.; Esposito, I.; Kleeff, J.; Michalski, C.W. Hypoxia-induced endoplasmic reticulum stress characterizes a necrotic phenotype of pancreatic cancer. Oncotarget 2015, 6, 32154–32160. [Google Scholar] [CrossRef] [PubMed]
- Demachi, H.; Matsui, O.; Kobayashi, S.; Akakura, Y.; Konishi, K.; Tsuji, M.; Miwa, A.; Miyata, S. Histological influence on contrast-enhanced CT of pancreatic ductal adenocarcinoma. J. Comput. Assist. Tomogr. 1997, 21, 980–985. [Google Scholar] [CrossRef]


| RPC (n = 159) | BRPC/LAPC (n = 139) | Total (n = 298) | p-Value | |
|---|---|---|---|---|
| Age (years) * | 65.8 ± 10.9 | 63.2 ± 10.6 | 64.6 ± 10.8 | 0.390 |
| Male | 93 (58.5%) | 78 (56.1%) | 171 (57.4%) | 0.767 |
| BMI (kg/cm2) * | 22.6 ± 3.2 | 22.3 ± 2.7 | 22.5 ± 3.0 | 0.326 |
| CA 19-9 (U/mL) | 495.2 ± 1046.5 | 1157.5 ± 2783.0 | 804.1 ± 2071.4 | 0.009 |
| Tumor location, n (%) | ||||
| Head or neck | 113 (71.1%) | 84 (60.4%) | 197 (66.1%) | 0.070 |
| Body or tail | 46 (28.9%) | 55 (39.6%) | 101 (33.9%) | |
| Tumor size (mm) * | 33.6 ± 13.5 | 36.6 ± 14.2 | 35.0 ± 13.9 | 0.070 |
| T-stage, n (%) | ||||
| T1 (≤2 cm) | 17 (10.7%) | 8 (5.8%) | 25 (8.4%) | 0.039 |
| T2 (2–4 cm) | 109 (68.6%) | 86 (61.9%) | 195 (65.4%) | |
| T3 (>4 cm) | 33 (20.8%) | 45 (32.4%) | 78 (26.2%) | |
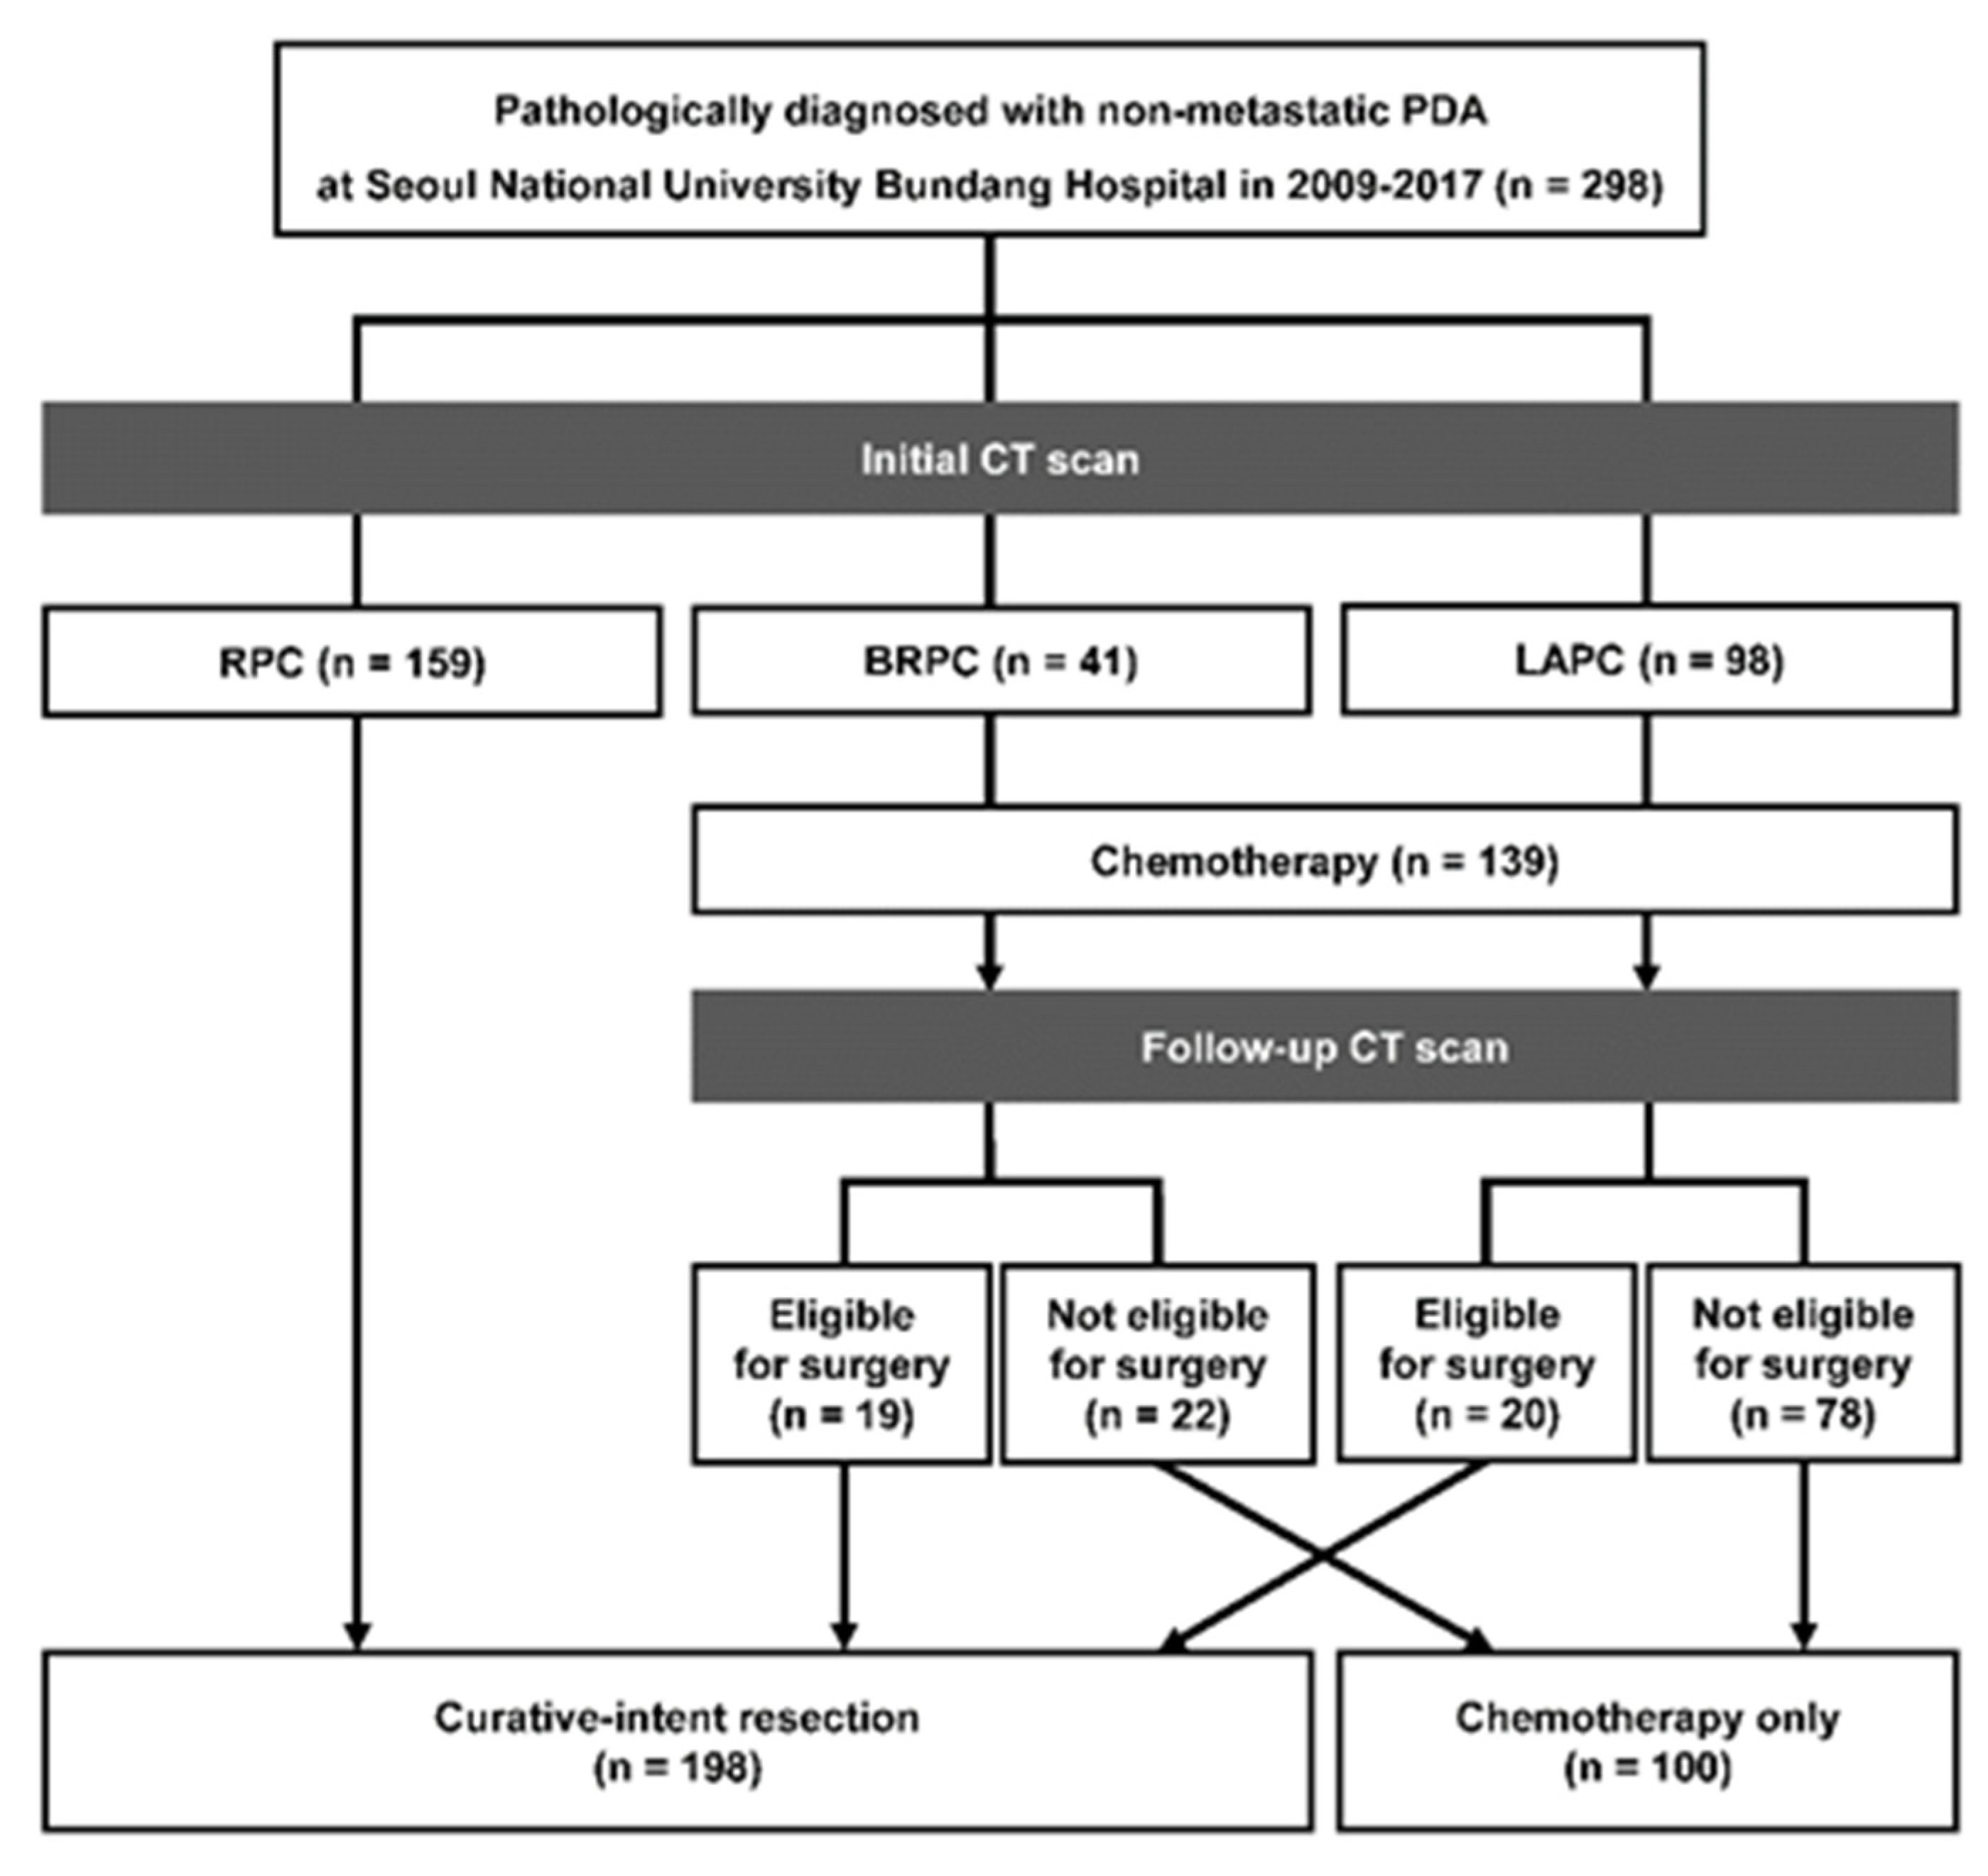
| Intra-tumoral attenuation values | ||||
| UP (HU) *# | 37.3 ± 6.9 | 35.8 ± 7.7 | 36.6 ± 7.3 | 0.078 |
| PPP (HU) *# | 94.5 ± 27.5 | 60.7 ± 19.6 | 78.8 ± 29.4 | <0.001 |
| PVP (HU) *# | 101.5 ± 27.5 | 75.5 ± 25.9 | 89.4 ± 29.7 | <0.001 |
| RPC (n = 159) | BRPC/LAPC (n = 139) | |||||||
|---|---|---|---|---|---|---|---|---|
| Subgroups | Patients (%) | Median OS (95% CI) (mo.) | p-Value | Subgroups | Patients (%) | Median OS (95% CI) (mo.) | p-Value | |
| Initial CT | ||||||||
| PPP | <92.8 HU | 76 (47.8%) | 15.4 (11.0–19.8) | <0.001 | <84.9 HU | 122 (87.8%) | 13.6 (10.9–16.4) | 0.024 |
| ≥92.8 HU | 83 (52.2%) | 27.9 (21.7–34.0) | ≥84.9 HU | 17 (12.2%) | 22.7 (17.6–27.8) | |||
| PVP | <99.8 HU | 58 (36.5%) | 15.4 (10.0–20.8) | <0.001 | <101.0 HU | 119 (85.6%) | 13.6 (10.8–16.4) | 0.050 |
| ≥99.8 HU | 101 (63.5%) | 25.5 (20.0–31.0) | ≥101.0 HU | 20 (14.4%) | 21.6 (18.4–24.8) | |||
| Follow-up CT | ||||||||
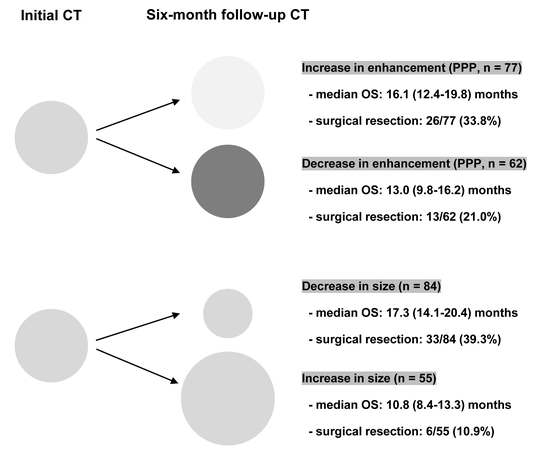
| PPP | NA | NA | NA | NA | <48.6 HU | 35 (25.2%) | 8.9 (5.0–12.9) | 0.007 |
| NA | NA | NA | NA | ≥48.6 HU | 104 (74.8%) | 16.1 (12.9–19.3) | ||
| PVP | NA | NA | NA | NA | <52.0 HU | 22 (15.8%) | 6.8 (4.0–9.7) | <0.001 |
| NA | NA | NA | NA | ≥52.0 HU | 117 (84.2%) | 16.1 (12.4–19.8) | ||
| Subgroup | Patients (%) | Median OS (95% CI) (Months) | p-Value | Univariate Analysis | Multivariate Analysis | |||
|---|---|---|---|---|---|---|---|---|
| HR (95% CI) | p-Value | aHR (95% CI) | p-Value | |||||
| Sex | Male | 93 (58.5%) | 20.5 (16.8–24.2) | 0.349 | 1 (reference) | 0.350 | - | - |
| Female | 66 (41.5%) | 23.5 (13.9–33.0) | 0.829 (0.560–1.228) | - | - | |||
| CA 19-9 | <37 U/mL | 40 (25.2%) | 23.3 (8.4–38.3)) | 0.260 | 1 (reference) | 0.748 | - | - |
| ≥37 U/mL | 119 (74.8%) | 21.9 (17.5–26.3) | 1.300 (0.823–2.053) | - | - | |||
| Tumor location | Head, neck | 113 (71.1%) | 22.6 (18.0–27.2) | 0.606 | 1 (reference) | 0.606 | - | - |
| Body, tail | 46 (28.9%) | 21.3 (11.8–30.8) | 1.117 (0.733–1.701) | - | - | |||
| Tumor size | T1 (≤ 2 cm) | 17 (10.7%) | 49.3 (35.7–62.9) | <0.001 | 1 (reference) | 1 (reference) | ||
| T2 (2–4 cm) | 109 (68.6%) | 22.7 (17.9–27.5) | 2.254 (1.033–4.919) | 0.041 | 1.870 (0.851–4.112) | 0.119 | ||
| T3 (>4 cm) | 33 (20.8%) | 14.4 (9.7–19.1) | 4.955 (2.157–11.383) | <0.001 | 4.050 (1.750–9.376) | <0.001 | ||
| UP | <29.1 HU | 16 (10.1%) | 16.9 (5.1–28.8) | 0.116 | 1 (reference) | 0.899 | - | - |
| ≥29.1 HU | 143 (89.9%) | 22.7 (18.2–27.2) | 0.646 (0.373–1.119) | - | - | |||
| PPP | <92.8 HU | 76 (47.8%) | 15.4 (11.0–19.8) | <0.001 | 1 (reference) | <0.001 | 1 (reference) | <0.001 |
| ≥92.8 HU | 83 (52.2%) | 27.9 (21.7–34.0) | 0.445 (0.301–0.657) | 0.487 (0.328–0.722) | ||||
| PVP | <99.8 HU | 58 (36.5%) | 15.4 (10.0–20.8) | <0.001 | 1 (reference) | <0.001 | 1 (reference) | 0.918 |
| ≥99.8 HU | 101 (63.5%) | 25.5 (20.0–31.0) | 0.500 (0.339–0.738) | 0.970 (0.539–1.745) | ||||
| Subgroup | Patients (%) | Median OS (95% CI) (mo.) | p-Value | Univariate Analysis | Multivariate Analysis | |||
|---|---|---|---|---|---|---|---|---|
| HR (95% CI) | p-Value | aHR (95% CI) | p-Value | |||||
| Sex | Male | 78 (56.1%) | 13.6 (10.6–16.7) | 0.197 | 1 (reference) | 0.199 | ||
| Female | 61 (43.9%) | 15.7 (12.4–19.1) | 0.768 (0.513–1.149) | |||||
| CA 19-9 | <37 U/mL | 30 (21.6%) | 21.5 (10.5–32.6) | 0.280 | 1 (reference) | 0.282 | ||
| ≥37 U/mL | 109 (78.4%) | 13.8 (11.2–16.3) | 1.301 (0.806–2.100) | |||||
| Tumor location | Head, neck | 84 (60.4%) | 13.6 (10.5–16.8) | 0.344 | 1 (reference) | 0.345 | ||
| Body, tail | 55 (39.6%) | 16.1 (12.5–19.7) | 0.822 (0.547–1.235) | |||||
| Tumor size | T1 (≤ 2 cm) | 8 (5.8%) | 42.3 (20.1–64.5) | 0.009 | 1 (reference) | 1 (reference) | ||
| T2 (2–4 cm) | 86 (61.9%) | 16.5 (14.5–18.5) | 2.138 (0.658–6.945) | 0.206 | 2.198 (0.676–7.146) | 0.190 | ||
| T3 (>4 cm) | 45 (32.4%) | 11.4 (7.9–14.8) | 3.633 (1.100–12.000) | 0.034 | 3.335 (1.007–11.039) | 0.049 | ||
| UP | <30.5 HU | 31 (22.3%) | 12.3 (9.5–15.1) | 0.346 | 1 (reference) | 0.347 | ||
| ≥30.5 HU | 108 (77.7%) | 15.2 (12.9–17.4) | 0.802 (0.506–1.271) | |||||
| PPP | <84.9 HU | 122 (87.8%) | 13.6 (10.9–16.4) | 0.024 | 1 (reference) | 0.029 | 1 (reference) | 0.009 |
| ≥84.9 HU | 17 (12.2%) | 22.7 (17.6–27.8) | 0.425 (0.197–0.916) | 0.497 (0.226–0.950) | ||||
| PVP | <101.0 HU | 119 (85.6%) | 13.6 (10.8–16.4) | 0.050 | 1 (reference) | 0.054 | ||
| ≥101.0 HU | 20 (14.4%) | 21.6 (18.4–24.8) | 0.540 (0.288–1.011) | |||||
Publisher’s Note: MDPI stays neutral with regard to jurisdictional claims in published maps and institutional affiliations. |
© 2022 by the authors. Licensee MDPI, Basel, Switzerland. This article is an open access article distributed under the terms and conditions of the Creative Commons Attribution (CC BY) license (https://creativecommons.org/licenses/by/4.0/).
Share and Cite
Shin, D.W.; Park, J.; Lee, J.-C.; Kim, J.; Kim, Y.H.; Hwang, J.-H. Multi-Phase, Contrast-Enhanced Computed Tomography-Based Radiomic Prognostic Marker of Non-Metastatic Pancreatic Ductal Adenocarcinoma. Cancers 2022, 14, 2476. https://0-doi-org.brum.beds.ac.uk/10.3390/cancers14102476
Shin DW, Park J, Lee J-C, Kim J, Kim YH, Hwang J-H. Multi-Phase, Contrast-Enhanced Computed Tomography-Based Radiomic Prognostic Marker of Non-Metastatic Pancreatic Ductal Adenocarcinoma. Cancers. 2022; 14(10):2476. https://0-doi-org.brum.beds.ac.uk/10.3390/cancers14102476
Chicago/Turabian StyleShin, Dong Woo, Jaewon Park, Jong-Chan Lee, Jaihwan Kim, Young Hoon Kim, and Jin-Hyeok Hwang. 2022. "Multi-Phase, Contrast-Enhanced Computed Tomography-Based Radiomic Prognostic Marker of Non-Metastatic Pancreatic Ductal Adenocarcinoma" Cancers 14, no. 10: 2476. https://0-doi-org.brum.beds.ac.uk/10.3390/cancers14102476