
Development and Validation of the PaP Score Nomogram for Terminally Ill Cancer Patients


1
Unit of Biostatistics and Clinical Trials, IRCCS Istituto Romagnolo per lo Studio dei Tumori (IRST) “Dino Amadori”, 47014 Meldola, Italy
2
Medical Oncology Unit, Department of Specialized, Experimental and Diagnostic Medicine (DIMES), University of Bologna, 40126 Bologna, Italy
*
Author to whom correspondence should be addressed.
Cancers 2022, 14(10), 2510; https://0-doi-org.brum.beds.ac.uk/10.3390/cancers14102510
Submission received: 2 April 2022
/
Revised: 12 May 2022
/
Accepted: 16 May 2022
/
Published: 19 May 2022
(This article belongs to the Special Issue Palliative and Supportive Care in Oncology: An Update)
Abstract
:Simple Summary
The Accurate prediction of survival in a palliative care setting is vitally important for clinical, organizational and ethical reasons. Several prognostic tools have been developed to provide reliable estimates of survival in terminally ill cancer patients. We previously developed and validated the Palliative Prognostic (PaP) score, a prognostic tool that assigns patients to three different risk groups according to a 30-day survival probability: group A, >70%; group B, 30–70%; and group C, <30%. As the PaP score does not provide the individual prediction of the survival probability but only probability windows, the present work focuses on the development and validation of the PaP score as a nomogram in order to provide individualized prediction of survival at 15, 30 and 60 days. The nomogram improved the performance of the original PaP score while also maintaining its key feature of simplicity.
Abstract
The validated Palliative Prognostic (PaP) score predicts survival in terminally ill cancer patients, assigning patients to three different risk groups according to a 30-day survival probability: group A, >70%; group B, 30–70%; and group C, <30%. We aimed to develop and validate a PaP nomogram to provide individualized prediction of survival at 15, 30 and 60 days. Three cohorts of consecutive terminally ill cancer patients were used: one (n = 519) for nomogram development and internal validation, and a second (n = 451) and third (n = 549) for external validation. Multivariate analyses included dyspnea, anorexia, Karnofsky performance status, clinical prediction of survival, total white blood count and lymphocyte percentage. The predictive accuracy of the nomogram was determined by Harrell’s concordance index (95% CI), and calibration plots were generated. The nomogram had a concordance index of 0.74 (0.72–0.75) and showed good calibration. The internal validation showed no departures from ideal prediction. The accuracy of the nomogram at 15, 30 and 60 days was 74% (70–77), 89% (85–92) and 72% (68–76) in the external validation cohorts, respectively. The PaP nomogram predicts the individualized estimate of survival and could greatly facilitate clinical care decision-making at the end of life.
Keywords:
cancer patients; end-of-life; hospice; palliative care; prognosis; prognostic score; survival; nomogram1. Introduction
The accurate prediction of survival is part of the overall assessment of cancer patients. Information on prognostic factors is useful for a number of reasons. Prognosis helps when making therapeutic decisions, for example, whether or not to continue chemotherapy, when it is time to refer a patient to a palliative care setting, or which palliative setting seems most appropriate. Prognostic awareness facilitates the patient and the caregivers in care planning and is also useful in performing clinical research. Finally, it has an impact on the quality of “care”, that is, on the appropriate utilization of health care resources [1,2].
Although cancer can follow a variety of paths in the early course of the disease, involving a gradual decline over a period of months or years, prognostication in far advanced cancer is easier because there is usually an accelerated decline in the final weeks of life. The challenge facing clinicians caring for advanced patients is to identify the starting point of the irreversible decline.
Despite the predictable pattern of decline, clinical prediction of survival (CPS) is affected by training, experience, seniority and level of acquaintance with the patient and thus risks being inaccurate and over-optimistic [3,4,5,6,7,8,9]. Glare et al. reported that only 61% of cases presented an expected survival accurate to within 4 weeks of actual survival [7]. CPS is easy to use at the bedside, and its accuracy improves with longitudinal repeated measures. The closer to death CPS is, the more accurate it is. There are no sure differences between different specialties and professions. Several studies have reported that clinical experience is important, but this has not been universally confirmed. CPS is less accurate in young people and during the course of a long doctor/patient relationship [8]. Finally, there is debate about the best method for formulating CPS: the temporal way (how long will this patient live?); or the probabilistic way (what is the probability of survival of this patient in a specific time frame?); or a surprise question (would I be surprised if this patient died in a specific time frame?). In the systematic review by White et al. [10], when clinicians were asked to provide a prognostic estimate, accuracy varied from 23% to 78% and differences between predicted and actual survival ranged from −86 days to +93 days. The authors felt that there was sufficient evidence to say that probabilistic estimates of survival may be slightly more accurate than temporal estimates. Overall, evidence suggested that clinicians’ predictions were frequently inaccurate. An inaccurate, overly optimistic prediction has a number of negative consequences. Without improving survival, the presence of a more aggressive diagnostic–therapeutic attitude leads to an increase in futile approaches, late referrals to palliative care settings, and incorrect use of acute healthcare services.
CPS must be integrated by signs and symptoms/objective prognostic factors (i.e., anorexia, weight loss, trouble swallowing and dry mouth, Body Mass Index, weight-loss, phase angle and systemic inflammatory index, etc.) [11,12,13,14]. Prognostic scores or prognostic tools have been identified to increase the prognostic ability. A recent systematic review identified nine prognostic tools that were different in terms of number of factors (too many factors make their use quite complex), such as needing or not needing a blood sample, or integration or no integration between subjective evaluation and objective factors [15]. Some of the scores have been studied and validated by independent groups other than those that built them [16,17,18,19].
We previously developed a Palliative Prognostic (PaP) score for the survival prediction of terminally ill cancer patients [16,20,21,22]. The PaP score consists of a “weighted” scoring system obtained from multivariable analysis that takes into account 6 independent prognostic factors (Karnofsky performance status, clinical prediction of survival, anorexia, dyspnea, total white blood count (WBC) and lymphocyte percentage) selected from 34 clinical and laboratory parameters. This score was repeatedly validated in independent prospective cohorts of patients [22,23,24,25,26,27]. Total scores are in the range of 0–17.5, and patients were assigned to three different risk groups according to a 30-day survival probability: group A (total score 0–5.5), >70%; group B (total score 5.6–11.0), 30–70%; and group C (total score 11.1–17.5), <30. Higher scores predict shorter survival.
With the aim of converting the prognostic categories into meaningful clinical information, we decided to develop a PaP score nomogram. Nomograms are graphical depictions of predictive statistical models for individual patients. They have been developed for various diseases and have shown consistently better performance characteristics than other options [28]. Nomograms also provide a user-friendly interface that does not require computer software for interpretation/prediction [29].
The aim of the present paper was to develop and validate PaP nomogram to provide an individualized prediction of survival of terminally ill cancer patients at 15, 30 and 60 days.
We hypothesized that the application of routinely available survival predictors for terminally ill cancer patients in a nomogram setting could yield prognostic estimates with higher degrees of precision that the original PaP score.
2. Materials and Methods
2.1. Participants
The original study on the PaP score was conducted on a multicenter Italian cohort of 519 prospectively and consecutively recruited terminally ill cancer patients [16], and this population was used for the development and internal validation of the nomogram. All were adult patients with advanced phase solid tumors, for whom antiblastic therapy was no longer indicated. Palliative hormonal treatment and palliative radiotherapy patients were admitted, whereas patients with renal neoplasms, multiple myeloma and lymphatic pathologies were excluded from the study. Two multicenter Italian validation cohorts were used with the same selection criteria [22,27].
2.2. Procedure and Instruments
The PaP score was obtained from a Weibull multivariate regression model, including 6 independent variables (Karnofsky performance status score, CPS, anorexia, dyspnea, total WBC count and lymphocyte percentage), chosen after a backward selection procedure from a set of 34 biological and clinical factors. Each variable is allotted a “partial score” related to the size of the regression coefficient. The sum of the partial scores produced the PaP total score, ranging from 0 to 17.5, and patients were assigned to three different risk groups (A, B and C) according to different 30-day survival probability (Table 1). Higher scores predict shorter survival.
The patients had blood drawn within one week of the PaP score evaluation.
The PaP score was completed on the first day of admission to hospice by the physician.
2.3. Statistical Analysis
A nomogram was established on the basis of the results of multivariate analysis using SAS Statistical software version 9.4 (SAS Institute, Cary, NC, USA) and R version 4.0.5 (R Foundation for Statistical Computing, Vienna, Austria; http://www.r-project.org/, accessed on 2 April 2022).
The usefulness of a nomogram is that it maps the predicted probabilities onto points on a scale from 0 to 10 in a user-friendly graphical interface. The total number of points accumulated by the various covariates corresponds to the predicted probability for a patient. The discriminating ability of the PaP score nomogram was assessed using Harrell’s C-index for censored data [30], and the bootstrap method was used to account for possible over-fitting. C-index is a discrimination measure corresponding to the non-parametric estimate of the area under the receiver operating characteristic curve and can vary from 0.5 (no discrimination) to 1.0 (perfect discrimination).
Calibration plots were generated to explore the performance characteristics of the nomogram at 15, 30 and 60 days, comparing nomogram-predicted survival probability with observed Kaplan–Meier estimates.
The PaP score nomogram was externally validated using two independent cohorts of 451 and 549 terminally ill cancer patients, consecutively entered into hospice programs with the same characteristics (validation cohorts) used to validate the original PaP score [22,27].
The total number of points for each patient in the validation cohort was calculated according to the formulated nomogram. The endpoint was the overall survival (OS), defined as the time from the date of enrollment in the study to the date of death from any cause or the date of the last available information. Survival curves were estimated by the product-limit method of Kaplan–Meier.
The survival database of development and validation cohorts (survival time, status and total PaP score) is available (Table S1).
3. Results
The detailed characteristics of patients in the development and validation cohorts were previously reported [16,22,27], and the three cohorts were similar with respect to all variables. Median age was 67 (range 30–92), 70 (range 21–95) and 71 years (range 18–94) for the development cohort and validation cohorts, respectively. Mean age was 66.2 (standard deviation 12.1), 68.6 (standard deviation 12.5) and 68.8 years (standard deviation 13.2) in the same three cohorts.
Both genders were equally represented, and the most frequent primary cancers were gastrointestinal (37%, 38% and 37%), followed by respiratory (19%, 19% and 19%) and genitourinary (15%, 14% and 18%), in the three cohorts, respectively. Of the patients, 69% had locally advanced disease, and the prevalent metastatic sites were viscera (47%), bone (22%), soft tissue (14%) and central nervous system (11%) in the development cohort and 65%, 56%, 27%, 16% and 13% in the validation cohorts, respectively. Palliative hormonal treatment was administered in 71% of the patients.
The PaP scores in the three cohorts are presented in Table 2. The PaP distributions were quantitatively superimposable (34.3%, 28.2% and 33% in group A; 39.5%, 45.7% and 40.4% in group B; and 26.2%, 26.1% and 26.6% in group C) in the development and validation cohorts, respectively.
The median survival was 32 days (95% CI 29–34) for the development cohort. According to the PaP score, median survival times were 64 days in group A (30-day survival probability, 82.0%), 32 days in group B (30-day survival probability, 52.7%) and 11 days in group C (30-day survival probability, 9.6%).
The prognostic nomogram, integrating all the independent prognostic factors of the PaP score derived from the development cohort, is shown in Figure 1.
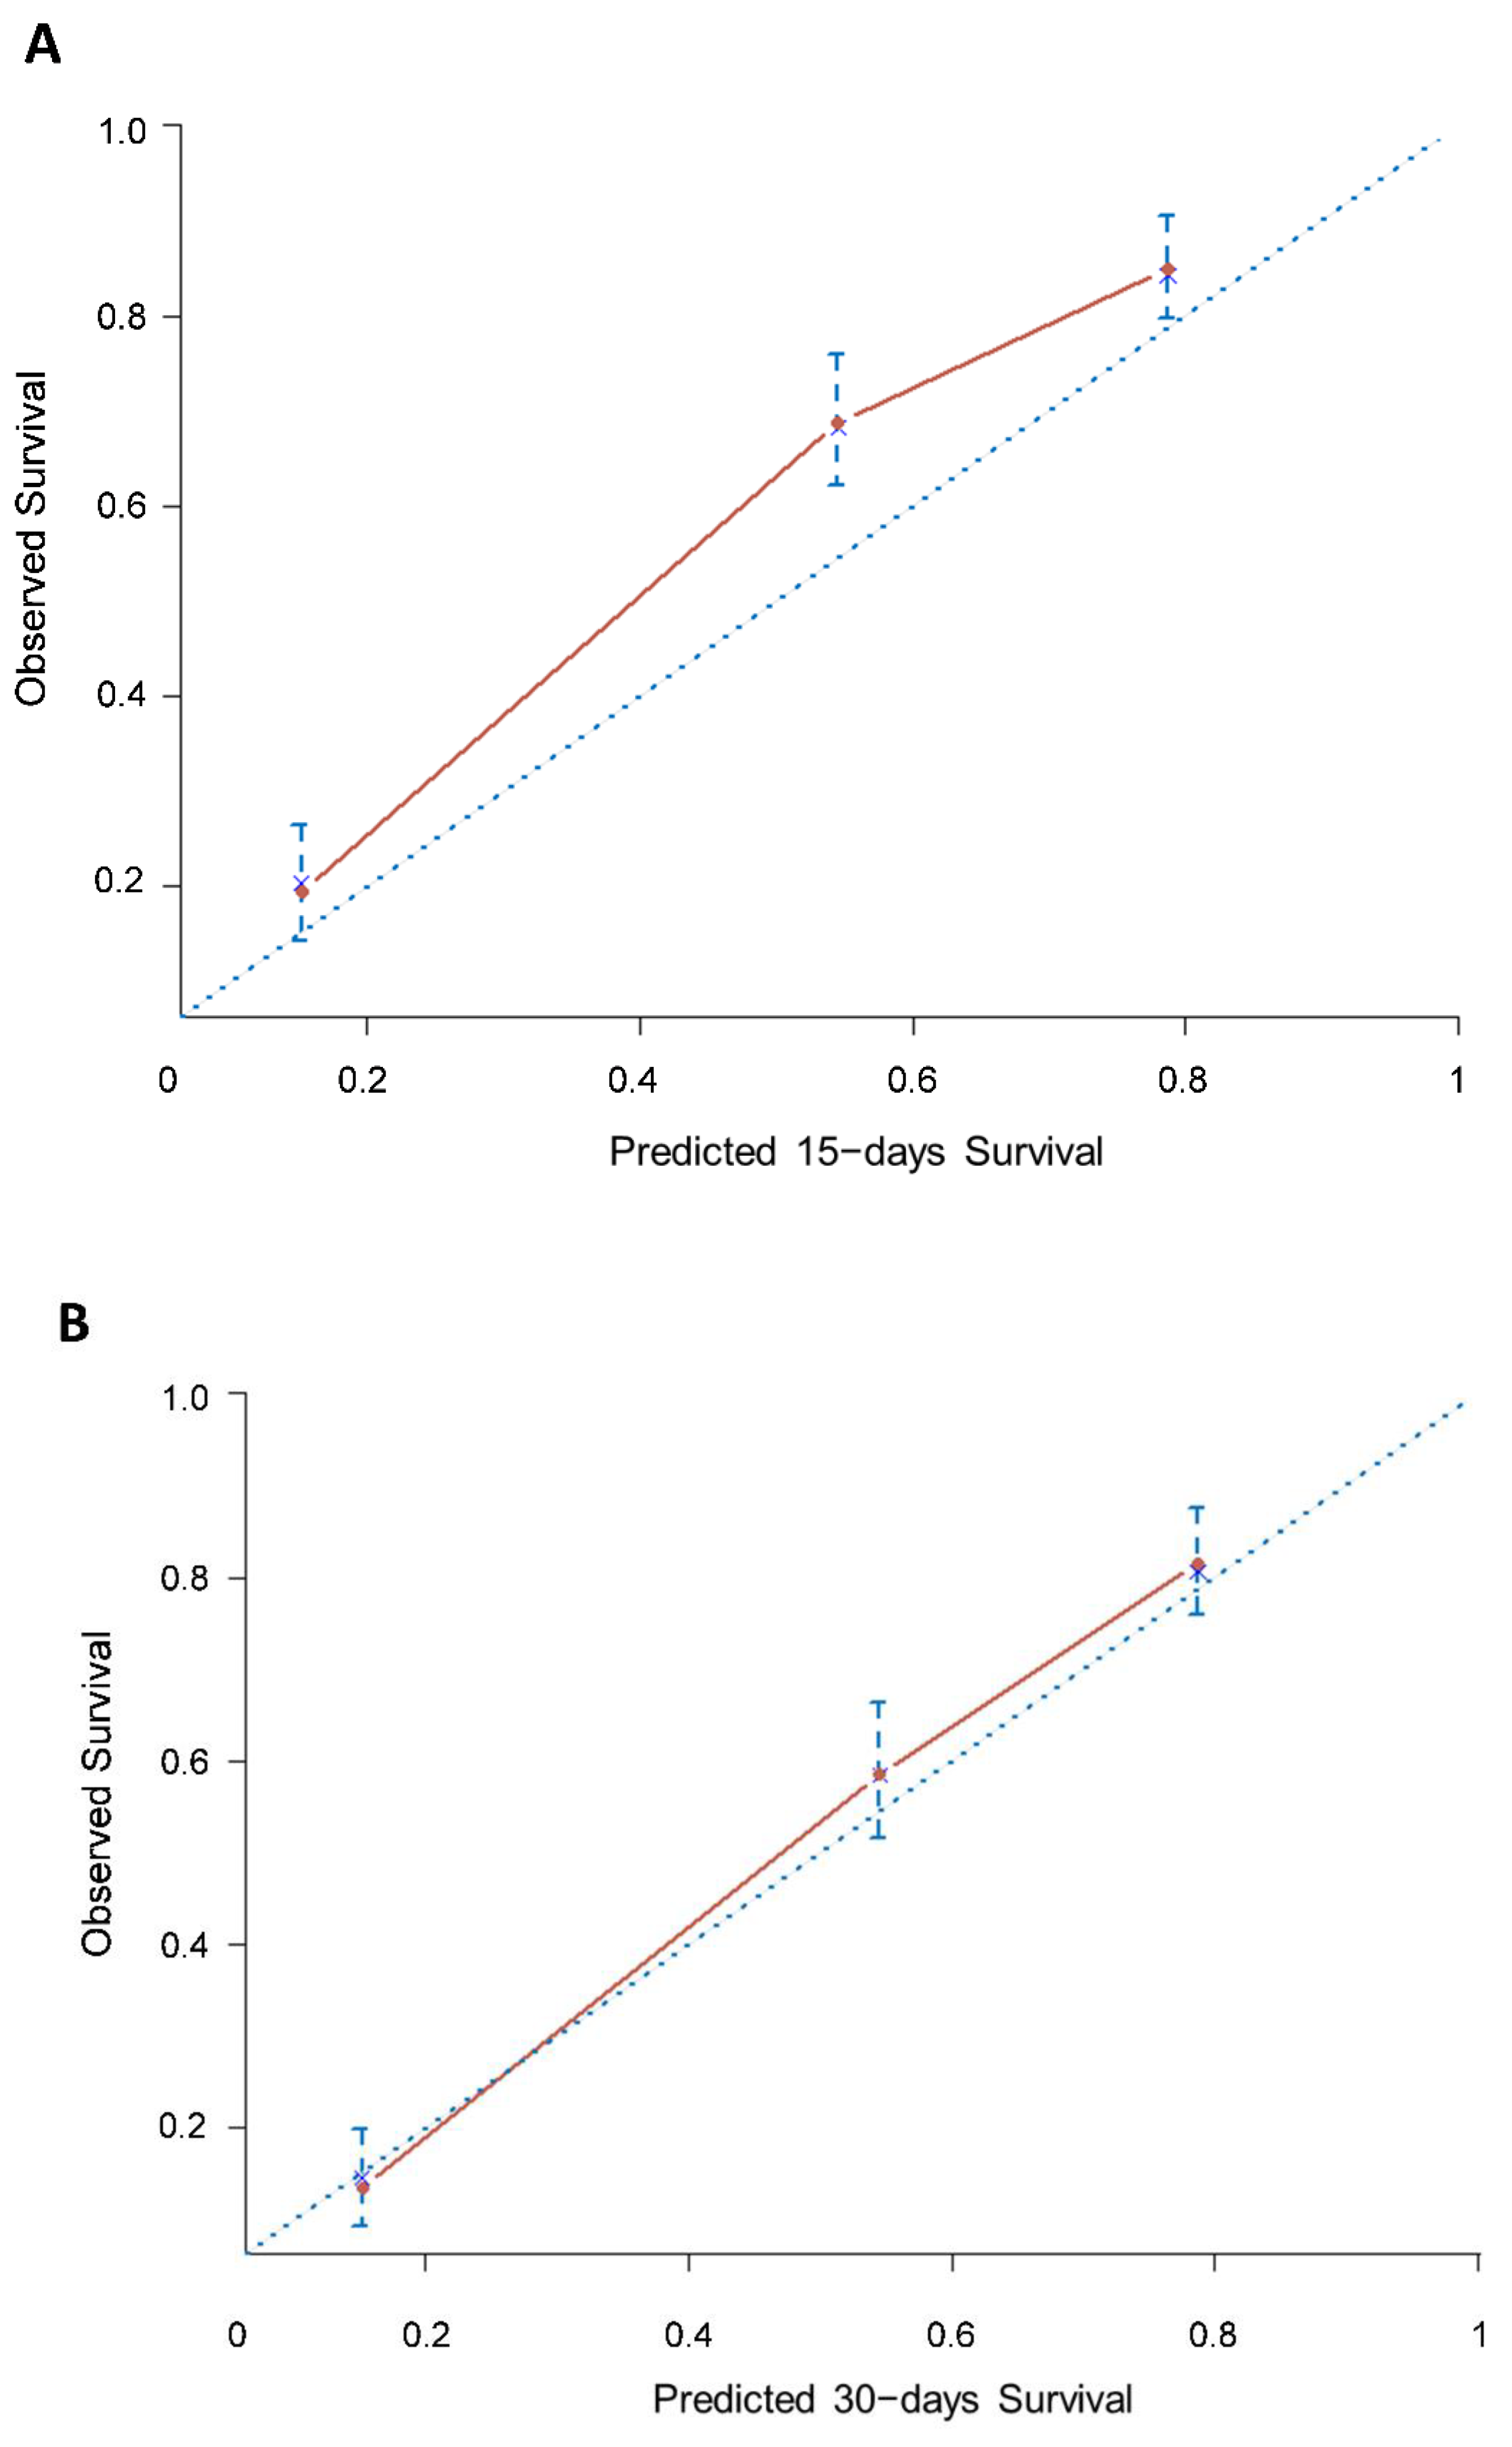
The nomogram had a good predictive performance, with a bootstrapped corrected concordance index of 0.74 (95% CI 0.72–0.75). The calibration plot for the probability of survival showed good consistency between the prediction by the nomogram and actual observation (Figure 2A–C).
Median survival in the validation cohorts was 33 (95% CI 29–37, 451 patients) and 22 days (95% CI 19–24, 549 patients). Median survival times were 76 days in group A (95% CI 67–87), 32 days in group B (95% CI 28–39) and 14 days in group C (95% CI 11–18) for the validation cohort of 451 patients. In the validation cohort of 549 patients, the median OS was 59 days (95% CI 52–72) in group A, 18 days (95% CI 16–22) in group B and 6 days (95% CI 5–7) for group C.
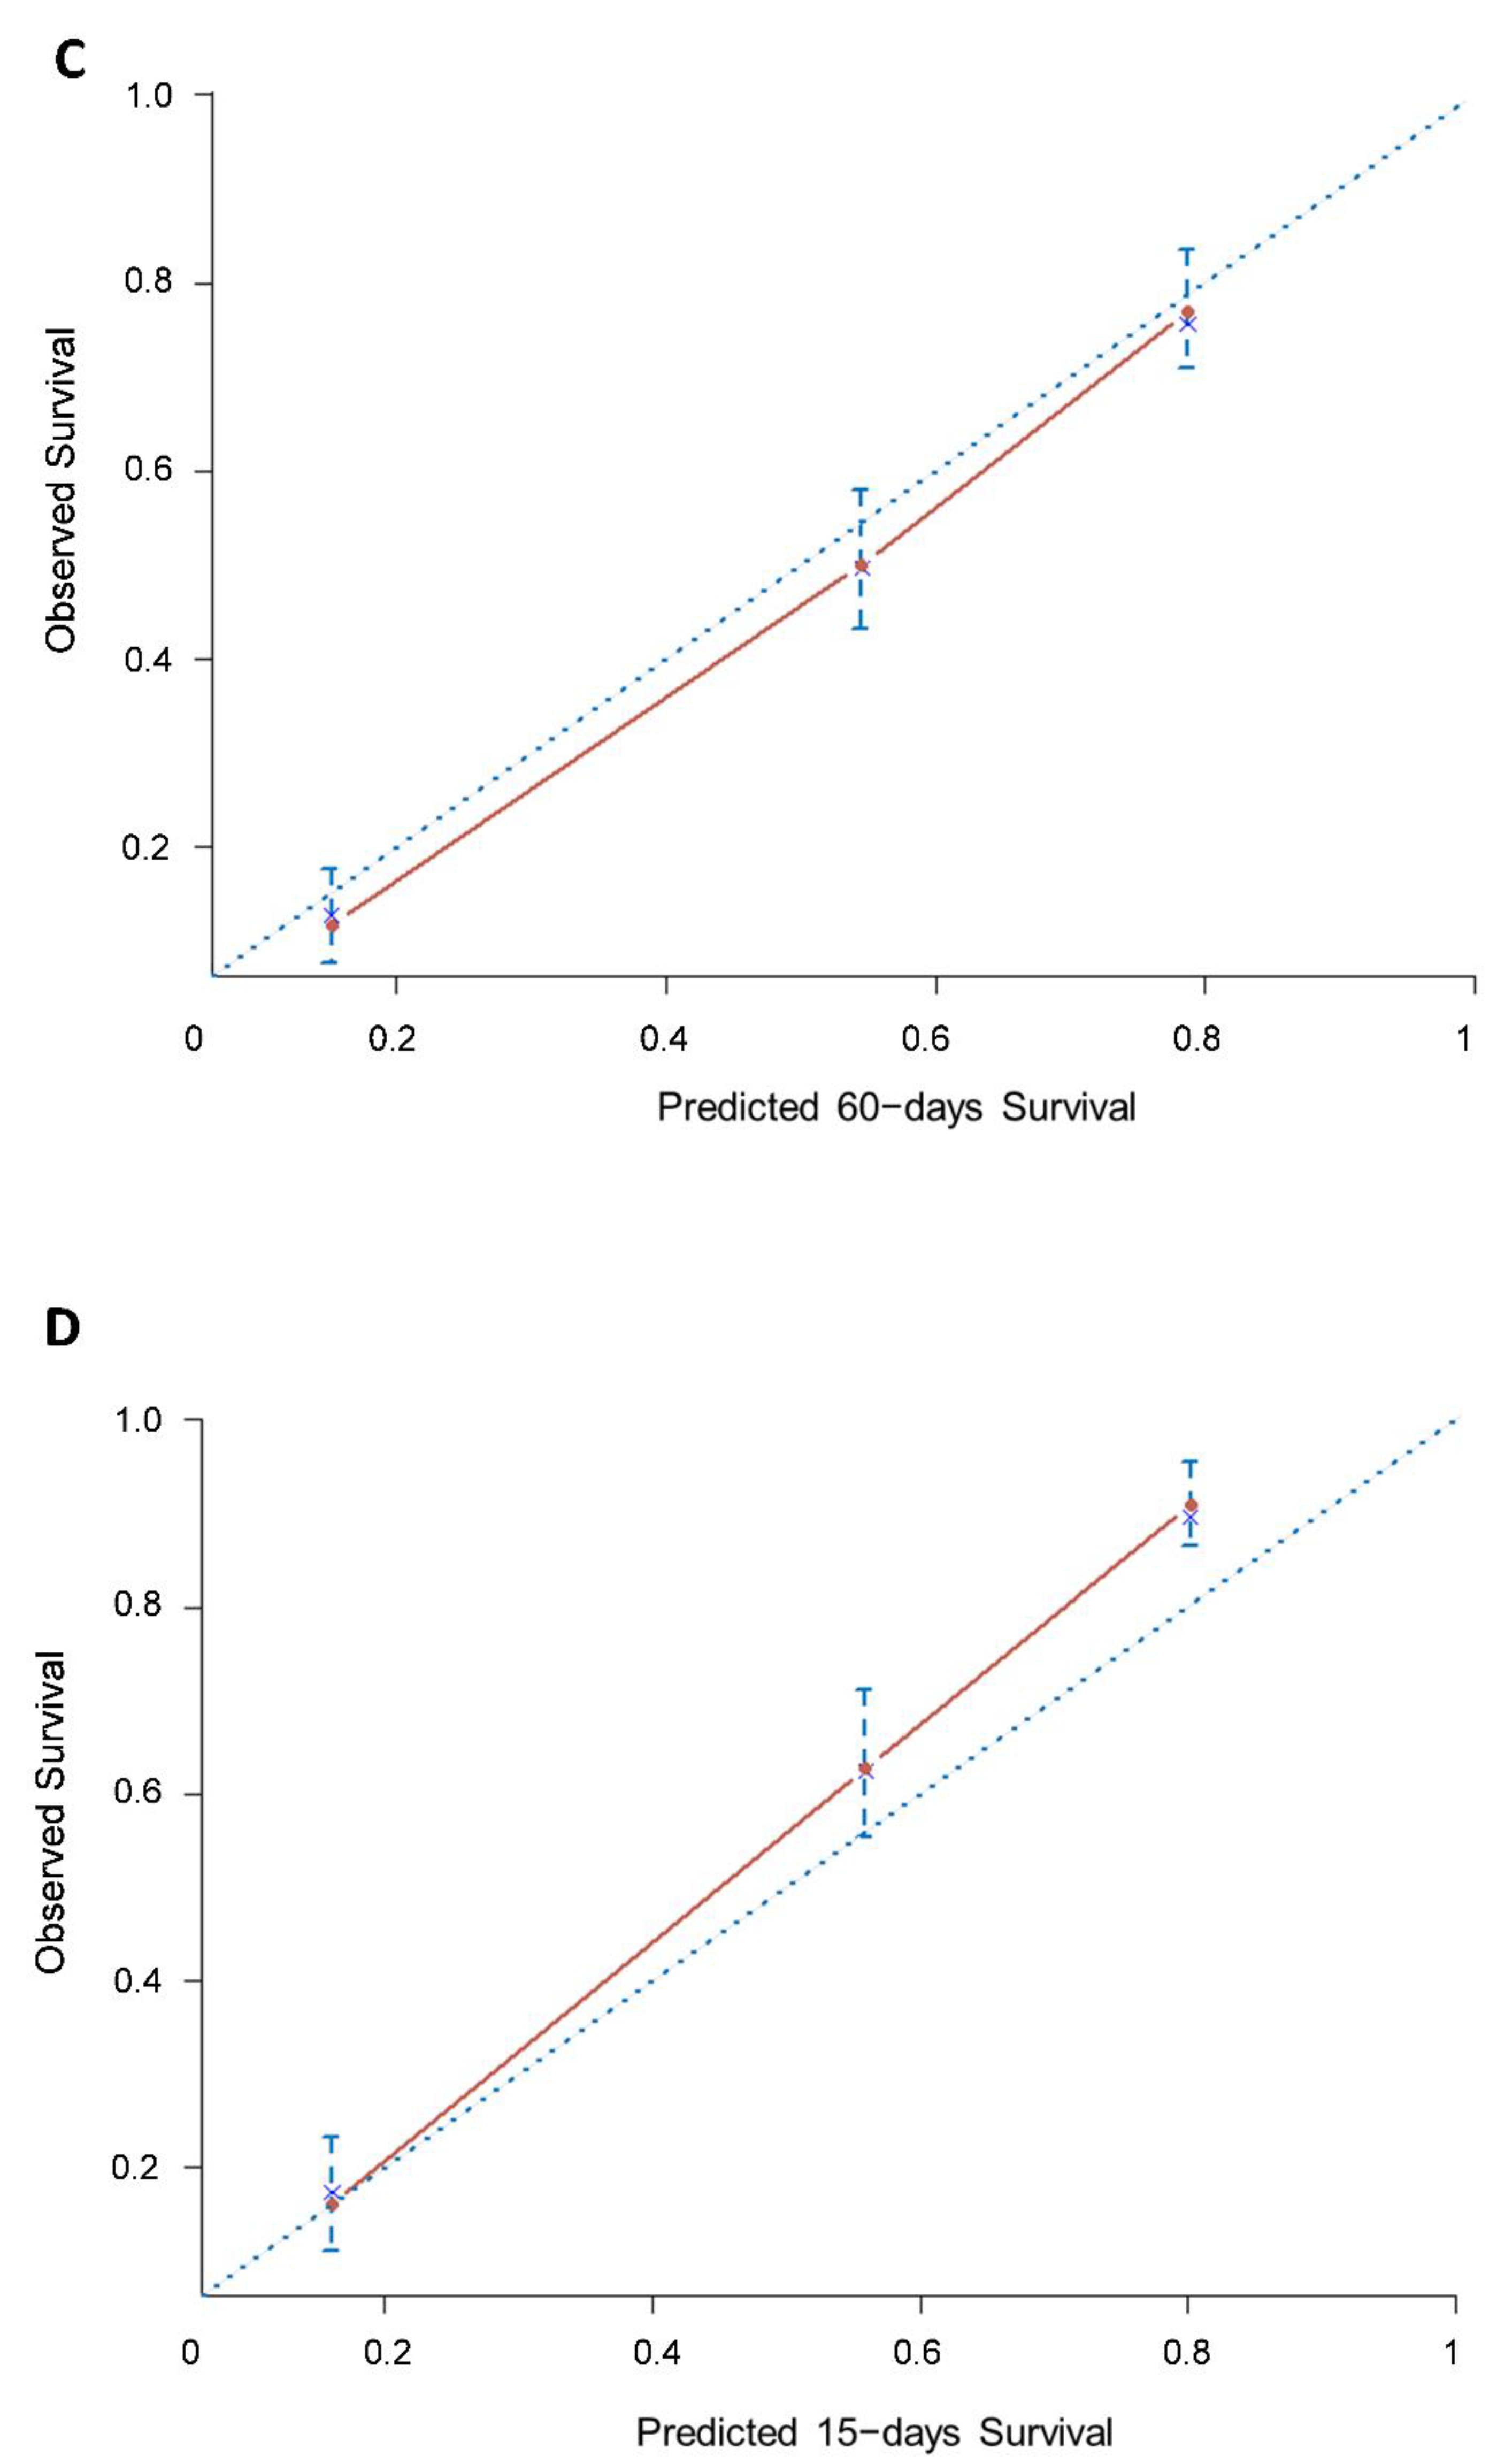
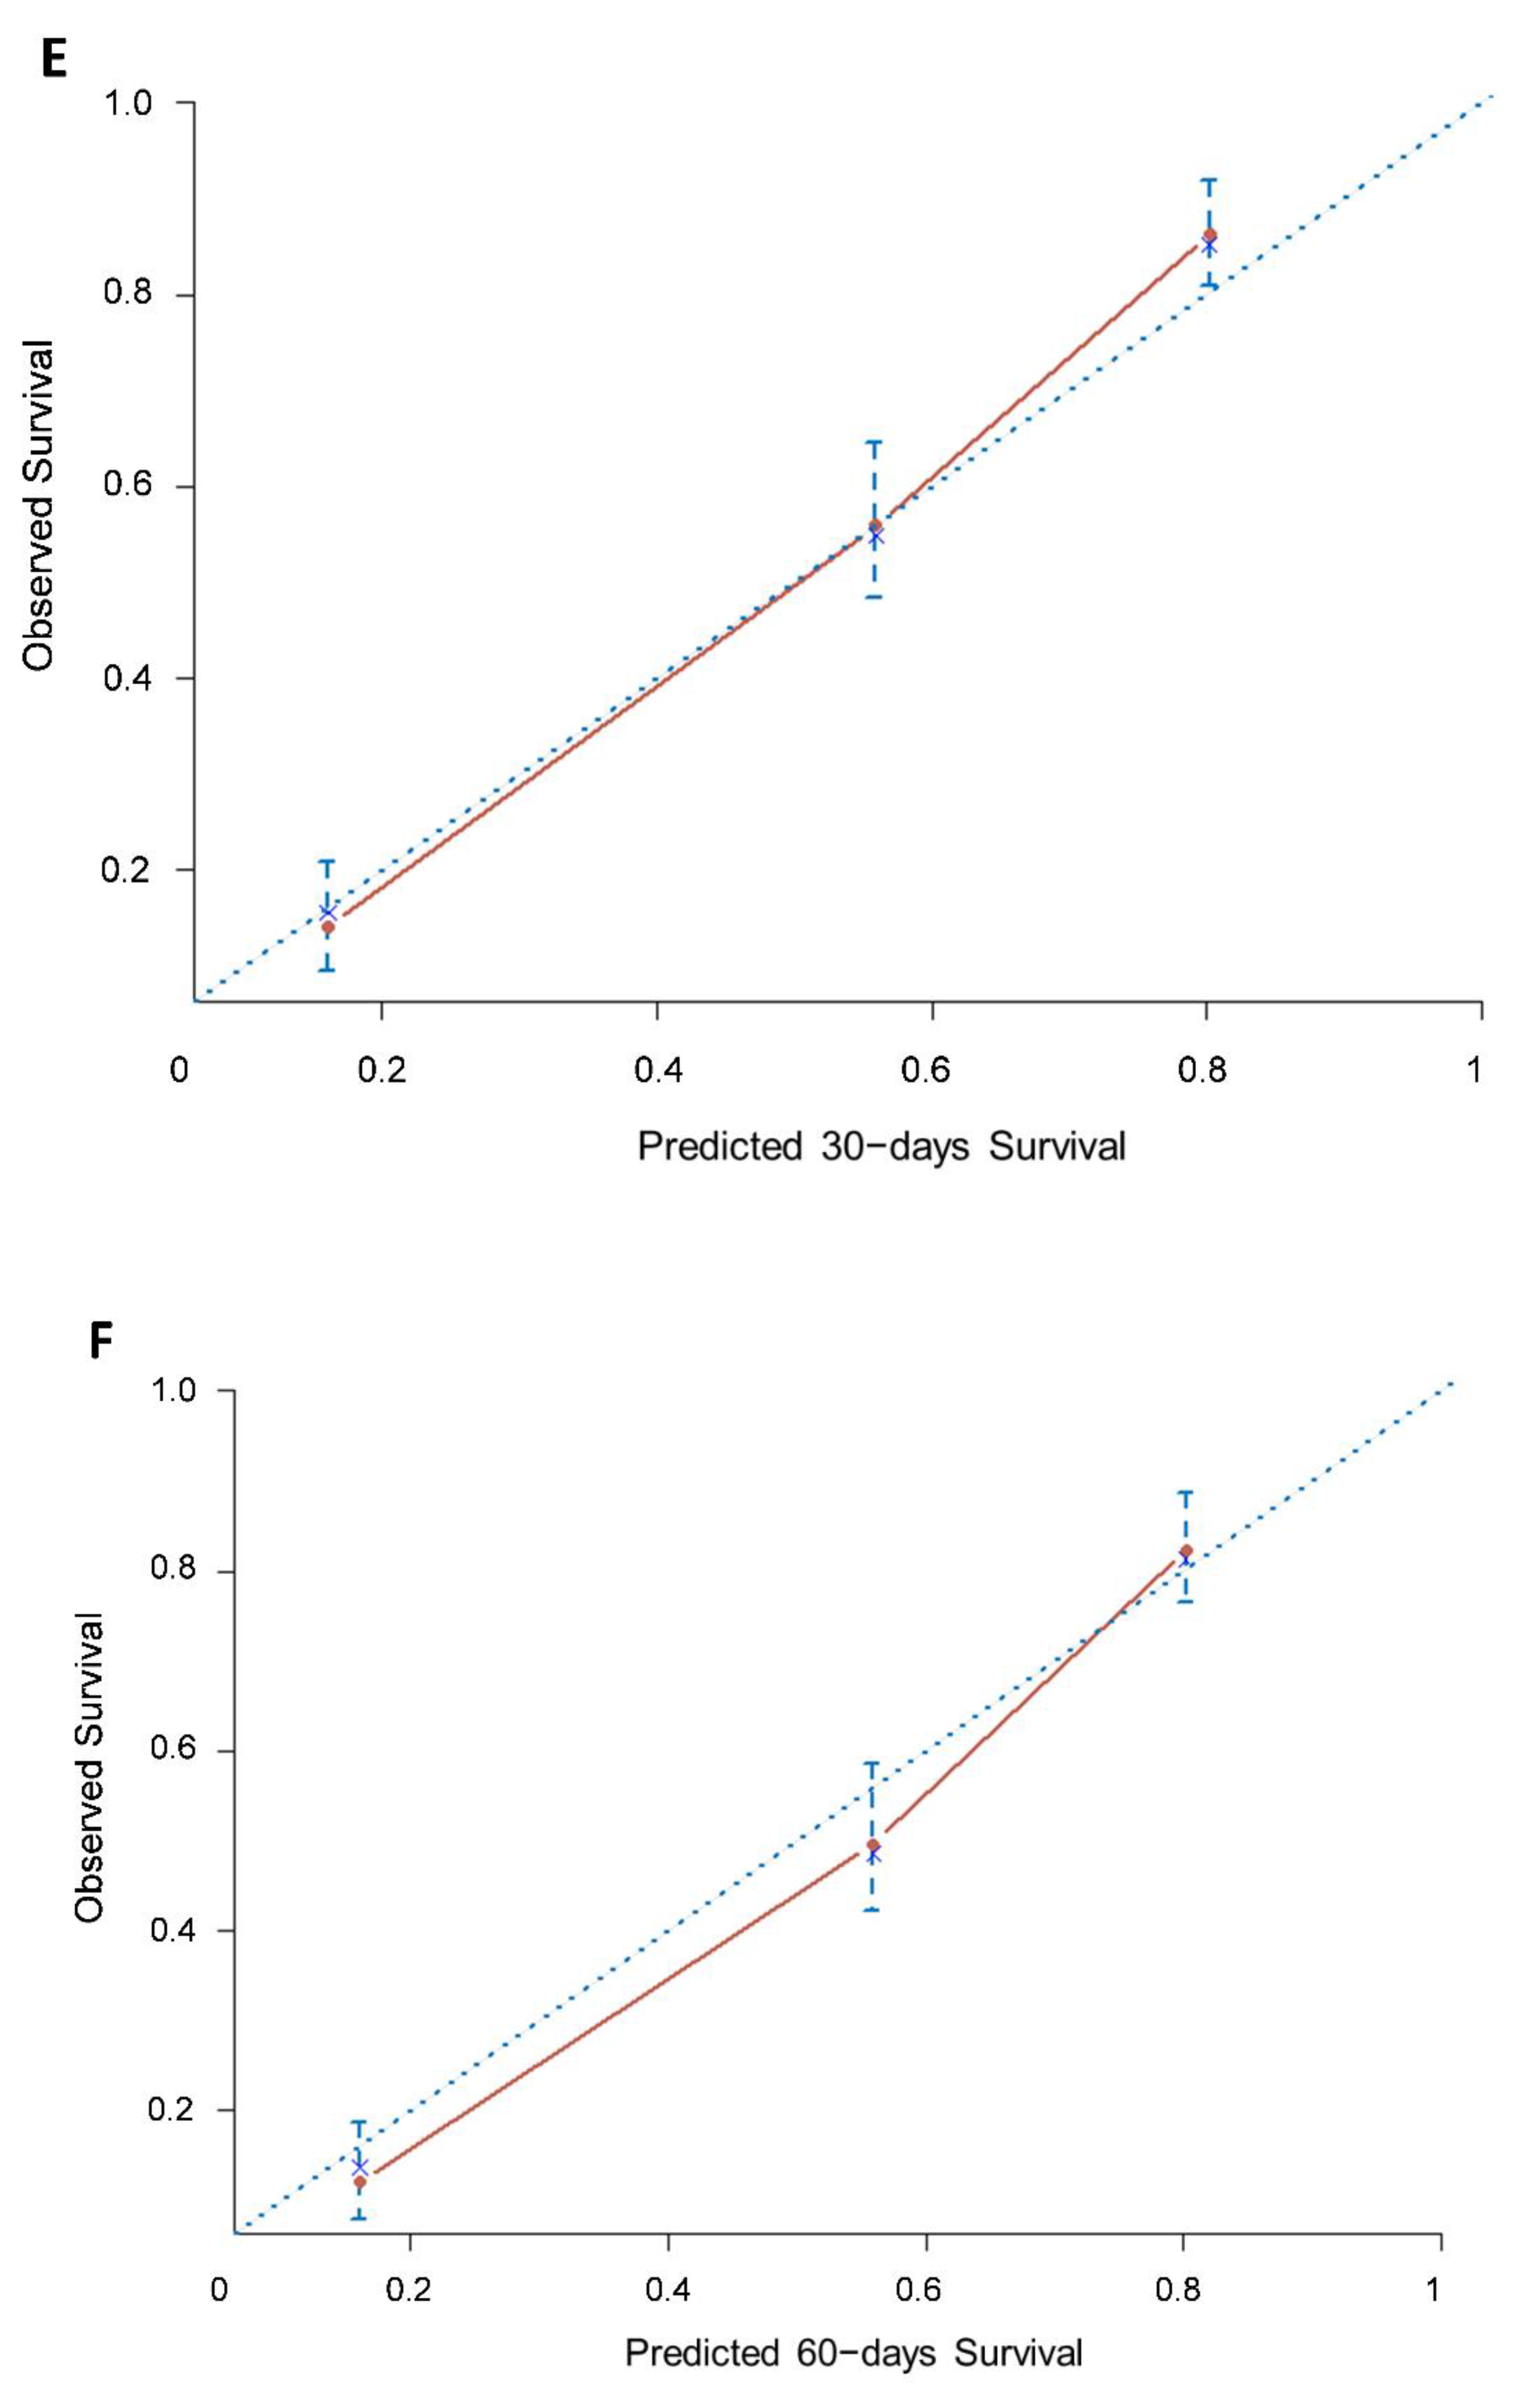
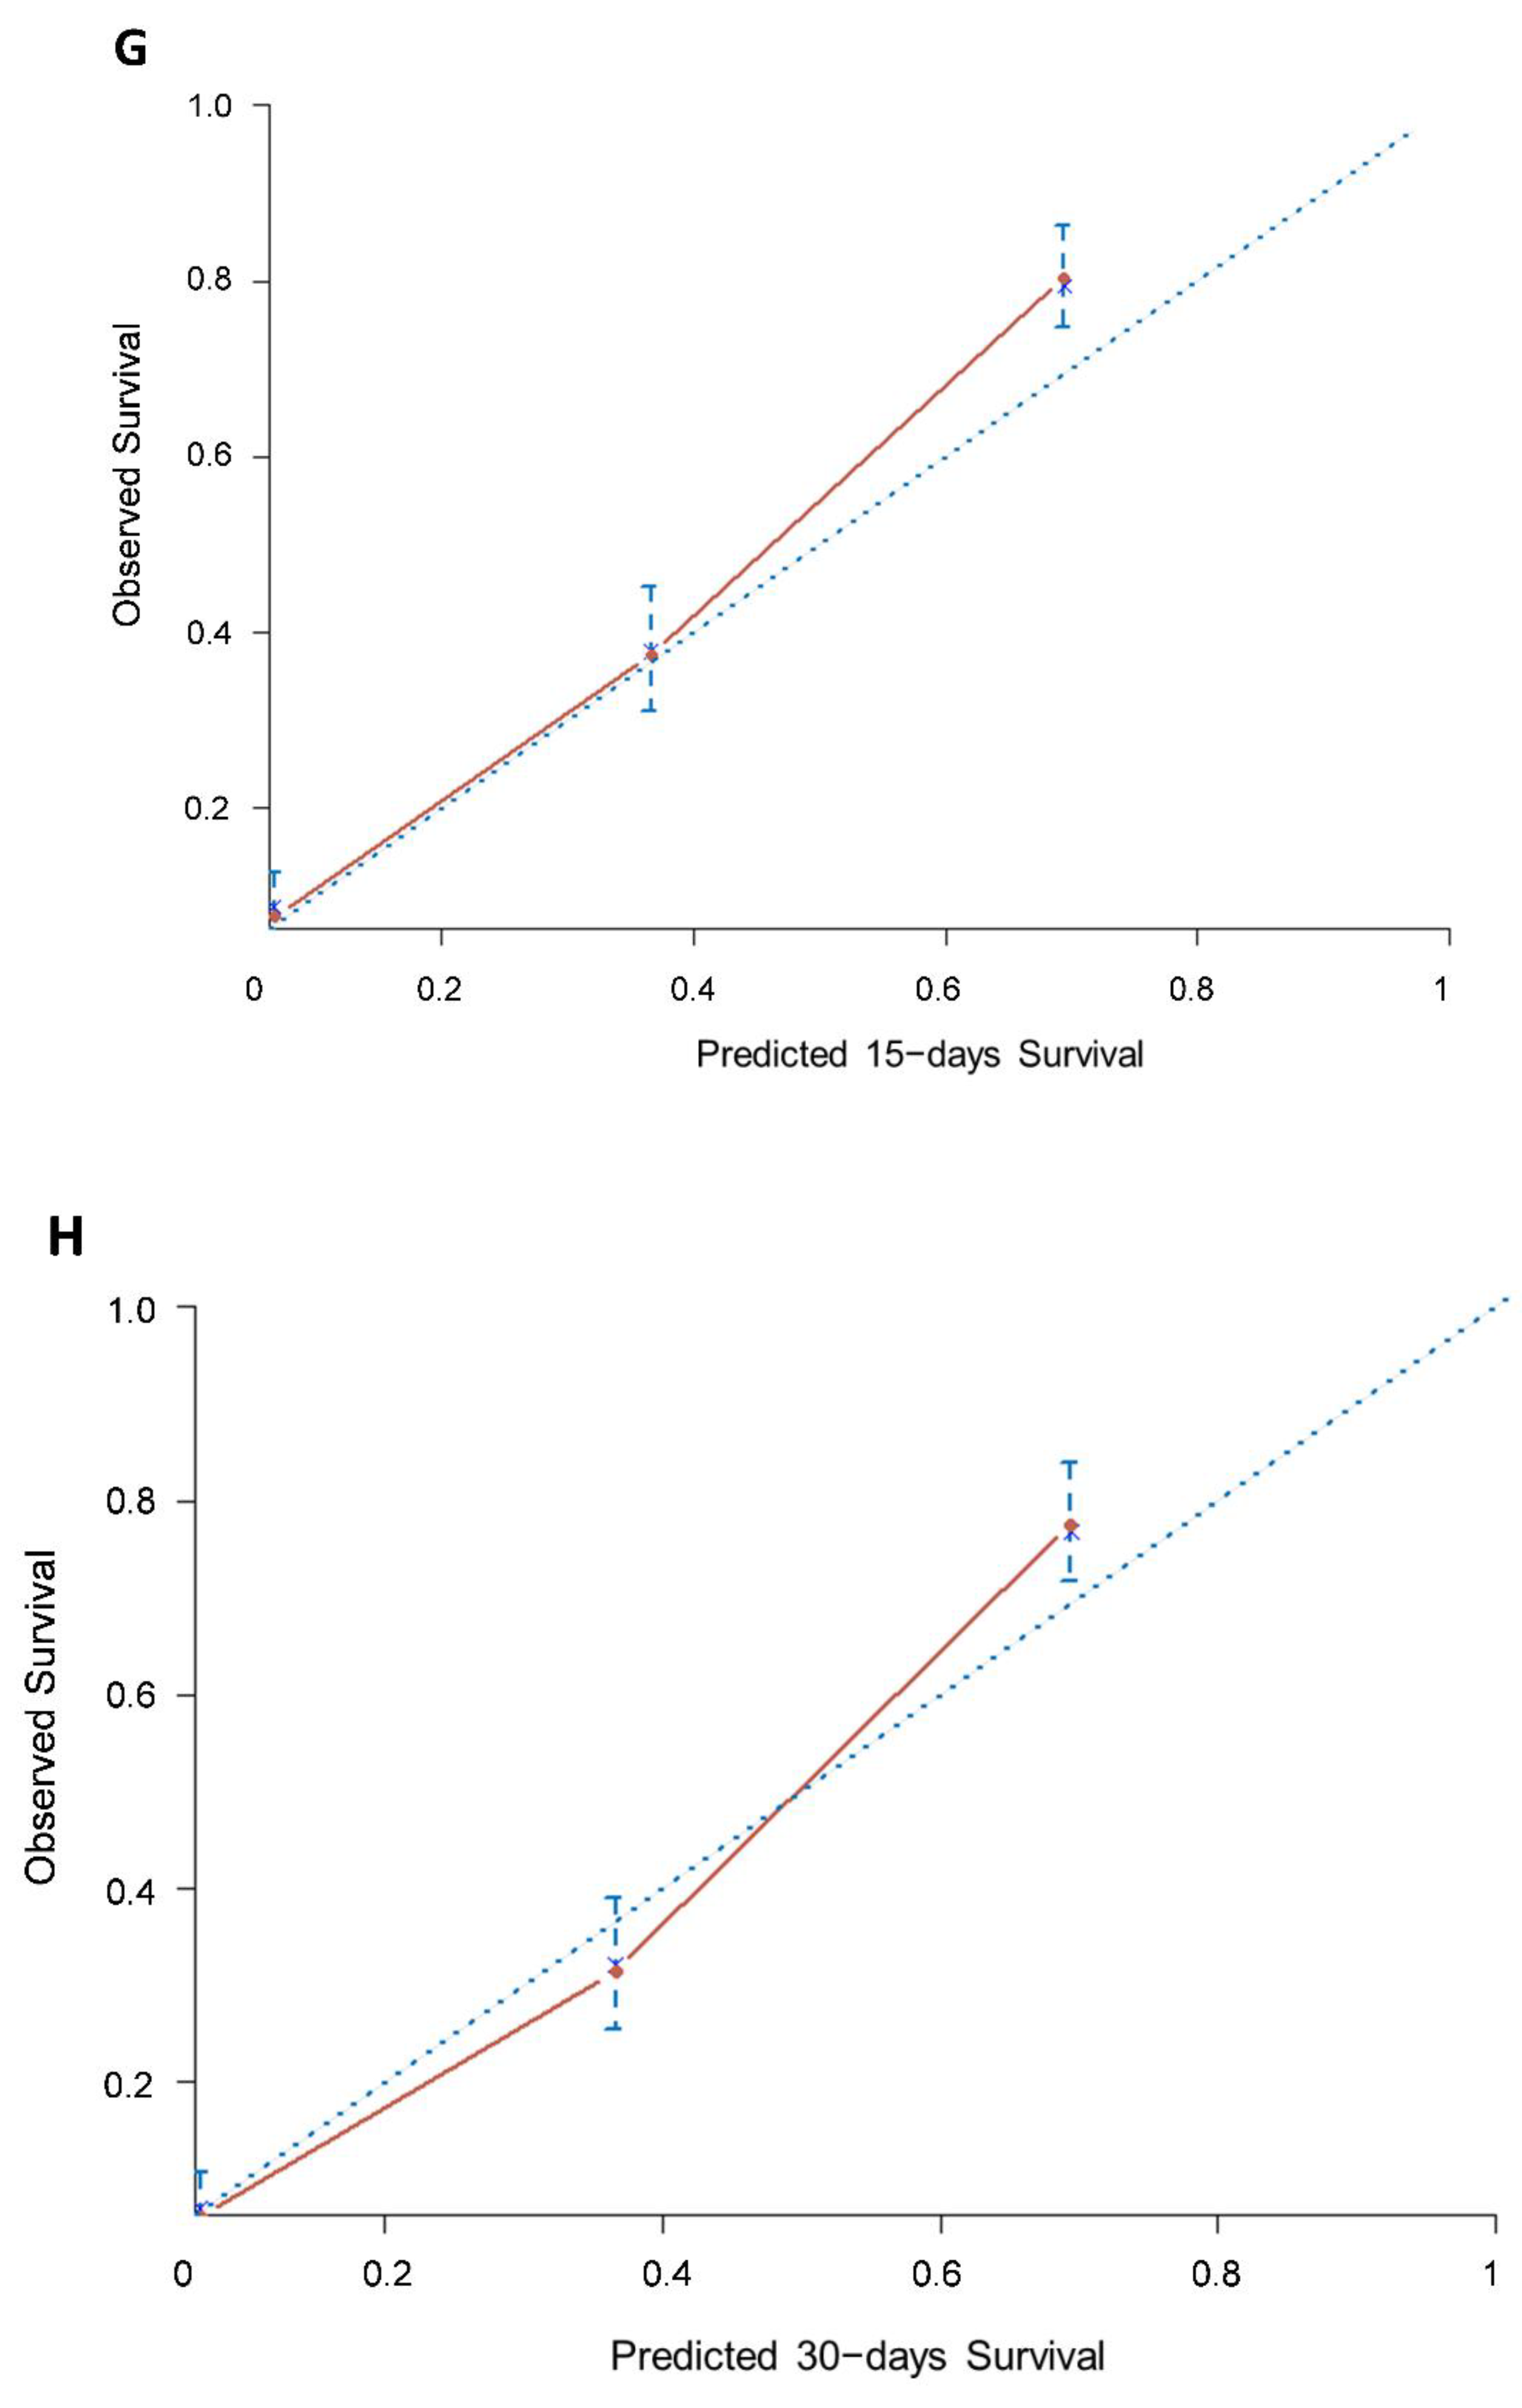
The accuracy of the nomogram at 15, 30 and 60 days was 74% (95% CI 70–77), 89% (95% CI 85–92) and 72% (95% CI 68–76), respectively, and the calibration curves fit well between prediction and observation in the probability of OS (Figure 2D–I).
4. Discussion
Several prognostic models have been developed to predict survival in terminally ill cancer patients [15,16,17,18,19,31,32,33,34]. However, only a few have been fully evaluated in terms of accuracy (discrimination and calibration) and generalizability (reproducibility and transportability) [15,31]. This may be due to the fact that investigators tend to develop new models rather than comparing and improving existing models [18,19,32,33,34].
In the study by Stone et al. [33], four prognostic tools (Palliative Prognostic Score, Palliative Prognostic Index, Palliative Performance Scale and Feliu Prognostic Nomogram) had acceptable discrimination and calibration. Even if none showed superiority to CPS alone, the authors suggest that tools that perform on par with CPS show enough advantages for CPS, so they recommend their use in clinical practice. They are more objective, more reproducible, useful for second opinions, useful as training and educational tools, helpful in communication, useful for defining entry criteria in clinical studies, and helpful in clinical decision-making. Furthermore, the complete form of the PiPS-B tool [34] showed similar accuracy at both 14 and 56 days to an agreed multi-professional estimate of survival and, therefore, is recommended based on the same reasons of the other scores.
In the study by Hui et al. [35], Subjective Clinical Prediction of Survival (PaP-CPS) worked worse than the objective part of the score (PaP-without CPS). When added to the objective part to make the total score (named PaP total score), it seemed to be less accurate than the objective part alone. The authors suggested that the subjective part of the score (PaP-CPS) added uncertainty to the score itself. On the contrary, a recent study by Yoon et al. [36] compared the accuracy of three prediction models (PaP-CPS, PaP without CPS and PaP total score). PaP total score and PaP-CPS had significantly higher C-indices than the PaP without CPS. No detrimental effect of CPS was seen on objective factors. The reasons for optimal functioning of the PaP Score were: physician characteristics with at least 15 years’ experience; direct use of the original categorical PaP-CPS; study subjects as original PaP study (32 days of median survival in the original study, 33 days in this study). However, due to the PaP Score, we have taken into consideration the need for a better tool, with a continuous presentation of clinical prediction of survival.
In the present study, we evaluated the accuracy and generalizability of the PaP score as a nomogram.
Based on the results from the present study, the PaP score nomogram, which is based on six prognostic factors (Karnofsky performance status, CPS, anorexia, dyspnea, total WBC and lymphocyte percentage), discriminates slightly better than the original PaP score. Calibration plots also demonstrated that the nomograms were well calibrated at 15, 30 and 60 days.
With regard to generalizability, a model’s reproducibility is normally evaluated using bootstrapping techniques in the development sample. The assessment of transportability also requires external validation in different populations. The present study was based on three multicenter databases collected within a wide timeframe, therefore guaranteeing the heterogeneity of the study cohort and making it suitable for transportability assessment. The heterogeneity among centers can thus be considered a strength of the study rather than a weakness. In fact, a high grade of heterogeneity accounting for the entire spectrum of disease, and thus mirroring the clinical world, is needed to generalize a prognostic model.
This study has a number of limitations, the main one being its retrospective design. However, the excellent calibration obtained suggests that this is probably a relatively minor concern. Although the multi-institutional nature of the cohorts could be interpreted as a further limitation, it should be remembered that the heterogeneity of the baseline characteristics, rather than homogeneity, is advisable in order to evaluate the accuracy and generalizability of prognostic models. Another limitation is that the PaP score includes the CPS, a subjective factor varying widely between different observers that often presents a bias towards overestimation [33]. A further criticism is that the score requires a blood sample to be taken [33]. Although laboratory tests can be performed as part of routine clinical practice, they are not very feasible when death is near or patients are hesitant. As reported in previous papers on the PaP Score, blood samples were drawn only as part of routine clinical practice [16,22,37] without providing any method of evaluation or predetermined definition of the symptom in question [37,38], but subsequent articles reported these issues [23].
Moreover, some authors have argued that the PaP score does not provide the individual prediction of the probability of survival but only probability windows [33]. Thus, the present work involved the development and validation of the Palliative Prognostic (PaP) score as a nomogram in order to provide an individualized prediction of survival at 15, 30 and 60 days.
Finally, the PaP score has been criticized because it does not include the “delirium” symptom, which has proven prognostic in other studies [39,40]. However, initial selections of prognostic factors of any score may miss a critical one, making this a universal methodological shortcoming [38]. A study evaluating the impact of this missing symptom in the PaP score showed that the overall performance of the revised PaP score, including delirium, was superimposable with that of the original score, therefore suggesting that no modification was necessary [41].
5. Conclusions
Although survival is not the goal of palliative care, physicians and patients need more accurate and generalizable prediction tools to help them in their clinical decision-making.
The PaP score is a tool that assigns patients to three different risk groups of survival probability. In order to determine the probability of survival in this patient setting, even more precisely and accurately, this study was proposed with the aim of converting the three prognostic categories into more accurate clinical information using a personalized determination of the probability of survival by creating a nomogram. The PaP score nomogram had a good predictive performance and calibration and could greatly facilitate clinical care decision-making at the end of life.
In conclusion, the present study helps to better define the general applicability of the PaP score, thus providing an individualized prediction of survival of terminally ill cancer patients at 15, 30 and 60 days.
Supplementary Materials
The following supporting information can be downloaded at: https://0-www-mdpi-com.brum.beds.ac.uk/article/10.3390/cancers14102510/s1, Table S1: The survival database of development and validation cohorts (survival time, status and total PaP score).
Author Contributions
Conceptualization, E.S., M.M. and O.N.; Methodology, E.S. and O.N.; Software, E.S.; Validation, E.S., M.M. and O.N.; Formal Analysis, E.S.; Investigation, M.M.; Resources, M.M. and O.N.; Data Curation, E.S.; Writing—Original Draft Preparation, E.S. and M.M.; Writing—Review and Editing, E.S., M.M. and O.N.; Visualization, E.S. and O.N.; Supervision, M.M. and O.N.; Project Administration, E.S.; Funding Acquisition, O.N. All authors have read and agreed to the published version of the manuscript.
Funding
This work was partly supported thanks to the contribution of Ricerca Corrente by the Italian Ministry of Health within the research line “Appropriateness, outcomes, drug value and organizational models for the continuity of diagnostic-therapeutic pathways in oncology” (L1P1126).
Institutional Review Board Statement
The study was conducted according to the guidelines of the Declaration of Helsinki and approved by the Institutional Review Board of IRCCS Istituto Romagnolo per lo Studio dei Tumori (IRST) “Dino Amadori” (protocol code L1P1126 and date of approval 5 May 2015).
Informed Consent Statement
Informed consent was not collected as this was a retrospective analysis of existing data.
Data Availability Statement
The datasets used and/or analyzed during the current study are available from the corresponding author on reasonable request.
Acknowledgments
The authors wish to thank Gráinne Tierney and Cristiano Verna for editing the manuscript and all investigators who participated in the previous study on the PaP score.
Conflicts of Interest
The authors declare no conflict of interest.
References
- Earle, C.C.; Neville, B.A.; Landrum, M.B.; Ayanian, J.Z.; Block, S.D.; Weeks, J.C. Trends in the aggressiveness of cancer care near the end of life. J. Clin. Oncol. 2004, 22, 315–321. [Google Scholar] [CrossRef] [PubMed]
- Steinhauser, K.E.; Christakis, N.A.; Clipp, E.C.; McNeilly, M.; Grambow, S.; Parker, J.; Tulsky, J.A. Preparing for the end of life: Preferences of patients, families, physicians, and other care providers. J. Pain Symptom Manag. 2001, 22, 727–737. [Google Scholar] [CrossRef]
- Bruera, E.; Miller, M.J.; Kuehn, N.; MacEachern, T.; Hanson, J. Estimate of survival of patients admitted to a palliative care unit: A prospective study. J. Pain Symptom Manag. 1992, 7, 82–86. [Google Scholar] [CrossRef]
- Christakis, N.A.; Lamont, E.B. Extent and determinants of error in doctors’ prognoses in terminally ill patients: Prospective cohort study. BMJ 2000, 320, 469–472. [Google Scholar] [CrossRef] [PubMed] [Green Version]
- Higginson, I.; Costantini, M. Accuracy of prognosis estimates by four palliative care teams: A prospective cohort study. BMC Palliat. Care 2002, 1, 1. [Google Scholar] [CrossRef] [Green Version]
- Glare, P.; Sinclair, C.; Downing, M.; Stone, P.; Maltoni, M.; Vigano, A. Predicting survival in patients with advanced disease. Eur. J. Cancer 2008, 44, 1146–1156. [Google Scholar] [CrossRef]
- Glare, P.; Virik, K.; Jones, M.; Hudson, M.; Eychmuller, S.; Simes, J.; Christakis, N. A systematic review of physicians’ survival predictions in terminally ill cancer patients. BMJ 2003, 327, 195–198. [Google Scholar] [CrossRef] [Green Version]
- Chow, E.; Harth, T.; Hruby, G.; Finkelstein, J.; Wu, J.; Danjoux, C. How accurate are physicians’ clinical predictions of survival and the available prognostic tools in estimating survival times in terminally ill cancer patients? A systematic review. Clin. Oncol. 2001, 13, 209–218. [Google Scholar] [CrossRef]
- Vigano, A.; Dorgan, M.; Bruera, E.; Suarez-Almazor, M.E. The relative accuracy of the clinical estimation of the duration of life for patients with end of life cancer. Cancer 1999, 86, 170–176. [Google Scholar] [CrossRef]
- White, N.; Reid, F.; Harris, A.; Harries, P.; Stone, P. A systematic review of predictions of survival in palliative care: How accurate are clinicians and who are the experts? PLoS ONE 2016, 11, e0161407. [Google Scholar] [CrossRef] [Green Version]
- Hui, D.; Bansal, S.; Morgado, M.; Dev, R.; Chisholm, G.; Bruera, E. Phase angle for prognostication of survival in patients with advanced cancer: Preliminary findings. Cancer 2014, 120, 2207–2214. [Google Scholar] [CrossRef] [PubMed] [Green Version]
- Dolan, R.D.; McSorley, S.T.; Horgan, P.G.; Laird, B.; McMillan, D.C. The role of the systemic inflammatory response in predicting outcomes in patients with advanced inoperable cancer: Systematic review and meta-analysis. Crit. Rev. Oncol. Hematol. 2017, 116, 134–146. [Google Scholar] [CrossRef] [PubMed] [Green Version]
- da Costa Cunha, G.; da Costa Rosa, K.; Wiegert, E.V.M.; de Oliveira, L.G. Clinical relevance and prognostic value of inflammatory biomarkers: A prospective study in terminal cancer patients receiving palliative care. J. Pain Symptom Manag. 2021, 62, 978–986. [Google Scholar] [CrossRef] [PubMed]
- Fan, H.; Shao, Z.Y.; Xiao, Y.Y.; Xie, Z.H.; Chen, W.; Xie, H.; Qin, G.Y.; Zhao, N.Q. Comparison of the Glasgow Prognostic Score (GPS) and the modified Glasgow Prognostic Score (mGPS) in evaluating the prognosis of patients with operable and inoperable non-small cell lung cancer. J. Cancer Res. Clin. Oncol. 2016, 142, 1285–1297. [Google Scholar] [CrossRef] [PubMed]
- Simmons, C.P.L.; McMillan, D.C.; McWilliams, K.; Sande, T.A.; Fearon, K.C.; Tuck, S.; Fallon, M.T.; Laird, B.J. Prognostic tools in patients with advanced cancer: A systematic review. J. Pain Symptom Manag. 2017, 53, 962–970.e10. [Google Scholar] [CrossRef] [PubMed] [Green Version]
- Pirovano, M.; Maltoni, M.; Nanni, O.; Marinari, M.; Indelli, M.; Zaninetta, G.; Petrella, V.; Barni, S.; Zecca, E.; Scarpi, E.; et al. A new palliative prognostic score: A first step for the staging of terminally ill cancer patients. Italian Multicenter and Study Group on Palliative Care. J. Pain Symptom Manag. 1999, 17, 231–239. [Google Scholar] [CrossRef]
- Morita, T.; Tsunoda, J.; Inoue, S.; Chihara, S. The Palliative Prognostic Index: A scoring system for survival prediction of terminally ill cancer patients. Support. Care Cancer 1999, 7, 128–133. [Google Scholar] [CrossRef]
- Chuang, R.B.; Hu, W.Y.; Chiu, T.Y.; Chen, C.Y. Prediction of survival in terminal cancer patients in Taiwan: Constructing a prognostic scale. J. Pain Symptom Manag. 2004, 28, 115–122. [Google Scholar] [CrossRef]
- Yun, Y.H.; Heo, D.S.; Heo, B.Y.; Yoo, T.W.; Bae, J.M.; Ahn, S.H. Development of terminal cancer prognostic score as an index in terminally ill cancer patients. Oncol. Rep. 2001, 8, 795–800. [Google Scholar] [CrossRef]
- Maltoni, M.; Pirovano, M.; Scarpi, E.; Marinari, M.; Indelli, M.; Arnoldi, E.; Gallucci, M.; Frontini, L.; Piva, L.; Amadori, D. Prediction of survival of patients terminally ill with cancer. Results of an Italian prospective multicentric study. Cancer 1995, 75, 2613–2622. [Google Scholar] [CrossRef]
- Maltoni, M.; Pirovano, M.; Nanni, O.; Marinari, M.; Indelli, M.; Gramazio, A.; Terzoli, E.; Luzzani, M.; De Marinis, F.; Caraceni, A.; et al. Biological indices predictive of survival in 519 Italian terminally ill cancer patients. Italian Multicenter Study Group on Palliative Care. J. Pain Symptom Manag. 1997, 13, 1–9. [Google Scholar] [CrossRef]
- Maltoni, M.; Nanni, O.; Pirovano, M.; Scarpi, E.; Indelli, M.; Martini, C.; Monti, M.; Arnoldi, E.; Piva, L.; Ravaioli, A.; et al. Successful validation of the palliative prognostic score in terminally ill cancer patients. Italian Multicenter Study Group on Palliative Care. J. Pain Symptom Manag. 1999, 17, 240–247. [Google Scholar] [CrossRef]
- Glare, P.; Virik, K. Independent prospective validation of the PaP score in terminally ill patients referred to a hospital-based palliative medicine consultation service. J. Pain Symptom Manag. 2001, 22, 891–898. [Google Scholar] [CrossRef]
- Glare, P.A.; Eychmueller, S.; McMahon, P. Diagnostic accuracy of the palliative prognostic score in hospitalized patients with advanced cancer. J. Clin. Oncol. 2004, 22, 4823–4828. [Google Scholar] [CrossRef] [PubMed]
- Tassinari, D.; Montanari, L.; Maltoni, M.; Ballardini, M.; Piancastelli, A.; Musi, M.; Porzio, G.; Minotti, V.; Caraceni, A.; Poggi, B.; et al. The palliative prognostic score and survival in patients with advanced solid tumors receiving chemotherapy. Support. Care Cancer 2008, 16, 359–370. [Google Scholar] [CrossRef] [PubMed]
- Naylor, C.; Cerqueira, L.; Costa-Paiva, L.H.; Costa, J.V.; Conde, D.M.; Pinto-Neto, A.M. Survival of women with cancer in palliative care: Use of the palliative prognostic score in a population of Brazilian women. J. Pain Symptom Manag. 2010, 39, 69–75. [Google Scholar] [CrossRef]
- Maltoni, M.; Scarpi, E.; Pittureri, C.; Martini, F.; Montanari, L.; Amaducci, E.; Derni, S.; Fabbri, L.; Rosati, M.; Amadori, D.; et al. Prospective comparison of prognostic scores in palliative care cancer populations. Oncologist 2012, 17, 446–454. [Google Scholar] [CrossRef] [Green Version]
- Balachandran, V.P.; Gonen, M.; Smith, J.J.; DeMatteo, R.P. Nomograms in oncology: More than meets the eye. Lancet Oncol. 2015, 6, e173–e180. [Google Scholar] [CrossRef] [Green Version]
- Iasonos, A.; Schrag, D.; Raj, G.V.; Panageas, K.S. How to build and interpret a nomogram for cancer prognosis. J. Clin. Oncol. 2008, 26, 1364–1370. [Google Scholar] [CrossRef]
- Harrell, F.E., Jr.; Lee, K.L.; Mark, D.B. Multivariable prognostic models: Issues in developing models, evaluating assumptions and adequacy, and measuring and reducing errors. Stat. Med. 1996, 15, 361–387. [Google Scholar] [CrossRef]
- Krishnan, M.; Temel, J.S.; Wright, A.A.; Bernacki, R.; Selvaggi, K.; Balboni, T. Predicting life expectancy in patients with advanced incurable cancer: A review. J. Support. Oncol. 2013, 11, 68–74. [Google Scholar] [CrossRef] [PubMed]
- Altman, D.G.; Royston, P. What do we mean by validating a prognostic model? Stat. Med. 2000, 19, 453–473. [Google Scholar] [CrossRef]
- Stone, P.; Vickerstaff, V.; Kalpakidou, A.; Todd, C.; Griffiths, J.; Keeley, V.; Spencer, K.; Buckle, P.; Finlay, D.; Omar, R.Z. Prognostic tools or clinical predictions: Which are better in palliative care? PLoS ONE 2021, 16, e0249763. [Google Scholar] [CrossRef]
- Stone, P.; Kalpakidou, A.; Todd, C.; Griffiths, J.; Keeley, V.; Spencer, K.; Buckle, P.; Finlay, D.A.; Vickerstaff, V.; Omar, R.Z. Prognostic models of survival in patients with advanced incurable cancer: The PiPS2 observational study. Health Technol. Assess. 2021, 25, 1–118. [Google Scholar] [CrossRef] [PubMed]
- Hui, D.; Park, M.; Liu, D.; Paiva, C.E.; Suh, S.Y.; Morita, T.; Bruera, E. Clinical prediction of survival versus the Palliative Prognostic Score: Which approach is more accurate? Eur. J. Cancer 2016, 64, 89–95. [Google Scholar] [CrossRef] [PubMed] [Green Version]
- Yoon, S.J.; Suh, S.Y.; Hui, D.; Choi, S.E.; Tatara, R.; Watanabe, H.; Otani, H.; Morita, T. Accuracy of the Palliative Prognostic Score with or without clinicians’ prediction of survival in patients with far advanced cancer. J. Pain Symptom Manag. 2021, 61, 1180–1187. [Google Scholar] [CrossRef]
- Tarumi, Y.; Watanabe, S.M.; Lau, F.; Yang, J.; Quan, H.; Sawchuk, L.; de Moissac, D.; Wolch, G.; Thai, V. Evaluation of the palliative prognostic score (PaP) and routinely collected clinical data in prognostication of survival for patients referred to a palliative care consultation service in an acute care hospital. J. Pain Symptom Manag. 2011, 42, 419–431. [Google Scholar] [CrossRef]
- Stone, P.C.; Lund, S. Predicting prognosis in patients with advanced cancer. Ann. Oncol. 2007, 18, 971–976. [Google Scholar] [CrossRef]
- Caraceni, A.; Nanni, O.; Maltoni, M.; Piva, L.; Indelli, M.; Arnoldi, E.; Monti, M.; Montanari, L.; Amadori, D.; De Conno, F. Impact of delirium on the short term prognosis of advanced cancer patients. Italian multicenter study group on palliative care. Cancer 2000, 89, 1145–1149. [Google Scholar] [CrossRef]
- Maltoni, M.; Caraceni, A.; Brunelli, C.; Broeckaert, B.; Christakis, N.; Eyschmueller, S.; Glare, P.; Nabal, M.; Viganò, A.; Larkin, P.; et al. Prognostic factors in advanced cancer patients: Evidence-based clinical recommendations. A study by the Steering committee of the European Association for Palliative Care. J. Clin. Oncol. 2005, 23, 6240–6248. [Google Scholar] [CrossRef]
- Scarpi, E.; Maltoni, M.; Miceli, R.; Mariani, L.; Caraceni, A.; Amadori, D.; Nanni, O. Survival prediction for terminally ill cancer patients: Revision of Palliative Prognostic Score with incorporation of delirium. Oncologist 2011, 16, 1793–1799. [Google Scholar] [CrossRef] [PubMed] [Green Version]
Figure 1.
PaP score nomogram (development cohort) predicting 15-, 30-, and 60-day survival. To estimate risk, points were assigned for each independent variable by drawing a line upward form the variable value to the axis labeled “Points”. All points were then summed and plotted on the “Total points” axis; then, a straight line was drawn from the total points axis to the 15-, 30- and 60- days survival axis. KPS: Karnofsky Performance Status; CPS: Clinical Prediction of Survival; Total WBC: Total White Blood Count.

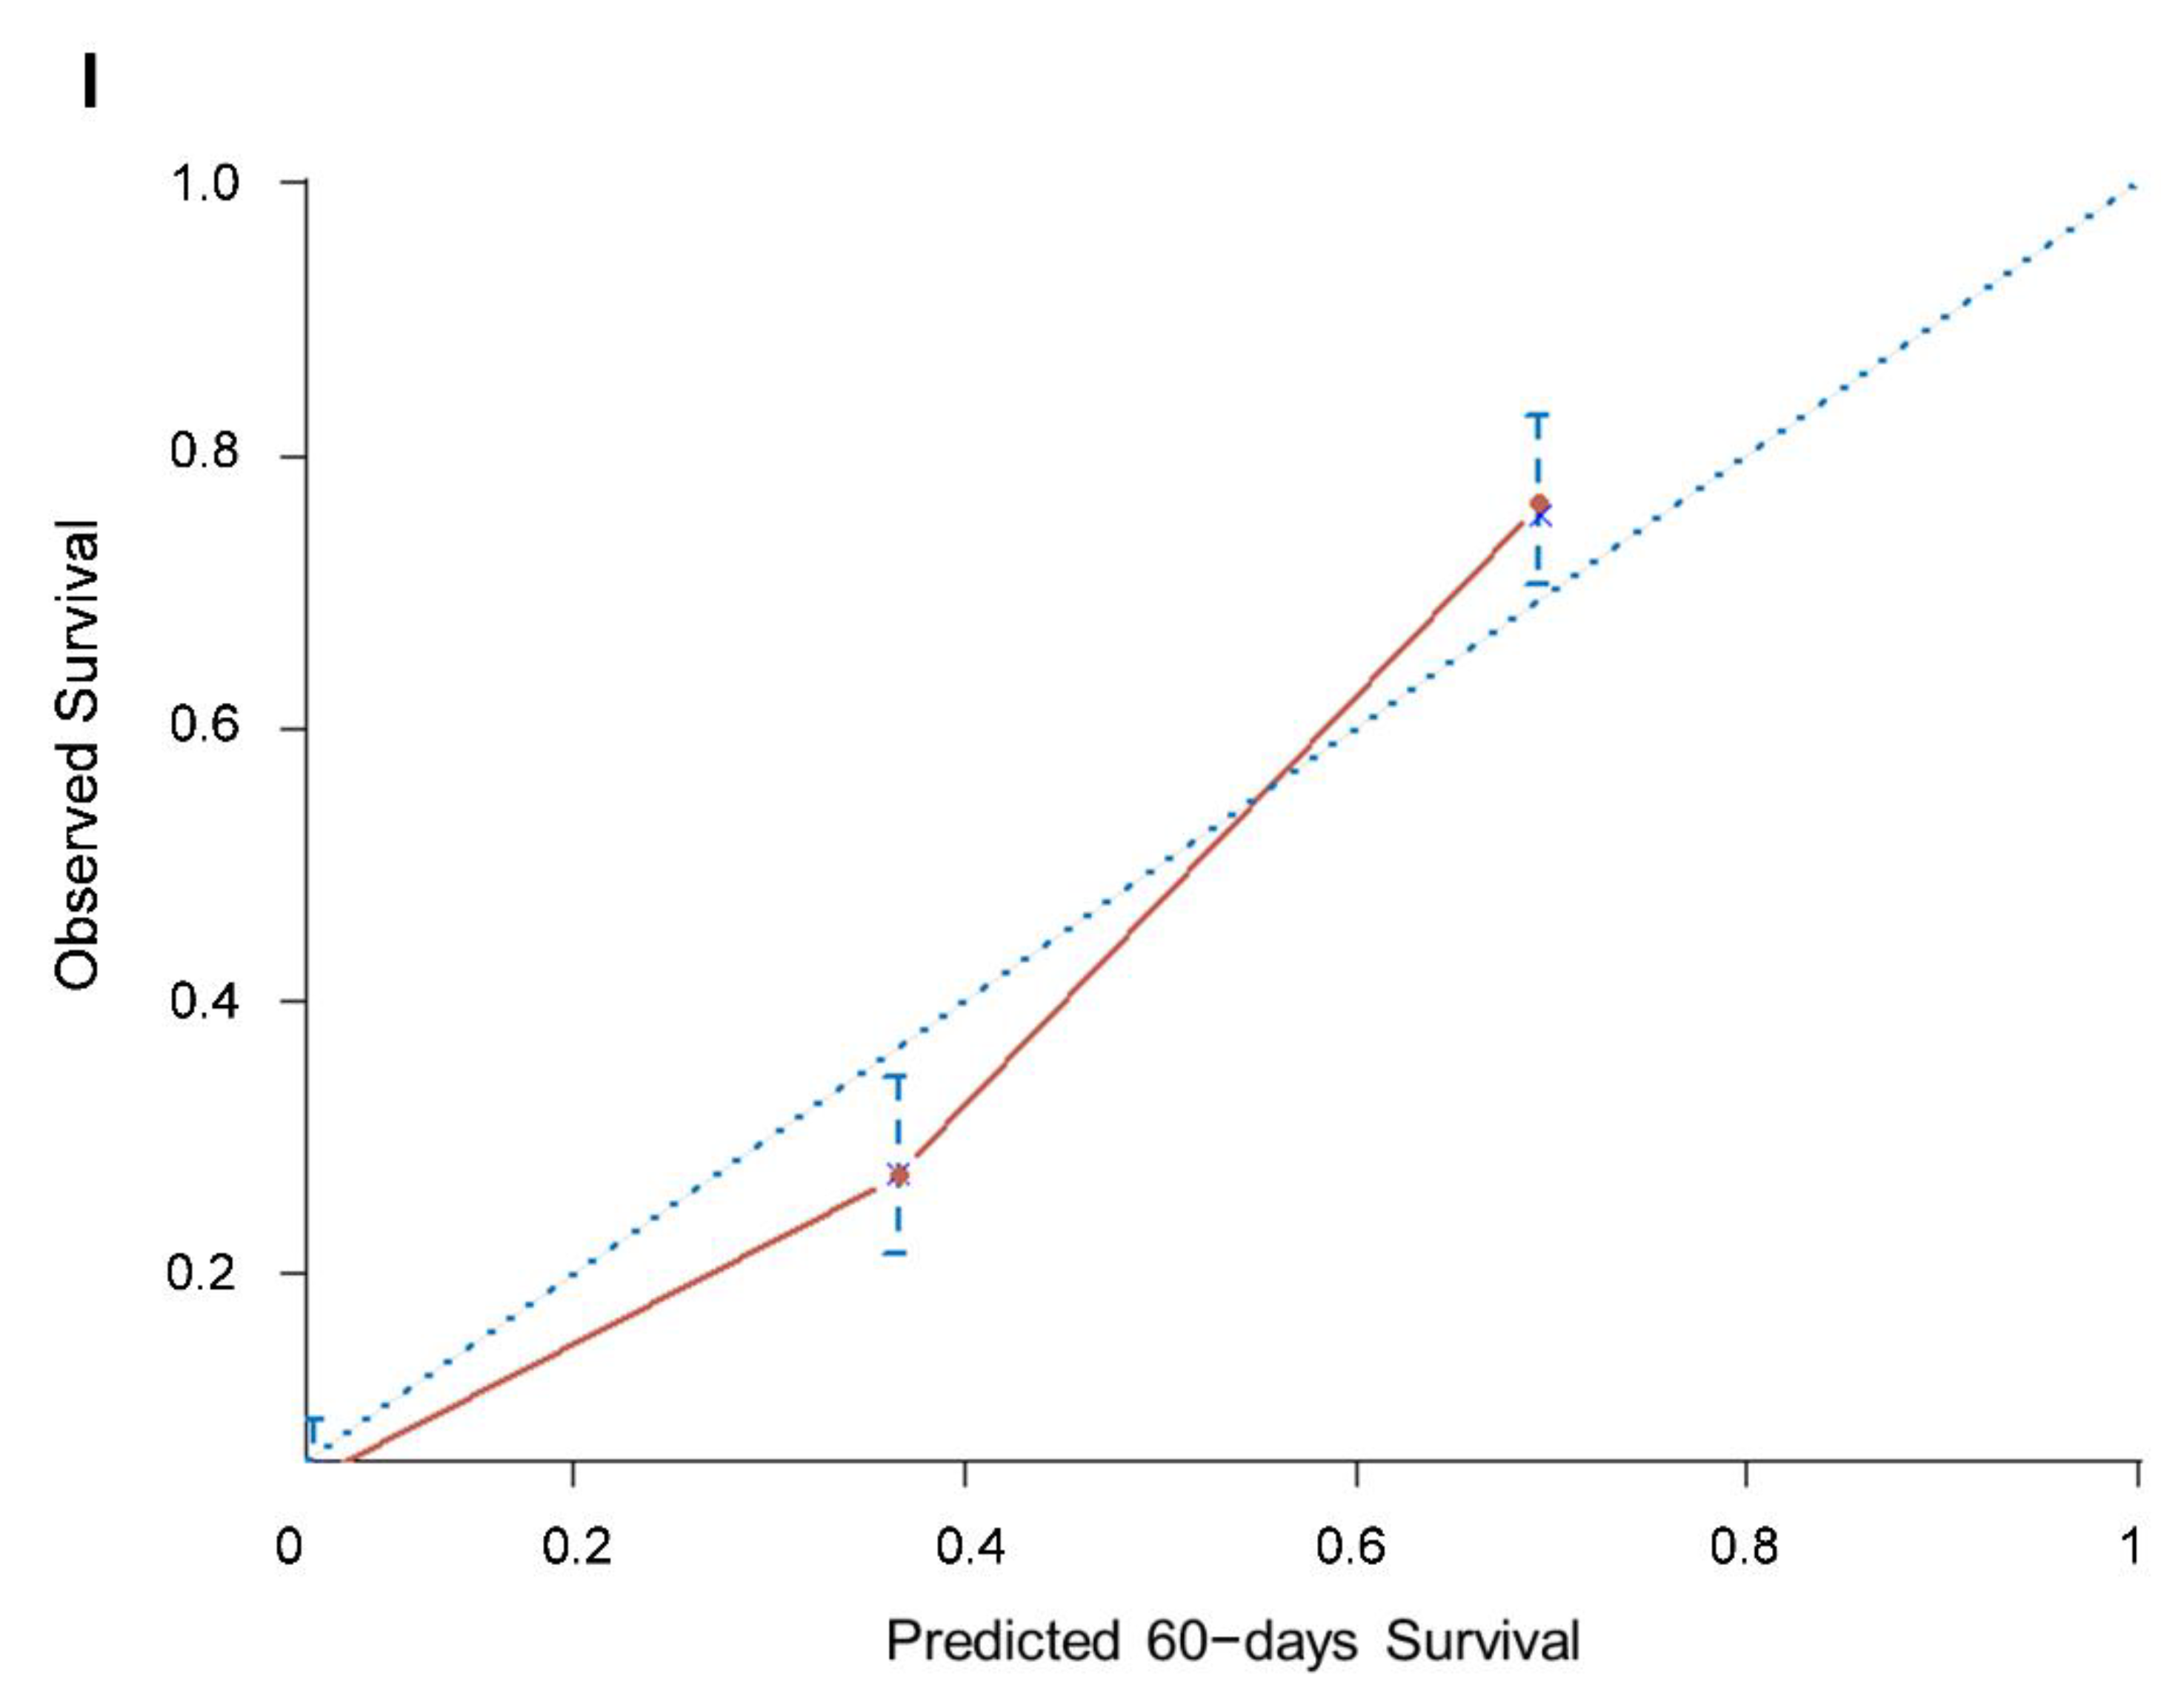
Figure 2.
Calibration plots of the PaP score nomogram for 15-, 30- and 60-day survival prediction of the development cohort (A–C) and validation cohorts of 451 patients (D–F) and 549 patients (G–I). The X-axis represents the nomogram-predicted probability of survival; Y-axis represents the observed survival probability (Kaplan–Meier estimates). A perfectly accurate nomogram prediction model would result in a plot where the observed and predicted probabilities for given groups fall along the line. Dots with bars represent nomogram-predicted probabilities and 95% confidence intervals.


Table 1.
Original PaP score and classification of patients in the three risk groups.
| Characteristic | PaP Partial Score |
|---|---|
| Dypnea | |
| No | 0 |
| Yes | 1.0 |
| Anorexia | |
| No | 0 |
| Yes | 1.5 |
| Karnofsky performance status | |
| ≥50 | 0 |
| 30–40 | 0 |
| 10–20 | 2.5 |
| Clinical prediction of survival (weeks) | |
| >12 | 0 |
| 11–12 | 2.0 |
| 9–10 | 2.5 |
| 7–8 | 2.5 |
| 5–6 | 4.5 |
| 3–4 | 6.0 |
| 1–2 | 8.5 |
| Total white blood count (cell/mm3) | |
| Normal (4800–8500) | 0 |
| High (8501–11000) | 0.5 |
| Very high (>11000) | 1.5 |
| Lymphocyte rate (%) | |
| Normal (20.0–40.0) | 0 |
| Low (12.0–19.9) | 1.0 |
| Very low (0–11.9) | 2.5 |
| Risk groups | PaP Total score |
| A (30-day survival probability >70%) | 0.0–5.5 |
| B (30-day survival probability 30–70%) | 5.6–11.0 |
| C (30-day survival probability <30%) | 11.1–17.5 |
Total scores range between 0 and 17.5, and patients were assigned to one of three different risk groups according to a 30-day survival probability: group A, <70%; group B, 30–70%; and group C, >30%.
Table 2.
PaP score in palliative care populations.
| Development Cohort (n = 519) | Validation Cohort (n = 451) | Validation Cohort (n = 549) | |
|---|---|---|---|
| Variables | No. Patients (%) | No. Patients (%) | No. Patients (%) |
| Dyspnea | |||
| No | 340 (65.5) | 302 (67.0) | 367 (66.9) |
| Yes | 179 (34.5) | 149 (33.0) | 182 (33.1) |
| Anorexia | |||
| No | 191 (36.8) | 181 (40.1) | 207 (37.7) |
| Yes | 328 (63.2) | 270 (59.9) | 342 (62.3) |
| KPS | |||
| ≥50 | 248 (17.8) | 140 (31.0) | 79 (14.4) |
| 30–40 | 217 (41.8) | 260 (57.6) | 356 (64.8) |
| 10–20 | 54 (10.4) | 51 (11.3) | 114 (20.8) |
| CPS (weeks) | |||
| >12 | 69 (13.3) | 49 (10.9) | 46 (8.4) |
| 11–12 | 51 (9.8) | 47 (10.4) | 52 (9.5) |
| 9–10 | 41 (7.9) | 32 (7.1) | 40 (7.3) |
| 7–8 | 77 (14.8) | 64 (14.2) | 86 (15.6) |
| 5–6 | 74 (14.3) | 65 (14.4) | 78 (14.2) |
| 3–4 | 109 (21.0) | 114 (25.3) | 134 (24.4) |
| 1–2 | 81 (15.6) | 80 (17.7) | 113 (20.6) |
| Total WBC (cells/mm3) | |||
| Normal (4800–8500) | 256 (49.3) | 253 (56.1) | 252 (45.9) |
| High (8501–11000) | 120 (23.1) | 107 (23.7) | 101 (18.4) |
| Very high (>11000) | 143 (27.6) | 91 (20.2) | 196 (35.7) |
| Lymphocyte rate (%) | |||
| Normal (20.0–40.0) | 150 (28.9) | 162 (35.9) | 114 (20.8) |
| Low (12.0–19.9) | 198 (38.2) | 180 (39.9) | 148 (27.0) |
| Very low (0–11.9) | 171 (32.9) | 109 (24.2) | 287 (52.2) |
| Risk groups | |||
| A (total score 0.0–5.5) | 178 (34.3) | 127 (28.2) | 181 (33.0) |
| B (total score 5.6–11.0) | 205 (39.5) | 206 (45.7) | 222 (40.4) |
| C (total score 11.1–17.5) | 136 (26.2) | 118 (26.1) | 146 (26.6) |
KPS: Karnofsky Performance Status; CPS: Clinical Prediction of Survival; Total WBC: Total White Blood Count.
Publisher’s Note: MDPI stays neutral with regard to jurisdictional claims in published maps and institutional affiliations. |
© 2022 by the authors. Licensee MDPI, Basel, Switzerland. This article is an open access article distributed under the terms and conditions of the Creative Commons Attribution (CC BY) license (https://creativecommons.org/licenses/by/4.0/).
Share and Cite
MDPI and ACS Style
Scarpi, E.; Nanni, O.; Maltoni, M. Development and Validation of the PaP Score Nomogram for Terminally Ill Cancer Patients. Cancers 2022, 14, 2510. https://0-doi-org.brum.beds.ac.uk/10.3390/cancers14102510
AMA Style
Scarpi E, Nanni O, Maltoni M. Development and Validation of the PaP Score Nomogram for Terminally Ill Cancer Patients. Cancers. 2022; 14(10):2510. https://0-doi-org.brum.beds.ac.uk/10.3390/cancers14102510
Chicago/Turabian StyleScarpi, Emanuela, Oriana Nanni, and Marco Maltoni. 2022. "Development and Validation of the PaP Score Nomogram for Terminally Ill Cancer Patients" Cancers 14, no. 10: 2510. https://0-doi-org.brum.beds.ac.uk/10.3390/cancers14102510
Note that from the first issue of 2016, this journal uses article numbers instead of page numbers. See further details here.