
Identification of Tumor Antigens and Immune Subtypes for the Development of mRNA Vaccines and Individualized Immunotherapy in Soft Tissue Sarcoma

 , , and
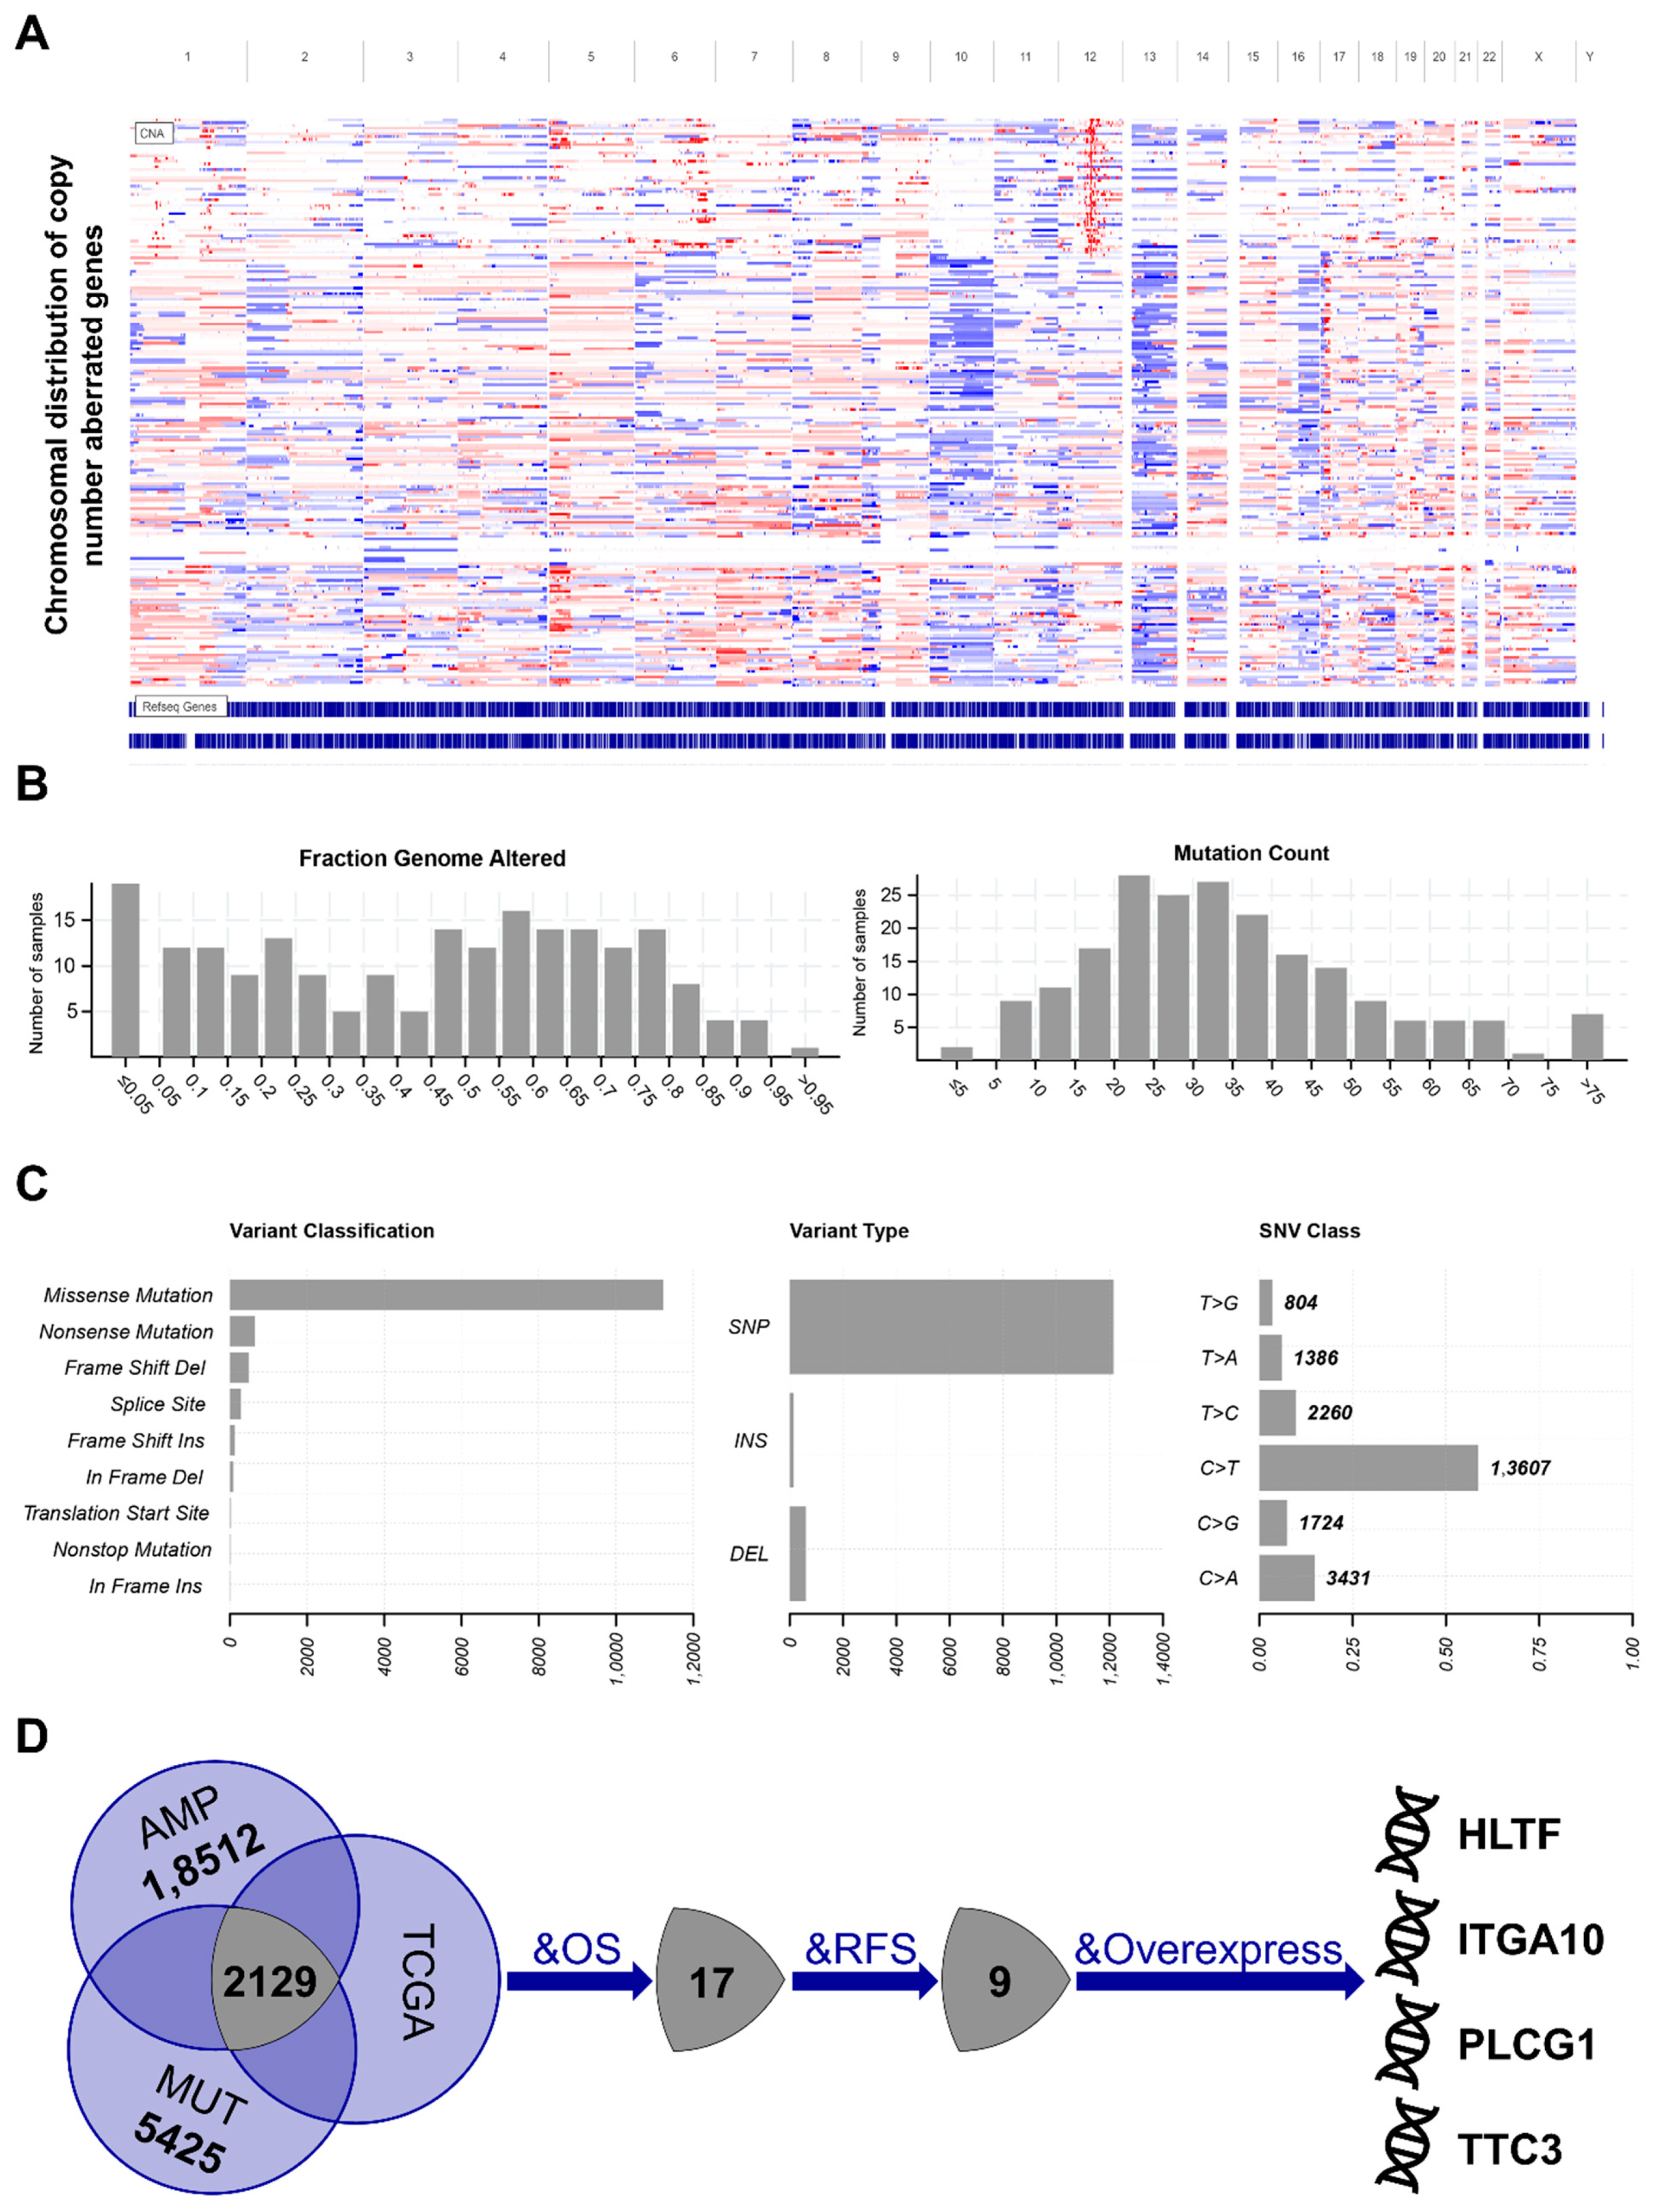
Abstract
:Simple Summary
Abstract
1. Introduction
2. Materials and Methods
2.1. Patients
2.2. Identification of Potential Tumor Antigens
2.3. Identification and Validation of Immune Subtypes
2.4. Molecular and Cellular Characteristics Related to Immune Subtypes
2.5. Defining the Immune Landscape
2.6. Identification of Immune-Related Gene Modules and Hub Genes
3. Results
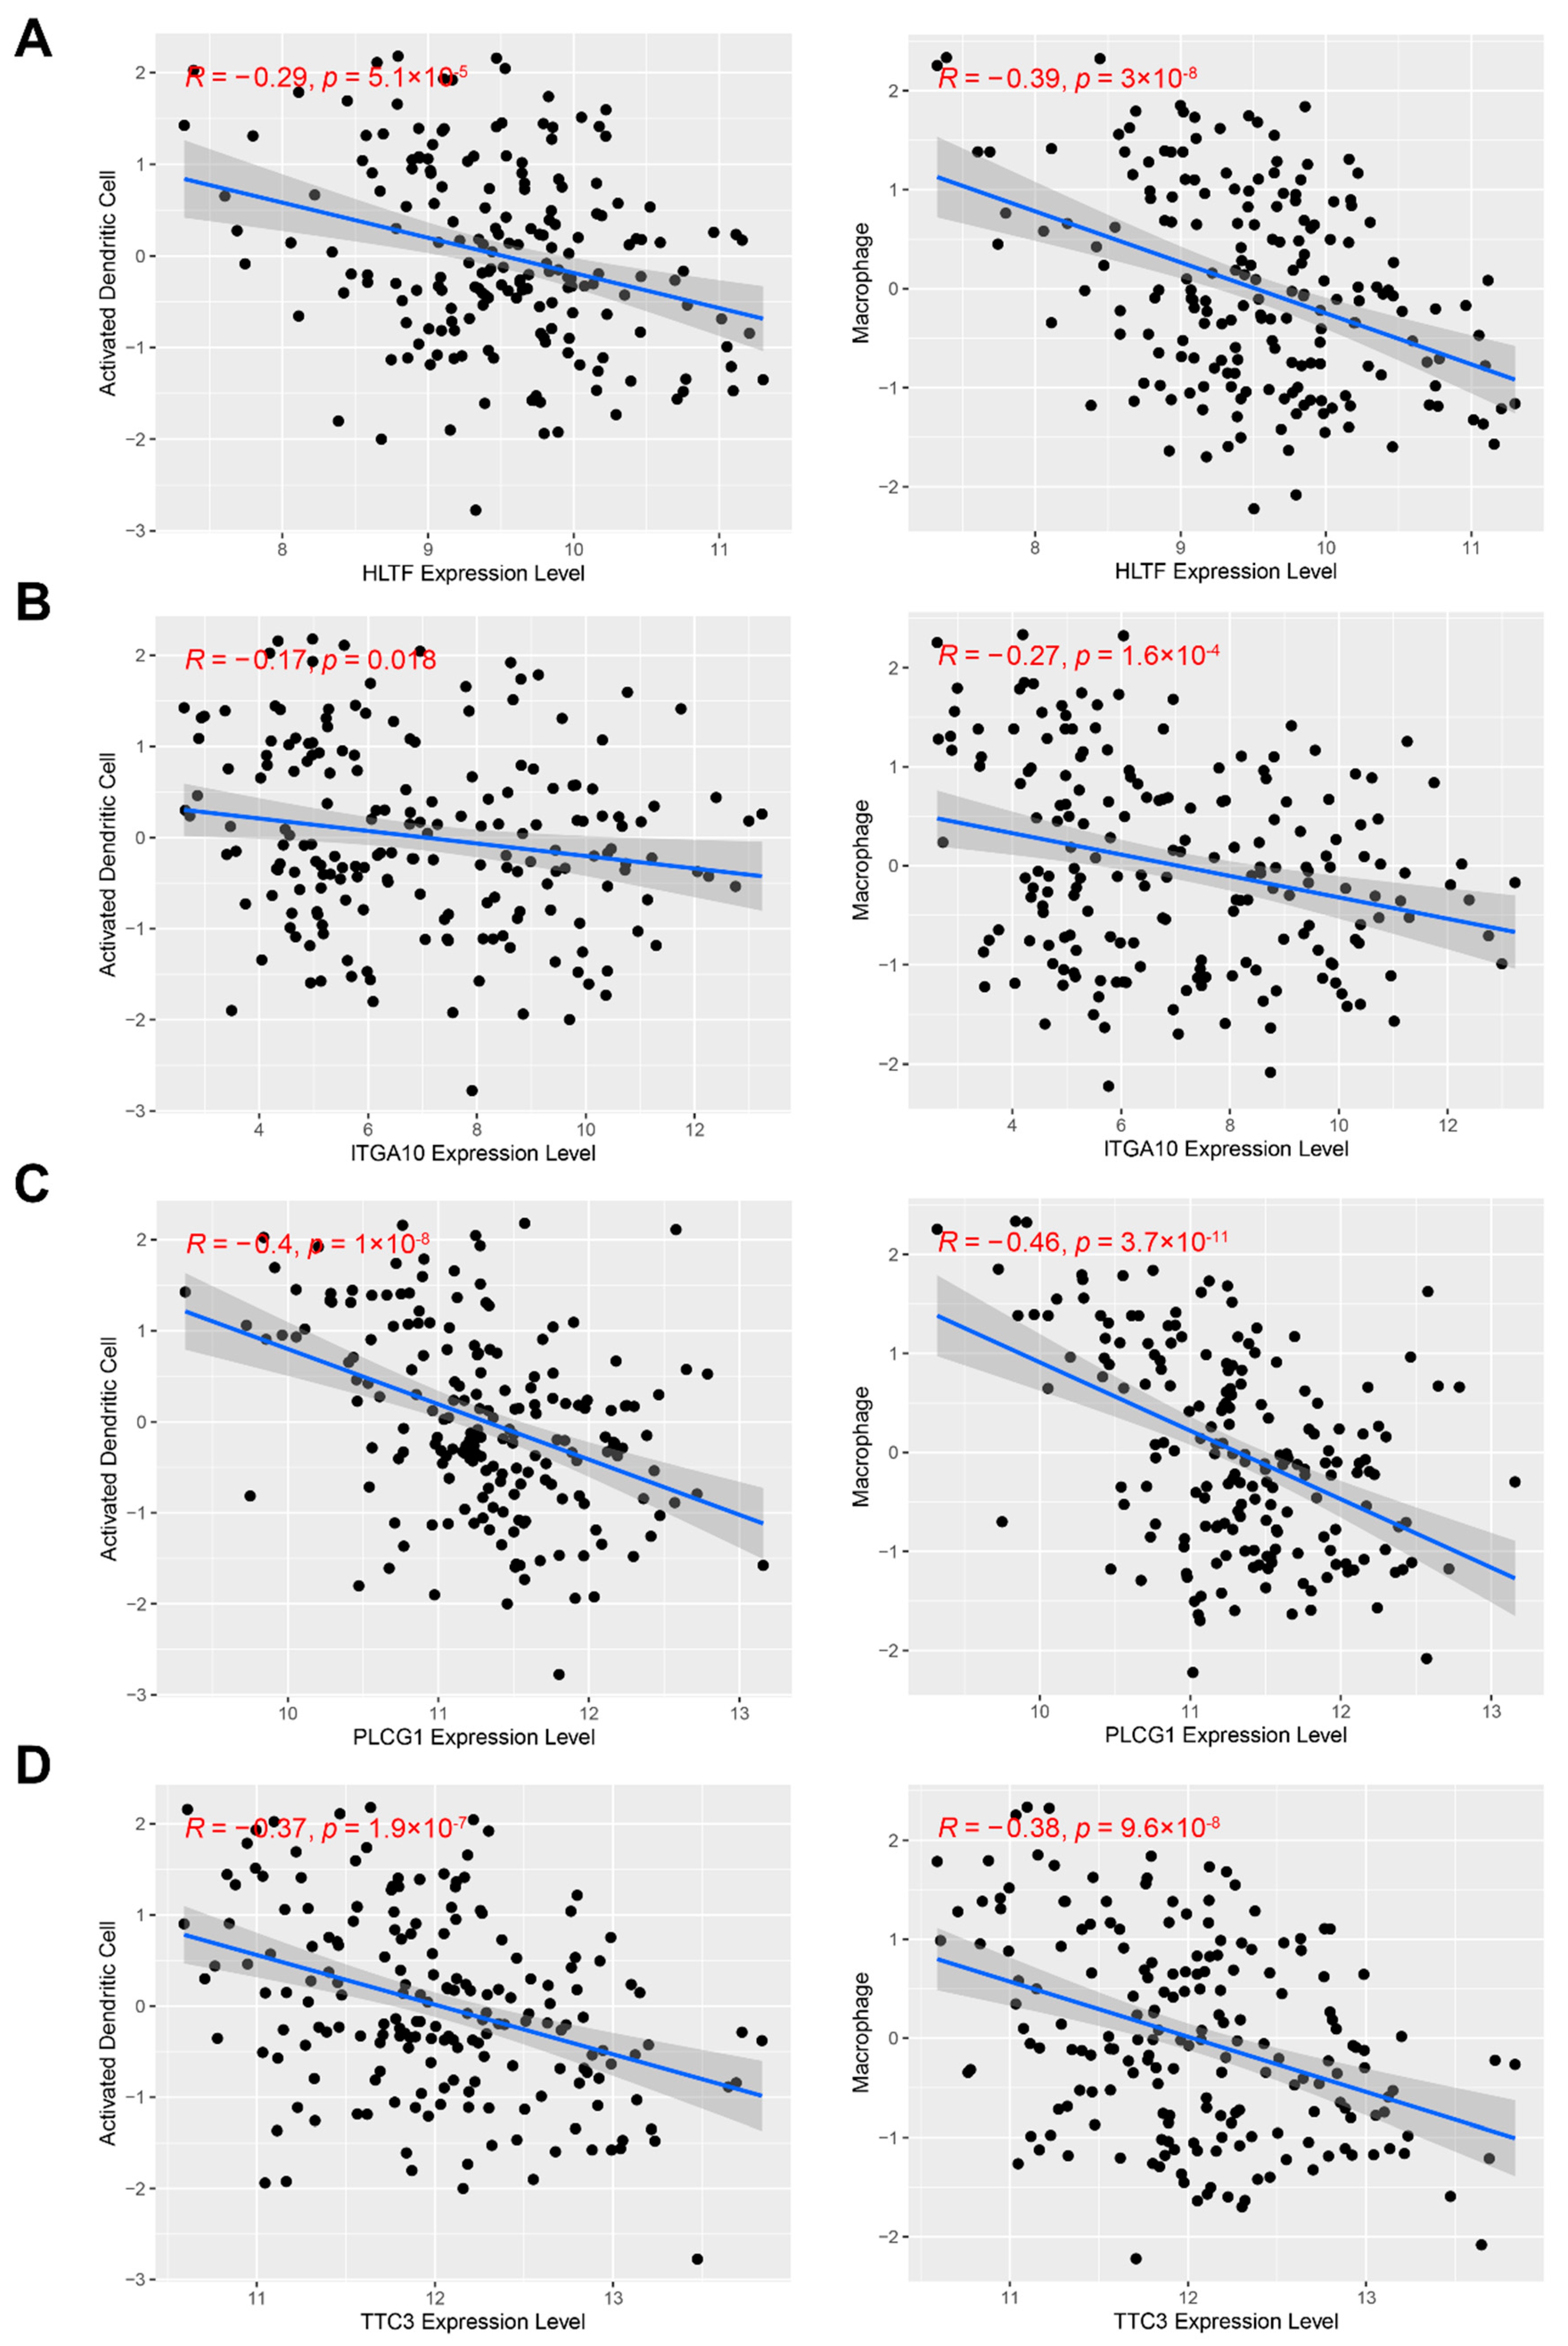
3.1. Identification of Potential Tumor Antigens in STS
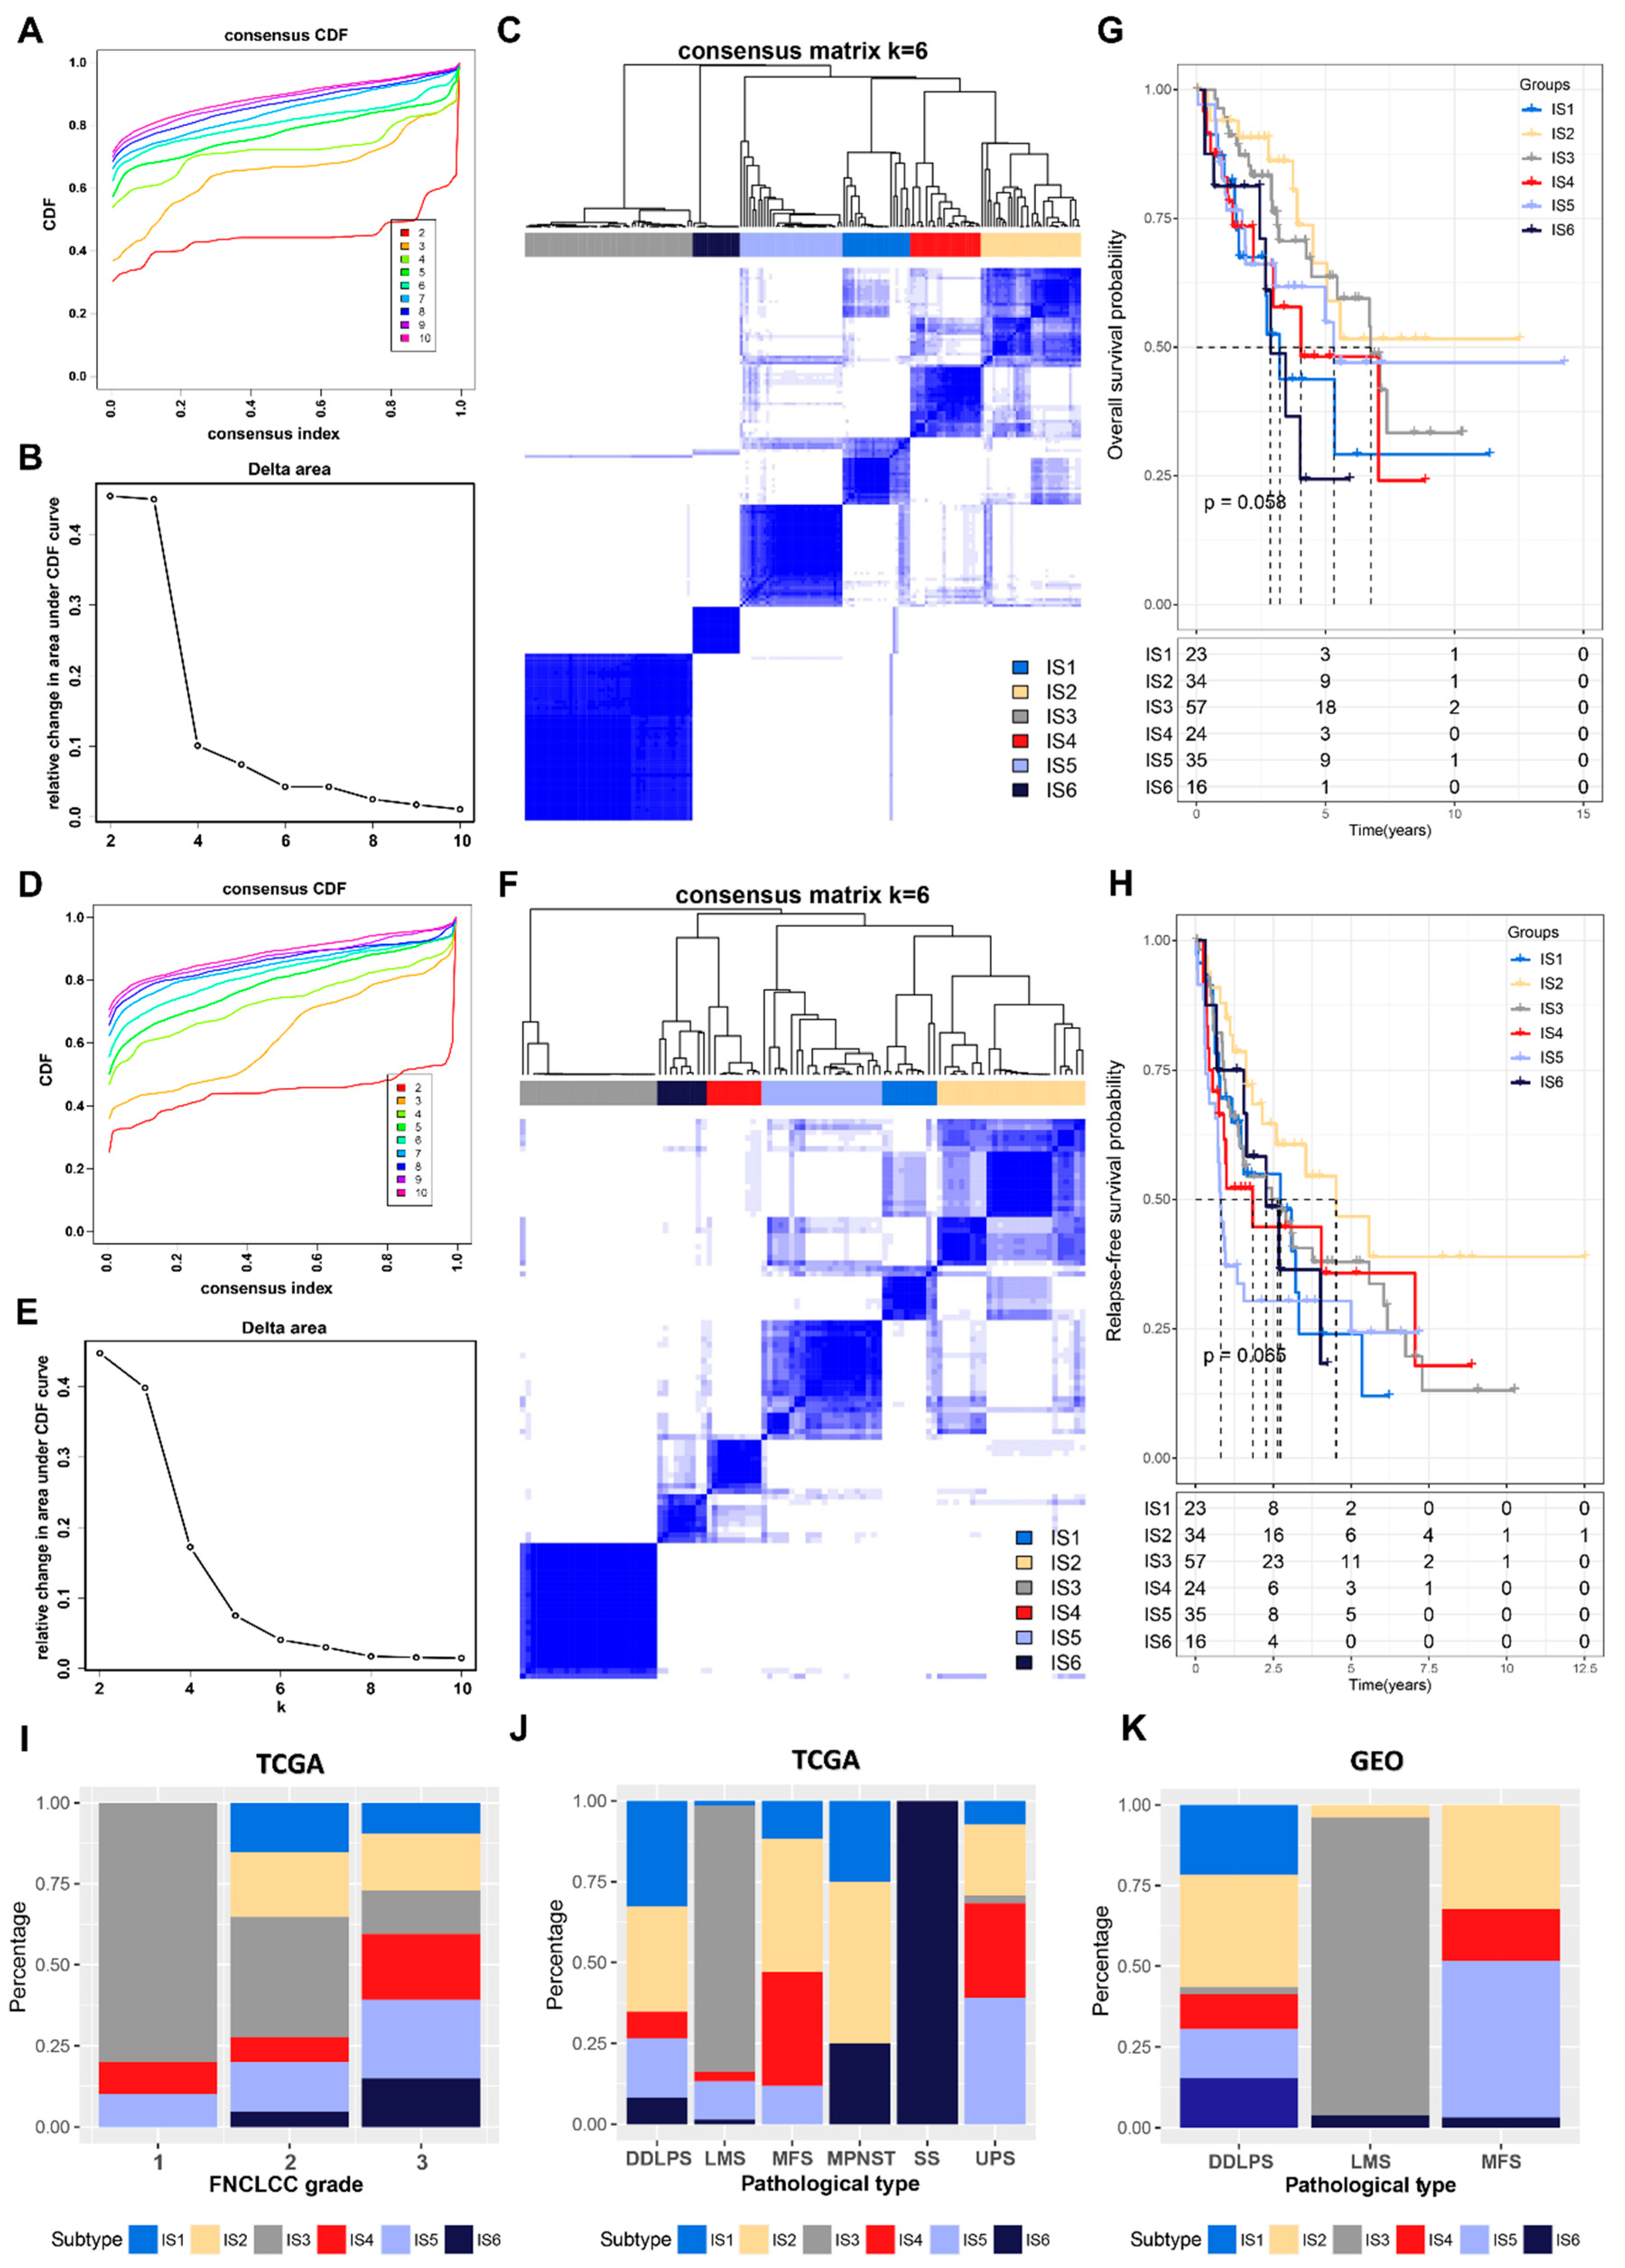
3.2. Identification of Potential Immune Subtypes in STS
3.3. The Relationship between Immune Subtypes and Mutation Status in STS
3.4. The Relationship between Immune Subtypes and Immunomodulators in STS
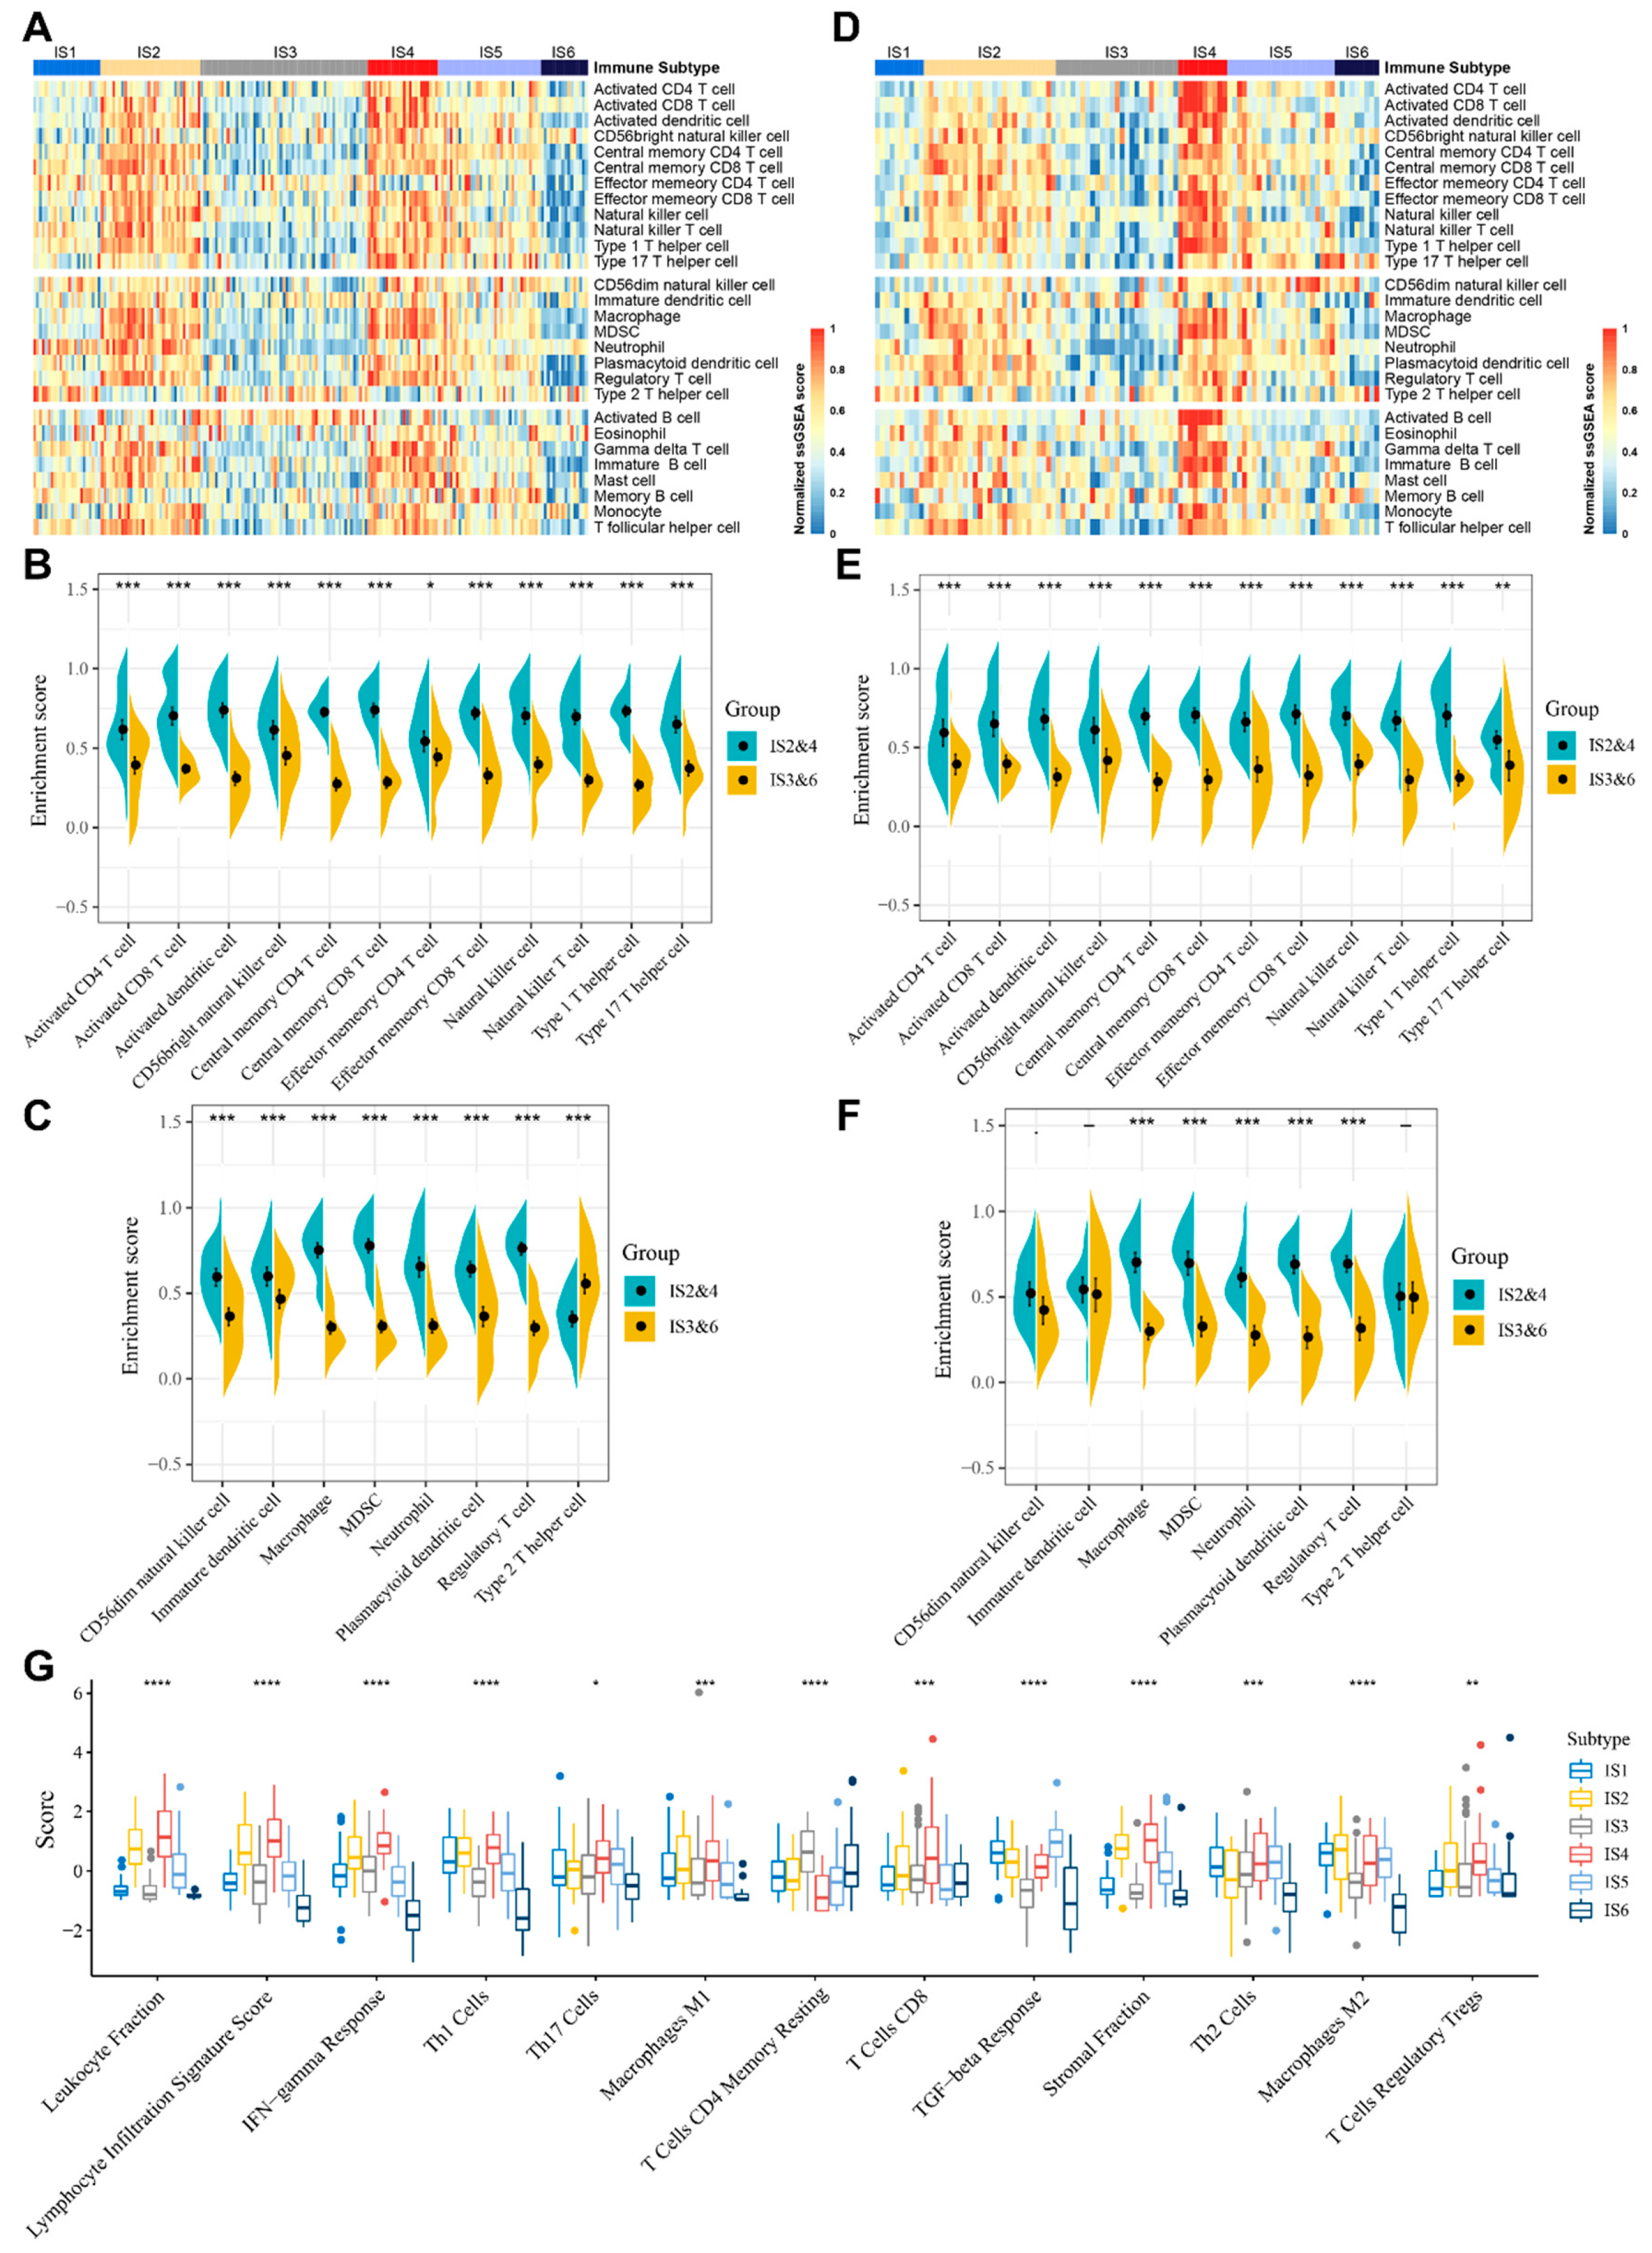
3.5. Molecular and Cellular Characteristics of Immune Subtypes
3.6. The Immune Landscape of STS
3.7. Identification of Functional Immune Gene Modules and Hub Genes in STS
4. Discussion
5. Conclusions
Supplementary Materials
Author Contributions
Funding
Institutional Review Board Statement
Informed Consent Statement
Data Availability Statement
Acknowledgments
Conflicts of Interest
References
- Blay, J.Y. Treatment of advanced soft tissue sarcoma by histological subtype: Wish, prediction or reality? Future Oncol. 2019, 15, 5–10. [Google Scholar] [CrossRef] [PubMed]
- Kim, J.; Kim, J.H.; Kang, H.G.; Park, S.Y.; Yu, J.Y.; Lee, E.Y.; Oh, S.E.; Kim, Y.H.; Yun, T.; Park, C.; et al. Integrated molecular characterization of adult soft tissue sarcoma for therapeutic targets. BMC Med. Genet. 2018, 19 (Suppl. S1), 216. [Google Scholar] [CrossRef] [PubMed]
- Siegel, R.L.; Miller, K.D.; Jemal, A. Cancer statistics, 2015. CA Cancer J. Clin. 2015, 65, 5–29. [Google Scholar] [CrossRef] [PubMed]
- Bourcier, K.; Le Cesne, A.; Tselikas, L.; Adam, J.; Mir, O.; Honore, C.; De Baere, T. Basic Knowledge in Soft Tissue Sarcoma. Cardiovasc. Interv. Radiol. 2019, 42, 1255–1261. [Google Scholar] [CrossRef]
- Spunt, S.L.; Million, L.; Chi, Y.-Y.; Anderson, J.; Tian, J.; Hibbitts, E.; Coffin, C.; McCarville, M.B.; Randall, R.L.; Parham, D.M.; et al. A risk-based treatment strategy for non-rhabdomyosarcoma soft-tissue sarcomas in patients younger than 30 years (ARST0332): A Children’s Oncology Group prospective study. Lancet Oncol. 2020, 21, 145–161. [Google Scholar] [CrossRef]
- Widemann, B.C.; Italiano, A. Biology and management of undifferentiated pleomorphic sarcoma, myxofibrosarcoma, and malignant peripheral nerve sheath tumors: State of the art and perspectives. J. Clin. Oncol. 2018, 36, 160–167. [Google Scholar] [CrossRef]
- Botta, L.; Gatta, G.; Trama, A.; Bernasconi, A.; Sharon, E.; Capocaccia, R.; Mariotto, A.B. Incidence and survival of rare cancers in the US and Europe. Cancer Med. 2020, 9, 5632–5642. [Google Scholar] [CrossRef]
- Istl, A.C.; Ruck, J.M.; Morris, C.D.; Levin, A.S.; Meyer, C.F.; Johnston, F.M. Call for improved design and reporting in soft tissue sarcoma studies: A systematic review and meta-analysis of chemotherapy and survival outcomes in resectable STS. J. Surg. Oncol. 2019, 119, 824–835. [Google Scholar] [CrossRef]
- Pardoll, D.M. The blockade of immune checkpoints in cancer immunotherapy. Nat. Rev. Cancer. 2012, 12, 252–264. [Google Scholar] [CrossRef] [Green Version]
- Topalian, S.L.; Hodi, F.S.; Brahmer, J.R.; Gettinger, S.N.; Smith, D.C.; McDermott, D.F.; Powderly, J.D.; Carvajal, R.D.; Sosman, J.A.; Atkins, M.B.; et al. Safety, Activity, and Immune Correlates of Anti–PD-1 Antibody in Cancer. N. Engl. J. Med. 2012, 366, 2443–2454. [Google Scholar] [CrossRef]
- Zappasodi, R.; Merghoub, T.; Wolchok, J.D. Emerging Concepts for Immune Checkpoint Blockade-Based Combination Therapies. Cancer Cell. 2018, 33, 581–598. [Google Scholar] [CrossRef] [Green Version]
- Ribas, A.; Wolchok, J.D. Cancer immunotherapy using checkpoint blockade. Science 2018, 359, 1350–1355. [Google Scholar] [CrossRef] [Green Version]
- Hargadon, K.M.; Johnson, C.E.; Williams, C.J. Immune checkpoint blockade therapy for cancer: An overview of FDA-approved immune checkpoint inhibitors. Int. Immunopharmacol. 2018, 62, 29–39. [Google Scholar] [CrossRef] [PubMed]
- Tawbi, H.A.; Burgess, M.; Bolejack, V.; Van Tine, B.A.; Schuetze, S.M.; Hu, J.; D’Angelo, S.; Attia, S.; Riedel, R.F.; Priebat, D.A.; et al. Pembrolizumab in advanced soft-tissue sarcoma and bone sarcoma (SARC028): A multicentre, two-cohort, single-arm, open-label, phase 2 trial. Lancet Oncol. 2017, 18, 1493–1501. [Google Scholar] [CrossRef]
- Sayour, E.J.; Mendez-Gomez, H.R.; Mitchell, D.A. Cancer vaccine immunotherapy with RNA-loaded liposomes. Int. J. Mol. Sci. 2018, 19, 2890. [Google Scholar] [CrossRef] [Green Version]
- Emens, L.A. Roadmap to a better therapeutic tumor vaccine. Int. Rev. Immunol. 2006, 25, 415–443. [Google Scholar] [CrossRef]
- Bayó, C.; Jung, G.; Español-Rego, M.; Balaguer, F.; Benitez-Ribas, D. Vaccines for non-viral cancer prevention. Int. J. Mol. Sci. 2021, 22, 10900. [Google Scholar] [CrossRef]
- Faghfuri, E.; Pourfarzi, F.; Faghfouri, A.H.; Abdoli Shadbad, M.; Hajiasgharzadeh, K.; Baradaran, B. Recent developments of RNA-based vaccines in cancer immunotherapy. Expert Opin. Biol. Ther. 2021, 21, 201–218. [Google Scholar] [CrossRef]
- Dillman, R.; Barth, N.; Selvan, S.; Beutel, L.; de Leon, C.; DePriest, C.; Peterson, C.; Nayak, S. Phase I/II Trial of Autologous Tumor Cell Line–Derived Vaccines for Recurrent or Metastatic Sarcomas. Cancer Biother. Radiopharm. 2004, 19, 581–588. [Google Scholar] [PubMed]
- Kawaguchi, S.; Wada, T.; Ida, K.; Sato, Y.; Nagoya, S.; Tsukahara, T.; Kimura, S.; Sahara, H.; Ikeda, H.; Shimozawa, K.; et al. Phase I vaccination trial of SYT-SSX junction peptide in patients with disseminated synovial sarcoma. J. Transl. Med. 2005, 3, 1. [Google Scholar] [CrossRef] [PubMed] [Green Version]
- Kawaguchi, S.; Tsukahara, T.; Ida, K.; Kimura, S.; Murase, M.; Kano, M.; Emori, M.; Nagoya, S.; Kaya, M.; Torigoe, T.; et al. SYT-SSX breakpoint peptide vaccines in patients with synovial sarcoma: A study from the Japanese Musculoskeletal Oncology Group 19. Cancer Sci. 2012, 103, 1625–1630. [Google Scholar] [CrossRef]
- Miao, L.; Zhang, Y.; Huang, L. mRNA vaccine for cancer immunotherapy. Mol. Cancer. 2021, 20, 41. [Google Scholar] [CrossRef]
- Van Nuffel, A.M.T.; Wilgenhof, S.; Thielemans, K.; Bonehill, A. Overcoming HLA restriction in clinical trials Immune monitoring of mRNA-loaded DC therapy. Oncoimmunology 2012, 1, 1392–1394. [Google Scholar] [CrossRef] [Green Version]
- Pardi, N.; Hogan, M.J.; Porter, F.W.; Weissman, D. mRNA vaccines-a new era in vaccinology. Nat. Rev. Drug Discov. 2018, 17, 261–279. [Google Scholar] [CrossRef] [Green Version]
- Grunwitz, C.; Kranz, L.M. mRNA cancer vaccines—messages that prevail. Curr. Top Microbiol. Immunol. 2017, 405, 145–164. [Google Scholar]
- Wang, Y.; Zhang, Z.; Luo, J.; Han, X.; Wei, Y.; Wei, X. mRNA vaccine: A potential therapeutic strategy. Mol. Cancer. 2021, 20, 33. [Google Scholar] [CrossRef] [PubMed]
- Vasileiou, E.; Simpson, C.R.; Shi, T.; Kerr, S.; Agrawal, U.; Akbari, A.; Bedston, S.; Beggs, J.; Bradley, D.; Chuter, A.; et al. Interim findings from first-dose mass COVID-19 vaccination roll-out and COVID-19 hospital admissions in Scotland: A national prospective cohort study. Lancet 2021, 397, 1646–1657. [Google Scholar] [CrossRef]
- Thompson, M.G.; Burgess, J.L.; Naleway, A.L.; Tyner, H.; Yoon, S.K.; Meece, J.; Olsho, L.E.W.; Caban-Martinez, A.J.; Fowlkes, A.L.; Lutrick, K.; et al. Prevention and Attenuation of COVID-19 with the BNT162b2 and mRNA-1273 Vaccines. N. Engl. J. Med. 2021, 385, 320–329. [Google Scholar] [CrossRef] [PubMed]
- Goyal, M.; Tewatia, N.; Vashisht, H.; Jain, R.; Kumar, S. Novel corona virus (COVID-19); Global efforts and effective investigational medicines: A review. J. Infect Public Health 2021, 14, 910–921. [Google Scholar] [CrossRef] [PubMed]
- Shahnazari, M.; Samadi, P.; Pourjafar, M.; Jalali, A. Therapeutic vaccines for colorectal cancer: The progress and future prospect. Int. Immunopharmacol. 2020, 88, 106944. [Google Scholar] [CrossRef]
- Sullenger, B.A.; Nair, S. From the RNAworld to the clinic. Science 2016, 352, 1417–1420. [Google Scholar] [CrossRef] [Green Version]
- Pardi, N.; Hogan, M.J.; Weissman, D. Recent advances in mRNA vaccine technology. Curr. Opin. Immunol. 2020, 65, 14–20. [Google Scholar] [CrossRef]
- Kübler, H.; Scheel, B.; Gnad-Vogt, U.; Miller, K.; Schultze-Seemann, W.; Dorp, F.; Parmiani, G.; Hampel, C.; Wedel, S.; Trojan, L.; et al. Self-adjuvanted mRNA vaccination in advanced prostate cancer patients: A first-in-man phase I/IIa study. J. Immunother. Cancer. 2015, 3, 26. [Google Scholar] [CrossRef] [Green Version]
- Fiedler, K.; Lazzaro, S.; Lutz, J.; Rauch, S.; Heidenreich, R. mRNA cancer vaccines. Recent Results Cancer Res. 2016, 209, 61–85. [Google Scholar]
- Abeshouse, A.; Adebamowo, C.; Adebamowo, S.N.; Akbani, R.; Akeredolu, T.; Ally, A.; Anderson, M.L.; Anur, P.; Appelbaum, E.L.; Armenia, J.; et al. Comprehensive and Integrated Genomic Characterization of Adult Soft Tissue Sarcomas. Cell 2017, 171, 950–965.e28. [Google Scholar] [CrossRef] [PubMed] [Green Version]
- Barretina, J.; Taylor, B.S.; Banerji, S.; Ramos, A.H.; Lagos-Quintana, M.; Decarolis, P.L.; Shah, K.; Socci, N.D.; Weir, B.A.; Ho, A.; et al. Subtype-specific genomic alterations define new targets for soft-tissue sarcoma therapy. Nat. Genet. 2010, 42, 715–721. [Google Scholar] [CrossRef] [Green Version]
- Charoentong, P.; Finotello, F.; Angelova, M.; Mayer, C.; Efremova, M.; Rieder, D.; Hackl, H.; Trajanoski, Z. Pan-cancer Immunogenomic Analyses Reveal Genotype-Immunophenotype Relationships and Predictors of Response to Checkpoint Blockade. Cell Rep. 2017, 18, 248–262. [Google Scholar] [CrossRef] [PubMed] [Green Version]
- Bhattacharya, S.; Dunn, P.; Thomas, C.G.; Smith, B.; Schaefer, H.; Chen, J.; Hu, Z.; Zalocusky, K.A.; Shankar, R.D.; Shen-Orr, S.S.; et al. ImmPort, toward repurposing of open access immunological assay data for translational and clinical research. Sci. Data 2018, 5, 180015. [Google Scholar] [CrossRef]
- Wilkerson, M.D.; Hayes, D.N. ConsensusClusterPlus: A class discovery tool with confidence assessments and item tracking. Bioinformatics 2010, 26, 1572–1573. [Google Scholar] [CrossRef] [PubMed] [Green Version]
- Kapp, A.V.; Tibshirani, R. Are clusters found in one dataset present in another dataset? Biostatistics 2007, 8, 9–31. [Google Scholar] [CrossRef] [PubMed] [Green Version]
- Thorsson, V.; Gibbs, D.L.; Brown, S.D.; Wolf, D.; Bortone, D.S.; Ou Yang, T.H.; Porta-Pardo, E.; Gao, G.F.; Plaisier, C.L.; Eddy, J.A.; et al. The Immune Landscape of Cancer. Immunity 2018, 48, 812–830.e14. [Google Scholar] [CrossRef] [Green Version]
- Trapnell, C.; Cacchiarelli, D.; Grimsby, J.; Pokharel, P.; Li, S.; Morse, M.; Lennon, N.J.; Livak, K.J.; Mikkelsen, T.S.; Rinn, J.L. The dynamics and regulators of cell fate decisions are revealed by pseudotemporal ordering of single cells. Nat. Biotechnol. 2014, 32, 381–386. [Google Scholar] [CrossRef] [Green Version]
- Szklarczyk, D.; Gable, A.L.; Lyon, D.; Junge, A.; Wyder, S.; Huerta-Cepas, J.; Simonovic, M.; Doncheva, N.T.; Morris, J.H.; Bork, P.; et al. STRING v11, Protein-protein association networks with increased coverage, supporting functional discovery in genome-wide experimental datasets. Nucleic Acids Res. 2019, 47, D607–D613. [Google Scholar] [CrossRef] [Green Version]
- Chin, C.H.; Chen, S.H.; Wu, H.H.; Ho, C.W.; Ko, M.T.; Lin, C.Y. cytoHubba: Identifying hub objects and sub-networks from complex interactome. BMC Syst. Biol. 2014, 8, S11. [Google Scholar] [CrossRef] [PubMed] [Green Version]
- Sha, D.; Jin, Z.; Budczies, J.; Kluck, K.; Stenzinger, A.; Sinicrope, F.A. Tumor mutational burden as a predictive biomarker in solid tumors. Cancer Discov. 2020, 10, 1808–1825. [Google Scholar] [CrossRef] [PubMed]
- Xie, L.; Wang, G.; Sang, W.; Li, J.; Zhang, Z.; Li, W.; Yan, J.; Zhao, Q.; Dai, Y. Phenolic immunogenic cell death nanoinducer for sensitizing tumor to PD-1 checkpoint blockade immunotherapy. Biomaterials 2021, 269, 120638. [Google Scholar] [CrossRef] [PubMed]
- Huang, X.; Tang, T.; Zhang, G.; Liang, T. Identification of tumor antigens and immune subtypes of cholangiocarcinoma for mRNA vaccine development. Mol. Cancer. 2021, 20, 50. [Google Scholar] [CrossRef] [PubMed]
- Huang, X.; Zhang, G.; Tang, T.; Liang, T. Identification of tumor antigens and immune subtypes of pancreatic adenocarcinoma for mRNA vaccine development. Mol. Cancer. 2021, 20, 44. [Google Scholar] [CrossRef]
- Dhont, L.; Mascaux, C.; Belayew, A. The helicase-like transcription factor (HLTF) in cancer: Loss of function or oncomorphic conversion of a tumor suppressor? Cell Mol. Life Sci. 2016, 73, 129–145. [Google Scholar] [CrossRef] [PubMed]
- Okada, T.; Lee, A.Y.; Qin, L.X.; Agaram, N.; Mimae, T.; Shen, Y.; O’Connor, R.; López-Lago, M.A.; Craig, A.; Miller, M.L.; et al. Integrin-α10 dependency identifies RAC and rictor as therapeutic targets in high-grade myxofibrosarcoma. Cancer Discov. 2016, 6, 1148–1165. [Google Scholar] [CrossRef] [Green Version]
- Hu, Q.; Zhou, S.; Hu, X.; Zhang, H.; Huang, S.; Wang, Y. Systematic screening identifies a 2-gene signature as a high-potential prognostic marker of undifferentiated pleomorphic sarcoma/myxofibrosarcoma. J. Cell. Mol. Med. 2020, 24, 1010–1021. [Google Scholar] [CrossRef] [Green Version]
- Behjati, S.; Tarpey, P.S.; Sheldon, H.; Martincorena, I.; Van Loo, P.; Gundem, G.; Wedge, D.; Ramakrishna, M.; Cooke, S.L.; Pillay, N.; et al. Recurrent PTPRB and PLCG1 mutations in angiosarcoma. Nat. Genet. 2014, 46, 376–379. [Google Scholar] [CrossRef]
- Kunze, K.; Spieker, T.; Gamerdinger, U.; Nau, K.; Berger, J.; Dreyer, T.; Sindermann, J.R.; Hoffmeier, A.; Gattenlöhner, S.; Bräuninger, A. A recurrent activating PLCG1 mutation in cardiac angiosarcomas increases apoptosis resistance and invasiveness of endothelial cells. Cancer Res. 2014, 74, 6173–6183. [Google Scholar] [CrossRef] [Green Version]
- Sun, L.; Li, J.; Yan, B. Gene expression profiling analysis of osteosarcoma cell lines. Mol. Med. Rep. 2015, 12, 4266–4272. [Google Scholar] [CrossRef] [PubMed] [Green Version]
- Suizu, F.; Hiramuki, Y.; Okumura, F.; Matsuda, M.; Okumura, A.J.; Hirata, N.; Narita, M.; Kohno, T.; Yokota, J.; Bohgaki, M.; et al. The E3 Ligase TTC3 Facilitates Ubiquitination and Degradation of Phosphorylated Akt. Dev. Cell. 2009, 17, 800–810. [Google Scholar] [CrossRef] [PubMed]
- Dey-Guha, I.; Alves, C.P.; Yeh, A.C.; Salony Sole, X.; Darp, R.; Ramaswamy, S. A mechanism for asymmetric cell division resulting in proliferative asynchronicity. Mol. Cancer Res. 2015, 13, 223–230. [Google Scholar] [CrossRef] [Green Version]
- Galluzzi, L.; Buqué, A.; Kepp, O.; Zitvogel, L.; Kroemer, G. Immunogenic cell death in cancer and infectious disease. Nat. Rev. Immunol. 2017, 17, 97–111. [Google Scholar] [CrossRef]
- Galluzzi, L.; Vitale, I.; Warren, S.; Adjemian, S.; Agostinis, P.; Martinez, A.B.; Chan, T.A.; Coukos, G.; Demaria, S.; Deutsch, E.; et al. Consensus guidelines for the definition, detection and interpretation of immunogenic cell death. J. Immunother. Cancer 2020, 8, 70. [Google Scholar] [CrossRef] [Green Version]
- Li, B.; Cui, Y.; Nambiar, D.K.; Sunwoo, J.B.; Li, R. The immune subtypes and landscape of squamous cell carcinoma. Clin. Cancer Res. 2019, 25, 3528–3537. [Google Scholar] [CrossRef] [Green Version]
- Ayodele, O.; Abdul Razak, A.R. Immunotherapy in soft-tissue sarcoma. Curr. Oncol. 2019, 26 (Suppl. S1), 17–23. [Google Scholar]
- Monga, V.; Skubitz, K.M.; Maliske, S.; Mott, S.L.; Dietz, H.; Hirbe, A.C.; Van Tine, B.A.; Oppelt, P.; Okuno, S.; Robinson, S.; et al. A retrospective analysis of the efficacy of immunotherapy in metastatic soft-tissue sarcomas. Cancers 2020, 12, 1873. [Google Scholar] [CrossRef]
- Clemente, O.; Ottaiano, A.; Di Lorenzo, G.; Bracigliano, A.; Lamia, S.; Cannella, L.; Pizzolorusso, A.; Di Marzo, M.; Santorsola, M.; De Chiara, A.; et al. Is immunotherapy in the future of therapeutic management of sarcomas? J. Transl. Med. 2021, 19, 173. [Google Scholar] [CrossRef] [PubMed]
- Ben-Ami, E.; Barysauskas, C.M.; Solomon, S.; Tahlil, K.; Malley, R.; Hohos, M.; Polson, K.; Loucks, M.; Severgnini, M.; Patel, T.; et al. Immunotherapy with single agent nivolumab for advanced leiomyosarcoma of the uterus: Results of a phase 2 study. Cancer 2017, 123, 3285–3290. [Google Scholar] [CrossRef] [Green Version]
- Maki, R.G.; Jungbluth, A.A.; Gnjatic, S.; Schwartz, G.K.; D’Adamo, D.R.; Keohan, M.L.; Wagner, M.J.; Scheu, K.; Chiu, R.; Ritter, E.; et al. A pilot study of anti-CTLA4 antibody ipilimumab in patients with synovial sarcoma. Sarcoma 2013, 2013, 168145. [Google Scholar] [CrossRef]
- Holmgaard, R.B.; Schaer, D.A.; Li, Y.; Castaneda, S.P.; Murphy, M.Y.; Xu, X.; Inigo, I.; Dobkin, J.; Manro, J.R.; Iversen, P.W.; et al. Targeting the TGFβ pathway with galunisertib, a TGFβRI small molecule inhibitor, promotes anti-tumor immunity leading to durable, complete responses, as monotherapy and in combination with checkpoint blockade. J. Immunother. Cancer 2018, 6, 47. [Google Scholar] [CrossRef] [PubMed]
- Ahmed, N.; Brawley, V.S.; Hegde, M.; Robertson, C.; Ghazi, A.; Gerken, C.; Liu, E.; Dakhova, O.; Ashoori, A.; Corder, A.; et al. Human epidermal growth factor receptor 2 (HER2)-Specific chimeric antigen receptor-Modified T cells for the immunotherapy of HER2-positive sarcoma. J. Clin. Oncol. 2015, 33, 1688–1696. [Google Scholar] [CrossRef]
- Breitbach, C.J.; Burke, J.; Jonker, D.; Stephenson, J.; Haas, A.R.; Chow, L.Q.M.; Nieva, J.; Hwang, T.-H.; Moon, A.; Patt, R.; et al. Intravenous delivery of a multi-mechanistic cancer-targeted oncolytic poxvirus in humans. Nature 2011, 477, 99–104. [Google Scholar] [CrossRef] [PubMed]
- Rytlewski, J.; Milhem, M.M.; Monga, V. Turning ‘Cold’ tumors ‘Hot’: Immunotherapies in sarcoma. Ann. Transl. Med. 2021, 9, 1039. [Google Scholar] [CrossRef] [PubMed]


Publisher’s Note: MDPI stays neutral with regard to jurisdictional claims in published maps and institutional affiliations. |
© 2022 by the authors. Licensee MDPI, Basel, Switzerland. This article is an open access article distributed under the terms and conditions of the Creative Commons Attribution (CC BY) license (https://creativecommons.org/licenses/by/4.0/).
Share and Cite
Wu, C.; Duan, Y.; Gong, S.; Osterhoff, G.; Kallendrusch, S.; Schopow, N. Identification of Tumor Antigens and Immune Subtypes for the Development of mRNA Vaccines and Individualized Immunotherapy in Soft Tissue Sarcoma. Cancers 2022, 14, 448. https://0-doi-org.brum.beds.ac.uk/10.3390/cancers14020448
Wu C, Duan Y, Gong S, Osterhoff G, Kallendrusch S, Schopow N. Identification of Tumor Antigens and Immune Subtypes for the Development of mRNA Vaccines and Individualized Immunotherapy in Soft Tissue Sarcoma. Cancers. 2022; 14(2):448. https://0-doi-org.brum.beds.ac.uk/10.3390/cancers14020448
Chicago/Turabian StyleWu, Changwu, Yingjuan Duan, Siming Gong, Georg Osterhoff, Sonja Kallendrusch, and Nikolas Schopow. 2022. "Identification of Tumor Antigens and Immune Subtypes for the Development of mRNA Vaccines and Individualized Immunotherapy in Soft Tissue Sarcoma" Cancers 14, no. 2: 448. https://0-doi-org.brum.beds.ac.uk/10.3390/cancers14020448