
Molecular Landscape of the Coagulome of Oral Squamous Cell Carcinoma

 , , , , and
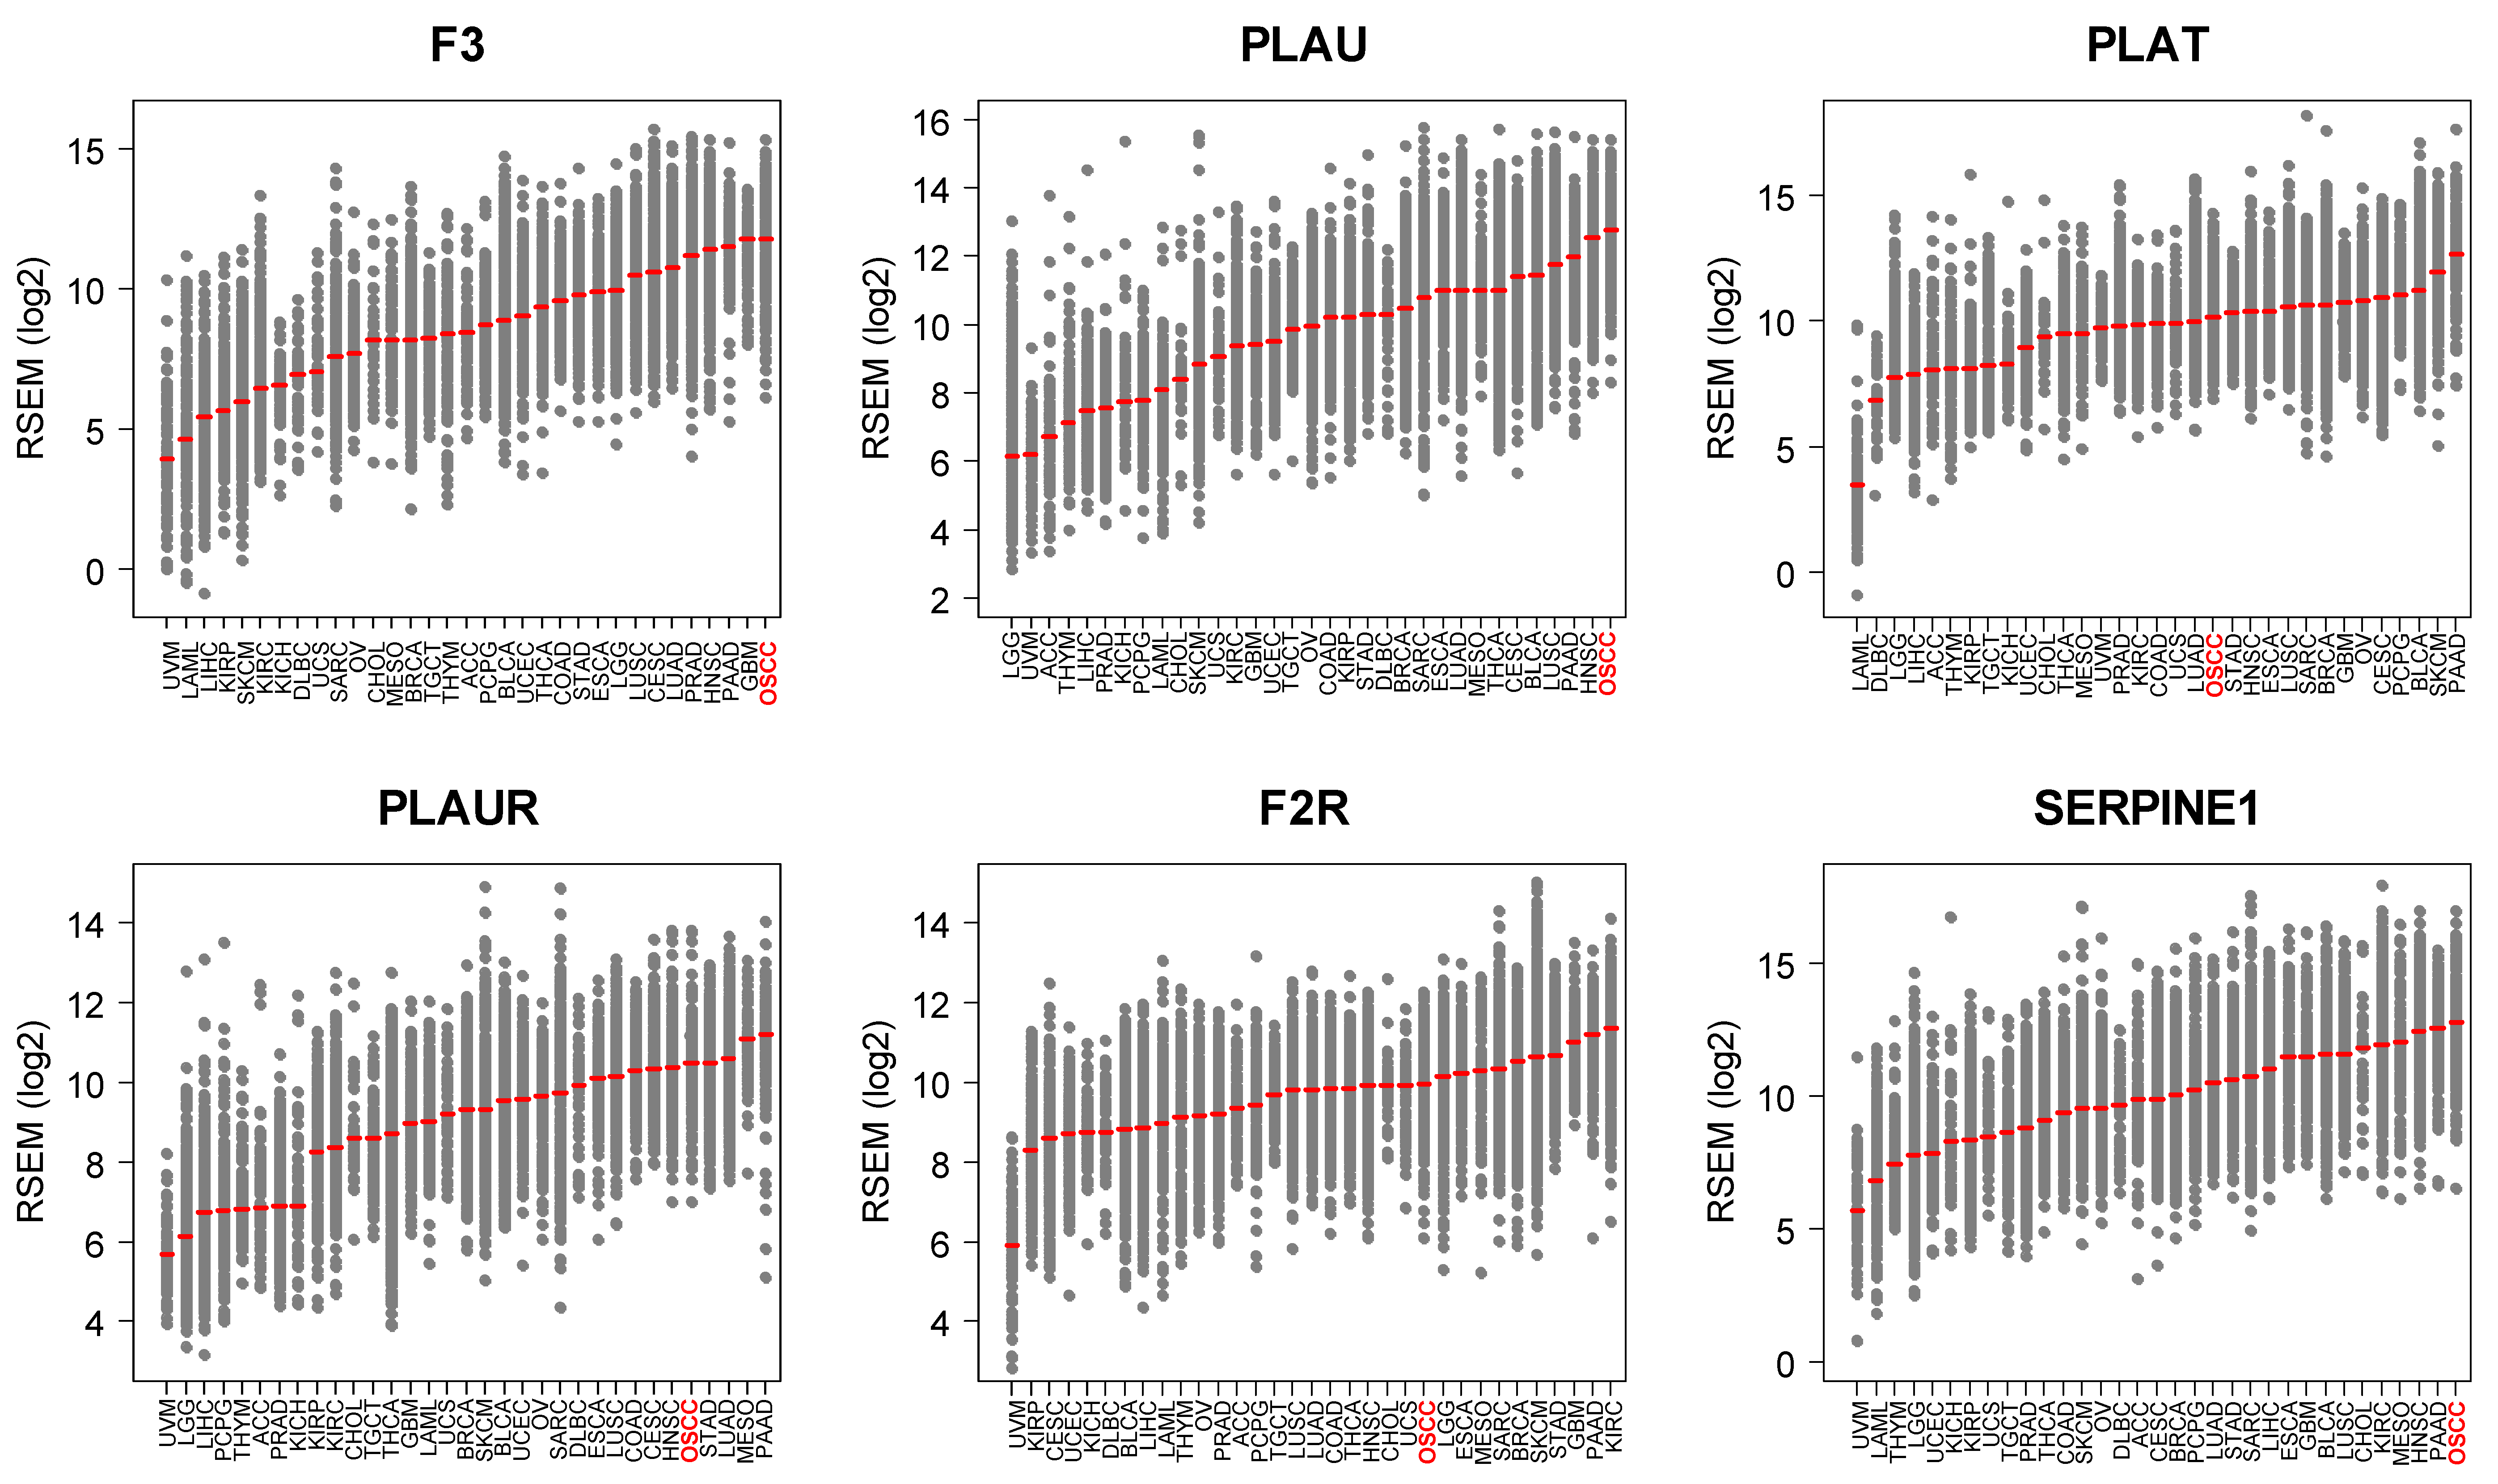
Abstract
:Simple Summary
Abstract
1. Introduction
2. Materials and Methods
2.1. Bulk RNA-Seq and DNA Methylation Analysis from Human Tumors
2.2. Single-Cell Transcriptomics
2.3. Tumor Microenvironment Analysis
2.4. Gene Set Enrichment Analysis (GSEA)
2.5. Cell Culture and Reagents
2.6. Antibodies and Immunoblot Analysis
2.7. Statistical Analyses
3. Results
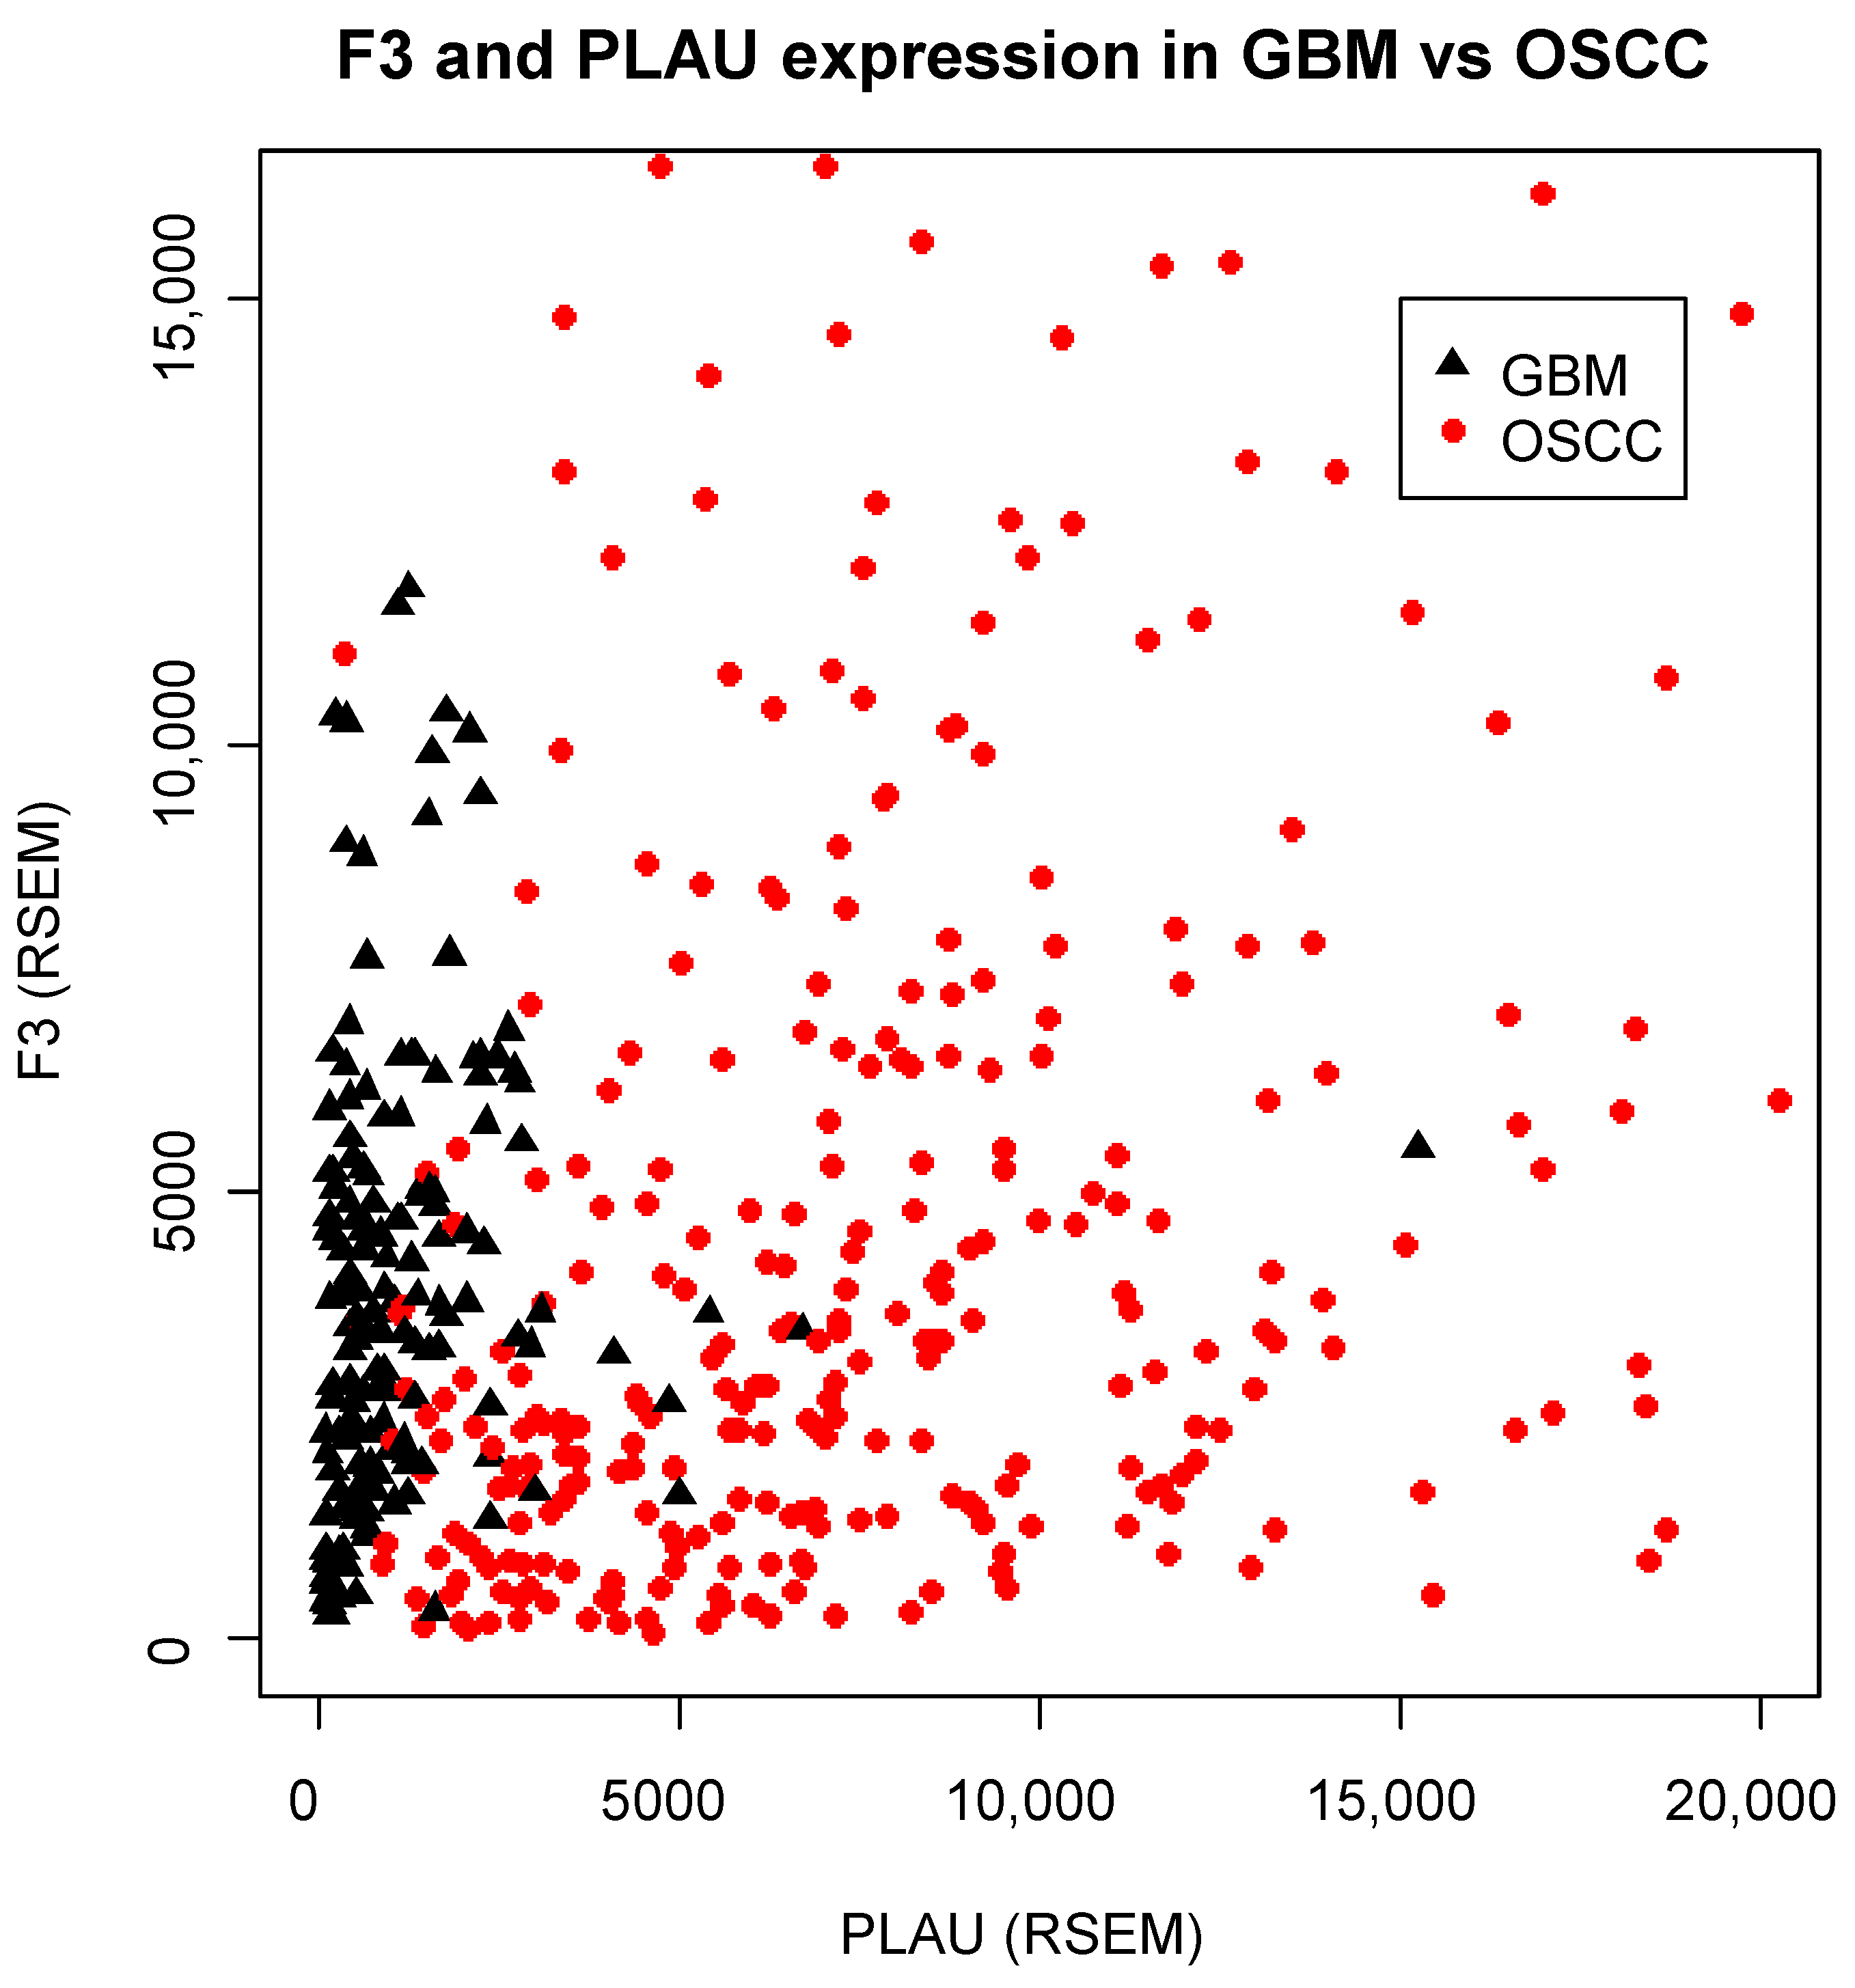
3.1. OSCC Express the Highest Levels of F3/PLAU across Human Tumors
3.2. The Coagulome of OSCC Is Genetically Stable and Is Correlated with Locus-Specific DNA Methylation
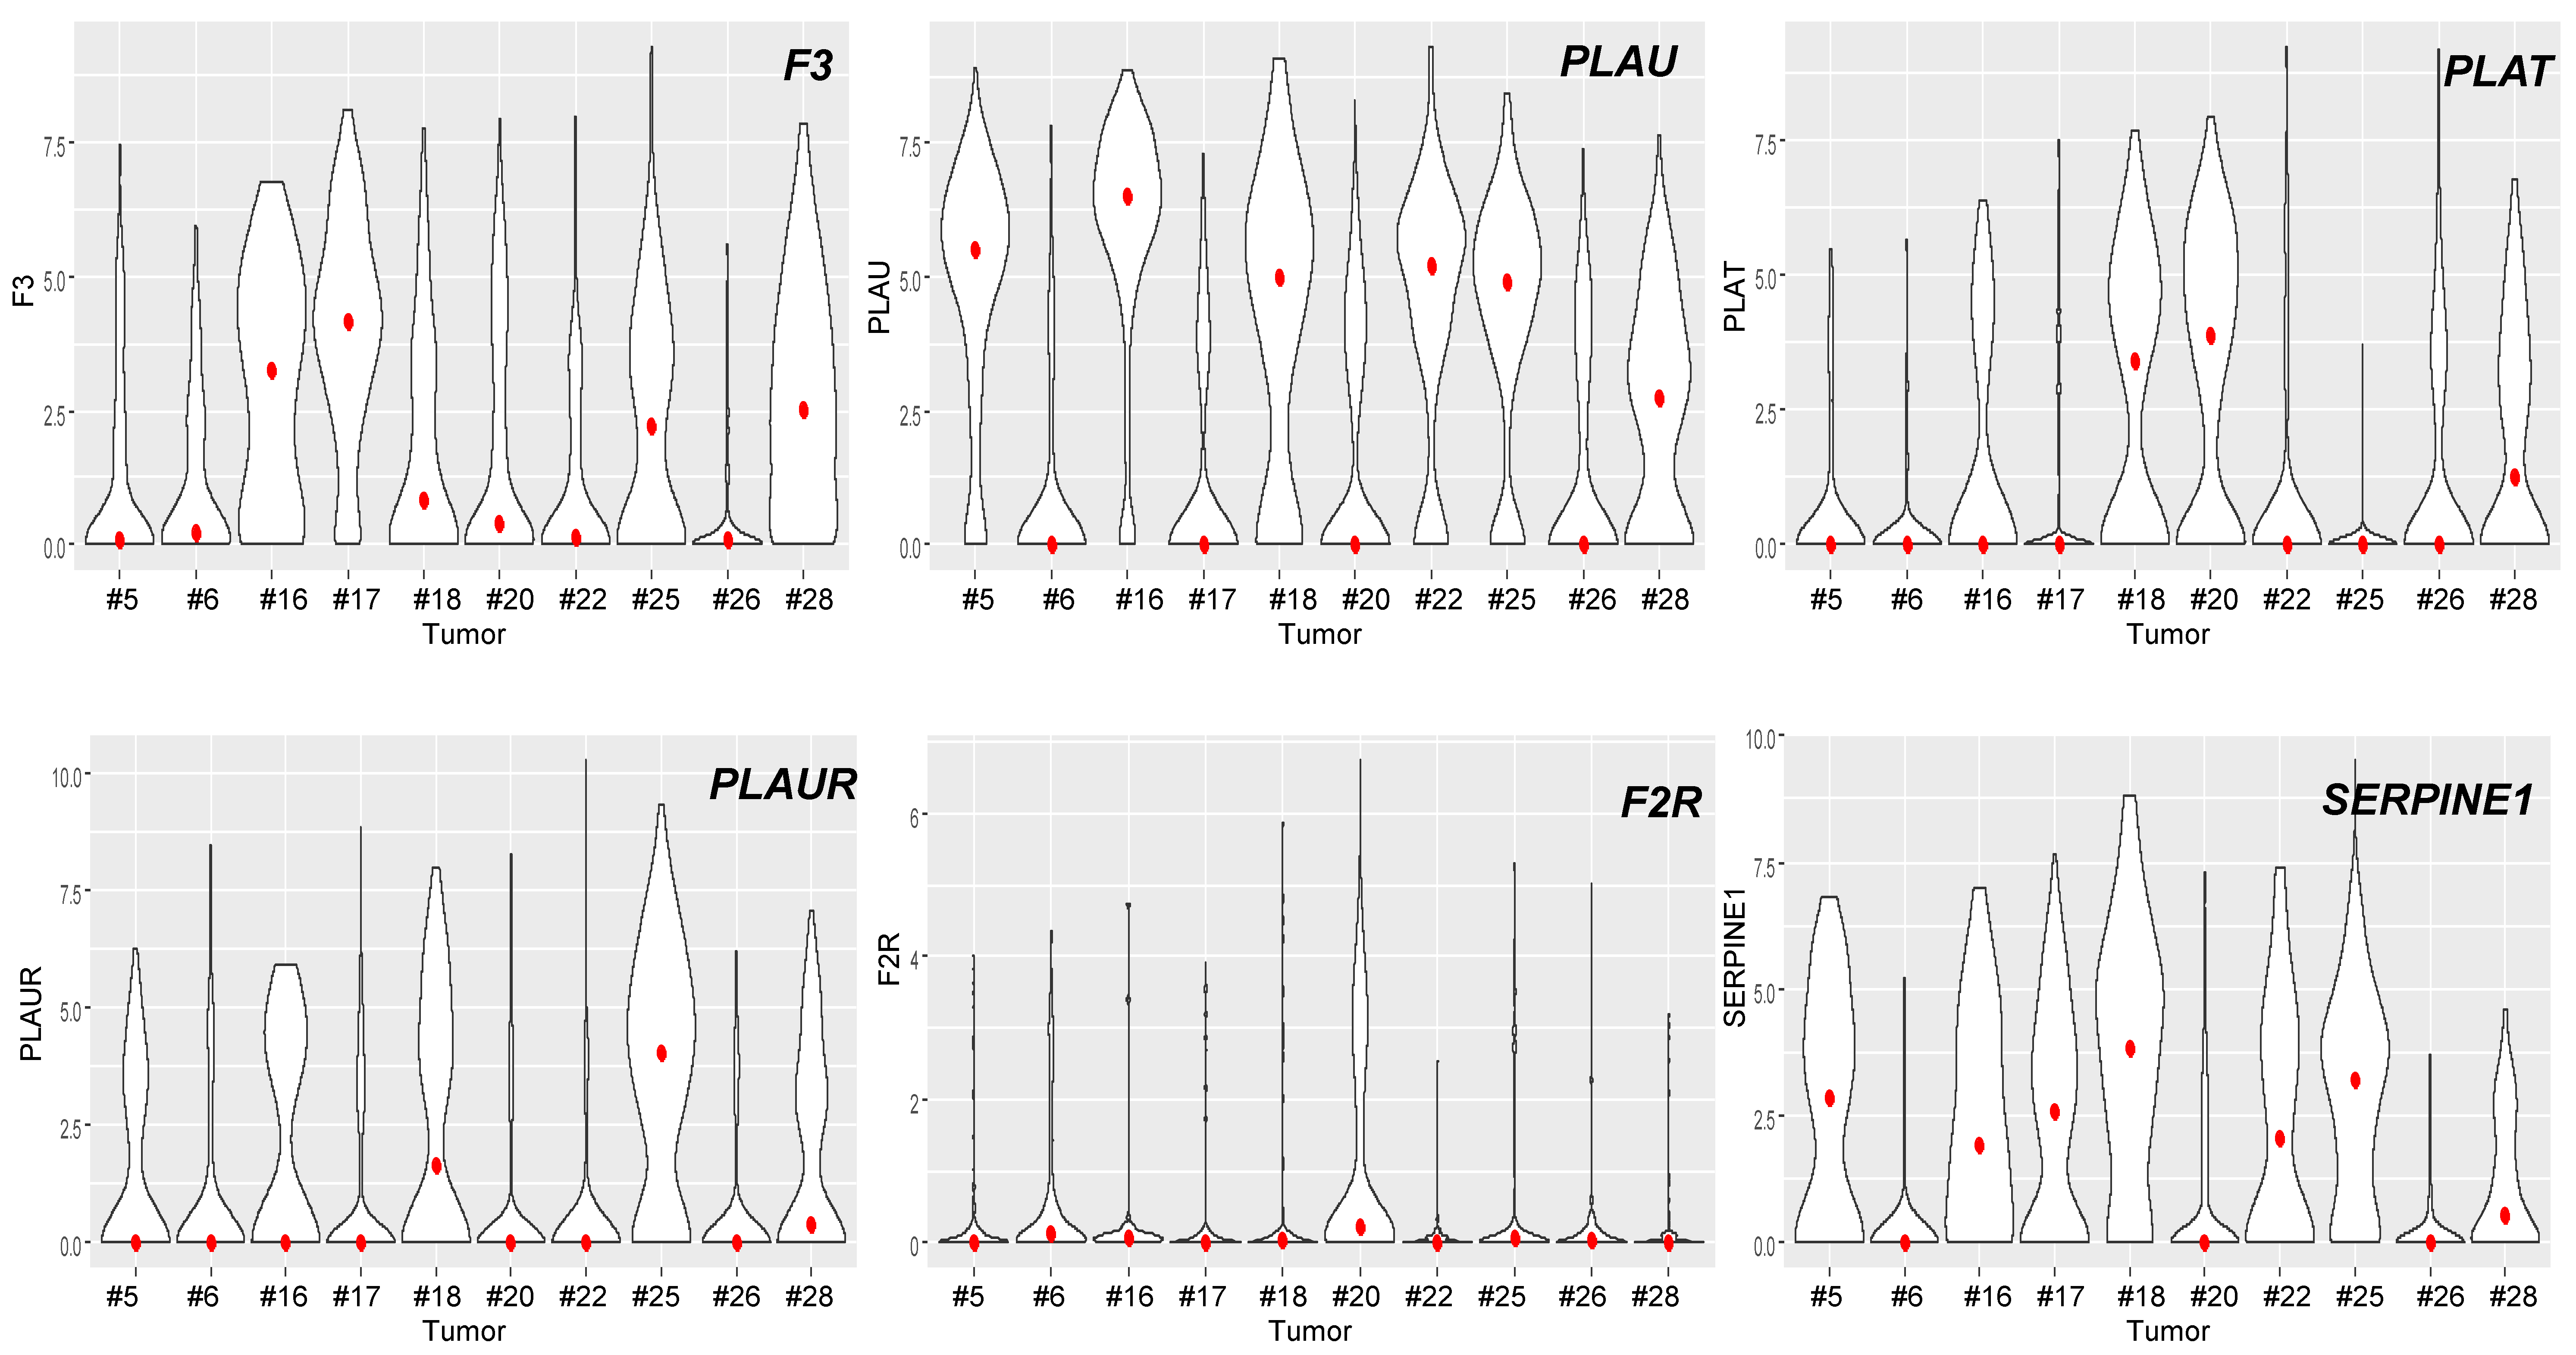
3.3. The Coagulome of OSCC at the Single-Cell Resolution
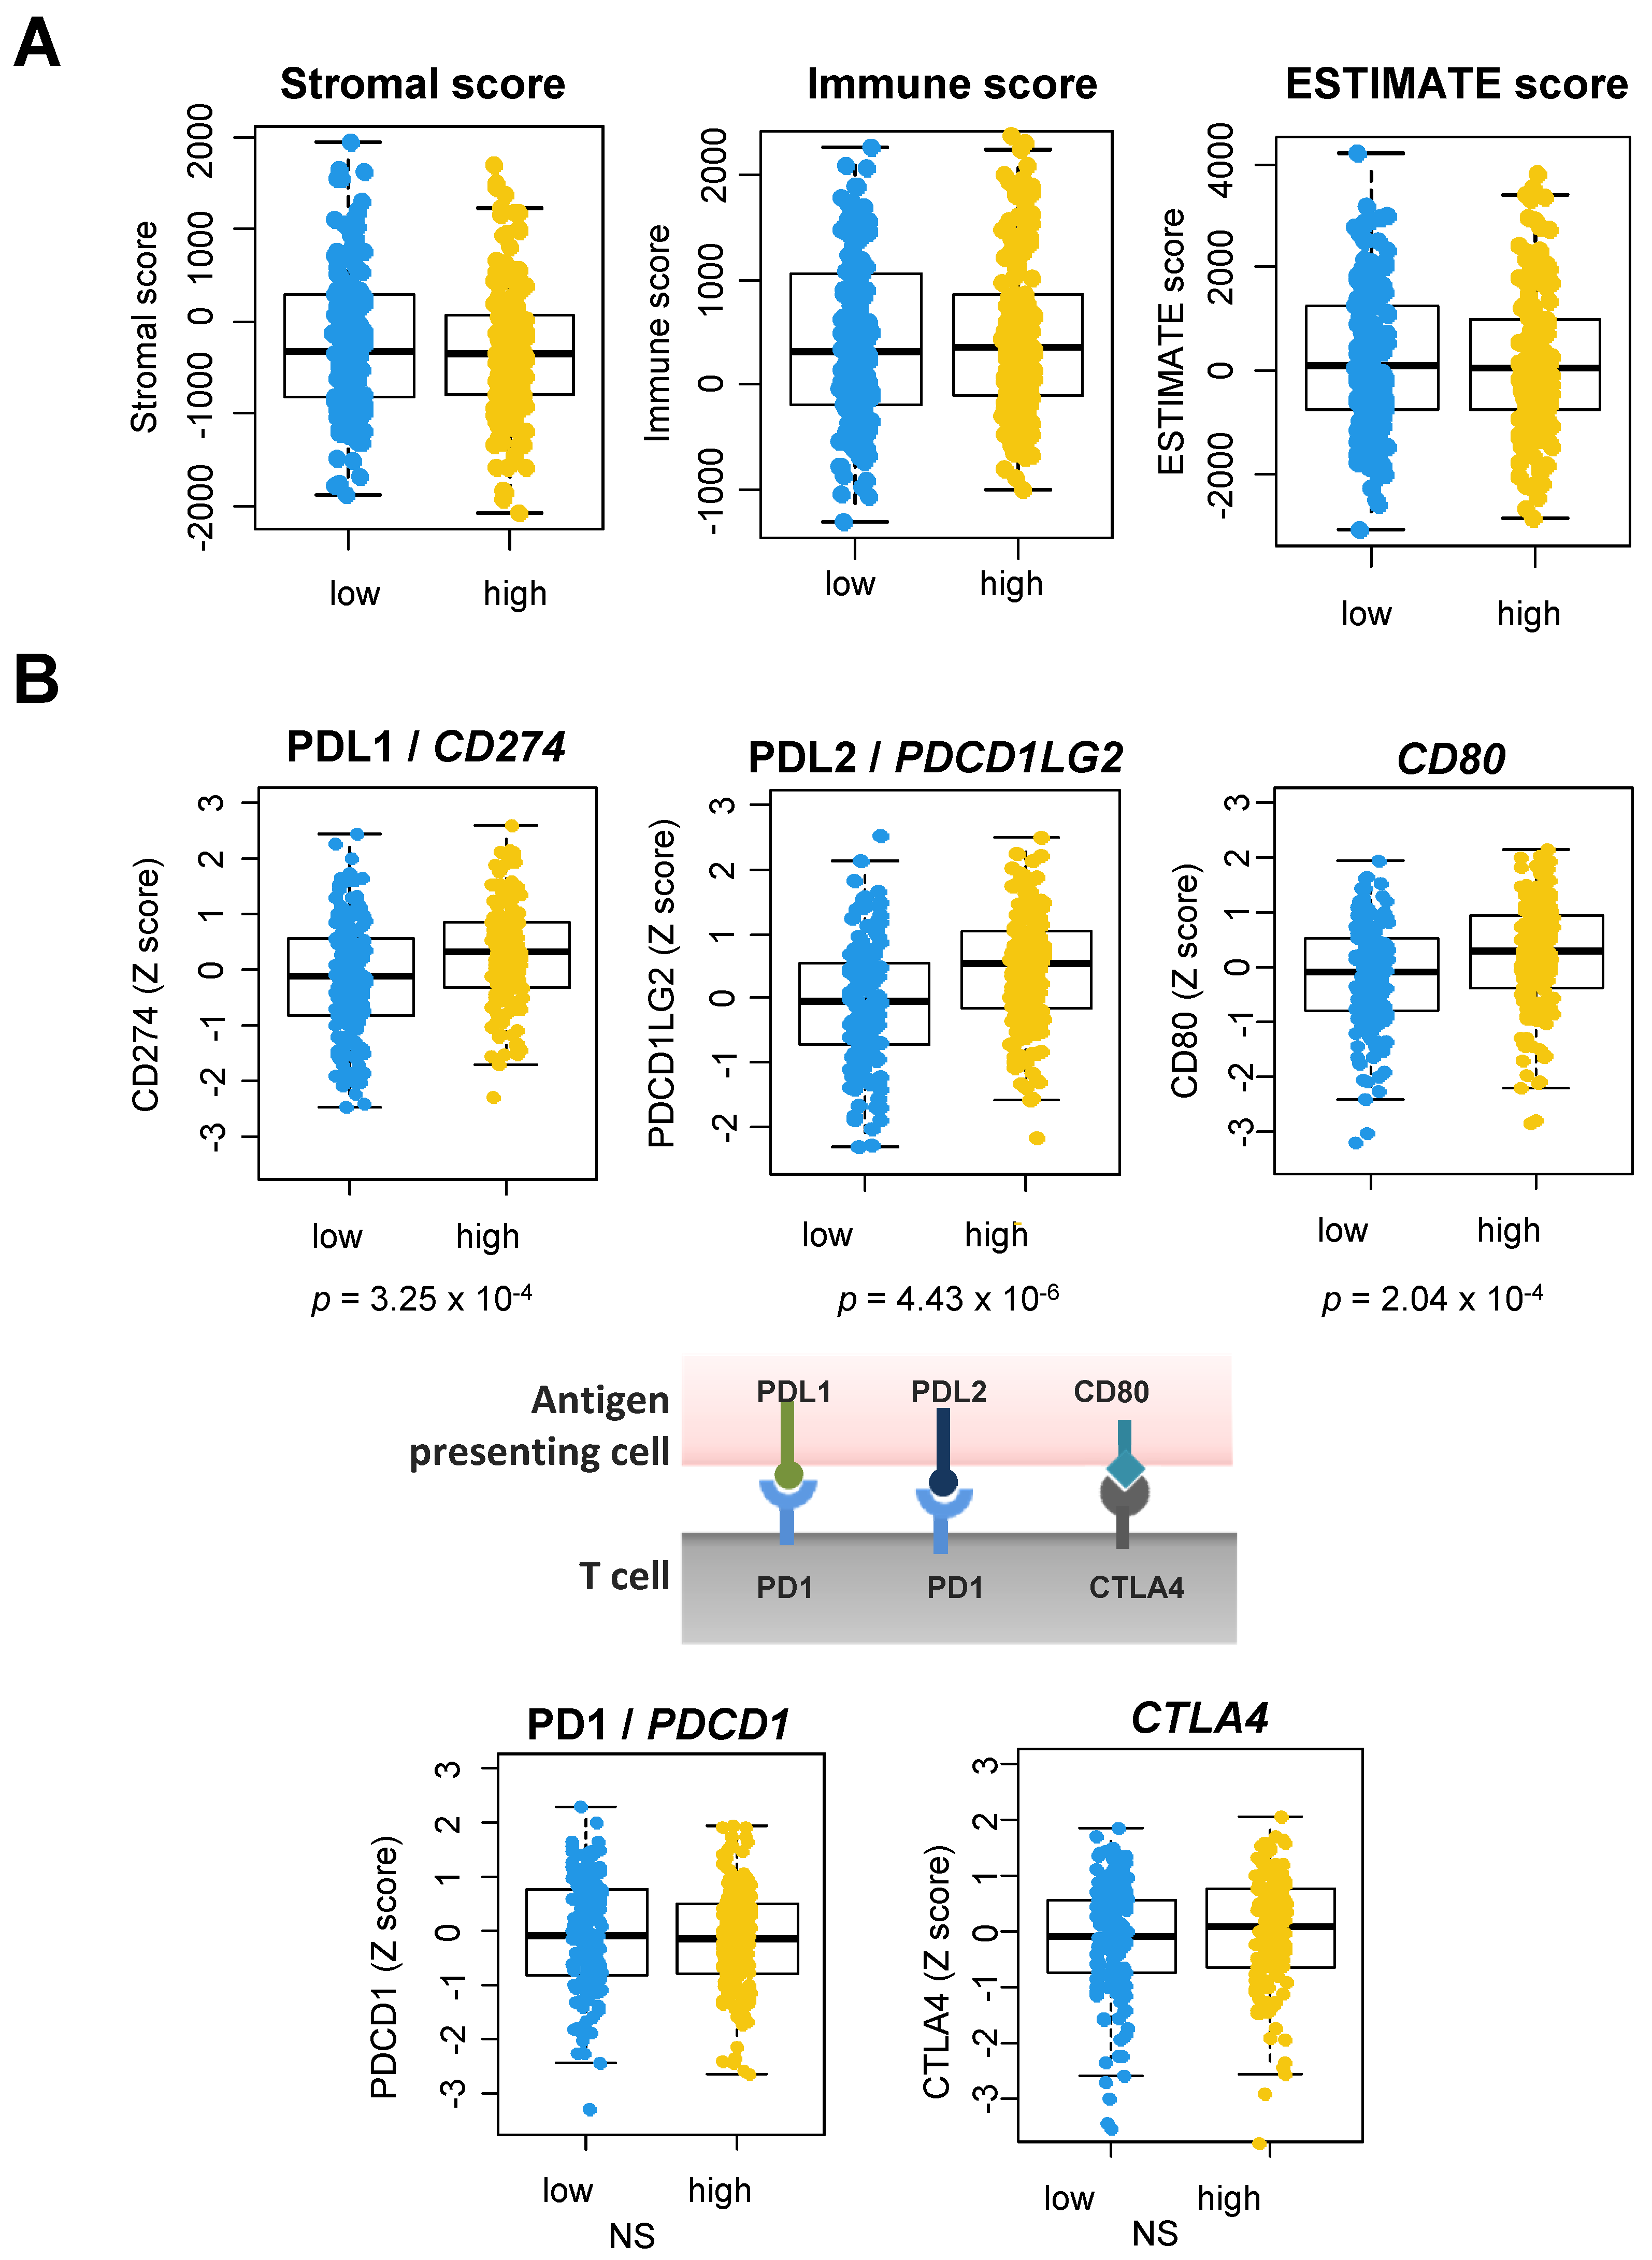
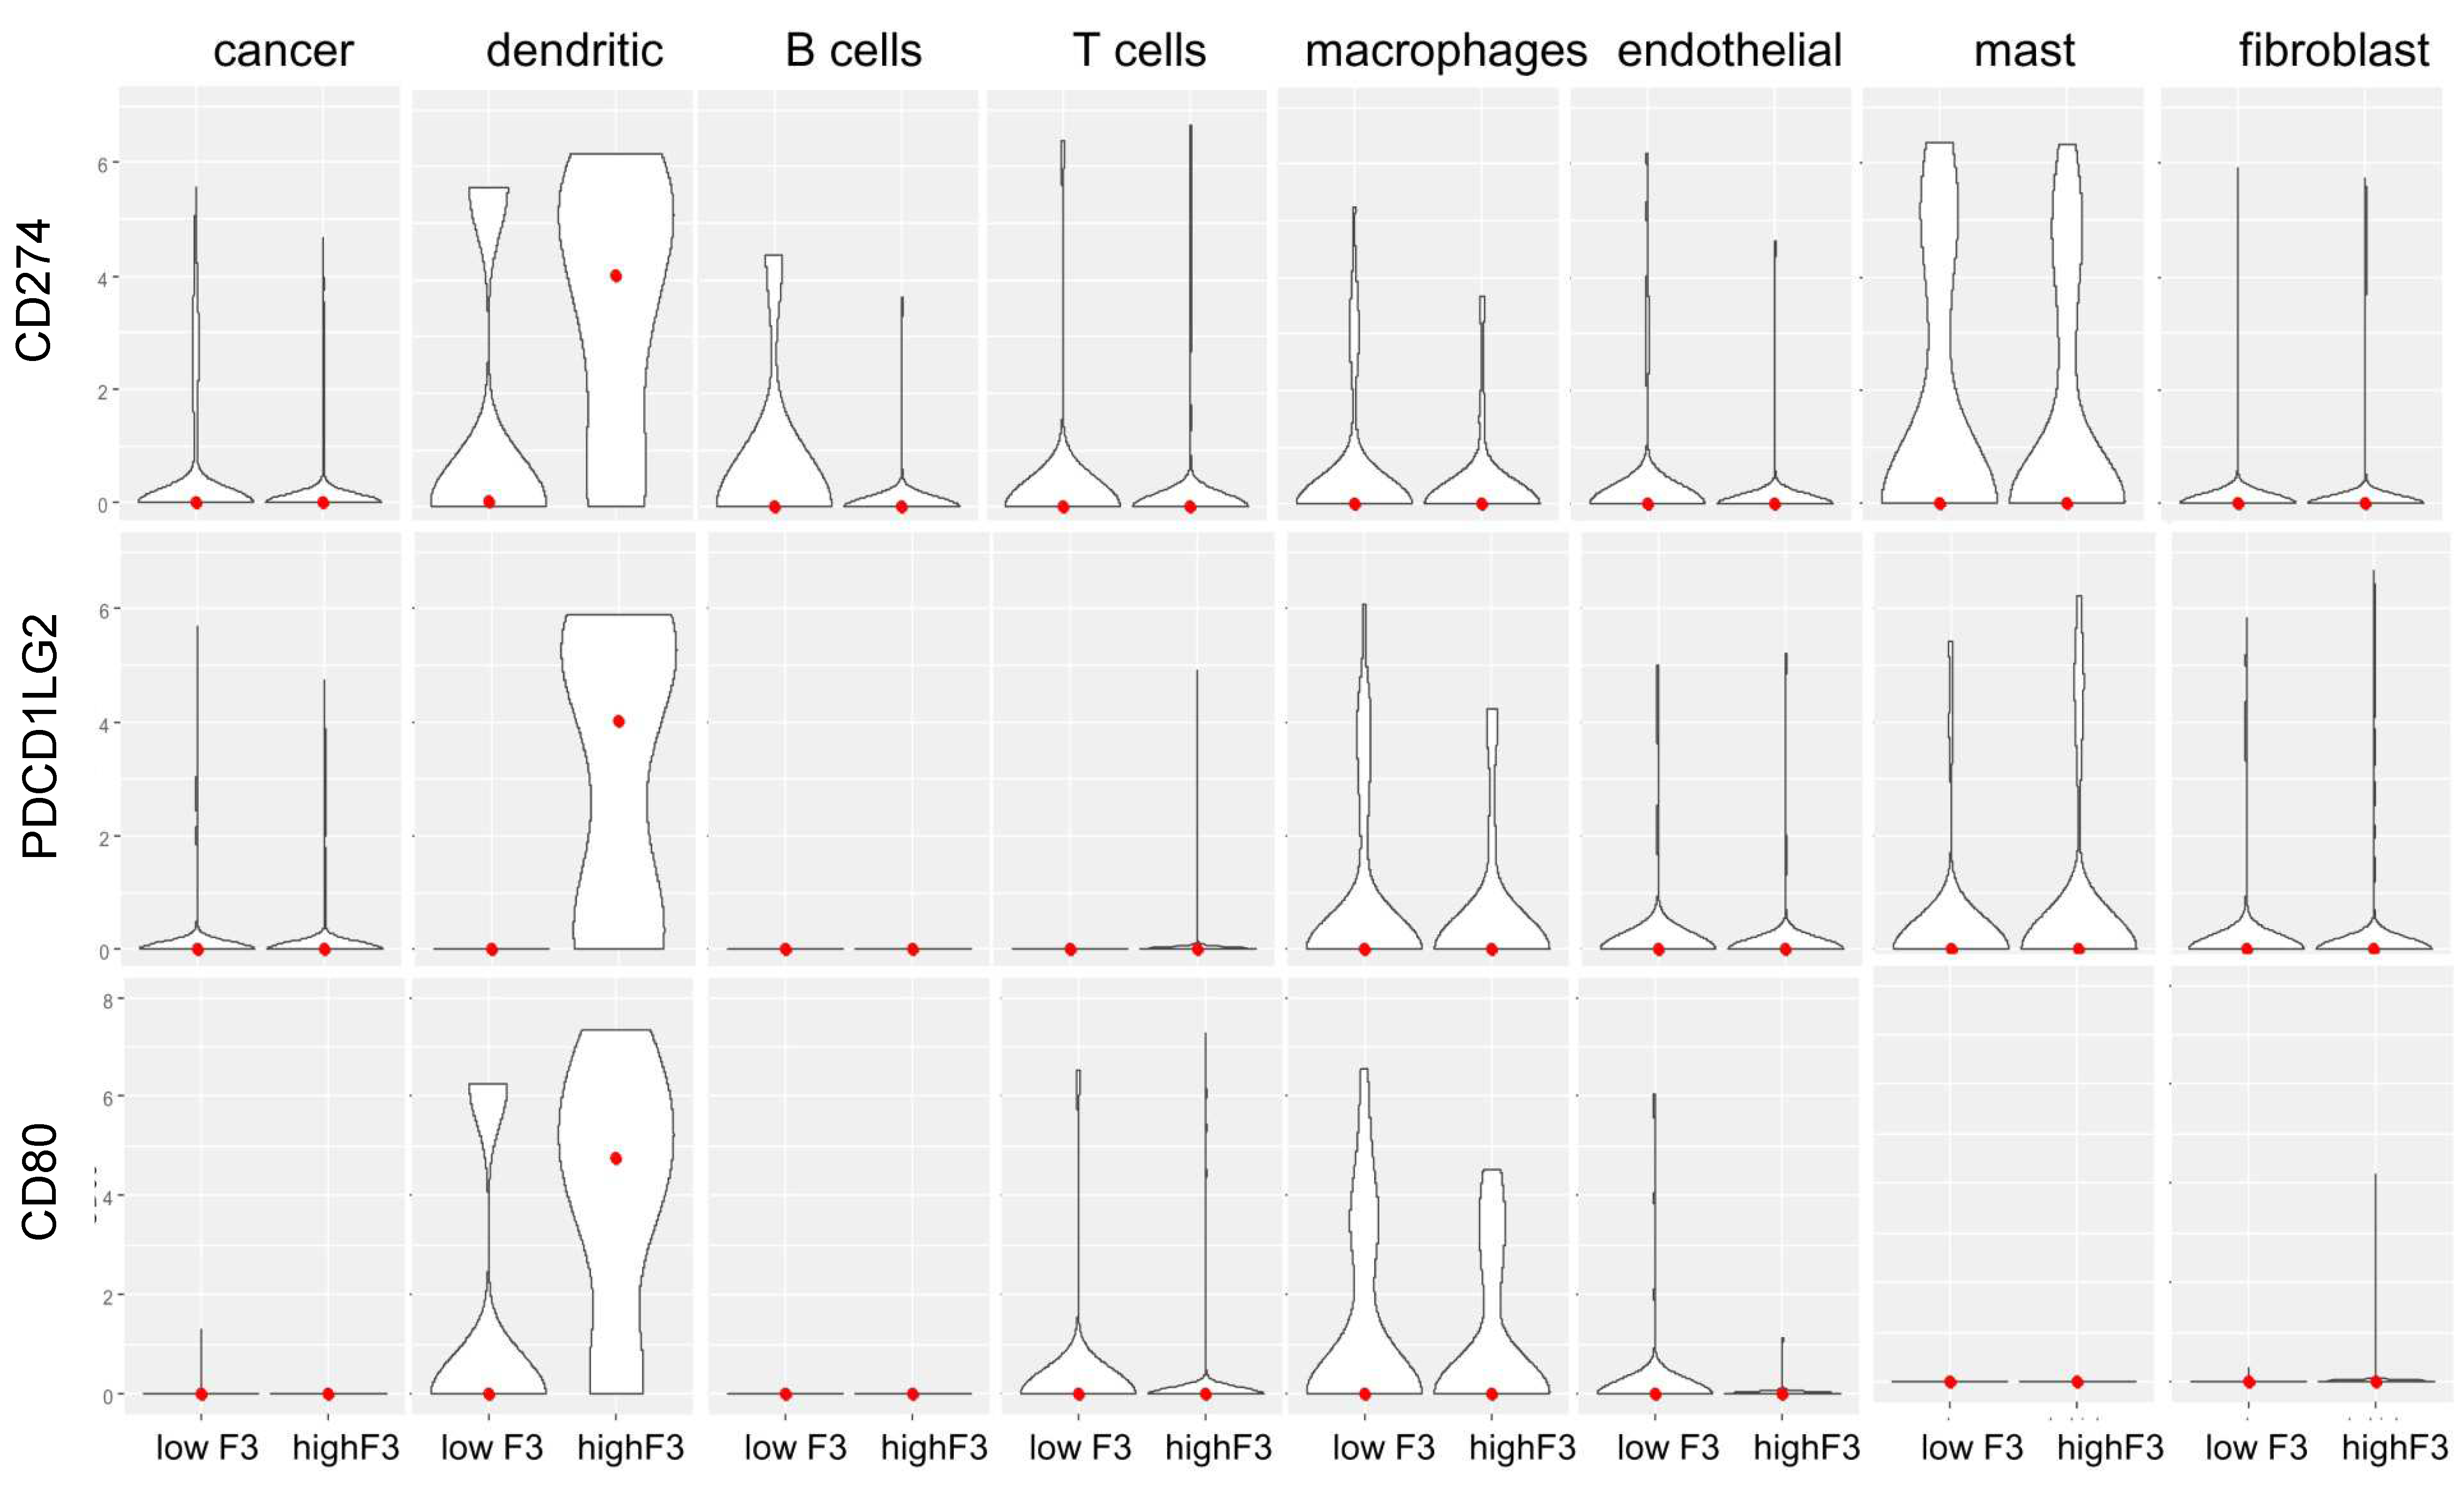
3.4. A Link between the Coagulome and the TME of OSCC
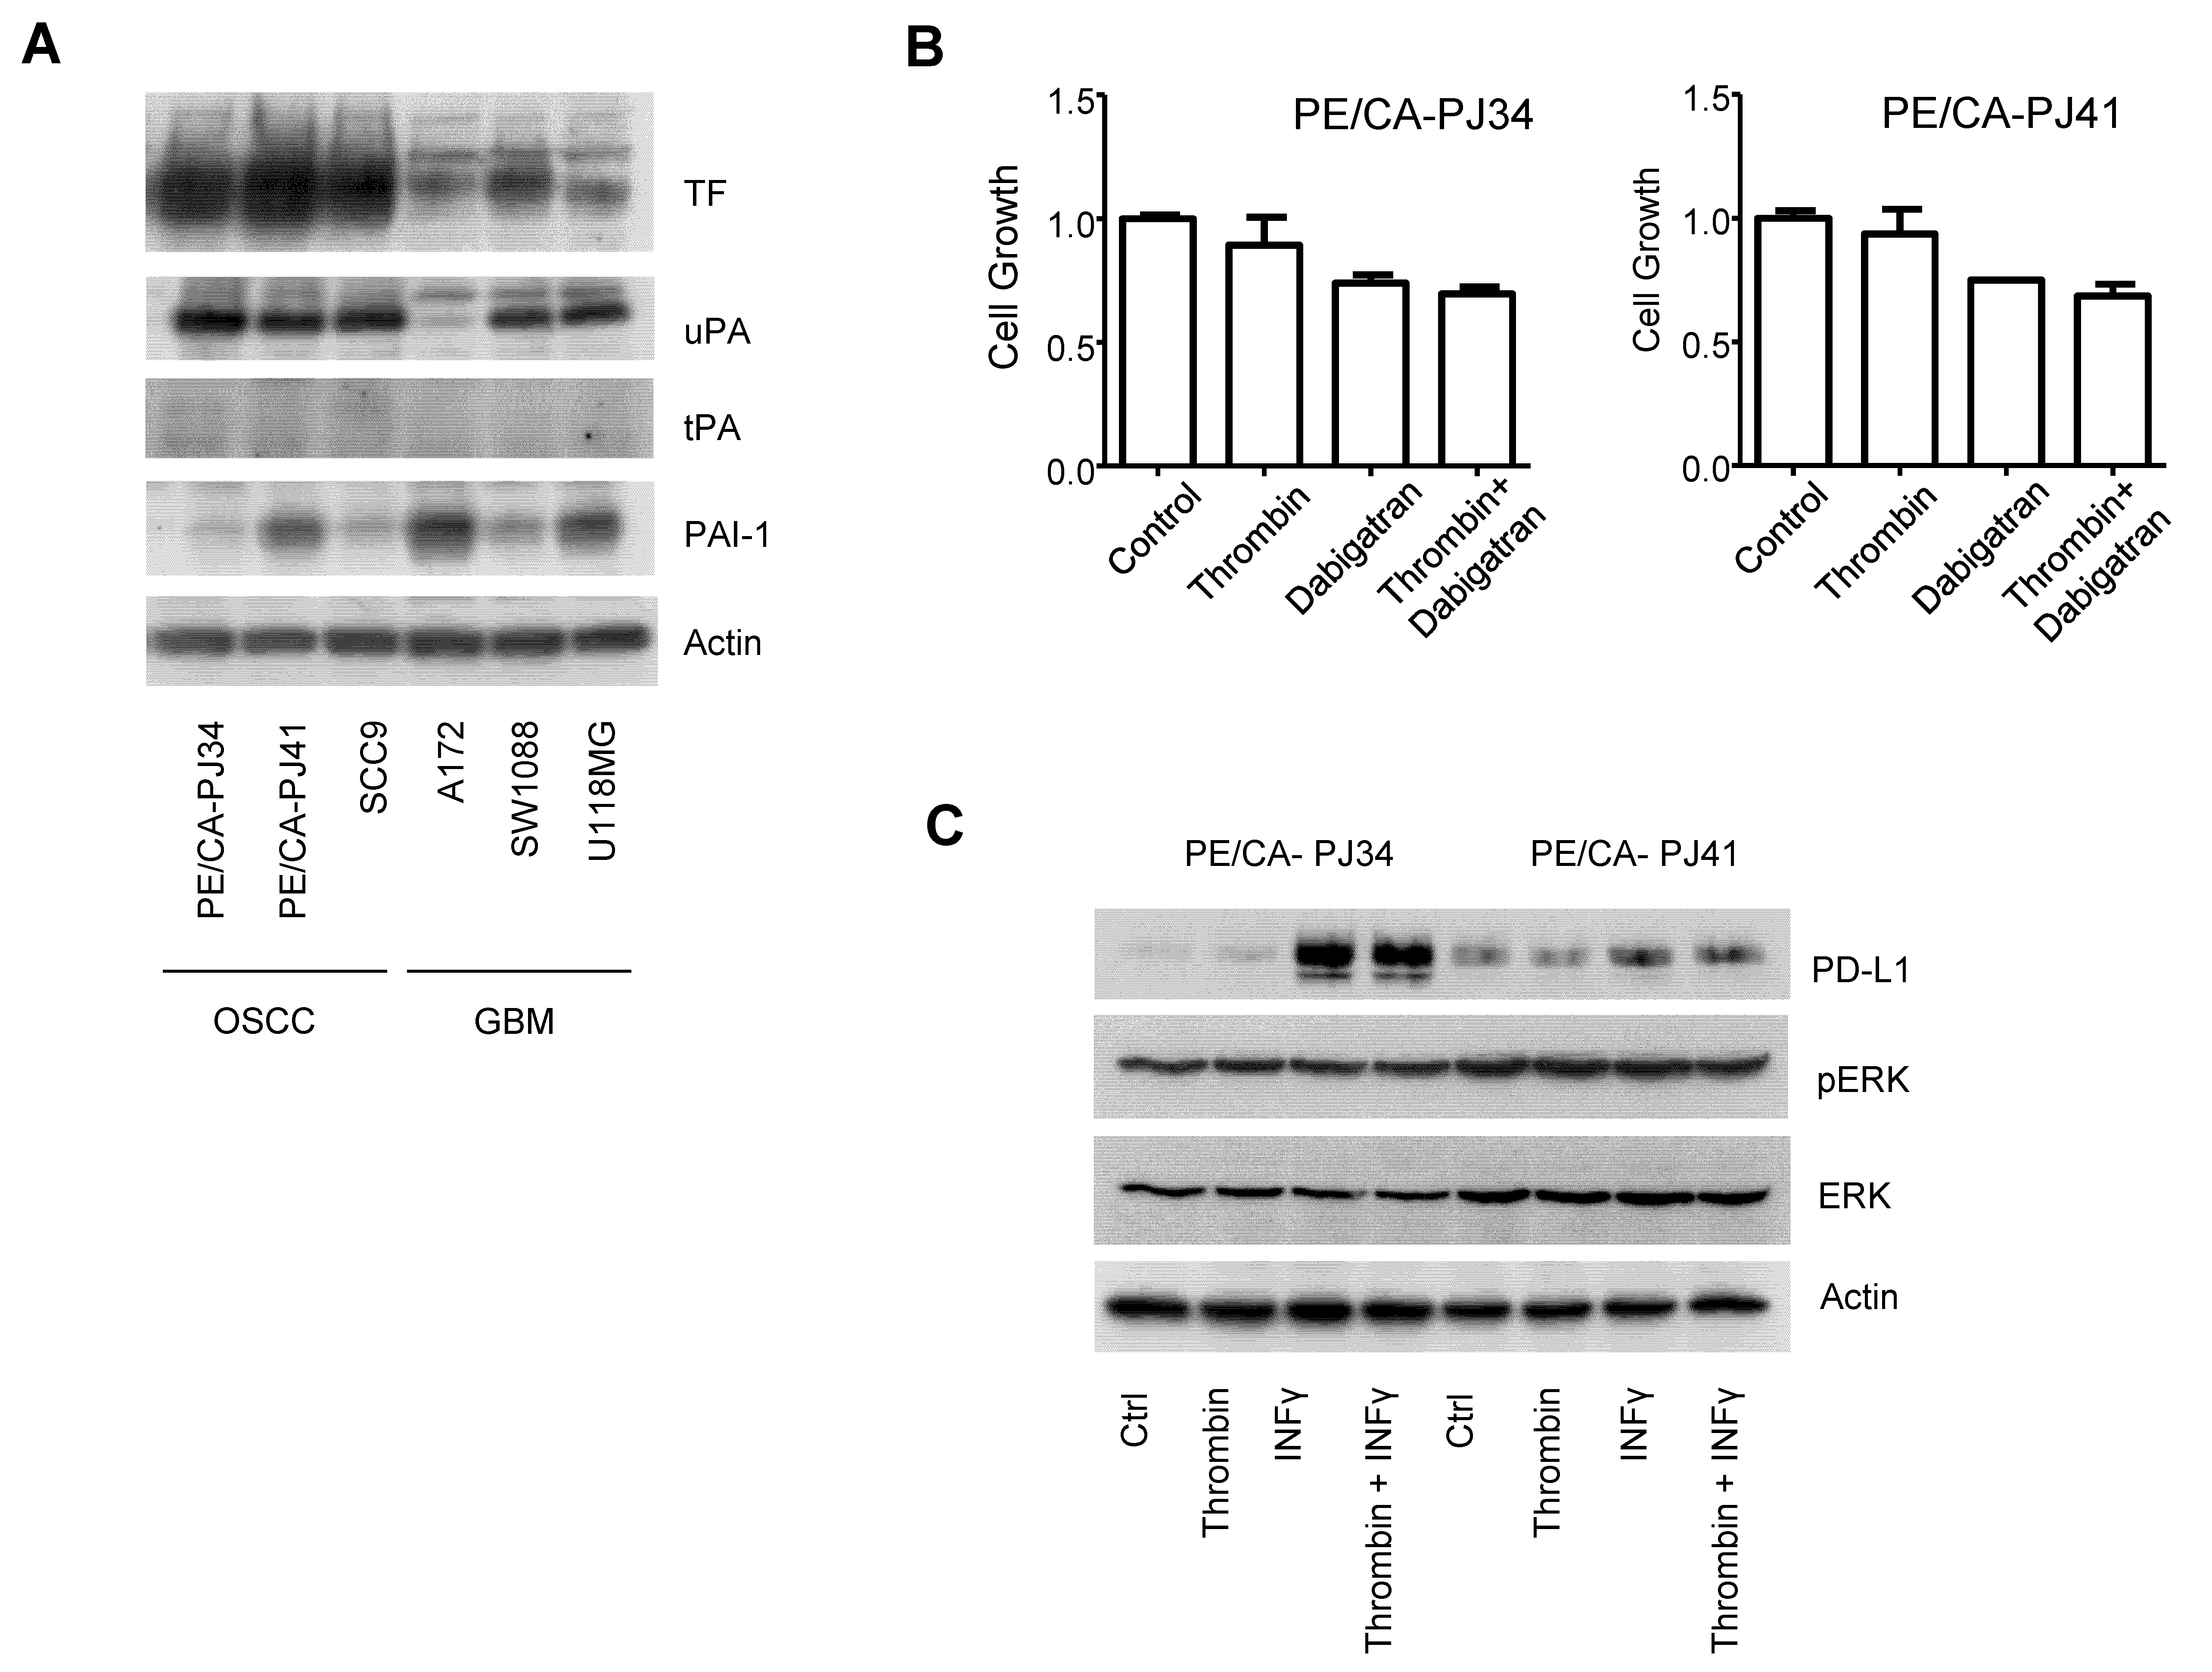
3.5. The Coagulome of OSCC Cells In Vitro
4. Discussion
5. Conclusions
Supplementary Materials
Author Contributions
Funding
Institutional Review Board Statement
Informed Consent Statement
Data Availability Statement
Acknowledgments
Conflicts of Interest
Abbreviations
| CAF | cancer-associated fibroblasts |
| DC | dendritic cells |
| HNSCC | Head and Neck Squamous Cell Carcinoma |
| OSCC | Oral Squamous Cell Carcinoma |
| PAI-1 | plasminogen activator inhibitor-1 |
| PAR-1 | protease-activated receptor-1 |
| RSEM | RNA-Seq by Expectation-Maximization |
| TAM | tumor-associated macrophages |
| TCGA | The Cancer Genome Atlas |
| TF | Tissue Factor |
| TME | tumor microenvironment |
| uPA | urokinase-type plasminogen activator |
| uPAR | urokinase-type plasminogen activator receptor |
References
- Farge, D.; Frere, C.; Connors, J.M.; Ay, C.; Khorana, A.A.; Munoz, A.; Brenner, B.; Kakkar, A.; Rafii, H.; Solymoss, S.; et al. 2019 international clinical practice guidelines for the treatment and prophylaxis of venous thromboembolism in patients with cancer. Lancet Oncol. 2019, 20, e566–e581. [Google Scholar] [CrossRef] [Green Version]
- Khorana, A.A.; Cohen, A.T.; Carrier, M.; Meyer, G.; Pabinger, I.; Kavan, P.; Wells, P. Prevention of venous thromboembolism in ambulatory patients with cancer. ESMO Open 2020, 5, e000948. [Google Scholar] [CrossRef]
- Chow, L.Q.M. Head and Neck Cancer. N. Engl. J. Med. 2020, 382, 60–72. [Google Scholar] [CrossRef] [PubMed]
- Grover, S.P.; Hisada, Y.M.; Kasthuri, R.S.; Reeves, B.N.; Mackman, N. Cancer Therapy–Associated Thrombosis. Arterioscler. Thromb. Vasc. Biol. 2021, 41, 1291–1305. [Google Scholar] [CrossRef] [PubMed]
- Argiris, A.; Li, S.; Savvides, P.; Ohr, J.P.; Gilbert, J.; Levine, M.A.; Chakravarti, A.; Haigentz, M.; Saba, N.F.; Ikpeazu, C.V.; et al. Phase III Randomized Trial of Chemotherapy With or Without Bevacizumab in Patients with Recurrent or Metastatic Head and Neck Cancer. J. Clin. Oncol. 2019, 37, 3266–3274. [Google Scholar] [CrossRef]
- Bergamini, C.; Ferris, R.L.; Xie, J.; Mariani, G.; Ali, M.; Holmes, W.C.; Harrington, K.; Psyrri, A.; Cavalieri, S.; Licitra, L. Bleeding complications in patients with squamous cell carcinoma of the head and neck. Head Neck 2021, 43, 2844–2858. [Google Scholar] [CrossRef]
- Moubayed, S.P.; Eskander, A.; Mourad, M.W.; Most, S.P. Systematic review and meta-analysis of venous thromboembolism in otolaryngology-head and neck surgery. Head Neck 2017, 39, 1249–1258. [Google Scholar] [CrossRef] [PubMed]
- Haen, P.; Mege, D.; Crescence, L.; Dignat-George, F.; Dubois, C.; Panicot-Dubois, L. Thrombosis Risk Associated with Head and Neck Cancer: A Review. Int. J. Mol. Sci. 2019, 20, 2838. [Google Scholar] [CrossRef] [Green Version]
- Rak, J.; Yu, J.L.; Luyendyk, J.; Mackman, N. Oncogenes, Trousseau Syndrome, and Cancer-Related Changes in the Coagulome of Mice and Humans. Cancer Res. 2006, 66, 10643–10646. [Google Scholar] [CrossRef] [PubMed] [Green Version]
- Magnus, N.; Gerges, N.; Jabado, N.; Rak, J. Coagulation-related gene expression profile in glioblastoma is defined by molecular disease subtype. J. Thromb. Haemost. 2013, 11, 1197–1200. [Google Scholar] [CrossRef] [Green Version]
- Tawil, N.; Bassawon, R.; Rak, J. Oncogenes and Clotting Factors: The Emerging Role of Tumor Cell Genome and Epigenome in Cancer-Associated Thrombosis. Semin. Thromb. Hemost. 2019, 45, 373–384. [Google Scholar] [CrossRef]
- Dunbar, A.; Bolton, K.L.; Devlin, S.M.; Sanchez-Vega, F.; Gao, J.; Mones, J.V.; Wills, J.; Kelly, D.; Farina, M.; Cordner, K.B.; et al. Genomic profiling identifies somatic mutations predicting thromboembolic risk in patients with solid tumors. Blood 2021, 137, 2103–2113. [Google Scholar] [CrossRef]
- Saidak, Z.; Soudet, S.; Lottin, M.; Salle, V.; Sevestre, M.-A.; Clatot, F.; Galmiche, A. A pan-cancer analysis of the human tumor coagulome and its link to the tumor immune microenvironment. Cancer Immunol. Immunother. 2021, 70, 923–933. [Google Scholar] [CrossRef] [PubMed]
- Falanga, A.; Schieppati, F.; Russo, L. Pathophysiology 1. Mechanisms of Thrombosis in Cancer Patients. In Thrombosis and Hemostasis in Cancer; Soff, G., Ed.; Cancer Treatment and Research; Springer: Cham, Switzerland, 2019; Volume 179, pp. 11–36. ISBN 978-3-030-20314-6. [Google Scholar]
- Unruh, D.; Horbinski, C. Beyond thrombosis: The impact of tissue factor signaling in cancer. J. Hematol. Oncol. 2020, 13, 93. [Google Scholar] [CrossRef] [PubMed]
- Pavón, M.A.; Arroyo-Solera, I.; Céspedes, M.V.; Casanova, I.; León, X.; Mangues, R. uPA/uPAR and SERPINE1 in head and neck cancer: Role in tumor resistance, metastasis, prognosis and therapy. Oncotarget 2016, 7, 57351–57366. [Google Scholar] [CrossRef] [PubMed] [Green Version]
- Saidak, Z.; Galmiche, A.; Lottin, M.; Montes, L.; Soudet, S.; Sevestre, M.-A.; Clatot, F.; Mirghani, H. The coagulome of Head and Neck Squamous Cell Carcinoma. Oral Oncol. 2020, 114, 105068. [Google Scholar] [CrossRef]
- desJardins-Park, H.E.; Mascharak, S.; Chinta, M.S.; Wan, D.C.; Longaker, M.T. The Spectrum of Scarring in Craniofacial Wound Repair. Front. Physiol. 2019, 10, 322. [Google Scholar] [CrossRef] [Green Version]
- Dvorak, H.F. Tumors: Wounds That Do Not Heal—A Historical Perspective with a Focus on the Fundamental Roles of Increased Vascular Permeability and Clotting. Semin. Thromb. Hemost. 2019, 45, 576–592. [Google Scholar] [CrossRef]
- Binnewies, M.; Roberts, E.W.; Kersten, K.; Chan, V.; Fearon, D.F.; Merad, M.; Coussens, L.M.; Gabrilovich, D.I.; Ostrand-Rosenberg, S.; Hedrick, C.C.; et al. Understanding the tumor immune microenvironment (TIME) for effective therapy. Nat. Med. 2018, 24, 541–550. [Google Scholar] [CrossRef]
- Peltanova, B.; Raudenska, M.; Masarik, M. Effect of tumor microenvironment on pathogenesis of the head and neck squamous cell carcinoma: A systematic review. Mol. Cancer 2019, 18, 63. [Google Scholar] [CrossRef]
- Cramer, J.D.; Burtness, B.; Le, Q.T.; Ferris, R.L. The changing therapeutic landscape of head and neck cancer. Nat. Rev. Clin. Oncol. 2019, 16, 669–683. [Google Scholar] [CrossRef]
- Chen, D.S.; Mellman, I. Elements of cancer immunity and the cancer–immune set point. Nature 2017, 541, 321–330. [Google Scholar] [CrossRef] [PubMed]
- Luyendyk, J.P.; Schoenecker, J.G.; Flick, M.J. The multifaceted role of fibrinogen in tissue injury and inflammation. Blood 2019, 133, 511–520. [Google Scholar] [CrossRef]
- Fan, Q.; Ma, Q.; Bai, J.; Xu, J.; Fei, Z.; Dong, Z.; Maruyama, A.; Leong, K.W.; Liu, Z.; Wang, C. An implantable blood clot–based immune niche for enhanced cancer vaccination. Sci. Adv. 2020, 6, eabb4639. [Google Scholar] [CrossRef]
- Cantrell, R.; Palumbo, J.S. The thrombin–inflammation axis in cancer progression. Thromb. Res. 2020, 191, S117–S122. [Google Scholar] [CrossRef]
- Cancer Genome Atlas Network Comprehensive genomic characterization of head and neck squamous cell carcinomas. Nature 2015, 517, 576–582. [CrossRef] [PubMed] [Green Version]
- Puram, S.V.; Tirosh, I.; Parikh, A.S.; Patel, A.P.; Yizhak, K.; Gillespie, S.; Rodman, C.; Luo, C.L.; Mroz, E.A.; Emerick, K.S. Single-cell transcriptomic analysis of primary and metastatic tumor ecosystems in head and neck cancer. Cell 2017, 171, 1611–1624. [Google Scholar] [CrossRef] [Green Version]
- Yoshihara, K.; Shahmoradgoli, M.; Martínez, E.; Vegesna, R.; Kim, H.; Torres-Garcia, W.; Treviño, V.; Shen, H.; Laird, P.W.; Levine, D.A. Inferring tumour purity and stromal and immune cell admixture from expression data. Nat. Commun. 2013, 4, 2612. [Google Scholar] [CrossRef]
- Subramanian, A.; Tamayo, P.; Mootha, V.K.; Mukherjee, S.; Ebert, B.L.; Gillette, M.A.; Paulovich, A.; Pomeroy, S.L.; Golub, T.R.; Lander, E.S.; et al. Gene set enrichment analysis: A knowledge-based approach for interpreting genome-wide expression profiles. Proc. Natl. Acad. Sci. USA 2005, 102, 15545–15550. [Google Scholar] [CrossRef] [PubMed] [Green Version]
- Lailler, C.; Lamuraglia, M.; Racine, F.; Louandre, C.; Godin, C.; Chauffert, B.; Galmiche, A.; Saidak, Z. DNA damage response- and JAK-dependent regulation of PD-L1 expression in head and neck squamous cell carcinoma (HNSCC) cells exposed to 5-fluorouracil (5-FU). Transl. Oncol. 2021, 14, 101110. [Google Scholar] [CrossRef] [PubMed]
- Christensen, A.; Kiss, K.; Lelkaitis, G.; Juhl, K.; Persson, M.; Charabi, B.W.; Mortensen, J.; Forman, J.L.; Sørensen, A.L.; Jensen, D.H.; et al. Urokinase-type plasminogen activator receptor (uPAR), tissue factor (TF) and epidermal growth factor receptor (EGFR): Tumor expression patterns and prognostic value in oral cancer. BMC Cancer 2017, 17, 572. [Google Scholar] [CrossRef] [Green Version]
- Unruh, D.; Mirkov, S.; Wray, B.; Drumm, M.; Lamano, J.; Li, Y.D.; Haider, Q.F.; Javier, R.; McCortney, K.; Saratsis, A.; et al. Methylation-dependent Tissue Factor Suppression Contributes to the Reduced Malignancy of IDH1-mutant Gliomas. Clin. Cancer Res. 2019, 25, 747–759. [Google Scholar] [CrossRef] [Green Version]
- Liang, Y.-J.; Mei, X.-Y.; Zeng, B.; Zhang, S.-E.; Yang, L.; Lao, X.-M.; Liao, G.-Q. Prognostic role of preoperative D-dimer, fibrinogen and platelet levels in patients with oral squamous cell carcinoma. BMC Cancer 2021, 21, 122. [Google Scholar] [CrossRef] [PubMed]
- Vitale, I.; Shema, E.; Loi, S.; Galluzzi, L. Intratumoral heterogeneity in cancer progression and response to immunotherapy. Nat. Med. 2021, 27, 212–224. [Google Scholar] [CrossRef]
- Chen, G.; Sun, J.; Xie, M.; Yu, S.; Tang, Q.; Chen, L. PLAU Promotes Cell Proliferation and Epithelial-Mesenchymal Transition in Head and Neck Squamous Cell Carcinoma. Front. Genet. 2021, 12, 651882. [Google Scholar] [CrossRef]
- Auvergne, R.; Wu, C.; Connell, A.; Au, S.; Cornwell, A.; Osipovitch, M.; Benraiss, A.; Dangelmajer, S.; Guerrero-Cazares, H.; Quinones-Hinojosa, A.; et al. PAR1 inhibition suppresses the self-renewal and growth of A2B5-defined glioma progenitor cells and their derived gliomas in vivo. Oncogene 2016, 35, 3817–3828. [Google Scholar] [CrossRef] [PubMed] [Green Version]
- Adams, G.N.; Sharma, B.K.; Rosenfeldt, L.; Frederick, M.; Flick, M.J.; Witte, D.P.; Mosnier, L.O.; Harmel-Laws, E.; Steinbrecher, K.A.; Palumbo, J.S. Protease-activated receptor-1 impedes prostate and intestinal tumor progression in mice. J. Thromb. Haemost. 2018, 16, 2258–2269. [Google Scholar] [CrossRef] [Green Version]
- Tekin, C.; Shi, K.; Daalhuisen, J.B.; ten Brink, M.S.; Bijlsma, M.F.; Spek, C.A. PAR1 signaling on tumor cells limits tumor growth by maintaining a mesenchymal phenotype in pancreatic cancer. Oncotarget 2018, 9, 32010–32023. [Google Scholar] [CrossRef] [PubMed] [Green Version]
- Najidh, S.; Versteeg, H.H.; Buijs, J.T. A systematic review on the effects of direct oral anticoagulants on cancer growth and metastasis in animal models. Thromb. Res. 2020, 187, 18–27. [Google Scholar] [CrossRef] [Green Version]
- Galmiche, A.; Rak, J.; Roumenina, L.T.; Saidak, Z. Coagulome and the tumor microenvironment: An actionable interplay. Trends Cancer 2022. in press. [Google Scholar] [CrossRef] [PubMed]
- Murphy, T.L.; Murphy, K.M. Dendritic cells in cancer immunology. Cell Mol. Immunol. 2021, 19, 3–13. [Google Scholar] [CrossRef] [PubMed]
- Noubade, R.; Majri-Morrison, S.; Tarbell, K.V. Beyond cDC1: Emerging Roles of DC Crosstalk in Cancer Immunity. Front. Immunol. 2019, 10, 1014. [Google Scholar] [CrossRef] [PubMed] [Green Version]
- Niessen, F.; Schaffner, F.; Furlan-Freguia, C.; Pawlinski, R.; Bhattacharjee, G.; Chun, J.; Derian, C.K.; Andrade-Gordon, P.; Rosen, H.; Ruf, W. Dendritic cell PAR1-S1P3 signalling couples coagulation and inflammation. Nature 2008, 452, 654–658. [Google Scholar] [CrossRef] [PubMed]
- Graf, C.; Wilgenbus, P.; Pagel, S.; Pott, J.; Marini, F.; Reyda, S.; Kitano, M.; Macher-Göppinger, S.; Weiler, H.; Ruf, W. Myeloid cell–synthesized coagulation factor X dampens antitumor immunity. Sci. Immunol. 2019, 4, eaaw8405. [Google Scholar] [CrossRef] [PubMed]
- Haist, M.; Stege, H.; Pemler, S.; Heinz, J.; Fleischer, M.I.; Graf, C.; Ruf, W.; Loquai, C.; Grabbe, S. Anticoagulation with Factor Xa Inhibitors Is Associated with Improved Overall Response and Progression-Free Survival in Patients with Metastatic Malignant Melanoma Receiving Immune Checkpoint Inhibitors—A Retrospective, Real-World Cohort Study. Cancers 2021, 13, 5103. [Google Scholar] [CrossRef]


Publisher’s Note: MDPI stays neutral with regard to jurisdictional claims in published maps and institutional affiliations. |
© 2022 by the authors. Licensee MDPI, Basel, Switzerland. This article is an open access article distributed under the terms and conditions of the Creative Commons Attribution (CC BY) license (https://creativecommons.org/licenses/by/4.0/).
Share and Cite
Lottin, M.; Soudet, S.; Fercot, J.; Racine, F.; Demagny, J.; Bettoni, J.; Chatelain, D.; Sevestre, M.-A.; Mammeri, Y.; Lamuraglia, M.; et al. Molecular Landscape of the Coagulome of Oral Squamous Cell Carcinoma. Cancers 2022, 14, 460. https://0-doi-org.brum.beds.ac.uk/10.3390/cancers14020460
Lottin M, Soudet S, Fercot J, Racine F, Demagny J, Bettoni J, Chatelain D, Sevestre M-A, Mammeri Y, Lamuraglia M, et al. Molecular Landscape of the Coagulome of Oral Squamous Cell Carcinoma. Cancers. 2022; 14(2):460. https://0-doi-org.brum.beds.ac.uk/10.3390/cancers14020460
Chicago/Turabian StyleLottin, Marine, Simon Soudet, Julie Fercot, Floriane Racine, Julien Demagny, Jérémie Bettoni, Denis Chatelain, Marie-Antoinette Sevestre, Youcef Mammeri, Michele Lamuraglia, and et al. 2022. "Molecular Landscape of the Coagulome of Oral Squamous Cell Carcinoma" Cancers 14, no. 2: 460. https://0-doi-org.brum.beds.ac.uk/10.3390/cancers14020460