
A Data Science Approach for the Identification of Molecular Signatures of Aggressive Cancers

 ,
,  and
and
Abstract
:Simple Summary
Abstract
1. Introduction
2. Materials and Methods
2.1. GDC Data
2.2. RNA-seq Processing
2.3. Data Processing
3. Results
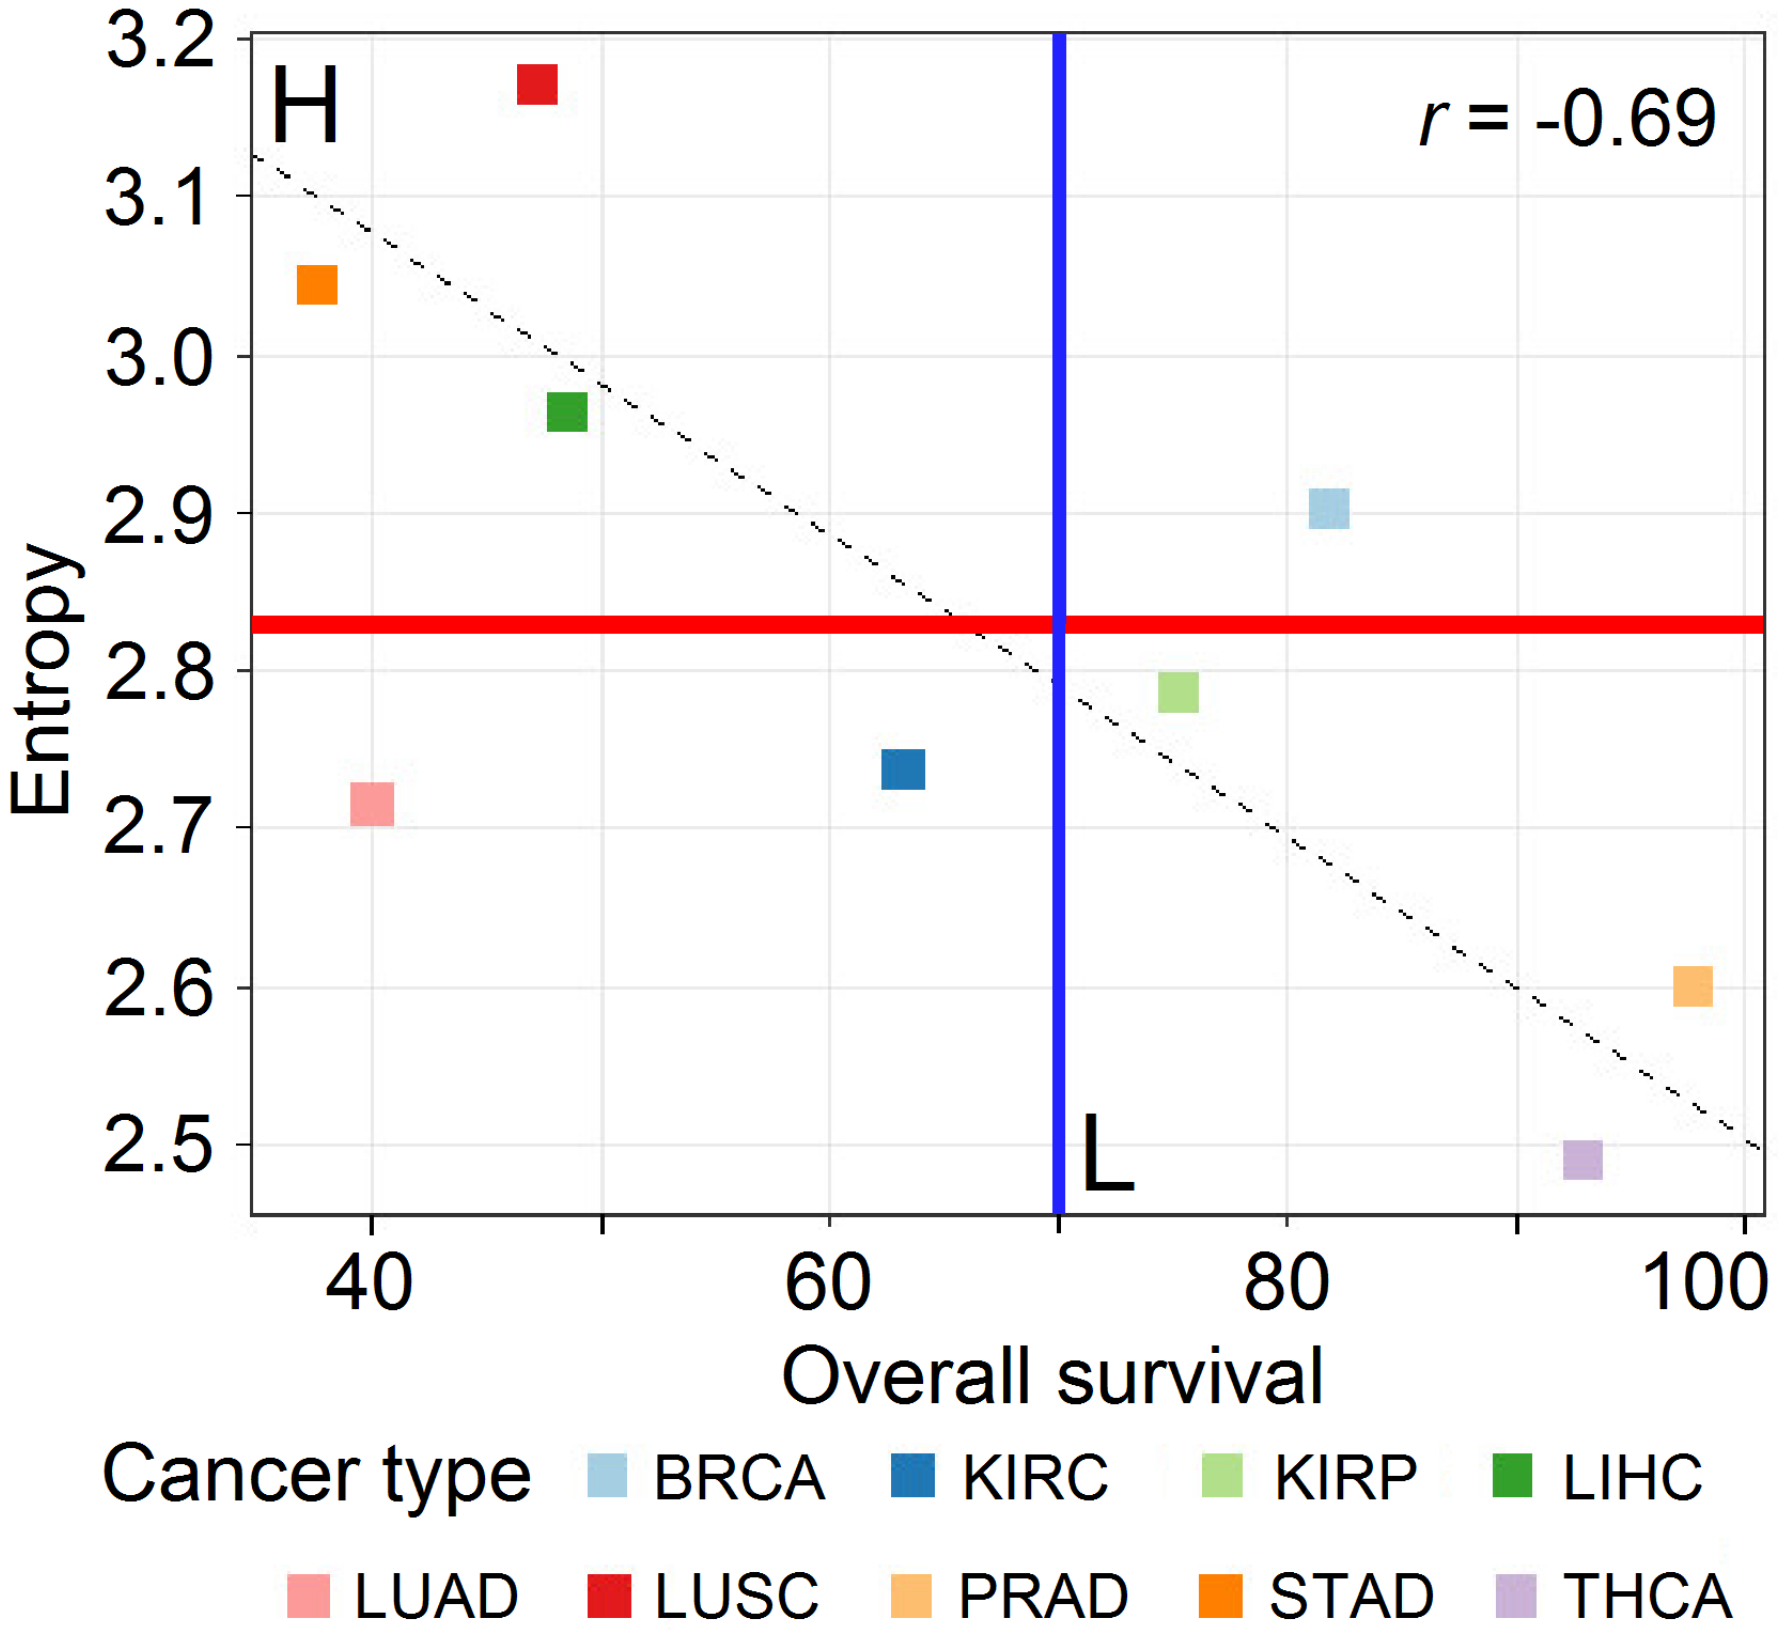
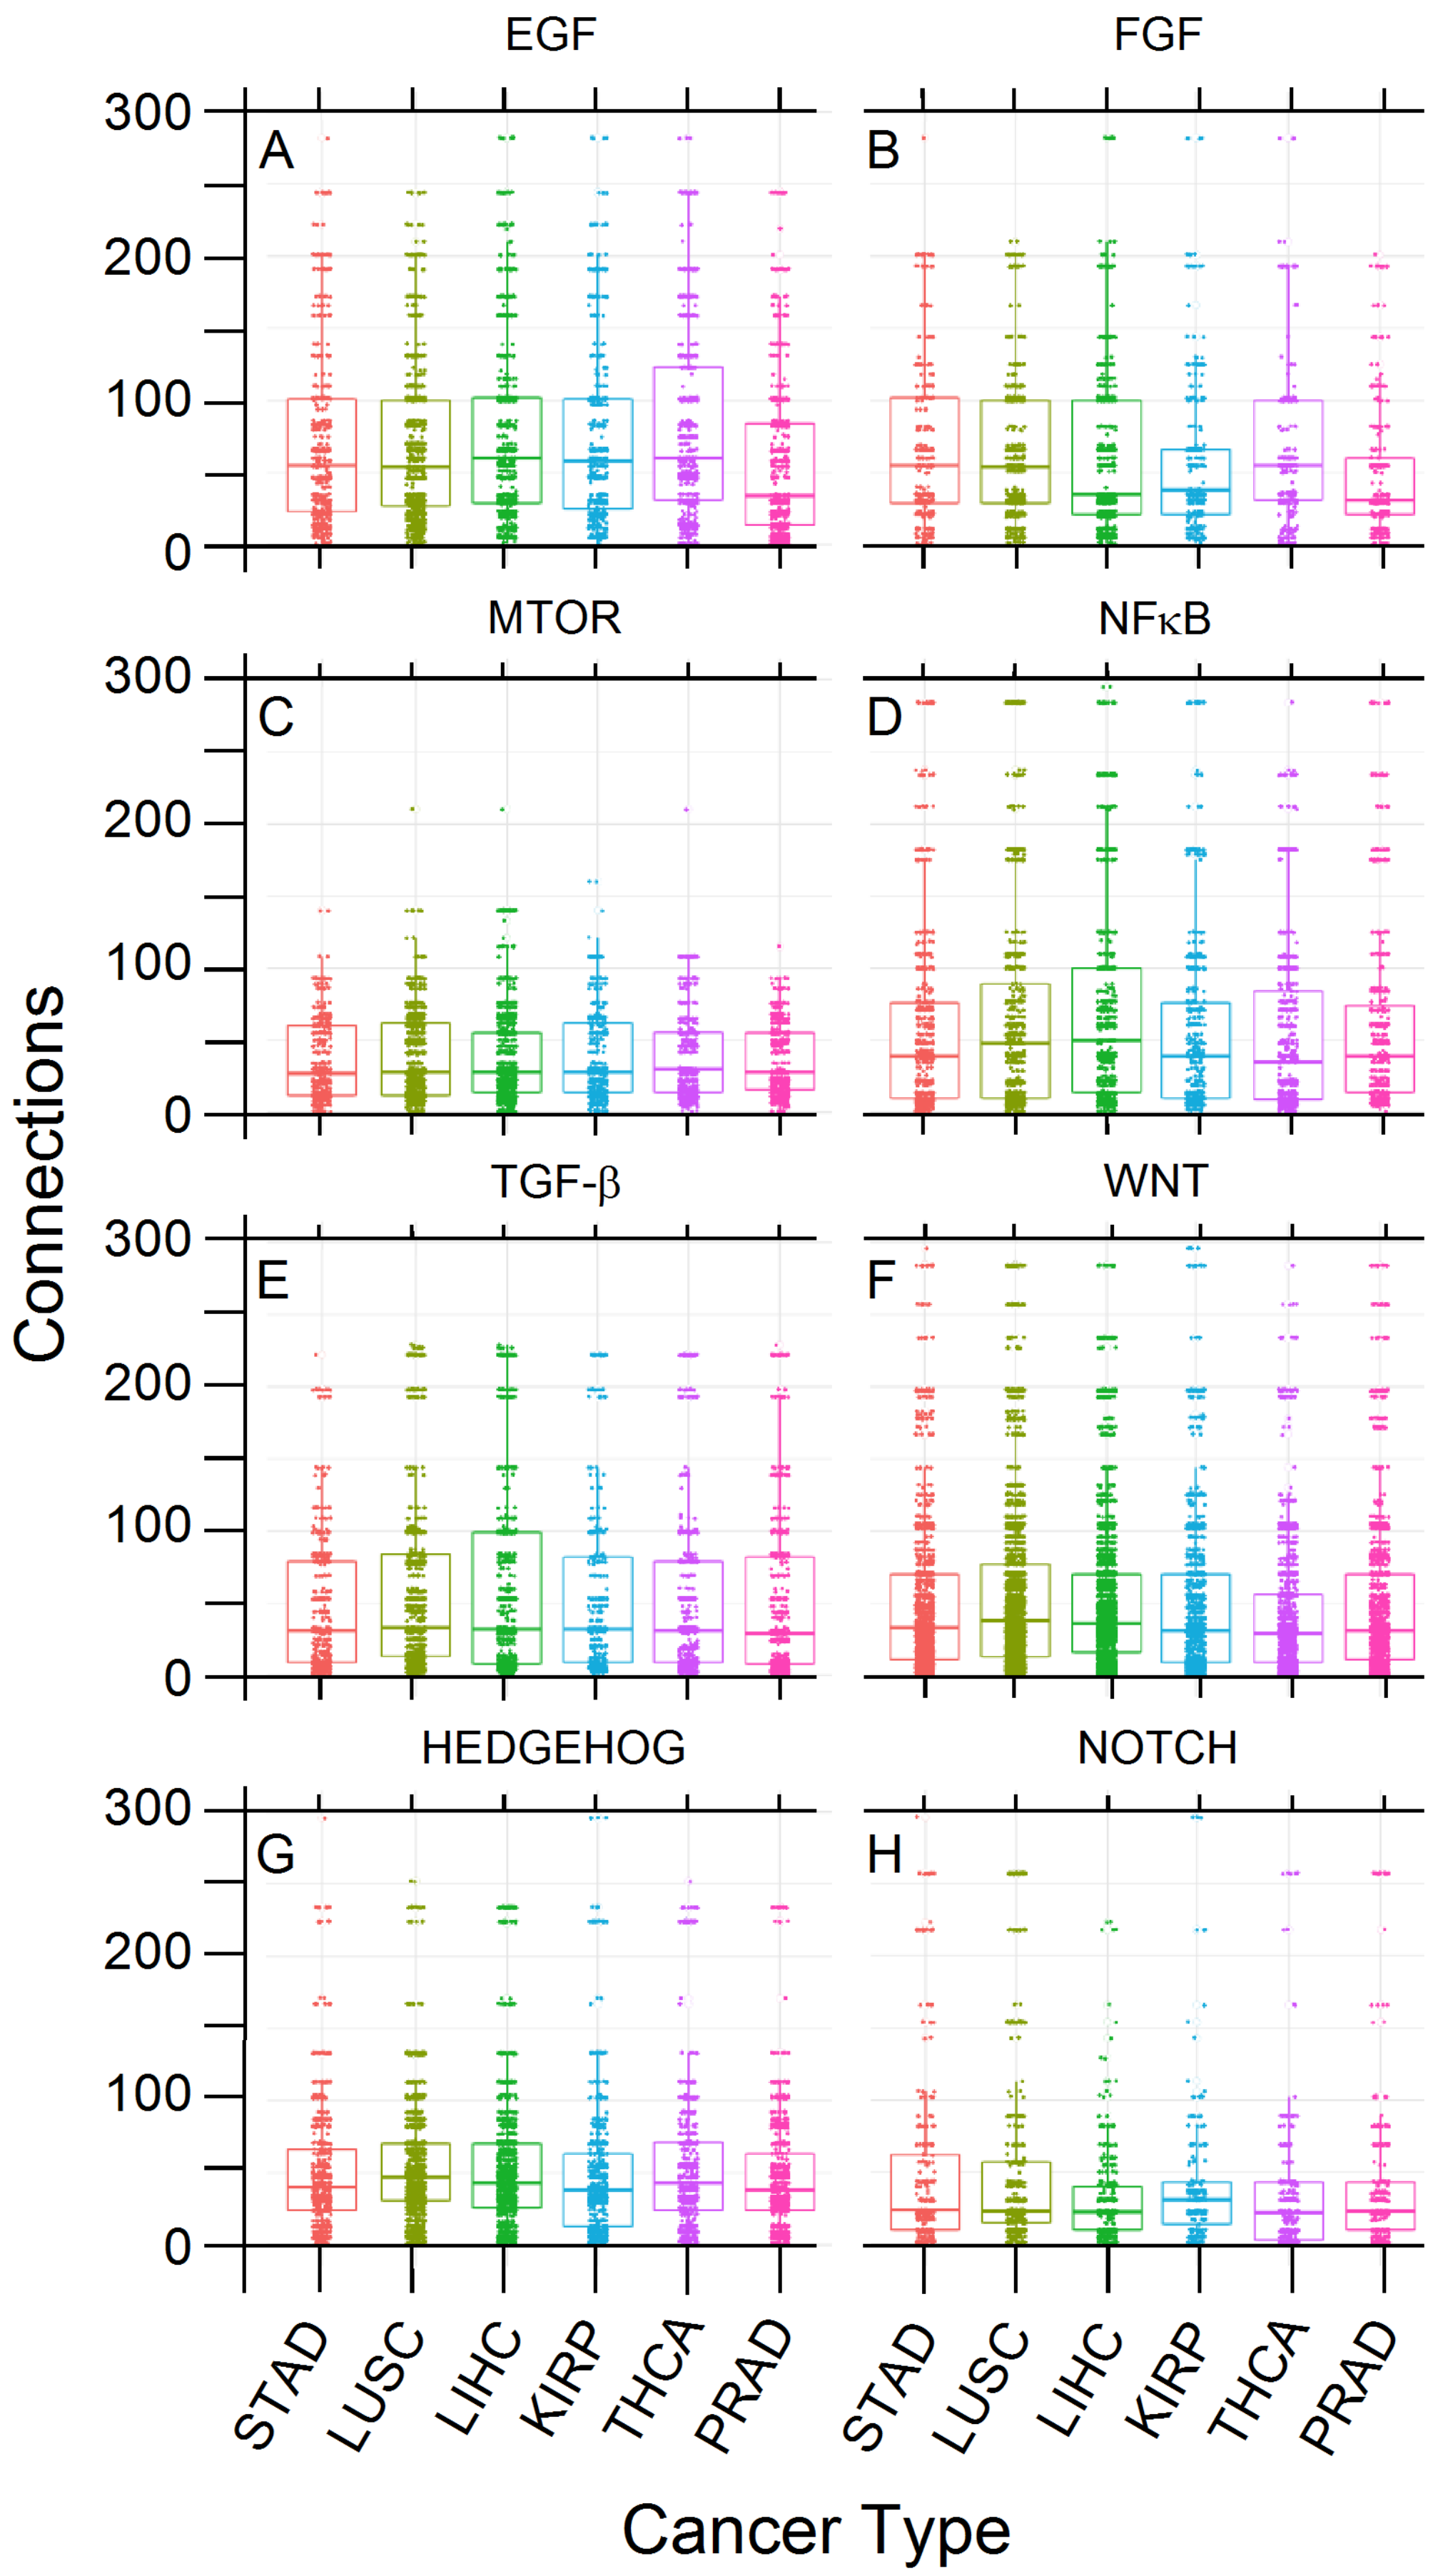
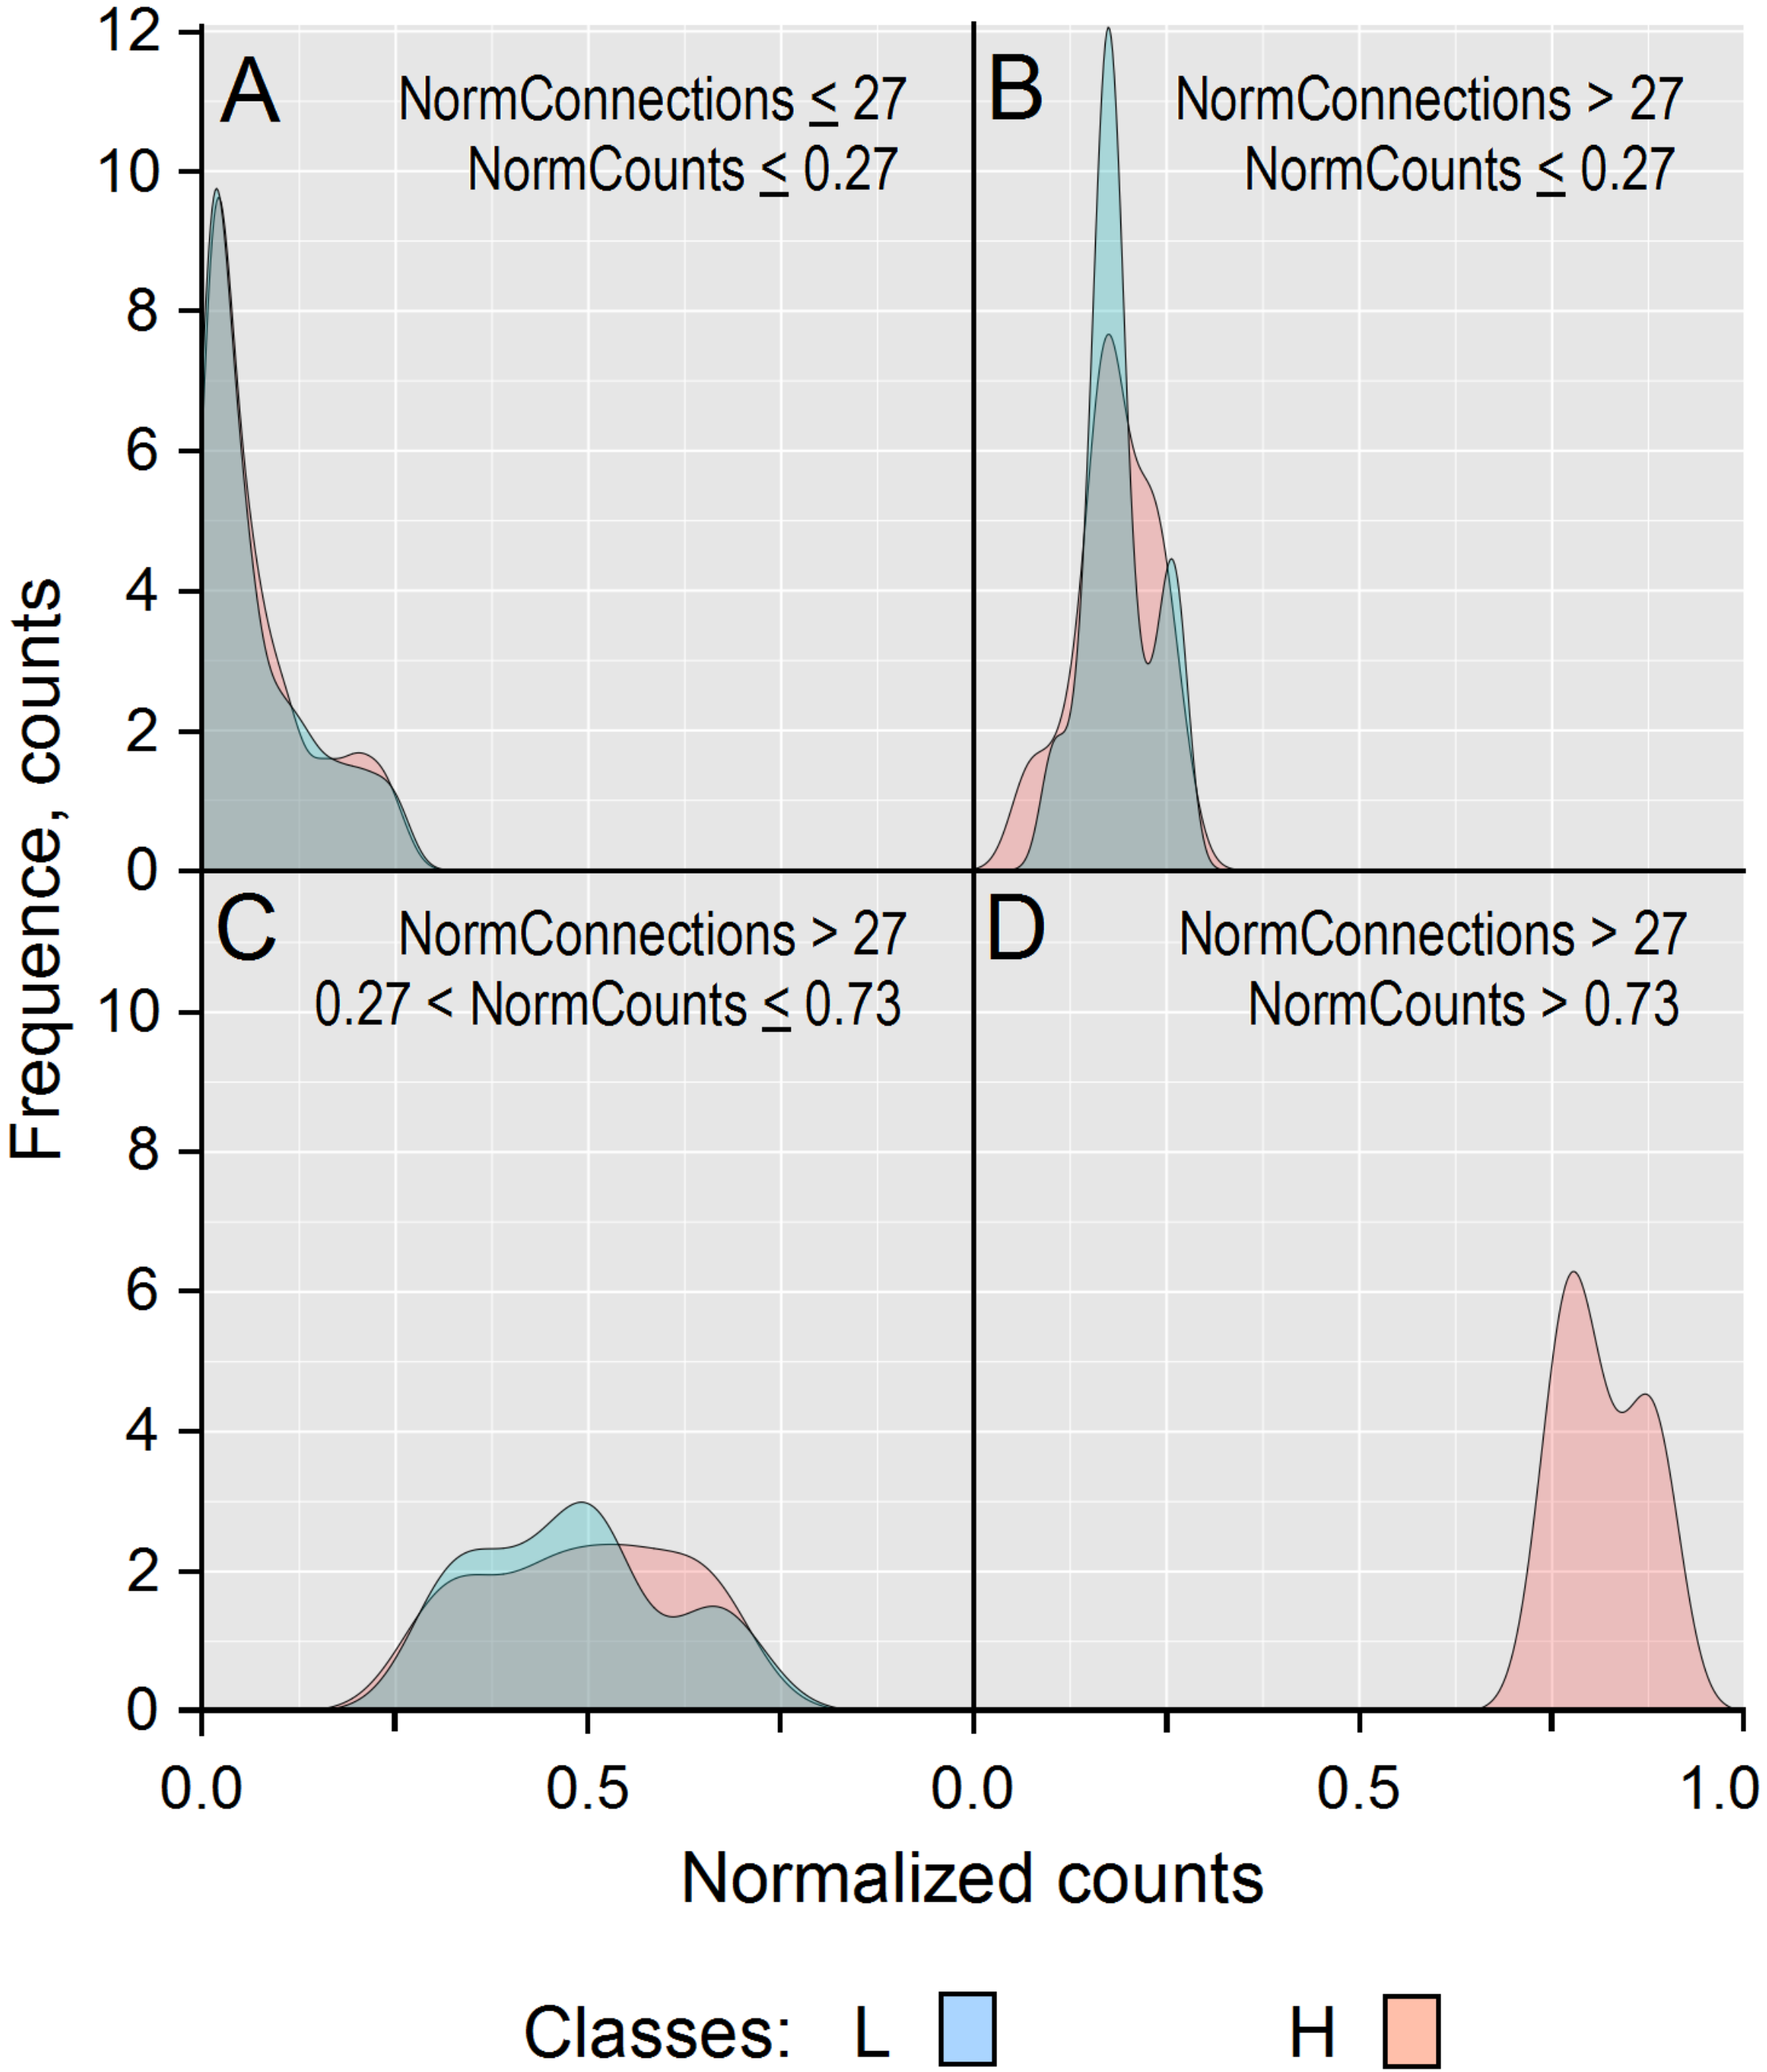
3.1. Data Analysis
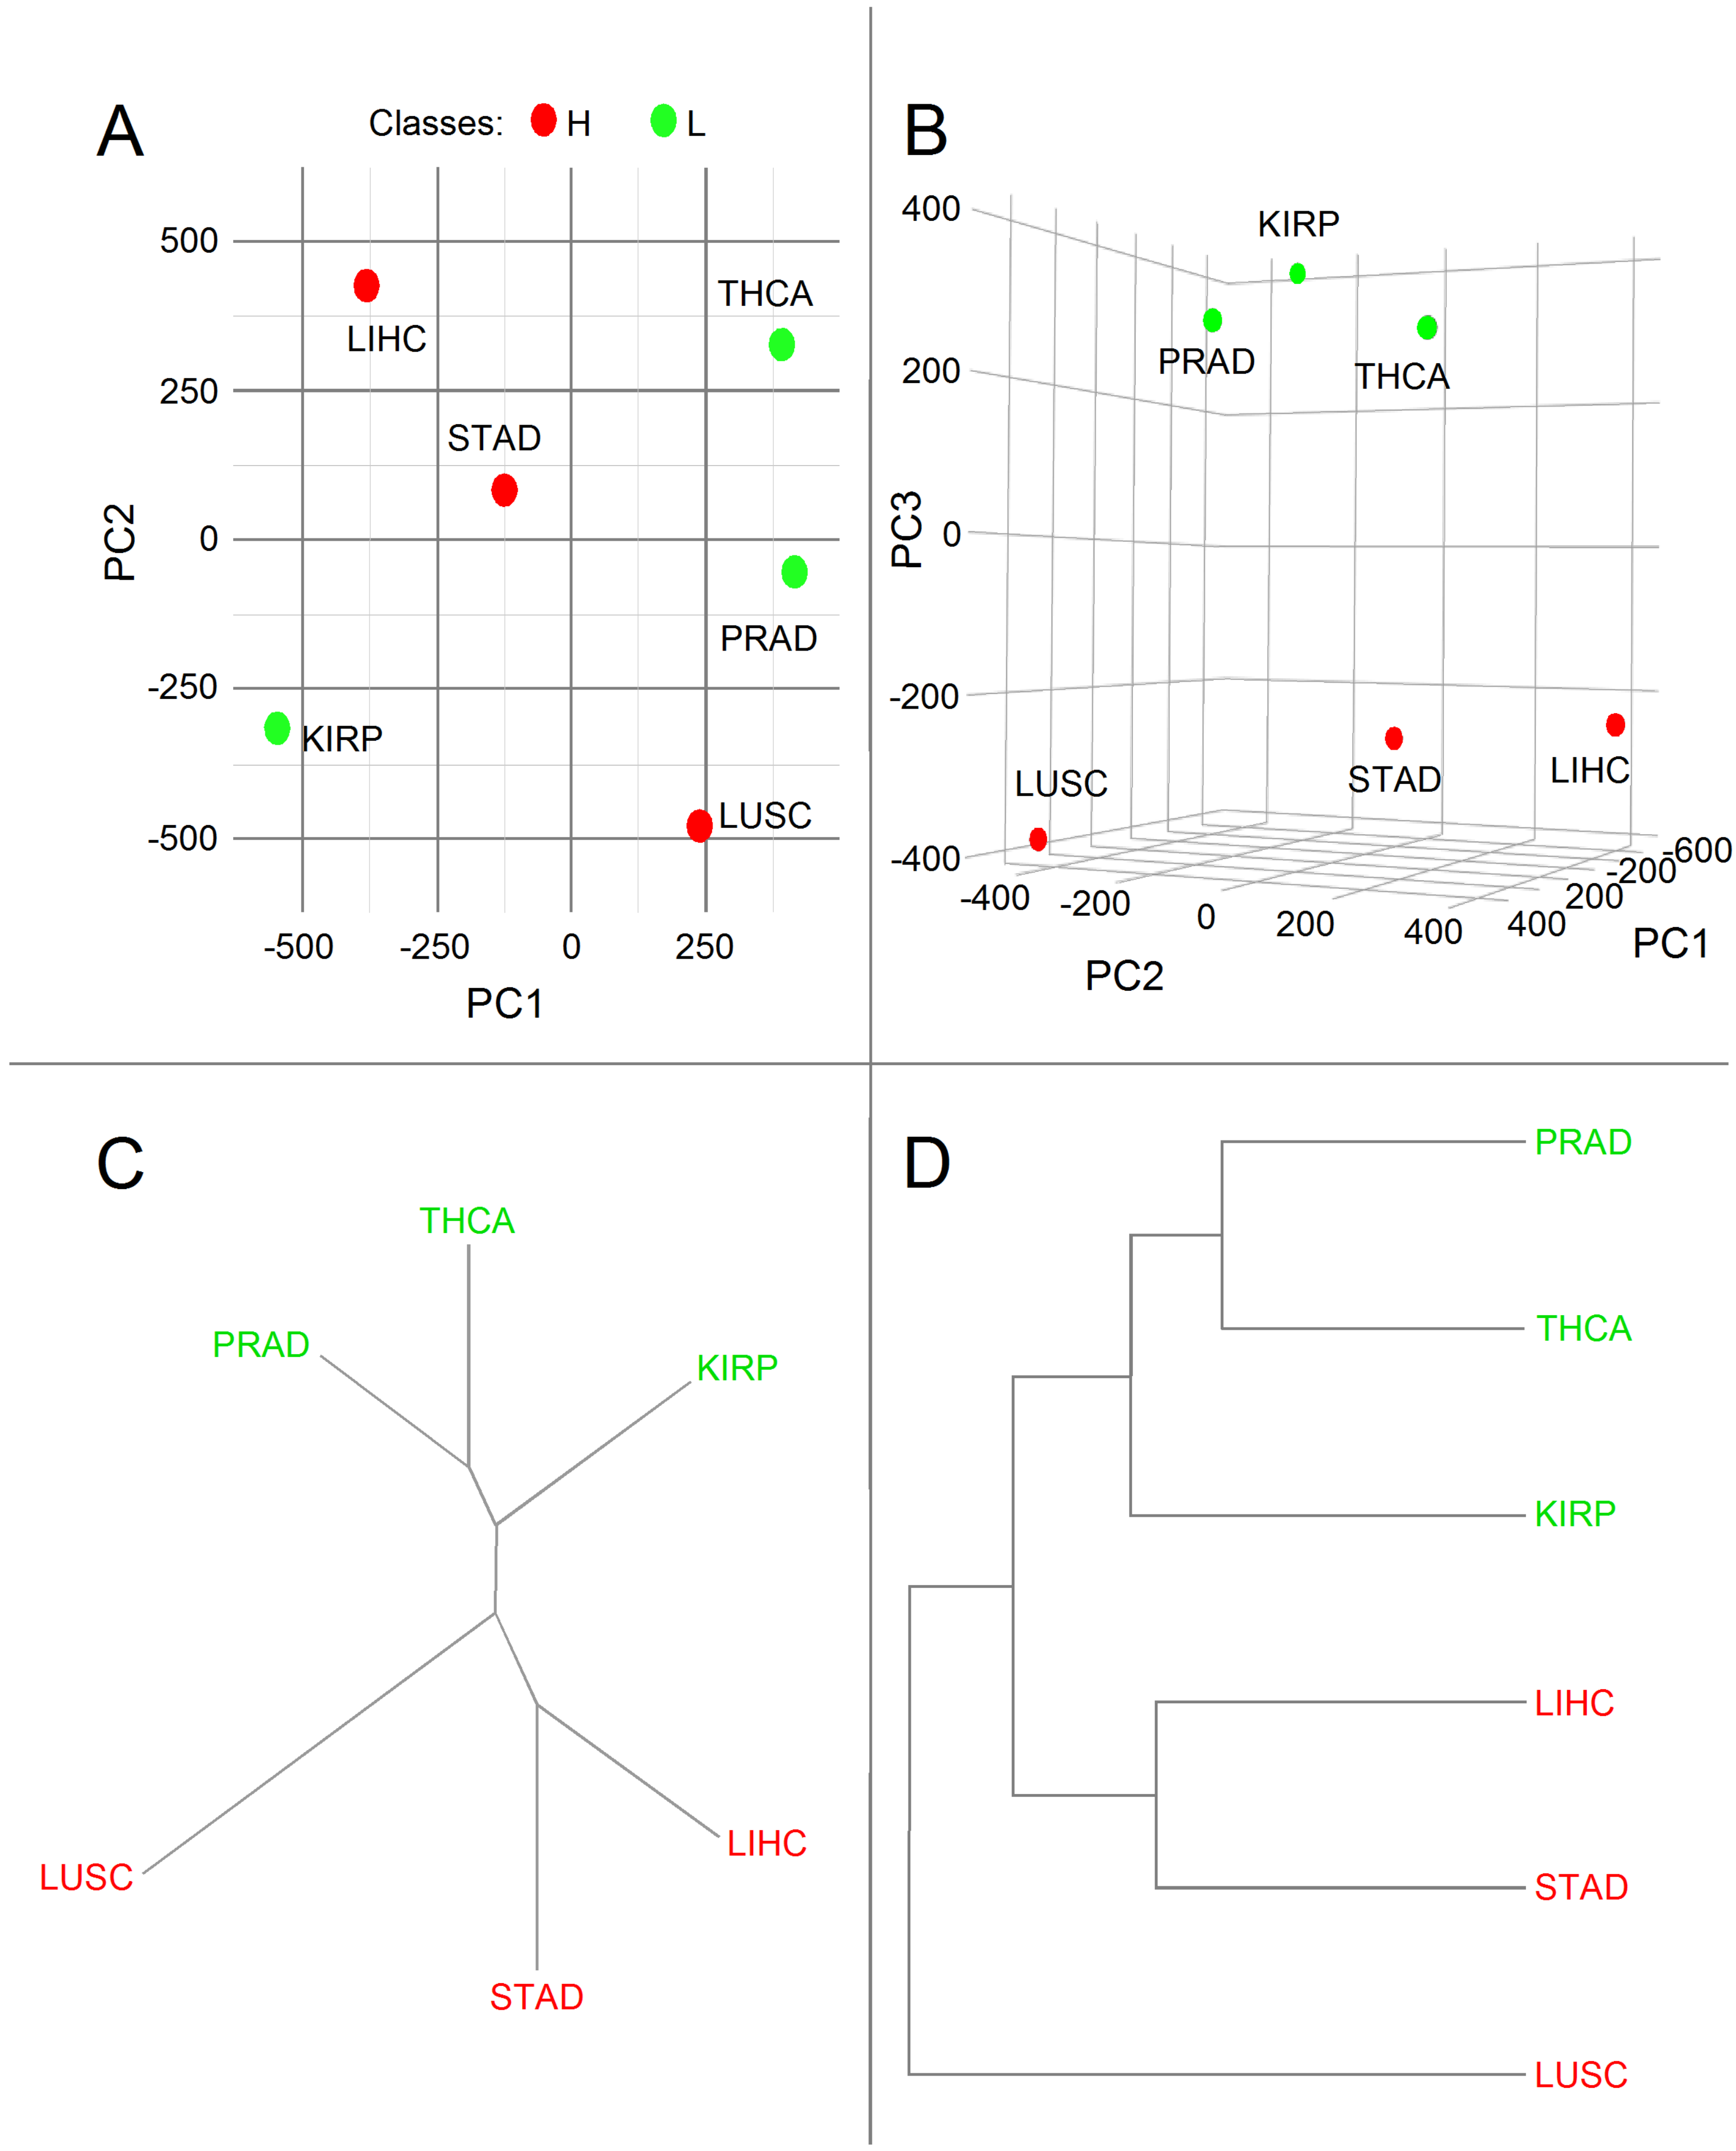
3.2. Principal Component Analysis
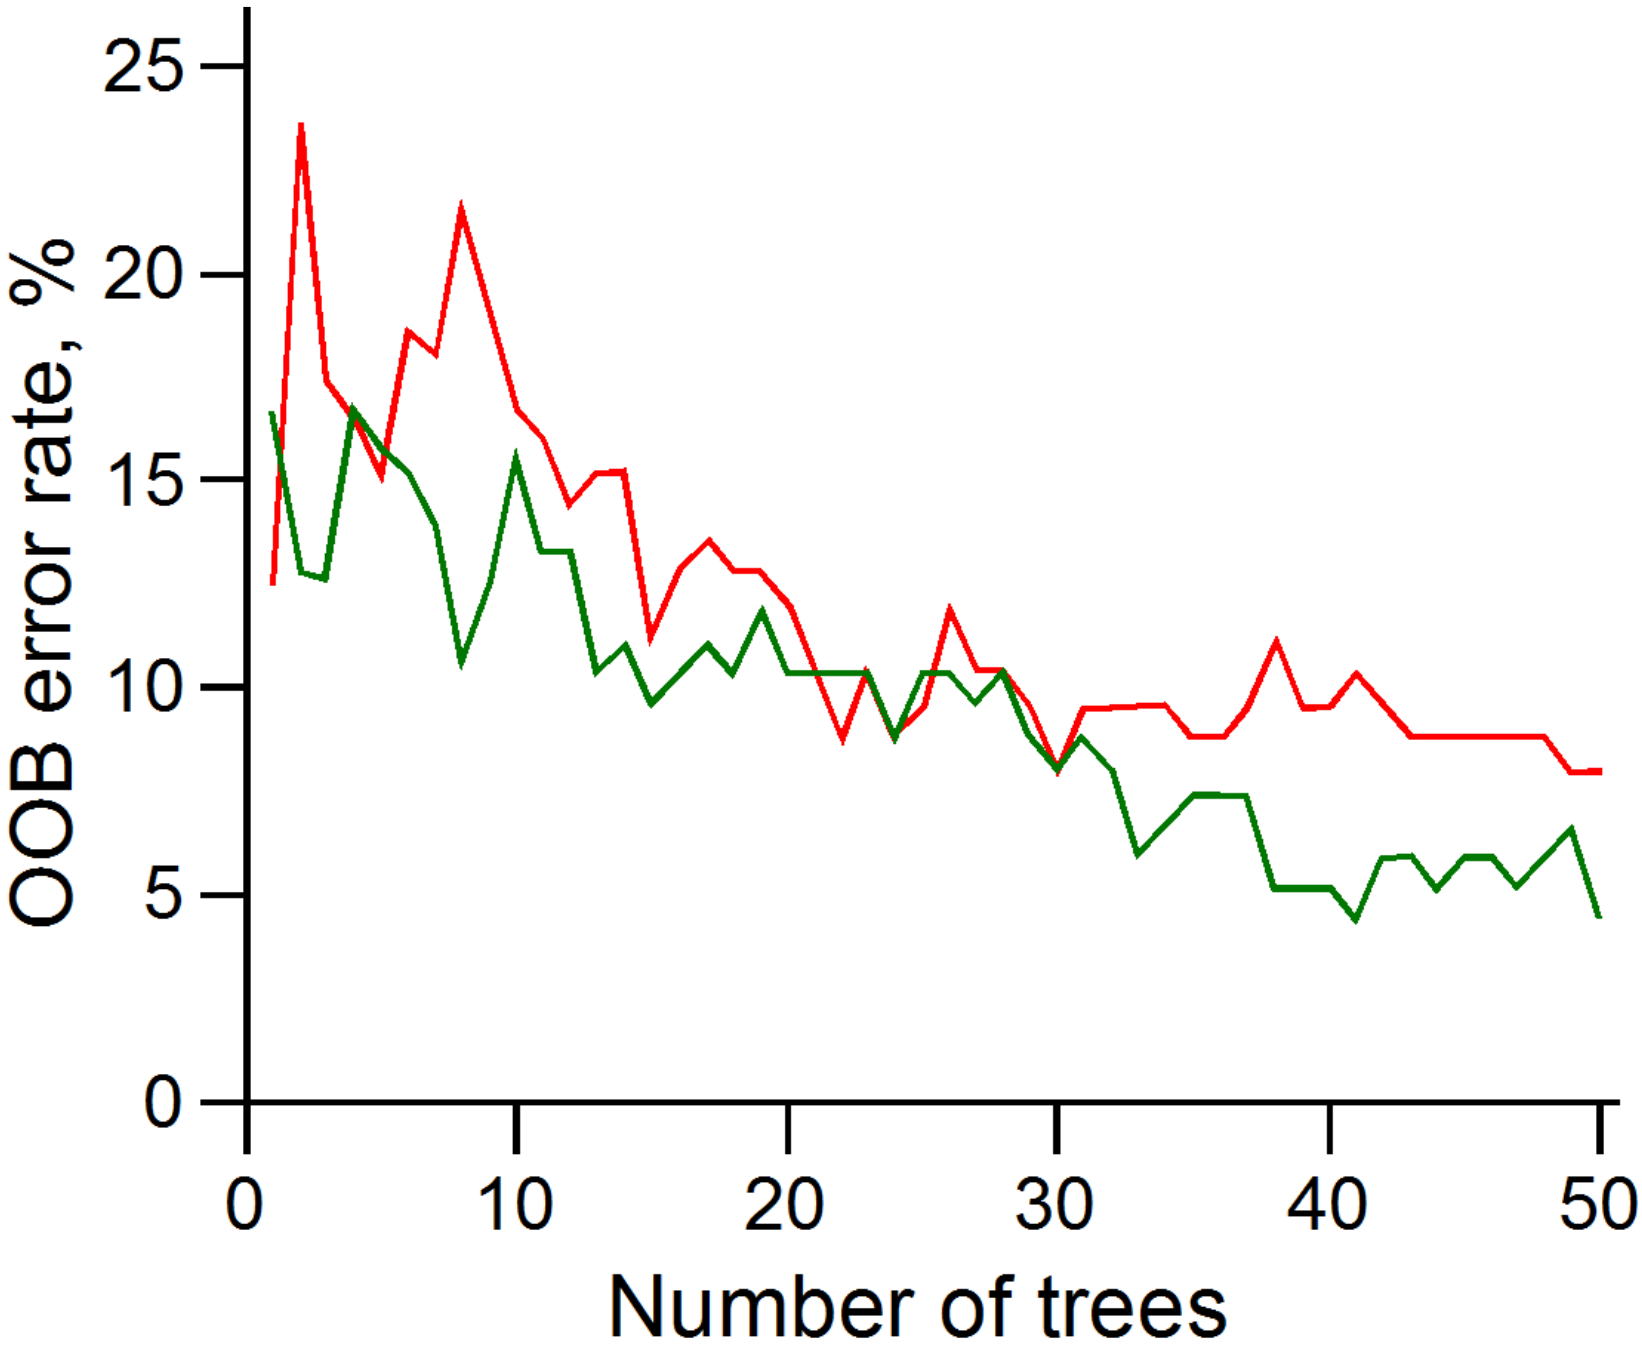
3.3. Random Forest Classifier Analysis
3.4. Assessing PCA and RFC Analyses
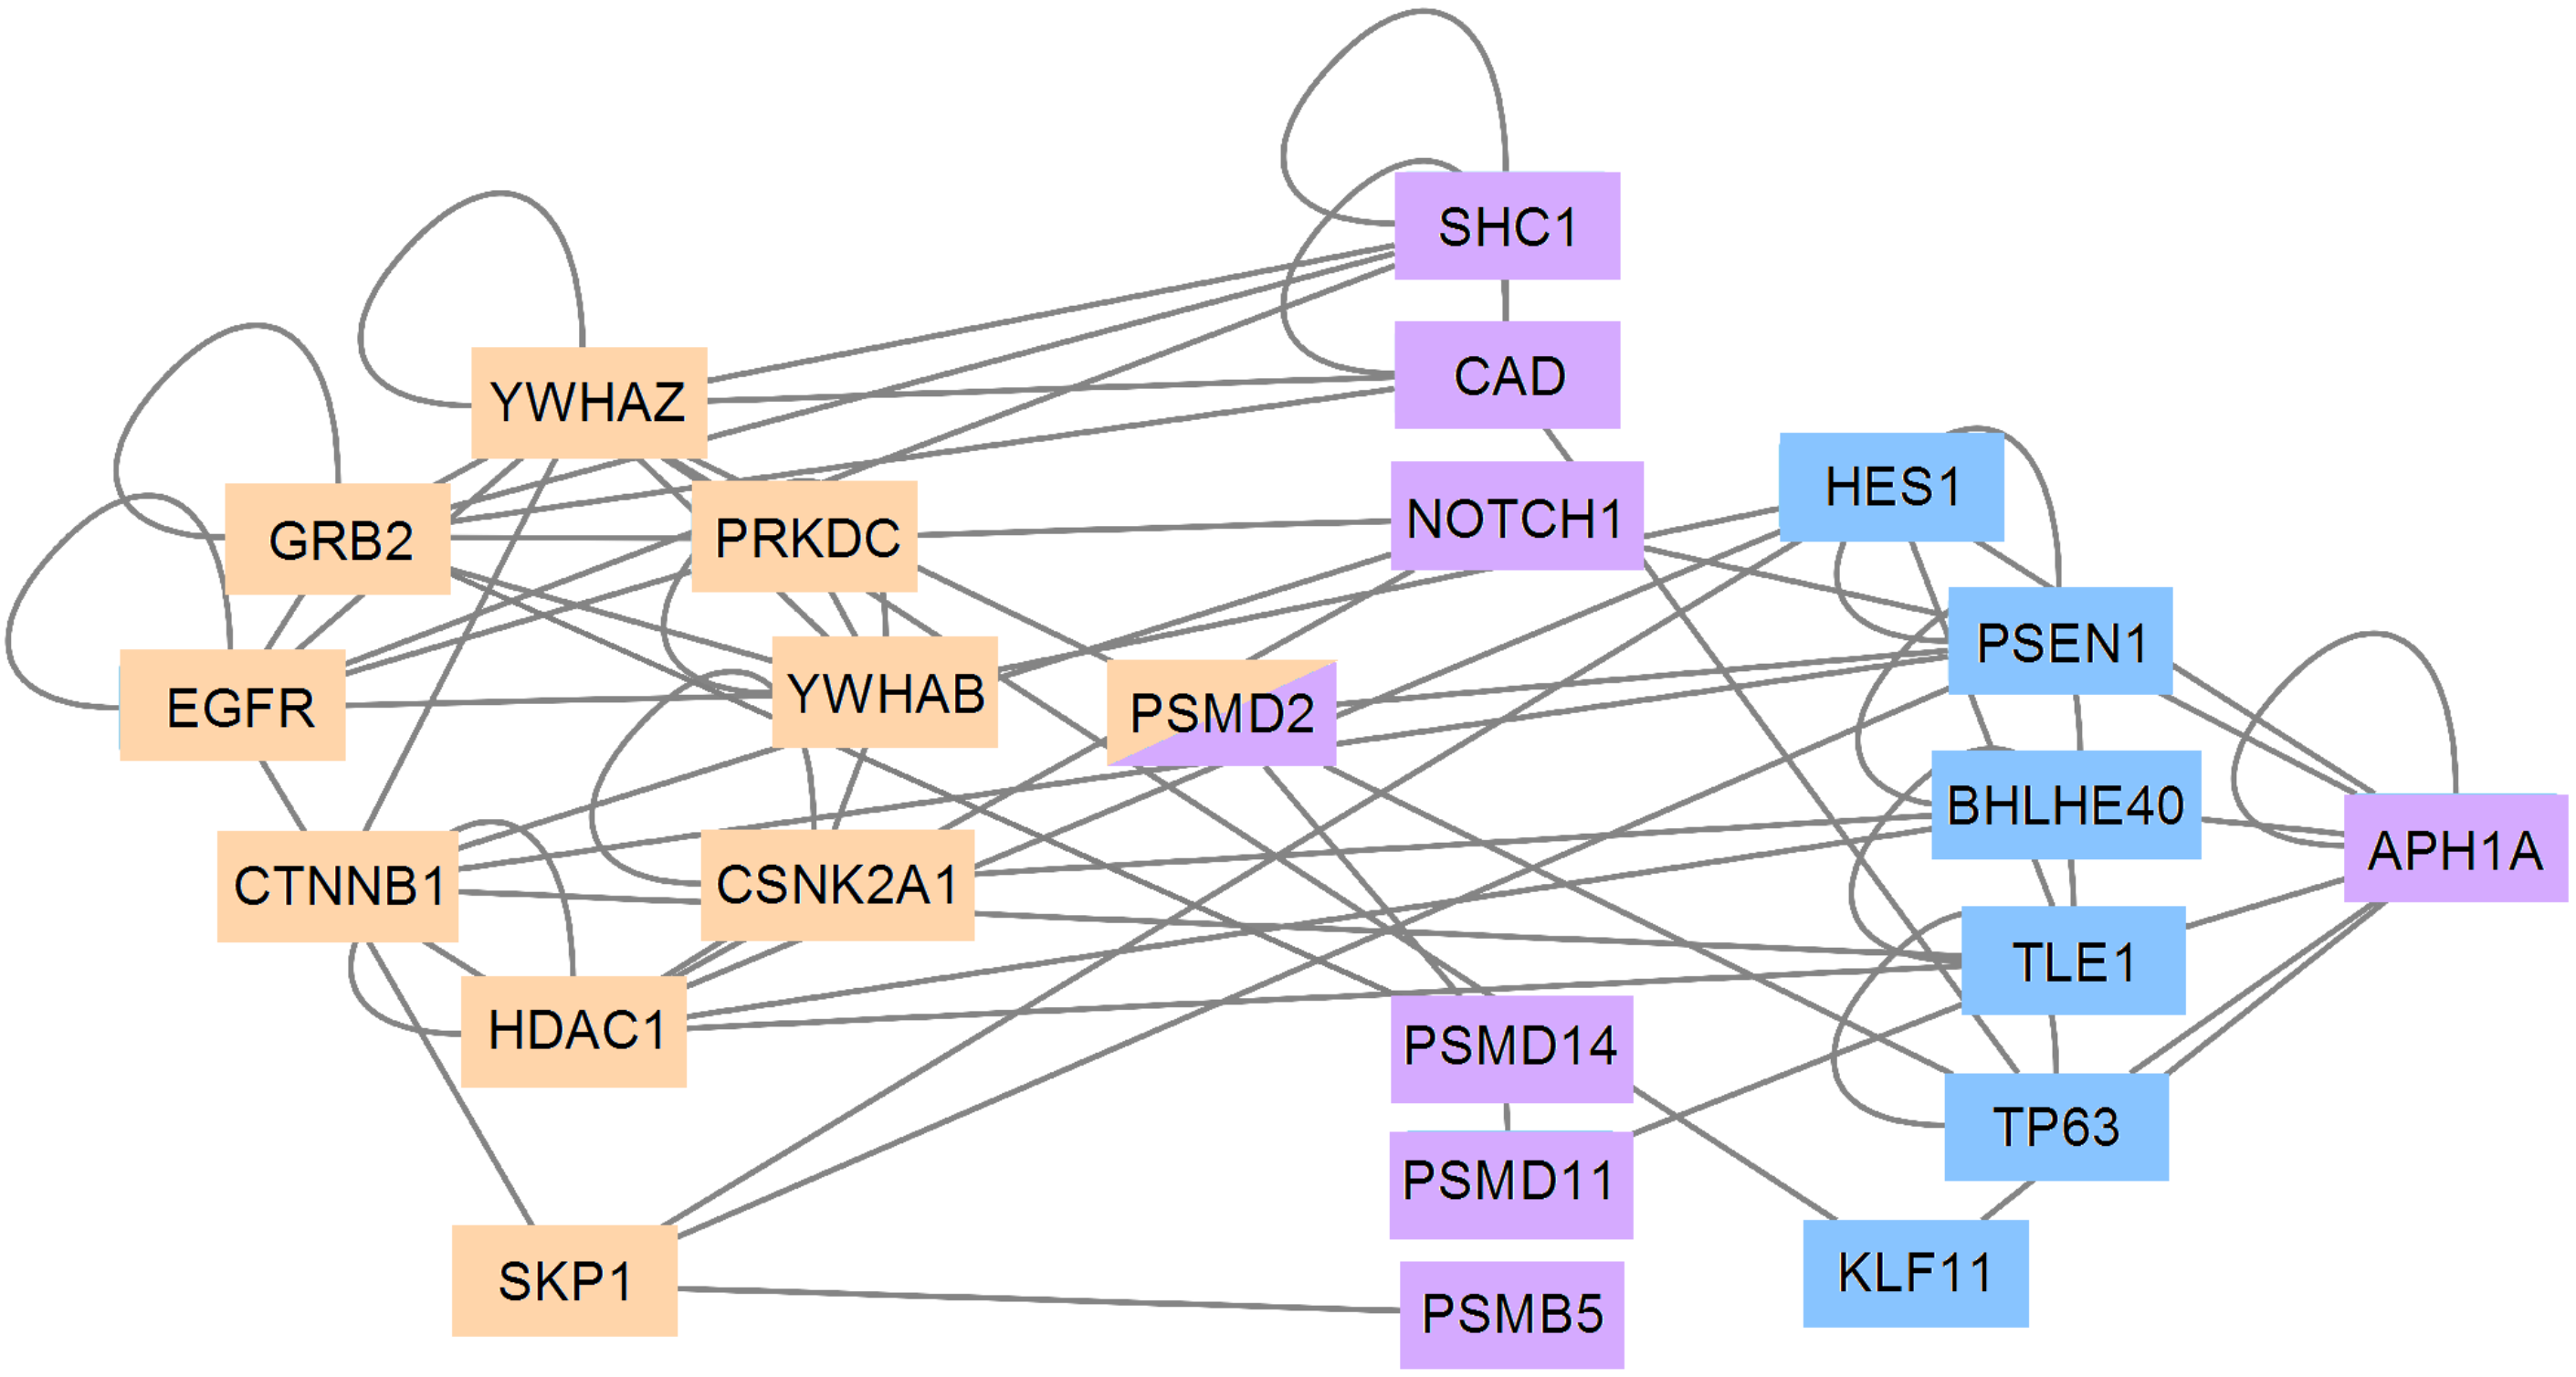
3.5. PCA and RFC Gene Network
4. Discussion
5. Conclusions
Supplementary Materials
Author Contributions
Funding
Funding
Institutional Review Board Statement
Informed Consent Statement
Data Availability Statement
Conflicts of Interest
References
- Bray, F.; Ferlay, J.; Soerjomataram, I.; Siegel, R.L.; Torre, L.A.; Jemal, A. Global cancer statistics 2018: GLOBOCAN estimates of incidence and mortality worldwide for 36 cancers in 185 countries. CA Cancer J. Clin. 2018, 68, 394–424. [Google Scholar] [CrossRef] [Green Version]
- Carels, N.; Conforte, A.J.; Lima, C.R.; da Silva, F.A.B. Challenges for the optimization of drug therapy in the treatment of cancer. In Computational Biology; Da Silva, F.A.B., Carels, N., dos Santos, T.M., Lopes, F.J.P., Eds.; Springer International Publishing: Cham, Switzerland, 2020; pp. 163–198. [Google Scholar]
- Heudobler, D.; Lüke, F.; Vogelhuber, M.; Klobuch, S.; Pukrop, T.; Herr, W.; Gerner, C.; Pantziarka, P.; Ghibelli, L.; Reichle, A. Anakoinosis: Correcting aberrant homeostasis of cancer tissue-going beyond apoptosis induction. Front. Oncol. 2019, 9, 1408. [Google Scholar] [CrossRef]
- Lahiri, C.; Pawar, S.; Rohit Mishra, R. Precision medicine and future of cancer treatment. Precis. Cancer Med. 2019, 2, 5167. [Google Scholar] [CrossRef]
- Whirl-Carrillo, M.; McDonagh, E.M.; Hebert, J.M.; Gong, L.; Sangkuhl, K.; Thorn, C.F.; Altman, R.B.; Klein, T.E. Pharmacogenomics knowledge for personalized medicine. Clin. Pharmacol. Ther. 2012, 92, 414–417. [Google Scholar] [CrossRef]
- Kunz, M.; Jeromin, J.; Fuchs, M.; Christoph, J.; Veronesi, G.; Flentje, M.; Nietzer, S.; Dandekar, G.; Dandekar, T. In silico signaling modeling to understand cancer pathways and treatment responses. Brief. Bioinform. 2020, 21, 1115–1117. [Google Scholar] [CrossRef]
- Carels, N.; Tilli, T.; Tuszynski, J.A. A computational strategy to select optimized protein targets for drug development toward the control of cancer diseases. PLoS ONE 2015, 10, e0115054. [Google Scholar] [CrossRef] [Green Version]
- Carels, N.; Tilli, T.M.; Tuszynki, J.A. Optimization of combination chemotherapy based on the calculation of network entropy for protein–protein interactions in breast cancer cell lines. EPJ Nonlinear Biomed. Phys. 2015, 3, 6. [Google Scholar] [CrossRef] [Green Version]
- Finak, G.; Sadekova, S.; Pepin, F.; Hallett, M.; Meterissian, S.; Halwani, F.; Khetani, K.; Souleimanova, M.; Zabolotny, B.; Omeroglu, A.; et al. Gene expression signatures of morphologically normal breast tissue identify basal-like tumors. Breast Cancer Res. 2006, 8, R58. [Google Scholar] [CrossRef] [Green Version]
- Tilli, T.M.; Carels, N.; Tuszynski, J.A.; Pasdar, M. Validation of a network-based strategy for the optimization of combinatorial target selection in breast cancer therapy: SiRNA knockdown of network targets in MDA-MB-231 cells as an Vitr. Model Inhib. Tumor Development. Oncotarget 2016, 7, 63189–63203. [Google Scholar] [CrossRef] [Green Version]
- Albert, R.; Jeong, H.; Barabasi, A.L. Error and attack tolerance of complex networks. Nature 2000, 406, 378–382. [Google Scholar] [CrossRef] [Green Version]
- Barabási, A.-L. Network Science; Cambridge University Press: Cambridge, UK, 2016; 475p. [Google Scholar]
- Conforte, A.J.; Tuszynski, J.A.; da Silva, F.A.B.; Carels, N. Signaling complexity measured by Shannon entropy and its application in personalized medicine. Front. Genet. 2019, 10, 930. [Google Scholar] [CrossRef] [Green Version]
- Pires, J.G.; da Silva, G.F.; Weyssow, T.; Conforte, A.J.; Pagnoncelli, D.; da Silva, F.A.B.; Carels, N. Galaxy and MEAN Stack to create a user-friendly workflow for the rational optimization of cancer chemotherapy. Front. Genet. 2021, 12, 624259. [Google Scholar] [CrossRef]
- Thompson, M.; Nejak-Bowen, K.; Monga, S.P.S. Crosstalk of the wnt signaling pathway. In The Wnt Pathway in Cancer; Springer International Publishing: New York, NY, USA, 2011; pp. 51–80. [Google Scholar]
- Collu, G.M.; Hidalgo-Sastre, A.; Brennan, K. Wnt-Notch signalling crosstalk in development and disease. Cell Mol. Life Sci. 2014, 71, 3553–3567. [Google Scholar] [CrossRef]
- Morris, S.A.L.; Huang, S. Crosstalk of the Wnt/-catenin pathway with other pathways in cancer cells. Genes Dis. 2016, 3, 41–47. [Google Scholar] [CrossRef] [Green Version]
- Marquard, A.M.; Birkbak, N.J.; Thomas, C.E.; Favero, F.; Krzystanek, M.; Lefebvre, C.; Ferté, C.; Jamal-Hanjani, M.; Wilson, G.A.; Shafi, S.; et al. TumorTracer: A method to identify the tissue of origin from the somatic mutations of a tumor specimen. BMC Med. Genom. 2015, 8, 58. [Google Scholar] [CrossRef] [Green Version]
- Pellegrino, E.; Jacques, C.; Beaufils, N.; Nanni, I.; Carlioz, A.; Metellus, P.; Ouafik, L. Machine learning random forest for predicting oncosomatic variant NGS analysis. Sci. Rep. 2021, 11, 21820. [Google Scholar] [CrossRef]
- Patel, H.; Vock, D.M.; Marai, G.E.; Fuller, C.D.; Mohamed, A.S.R.; Canahuate, G. Oropharyngeal cancer patient stratification using random forest based-learning over high-dimensional radiomic features. Sci. Rep. 2021, 11, 14057. [Google Scholar] [CrossRef]
- Altschul, S.F.; Madden, T.L.; Schaffer, A.A.; Zhang, J.; Zhang, Z.; Miller, W.; Lipman, D.J. Gapped BLAST and PSI-BLAST: A new generation of protein database search programs. Nucleic Acids Res. 1997, 25, 3389–3402. [Google Scholar] [CrossRef] [Green Version]
- Orchard, S.; Ammari, M.; Aranda, B.; Breuza, L.; Briganti, L.; Broackes-Carter, F.; Campbell, N.H.; Chavali, G.; Chen, C.; del-Toro, N.; et al. The MIntAct project–IntAct as a common curation platform for 11 molecular interaction databases. Nucleic Acids Res. 2014, 42, D358–D363. [Google Scholar] [CrossRef] [Green Version]
- Kanehisa, M.; Goto, S. KEGG: Kyoto Encyclopedia of Genes and Genomes. Nucleic Acids Res. 2000, 28, 27–30. [Google Scholar] [CrossRef]
- Jassal, B.; Matthews, L.; Viteri, G.; Gong, C.; Lorente, P.; Fabregat, A.; Sidiropoulos, K.; Cook, J.; Gillespie, M.; Haw, R.; et al. The reactome pathway knowledgebase. Nucleic Acids Res. 2020, 48, D498–D503. [Google Scholar] [CrossRef]
- Kruskal, W.H.; Wallis, W.A. Use of ranks in one-criterion variance analysis. J. Am. Stat. Assoc. 1952, 47, 583–621. [Google Scholar] [CrossRef]
- Wilcoxon, F. Individual comparisons by ranking methods. Biom. Bull. 1945, 1, 80–83. [Google Scholar] [CrossRef]
- Pearson, K. On lines and planes of closest fit to systems of points in space. Philos. Mag. 1901, 2, 559–572. [Google Scholar] [CrossRef] [Green Version]
- Lever, J.; Krzywinski, M.; Altman, N. Principal component analysis. Nat. Methods 2017, 14, 641–642. [Google Scholar] [CrossRef] [Green Version]
- Fujisawa, K.; Shimo, M.; Taguchi, Y.H.; Ikematsu, S.; Miyata, R. PCA-based unsupervised feature extraction for gene expression analysis of COVID-19 patients. Sci. Rep. 2021, 11, 17351. [Google Scholar] [CrossRef]
- Van der Maaten, L.J.P.; Hinton, G.E. Visualizing high-dimensional data using t-SNE. J. Mach. Learn. Res. 2008, 9, 2579–2605. [Google Scholar]
- McInnes, L.; Healy, J. UMAP: Uniform Manifold Approximation and Projection for Dimension Reduction. arXiv 2018, arXiv:1802.03426v3. [Google Scholar]
- Kobak, D.; Linderman, G.C. Initialization is critical for preserving global data structure in both t-SNE and UMAP. Nat. Biotechnol. 2021, 39, 156–157. [Google Scholar] [CrossRef]
- Dorrity, M.W.; Saunders, L.M.; Queitsch, C.; Fields, S.; Trapnell, C. Dimensionality reduction by UMAP to visualize physical and genetic interactions. Nat. Commun. 2020, 11, 1537. [Google Scholar] [CrossRef] [Green Version]
- Ho, T.K. The random subspace method for constructing decision forests. IEEE PAMI 1998, 20, 832–844. [Google Scholar]
- Genuer, R.; Poggi, J.-M.; Tuleau-Malot, C. Variable selection using Random Forests. Pattern Recognit. Lett. 2010, 31, 2225–2236. [Google Scholar] [CrossRef] [Green Version]
- Hong, S.; Lynn, H.S. Accuracy of random-forest-based imputation of missing data in the presence of non-normality, non-linearity, and interaction. BMC Med. Res. Methodol. 2020, 20, 199. [Google Scholar] [CrossRef]
- Song, J.; Gao, Y.; Yin, P.; Li, Y.; Li, Y.; Zhang, J.; Su, Q.; Fu, X.; Pi, H. The random forest model has the best accuracy among the four pressure ulcer prediction models using machine learning algorithms. Risk Manag. Health Policy 2021, 14, 1175–1187. [Google Scholar] [CrossRef]
- Herrera, V.M.; Khoshgoftaar, T.M.; Villanustre, F.; Furht, B. Random forest implementation and optimization for Big Data analytics on LexisNexis’s high performance computing cluster platform. J. Big Data 2019, 6, 68. [Google Scholar] [CrossRef] [Green Version]
- More, A.S.; Rana, D.P. Review of random forest classification techniques to resolve data imbalance. ICISIM 2017, 72–78. [Google Scholar]
- Shannon, P.; Markiel, A.; Ozier, O.; Baliga, N.S.; Wang, J.T.; Ramage, D.; Amin, N.; Schwikowski, B.; Ideker, T. Cytoscape: A software environment for integrated models of biomolecular interaction networks. Genome Res. 2003, 13, 2498–2504. [Google Scholar] [CrossRef]
- Van Wieringen, W.N.; van der Vaart, A.W. Statistical analysis of the cancer cell’s molecular entropy using high-throughput data. Bioinformatics 2011, 27, 556–563. [Google Scholar] [CrossRef] [Green Version]
- Breitkreutz, D.; Hlatky, L.; Rietman, E.; Tuszynski, J.A. Molecular signaling network complexity is correlated with cancer patient survivability. Proc. Natl. Acad. Sci. USA 2012, 109, 9209–9212. [Google Scholar] [CrossRef] [Green Version]
- Winterbach, W.; Mieghem, P.; Reinders, M.; Wang, H.; de Ridder, D. Topology of molecular interaction networks. BMC Syst. Biol. 2013, 7, 90. [Google Scholar] [CrossRef] [Green Version]
- Banerji, C.R.S.; Severini, S.; Caldas, C.; Teschendorff, A.E. Intra-tumour signalling entropy determines clinical outcome in breast and lung cancer. PLoS Comput. Biol. 2015, 11, e1004115. [Google Scholar] [CrossRef]
- Zhan, T.; Rindtorff, N.; Boutros, M. Wnt signaling in cancer. Oncogene 2017, 36, 1461–1473. [Google Scholar] [CrossRef]
- Santos, R.O.; Gorgulho, B.M.; Castro, M.A.; Fisberg, R.M.; Marchioni, D.M.; Baltar, V.T. Principal Component Analysis and Factor Analysis: Differences and similarities in Nutritional Epidemiology application. Rev. Bras. Epidemiol. 2019, 22, e190041. [Google Scholar] [CrossRef] [Green Version]
- Raileanu, L.E.; Stoffel, K. Theoretical comparison between the Gini Index and Information Gain criteria. Ann. Math. Artif. Intell. 2004, 41, 77–93. [Google Scholar] [CrossRef]
- Xie, X.; Li, Y.; Zhu, H.; Kuang, Z.; Chen, D.; Fan, T. Prognostic significance of -catenin expression in osteosarcoma: A meta-analysis. Front. Oncol. 2020, 10, 402. [Google Scholar] [CrossRef]
- Guo, X.E.; Ngo, B.; Modrek, A.S.; Lee, W.-H. Targeting tumor suppressor networks for cancer therapeutics. Curr. Drug Targets 2014, 15, 2–16. [Google Scholar] [CrossRef] [Green Version]
- Campbell, P.J.; Getz, G.; Korbel, J.O. The Icgc/Tcga Pan-Cancer Analysis of Whole Genomes Consortium. Pan-cancer analysis of whole genomes. Nature 2020, 578, 82–93. [Google Scholar]
- Didiasova, M.; Schaefer, L.; Wygrecka, M. Targeting GLI transcription factors in cancer. Molecules 2018, 23, 1003. [Google Scholar] [CrossRef] [Green Version]
- Karolak, A.; Branciamore, S.; McCune, J.S.; Lee, P.P.; Rodin, A.S.; Rockne, R.C. Concepts and applications of information theory to immuno-oncology. Trends Cancer 2021, 7, 335–346. [Google Scholar] [CrossRef]
- Jean-Quartier, C.; Jeanquartier, F.; Jurisica, I.; Holzinger, A. Silico Cancer Res. Towards 3R. BMC Cancer 2018, 18, 408. [Google Scholar] [CrossRef]
- Jin, X.; Liu, Y.; Liu, J.; Lu, W.; Liang, Z.; Zhang, D.; Liu, G.; Zhu, H.; Xu, N.; Liang, S. The overexpression of IQGAP1 and β-catenin is associated with tumor progression in hepatocellular carcinoma in vitro and in vivo. PLoS ONE 2015, 10, e0133770. [Google Scholar] [CrossRef]
- Jin, J.; Zhan, P.; Katoh, M.; Kobayashi, S.S.; Phan, K.; Qian, H.; Li, H.; Wang, X.; Wang, X.; Song, Y. Prognostic significance of β-catenin expression in patients with non-small cell lung cancer: A meta-analysis. Transl Lung Cancer Res. 2017, 6, 97–108. [Google Scholar] [CrossRef] [Green Version]
- Schatoff, E.M.; Leach, B.I.; Dow, L.E. WNT Signaling and Colorectal Cancer. Curr. Color. Cancer Rep. 2017, 13, 101–110. [Google Scholar] [CrossRef] [Green Version]
- Yang, F.; Xu, J.; Li, H.; Tan, M.; Xiong, X.; Sun, Y. FBXW2 suppresses migration and invasion of lung cancer cells via promoting -catenin ubiquitylation and degradation. Nat. Commun. 2019, 10, 1382. [Google Scholar] [CrossRef] [Green Version]
- Kim, W.K.; Kwon, Y.; Jang, M.; Park, M.; Kim, J.; Cho, S.; Jang, D.G.; Lee, W.B.; Jung, S.H.; Choi, H.J.; et al. -catenin activation down-regulates cell–cell junction-related genes and induces epithelial-to-mesenchymal transition in colorectal cancers. Sci. Rep. 2019, 9, 18440. [Google Scholar] [CrossRef] [Green Version]
- Soares-Lima, S.C.; Pombo-de-Oliveira, M.S.; Carneiro, F.R.G. The multiple ways Wnt signaling contributes to acute leukemia pathogenesis. J. Leukoc. Biol. 2020, 108, 1081–1099. [Google Scholar] [CrossRef]
- Gonzalez, D.M.; Medici, D. Signaling mechanisms of the epithelial-mesenchymal transition. Sci. Signal. 2014, 7, re8. [Google Scholar] [CrossRef] [Green Version]
- Borgo, C.; D’Amore, C.; Sarno, S.; Salvi, M.; Ruzzene, M. Protein kinase CK2: A potential therapeutic target for diverse human diseases. Signal Transduct. Target. Ther. 2021, 6, 183. [Google Scholar] [CrossRef]
- Chua, M.M.J.; Ortega, C.E.; Sheikh, A.; Lee, M.; Abdul-Rassoul, H.; Hartshorn, K.L.; Dominguez, I. CK2 in cancer: Cellular and biochemical mechanisms and potential therapeutic target. Pharmaceuticals 2017, 10, 18. [Google Scholar] [CrossRef]
- Bae, J.S.; Park, S.H.; Jamiyandorj, U.; Kim, K.M.; Noh, S.J.; Kim, J.R.; Park, H.J.; Kwon, K.S.; Jung, S.H.; Park, H.S.; et al. CK2/CSNK2A1 Phosphorylates SIRT6 and Is Involved in the Progression of Breast Carcinoma and Predicts Shorter Survival of Diagnosed Patients. Am. J. Pathol. 2016, 186, 3297–3315. [Google Scholar] [CrossRef] [Green Version]
- Jiang, C.; Ma, Z.; Zhang, G.; Yang, X.; Du, Q.; Wang, W. Csnk2a1 promotes gastric cancer invasion through the pi3k-akt-mtor signaling pathway. Cancer Manag. Res. 2019, 11, 10135–10143. [Google Scholar] [CrossRef] [PubMed] [Green Version]
- Cornell, L.; Munck, J.M.; Alsinet, C.; Villanueva, A.; Ogle, L.; Willoughby, C.E.; Televantou, D.; Thomas, H.D.; Jackson, J.; Burt, A.D.; et al. DNA-PK- A candidate driver of hepatocarcinogenesis and tissue biomarker that predicts response to treatment and survival. Clin. Cancer Res. 2015, 21, 925–933. [Google Scholar] [CrossRef] [PubMed] [Green Version]
- Sun, G.; Yang, L.; Dong, C.; Ma, B.; Shan, M.; Ma, B. PRKDC regulates chemosensitivity and is a potential prognostic and predictive marker of response to adjuvant chemotherapy in breast cancer patients. Oncol. Rep. 2017, 37, 3536–3542. [Google Scholar] [CrossRef]
- Yang, H.; Yao, F.; Marti, T.M.; Schmid, R.A.; Peng, R.W. Beyond DNA repair: DNA-PKcs in tumor metastasis, metabolism and immunity. Cancers 2020, 12, 3389. [Google Scholar] [CrossRef]
- Kothari, V.; Goodwin, J.F.; Zhao, S.G.; Drake, J.M.; Yin, Y.; Chang, S.L.; Evans, J.R.; Wilder-Romans, K.; Gabbara, K.; Dylgjeri, E.; et al. DNA-dependent protein kinase drives prostate cancer progression through transcriptional regulation of the Wnt signaling pathway. Clin. Cancer Res. 2019, 25, 5608–5622. [Google Scholar] [CrossRef] [PubMed]
- Zheng, B.; Mao, J.H.; Li, X.Q.; Qian, L.; Zhu, H.; Gu, D.H.; Pan, X.D. Over-expression of DNA-PKcs in renal cell carcinoma regulates mTORC2 activation, HIF-2 expression and cell proliferation. Sci. Rep. 2016, 6, 29415. [Google Scholar] [CrossRef] [PubMed]
- An, J.; Yang, D.Y.; Xu, Q.Z.; Zhang, S.M.; Huo, Y.Y.; Shang, Z.F.; Wang, Y.; Wu, D.C.; Zhou, P.K. DNA-dependent protein kinase catalytic subunit modulates the stability of c-Myc oncoprotein. Mol. Cancer 2008, 7, 32. [Google Scholar] [CrossRef] [PubMed] [Green Version]
- Mackintosh, C. Dynamic interactions between 14 and 3-3 proteins and phosphoproteins regulate diverse cellular processes. Biochem. J. 2004, 381, 329–342. [Google Scholar] [CrossRef] [Green Version]
- Pennington, K.; Chan, T.; Torres, M.; Andersen, J. The dynamic and stress-adaptive signaling hub of 14-3-3: Emerging mechanisms of regulation and context-dependent protein–protein interactions. Oncogene 2018, 37, 5587–5604. [Google Scholar] [CrossRef] [Green Version]
- Chen, C.H.; Chuang, S.M.; Yang, M.F.; Liao, J.W.; Yu, S.L.; Chen, J.J.W. A novel function of YWHAZ/-catenin axis in promoting epithelial-mesenchymal transition and lung cancer metastasis. Mol. Cancer Res. 2012, 10, 1319–1331. [Google Scholar] [CrossRef] [Green Version]
- Gan, Y.; Ye, F.; He, X.X. The role of YWHAZ in cancer: A maze of opportunities and challenges. J. Cancer 2020, 11, 2252–2264. [Google Scholar] [CrossRef] [PubMed]
- Hartman, A.M.; Hirsch, A.K.H. Molecular insight into specific 14-3-3 modulators: Inhibitors and stabilisers of protein–protein interactions of 14-3-3. Eur. J. Med. Chem. 2017, 136, 573–584. [Google Scholar] [CrossRef] [PubMed]
- Iralde-Lorente, L.; Cau, Y.; Clementi, L.; Franci, L.; Tassone, G.; Valensin, D.; Mori, M.; Angelucci, A.; Chiariello, M.; Botta, M. Chemically stable inhibitors of 14-3-3 protein–protein interactions derived from BV02. J. Enzym. Inhib. Med. Chem. 2019, 34, 657–664. [Google Scholar] [CrossRef] [PubMed] [Green Version]
- Tian, Q.; Feetham, M.C.; Tao, W.A.; He, X.C.; Li, L.; Aebersold, R.; Hood, L. Proteomic analysis identifies that 14-3-3 interacts with -catenin and facilitates its activation by Akt. Proc. Natl. Acad. Sci. USA 2004, 101, 15370–15375. [Google Scholar] [CrossRef] [Green Version]
- Dovrat, S.; Caspi, M.; Zilberberg, A.; Lahav, L.; Firsow, A.; Gur, H.; Rosin-Arbesfeld, R. 14-3-3 and -catenin are secreted on extracellular vesicles to activate the oncogenic Wnt pathway. Mol. Oncol. 2014, 8, 894–911. [Google Scholar] [CrossRef]
- Yang, X.; Cao, W.; Lin, H.; Zhang, W.; Lin, W.; Cao, L.; Zhen, H.; Huo, J.; Zhang, X. Isoform-specific expression of 14-3-3 proteins in human astrocytoma. J. Neurol. Sci. 2009, 276, 54–59. [Google Scholar] [CrossRef]
- Liu, T.A.; Jan, Y.J.; Ko, B.S.; Chen, S.C.; Liang, S.M.; Hung, Y.L.; Hsu, C.; Shen, T.L.; Lee, Y.M.; Chen, P.F.; et al. Increased expression of 14-3-3 promotes tumor progression and predicts extrahepatic metastasis and worse survival in hepatocellular carcinoma. Am. J. Pathol. 2011, 179, 2698–2708. [Google Scholar] [CrossRef]
- Zeng, Y.; Li, Y.; Chen, R.S.; He, X.; Yang, L.; Li, W. Overexpression of xCT induces up-regulation of 14-3-3beta in Kaposi’s sarcoma. Biosci. Rep. 2010, 30, 277–283. [Google Scholar] [CrossRef]
- Tang, Y.; Lv, P.; Sun, Z.; Han, L.; Zhou, W. 14-3-3 promotes migration and invasion of human hepatocellular carcinoma cells by modulating expression of mmp2 and mmp9 through PI3K/Akt/NF-κB pathway. PLoS ONE 2016, 11, e0146070. [Google Scholar] [CrossRef] [Green Version]
- Gong, F.; Wang, G.; Ye, J.; Li, T.; Bai, H.; Wang, W. 14-3-3 regulates the proliferation of glioma cells through the GSK3/-catenin signaling pathway. Oncol. Rep. 2013, 30, 2976–2982. [Google Scholar] [CrossRef] [Green Version]
- Jia, L.; Sun, Y. SCF E3 Ubiquitin Ligases as Anticancer Targets. Curr Cancer Drug Targets 2011, 11, 347–356. [Google Scholar] [CrossRef] [PubMed] [Green Version]
- Sun, Y. E3 ubiquitin ligases as cancer targets and biomarkers. Neoplasia 2006, 8, 645–654. [Google Scholar] [CrossRef] [PubMed] [Green Version]
- Liu, Y.-Q.; Wang, X.-L.; Cheng, X.; Lu, Y.-Z.; Wang, G.-Z.; Li, X.-C.; Zhang, J.; Wen, Z.S.; Huang, Z.L.; Gao, Q.L.; et al. Skp1 in lung cancer: Clinical significance and therapeutic efficacy of its small molecule inhibitors. Oncotarget 2015, 6, 34953–34967. [Google Scholar] [CrossRef] [PubMed] [Green Version]
- Tian, C.; Lang, T.; Qiu, J.; Han, K.; Zhou, L.; Min, D.; Zhang, Z.; Qi, D. SKP1 promotes YAP-mediated colorectal cancer stemness via suppressing RASSF1. Cancer Cell Int. 2020, 20, 579. [Google Scholar] [CrossRef] [PubMed]
- Lepage, C.C.; Palmer, M.C.L.; Farrell, A.C.; Neudorf, N.M.; Lichtensztejn, Z.; Nachtigal, M.W.; McManus, K.J. Reduced SKP1 and CUL1 expression underlies increases in Cyclin E1 and chromosome instability in cellular precursors of high-grade serous ovarian cancer. Br. J. Cancer 2021, 124, 1699–1710. [Google Scholar] [CrossRef]
- Luo, J.; Su, F.; Chen, D.; Shiloh, A.; Gu, W. Deacetylation of p53 modulates its effect on cell growth and apoptosis. Nature 2000, 408, 377–381. [Google Scholar] [CrossRef]
- Ito, A.; Kawaguchi, Y.; Lai, C.-H.; Kovacs, J.J.; Higashimoto, Y.; Appella, E.; Yao, T.P. MDM2-HDAC1-mediated deacetylation of p53 is required for its degradation. EMBO J. 2002, 21, 6236–6245. [Google Scholar] [CrossRef]
- Yu, Z.; Zeng, J.U.N.; Liu, H.U.I.; Wang, T.; Yu, Z.; Chen, J. Role of HDAC1 in the progression of gastric cancer and the correlation with lncRNAs. Oncol. Lett. 2019, 17, 3296–3304. [Google Scholar] [CrossRef] [Green Version]
- Halkidou, K.; Gaughan, L.; Cook, S.; Leung, H.Y.; Neal, D.E.; Robson, C.N. Upregulation and Nuclear Recruitment of HDACl in Hormone Refractory Prostate Cancer. Prostate 2004, 59, 177–189. [Google Scholar] [CrossRef]
- Tang, Z.; Ding, S.; Huang, H.; Luo, P.; Qing, B.; Zhang, S.; Tang, R. HDAC1 triggers the proliferation and migration of breast cancer cells via upregulation of interleukin-8. Biol. Chem. 2017, 398, 1347–1356. [Google Scholar] [CrossRef]
- Ramakrishnan, S.; Ku, S.Y.; Ciamporcero, E.; Miles, K.M.; Attwood, K.; Chintala, S.; Shen, L.; Ellis, L.; Sotomayor, P.; Swetzig, W.; et al. HDAC 1 and 6 modulate cell invasion and migration in clear cell renal cell carcinoma. BMC Cancer 2016, 16, 617. [Google Scholar] [CrossRef] [PubMed] [Green Version]
- Collins, G.A.; Goldberg, A.L. The Logic of the 26S Proteasome. Cell 2017, 169, 792–806. [Google Scholar] [CrossRef] [PubMed] [Green Version]
- Jang, H.H. Regulation of Protein Degradation by Proteasomes in Cancer. J. Cancer Prev. 2018, 23, 153–161. [Google Scholar] [CrossRef] [PubMed]
- Zhang, L.; Xu, H.; Ma, C.; Zhang, J.; Zhao, Y.; Yang, X.; Wang, S.; Li, D. Upregulation of deubiquitinase PSMD14 in lung adenocarcinoma (LUAD) and its prognostic significance. J. Cancer 2020, 11, 2962–2971. [Google Scholar] [CrossRef] [Green Version]
- Tan, Y.; Jin, Y.; Wu, X.; Ren, Z. PSMD1 and PSMD2 regulate HepG2 cell proliferation and apoptosis via modulating cellular lipid droplet metabolism. BMC Mol. Biol. 2019, 20, 24. [Google Scholar] [CrossRef]
- Li, Y.; Huang, J.; Zeng, B.; Yang, D.; Sun, J.; Yin, X.; Lu, M.; Qiu, Z.; Peng, W.; Xiang, T.; et al. PSMD2 regulates breast cancer cell proliferation and cell cycle progression by modulating p21 and p27 proteasomal degradation. Cancer Lett. 2018, 430, 109–122. [Google Scholar] [CrossRef]
- Tomida, S.; Yanagisawa, K.; Koshikawa, K.; Yatabe, Y.; Mitsudomi, T.; Osada, H.; Takahashi, T. Identification of a metastasis signature and the DLX4 homeobox protein as a regulator of metastasis by combined transcriptome approach. Oncogene 2007, 26, 4600–4608. [Google Scholar] [CrossRef] [Green Version]
- Matsuyama, Y.; Suzuki, M.; Arima, C.; Huang, Q.M.; Tomida, S.; Takeuchi, T.; Sugiyama, R.; Itoh, Y.; Yatabe, Y.; Goto, H.; et al. Proteasomal non-catalytic subunit PSMD2 as a potential therapeutic target in association with various clinicopathologic features in lung adenocarcinomas. Mol. Carcinog. 2011, 50, 301–309. [Google Scholar] [CrossRef]
- Giubellino, A.; Burke, T.R.; Bottaro, D.P. Grb2 signaling in cell motility and cancer. Expert Opin. Ther. Targets 2008, 12, 1021–1033. [Google Scholar] [CrossRef] [Green Version]
- Liang, C.; Xu, Y.; Ge, H.; Xing, B.; Li, G.; Li, G.; Wu, J. miR-564 inhibits hepatocellular carcinoma cell proliferation and invasion by targeting the GRB2-ERK1/2-AKT axis. Oncotarget 2017, 8, 107543–107557. [Google Scholar] [CrossRef] [Green Version]
- Mitra, P.; Kalailingam, P.; Tan, H.; Thanabalu, T. Overexpression of GRB2 Enhances Epithelial to Mesenchymal Transition of A549 Cells by Upregulating SNAIL Expression. Cells 2018, 7, 97. [Google Scholar] [CrossRef] [PubMed] [Green Version]
- Ijaz, M.; Wang, F.; Shahbaz, M.; Jiang, W.; Fathy, A.H.; Nesa, E.U. The Role of Grb2 in Cancer and Peptides as Grb2 Antagonists. Protein Pept. Lett. 2017, 24, 1084–1095. [Google Scholar] [CrossRef] [PubMed]
- Qu, Y.; Chen, Q.; Lai, X.; Zhu, C.; Chen, C.; Zhao, X.; Deng, R.; Xu, M.; Yuan, H.; Wang, Y.; et al. SUMOylation of Grb2 enhances the ERK activity by increasing its binding with Sos1. Mol. Cancer 2014, 13, 95. [Google Scholar] [CrossRef] [Green Version]
- Lv, J.; Zhang, S.; Wu, H.; Lu, J.; Lu, Y.; Wang, F.; Zhao, W.; Zhan, P.; Lu, J.; Fang, Q.; et al. Deubiquitinase PSMD14 enhances hepatocellular carcinoma growth and metastasis by stabilizing GRB2. Cancer Lett. 2020, 469, 22–34. [Google Scholar] [CrossRef] [PubMed]
- Tsvetkov, P.; Adler, J.; Myers, N.; Biran, A.; Reuven, N.; Shaul, Y. Oncogenic addiction to high 26S proteasome level. Cell Death Dis. 2018, 9, 773. [Google Scholar] [CrossRef] [PubMed] [Green Version]
- Zhou, C.; Li, H.; Han, X.; Pang, H.; Wu, M.; Tang, Y.; Luo, X. Prognostic Value and Molecular Mechanisms of Proteasome 26S Subunit, Non-ATPase Family Genes for Pancreatic Ductal Adenocarcinoma Patients after Pancreaticoduodenectomy. J. Investig. Surg. 2021, 35, 330–346. [Google Scholar] [CrossRef] [PubMed]
- Sahni, S.; Krisp, C.; Molloy, M.P.; Nahm, C.; Maloney, S.; Gillson, J.; Gill, A.J.; Samra, J.; Mittal, A. PSMD11, PTPRM and PTPRB as novel biomarkers of pancreatic cancer progression. Biochim. Biophys. Acta Gen. Subj. 2020, 1864, 142–149. [Google Scholar] [CrossRef]
- Wang, C.-Y.; Li, C.-Y.; Hsu, H.-P.; Cho, C.-Y.; Yen, M.-C.; Weng, T.-Y.; Chen, W.C.; Hung, Y.H.; Lee, K.T.; Hung, J.H.; et al. PSMB5 plays a dual role in cancer development and immunosuppression. Am. J. Cancer Res. 2017, 7, 2103–2120. [Google Scholar]
- Fan, J.; Du, W.; Zhang, H.; Wang, Y.; Li, K.; Meng, Y.; Wang, J. Transcriptional downregulation of miR-127-3p by CTCF promotes prostate cancer bone metastasis by targeting PSMB5. FEBS Lett. 2020, 594, 466–476. [Google Scholar] [CrossRef]
- Zhu, R.; Liu, Y.; Zhou, H.; Li, L.; Li, Y.; Ding, F.; Cao, X.; Liu, Z. Deubiquitinating enzyme PSMD14 promotes tumor metastasis through stabilizing SNAIL in human esophageal squamous cell carcinoma. Cancer Lett. 2018, 418, 125–134. [Google Scholar] [CrossRef]
- Li, G.; Li, D.; Wang, T.; He, S. Pyrimidine biosynthetic enzyme CAD: Its function, regulation, and diagnostic potential. Int. J. Mol. Sci. 2021, 22, 10253. [Google Scholar] [CrossRef] [PubMed]
- Givechian, K.B.; Garner, C.; Garban, H.; Rabizadeh, S.; Soon-Shiong, P. CAD/POLD2 gene expression is associated with poor overall survival and chemoresistance in bladder urothelial carcinoma. Oncotarget 2018, 9, 29743–29752. [Google Scholar] [CrossRef] [PubMed] [Green Version]
- Ridder, D.A.; Schindeldecker, M.; Weinmann, A.; Berndt, K.; Urbansky, L.; Witzel, H.R.; Heinrich, S.; Roth, W.; Straub, B.K. Key Enzymes in Pyrimidine Synthesis, CAD and CPS1, Predict Prognosis in Hepatocellular Carcinoma. Cancers 2021, 13, 744. [Google Scholar] [CrossRef] [PubMed]
- Dumenci, O.E.; U, A.M.; Khan, S.A.; Holmes, E.; Taylor-Robinson, S.D. Exploring Metabolic Consequences of CPS1 and CAD Dysregulation in Hepatocellular Carcinoma by Network Reconstruction. J. Hepatocell. Carcinoma 2020, 7, 1–9. [Google Scholar] [CrossRef] [PubMed] [Green Version]
- Miltenberger, R.J.; Sukow, K.A.; Farnham, P.J. An E-Box-Mediated Increase in cad Transcription at the G 1 /S-Phase Boundary Is Suppressed by Inhibitory c-Myc Mutants. Mol. Cell. Biol. 1995, 15, 2527–2535. [Google Scholar] [CrossRef] [Green Version]
- Aster, J.C.; Pear, W.S.; Blacklow, S.C. The Varied Roles of Notch in Cancer. Annu. Rev. Pathol. Mech. Dis. 2017, 12, 245–275. [Google Scholar] [CrossRef] [Green Version]
- Jeon, Y.H.; Ha, M.; Kim, S.W.; Kim, M.J.; Lee, C.S.; Oh, C.K.; Han, M.E.; Oh, S.O.; Kim, Y.H. Evaluation of the prognostic significances of γ-secretase genes in pancreatic cancer. Oncol. Lett. 2019, 17, 4614–4620. [Google Scholar] [CrossRef]
- Zhang, Z.; Nadeau, P.; Song, W.; Donoviel, D.; Yuan, M.; Bernstein, A.; Yankner, B.A. Presenilins are required for -secretase cleavage of -APP and transmembrane cleavage of Notch-1. Nat. Cell Biol. 2000, 2, 463–465. [Google Scholar] [CrossRef]
- Periz, G.; Fortini, M.E. Functional reconstitution of -secretase through coordinated expression of presenilin, nicastrin, Aph-1, and Pen-2. J. Neurosci. Res. 2004, 77, 309–322. [Google Scholar] [CrossRef]
- Bianchi, S.; Dotti, M.T.; Federico, A. Physiology and pathology of Notch signalling system. J. Cell. Physiol. 2006, 207, 300–308. [Google Scholar] [CrossRef]
- Yuan, X.; Zhang, M.; Wu, H.; Xu, H.; Han, N.; Chu, Q.; Yu, S.; Chen, Y.; Wu, K. Expression of Notch1 correlates with breast cancer progression and prognosis. PLoS ONE 2015, 10, e0131689. [Google Scholar] [CrossRef] [PubMed] [Green Version]
- Yuan, X.; Wu, H.; Xu, H.; Han, N.; Chu, Q.; Yu, S.; Chen, Y.; Wu, K. Meta-analysis reveals the correlation of Notch signaling with non-small cell lung cancer progression and prognosis. Sci. Rep. 2015, 5, 10338. [Google Scholar] [CrossRef] [PubMed] [Green Version]
- Wieland, E.; Rodriguez-Vita, J.; Liebler, S.S.; Mogler, C.; Moll, I.; Herberich, S.E.; Espinet, E.; Herpel, E.; Menuchin, A.; Chang-Claude, J.; et al. Endothelial Notch1 Activity Facilitates Metastasis. Cancer Cell 2017, 31, 355–367. [Google Scholar] [CrossRef] [PubMed] [Green Version]
- Ahmed, S.B.M.; Prigent, S.A. Insights into the Shc family of adaptor proteins. J. Mol. Signal. 2017, 12, 2. [Google Scholar] [CrossRef] [Green Version]
- Ahn, R.; Sabourin, V.; Bolt, A.M.; Hébert, S.; Totten, S.; de Jay, N.; Festa, M.C.; Young, Y.K.; Im, Y.K.; Pawson, T.; et al. The Shc1 adaptor simultaneously balances Stat1 and Stat3 activity to promote breast cancer immune suppression. Nat. Commun. 2017, 8, 14638. [Google Scholar] [CrossRef]
- Wright, K.D.; Miller, B.S.; El-Meanawy, S.; Tsaih, S.W.; Banerjee, A.; Geurts, A.M.; Sheinin, Y.; Sun, Y.; Kalyanaraman, B.; Rui, H.; et al. The p52 isoform of SHC1 is a key driver of breast cancer initiation. Breast Cancer Res. 2019, 21, 74. [Google Scholar] [CrossRef]
- Terada, L.S. Shc and the mechanotransduction of cellular anchorage and metastasis. Small GTPases 2019, 10, 64–71. [Google Scholar] [CrossRef] [Green Version]
- Qi, L.; Zhou, B.; Chen, J.; Hu, W.; Bai, R.; Ye, C.; Weng, X.; Zheng, S. Significant prognostic values of differentially expressed-aberrantly methylated hub genes in breast cancer. J. Cancer 2019, 10, 6618–6634. [Google Scholar] [CrossRef]
- Ghiraldini, F.G.; Filipescu, D.; Bernstein, E. Solid tumours hijack the histone variant network. Nat. Rev. Cancer 2021, 21, 2. [Google Scholar] [CrossRef]
- Dong, M.; Chen, J.; Deng, Y.; Zhang, D.; Dong, L.; Sun, D. H2AFZ Is a Prognostic Biomarker Correlated to TP53 Mutation and Immune Infiltration in Hepatocellular Carcinoma. Front. Oncol. 2021, 11, 701736. [Google Scholar] [CrossRef]
- Ávila-López, P.A.; Guerrero, G.; Nuñez-Martínez, H.N.; Peralta-Alvarez, C.A.; Hernández-Montes, G.; Álvarez-Hilario, L.G.; Herrera-Goepfert, R.; Albores-Saavedra, J.; Villegas-Sepúlveda, N.; Cedillo-Barrón, L.; et al. H2A.Z overexpression suppresses senescence and chemosensitivity in pancreatic ductal adenocarcinoma. Oncogene 2021, 40, 2065–2080. [Google Scholar] [CrossRef] [PubMed]
- Rispal, J.; Baron, L.; Beaulieu, J.F.; Chevillard-Briet, M.; Trouche, D.; Escaffit, F. The H2A.Z histone variant integrates Wnt signaling in intestinal epithelial homeostasis. Nat. Commun. 2019, 10, 1827. [Google Scholar] [CrossRef] [PubMed] [Green Version]
- Masood, M.; Grimm, S.; El-Bahrawy, M.; Yagüe, E. TMEFF2: A transmembrane proteoglycan with multifaceted actions in cancer and disease. Cancers 2020, 12, 3862. [Google Scholar] [CrossRef] [PubMed]
- Li, K.; Taylor, J.R.; Wu, T.D.; Gutierrez, J.; Elliott, J.M.; Vernes, J.M.; Koeppen, H.; Phillips, H.S.; de Sauvage, F.J.; Meng, Y.G. TMEFF2 is a PDGF-AA binding protein with methylation-associated gene silencing in multiple cancer types including glioma. PLoS ONE 2011, 6, e18608. [Google Scholar]
- Sun, T.; Du, W.; Xiong, H.; Yu, Y.; Weng, Y.; Ren, L.; Zhao, H.; Wang, Y.; Chen, Y.; Xu, J.; et al. TMEFF2 deregulation contributes to gastric carcinogenesis and indicates poor survival outcome. Clin. Cancer Res. 2014, 20, 4689–4704. [Google Scholar] [CrossRef] [Green Version]
- Zhao, X.-Y.; Schneider, D.; Biroc, S.L.; Parry, R.; Alicke, B.; Toy, P.; Xuan, J.A.; Sakamoto, C.; Wada, K.; Schulze, M.; et al. Targeting Tomoregulin for Radioimmunotherapy of Prostate Cancer. Cancer Res. 2005, 65, 2846–2853. [Google Scholar] [CrossRef] [Green Version]
- Chen, X.; Corbin, J.M.; Tipton, G.J.; Yang, L.V.; Asch, A.S.; Ruiz-Echevarría, M.J. The TMEFF2 tumor suppressor modulates integrin expression, RhoA activation and migration of prostate cancer cells. Biochim. Biophys. Acta 2014, 1843, 1216–1224. [Google Scholar] [CrossRef] [Green Version]
- Dillen, K.; Annaert, W. A two decade contribution of molecular cell biology to the centennial of Alzheimer’s disease: Are we progressing toward therapy. Int. Rev. Cytol. 2006, 254, 215–300. [Google Scholar]
- Testi, S.; Peluso, S.; Fabrizi, G.M.; Antenora, A.; Russo, C.V.; Pappatà, S.; Padovani, A.; Ferrarini, M.; Filla, A. A novel PSEN1 mutation in a patient with sporadic early-onset Alzheimer’s disease and prominent cerebellar ataxia. J. Alzheimers Dis. 2014, 41, 709–714. [Google Scholar] [CrossRef]


| Cancer Class | Cancer Tissue | Number of Samples | Total Samples per Class |
|---|---|---|---|
| H | STAD | 27 | 125 |
| LUSC | 48 | ||
| LIHC | 50 | ||
| L | KIRP | 31 | 135 |
| THCA | 56 | ||
| PRAD | 48 |
| PC1 | PC2 | PC3 | |
|---|---|---|---|
| Standard deviation | 523.245 | 355.632 | 334.339 |
| Proportion of variance | 0.475 | 0.219 | 0.194 |
| Cumulative proportion | 0.475 | 0.694 | 0.888 |
| PCA | H Class | L Class | ||||||||||
|---|---|---|---|---|---|---|---|---|---|---|---|---|
| Gene | PC1 | PC2 | PC3 | % Tot Var 1 | % Capt Var 2 | Cnx 3 | n 4 | Norm Cnt 5 | Norm Cnx 6 | n | Norm Cnt | Norm Cnx |
| GRB2 | 86.397 | 0.72 | 1.49 | 41.49 | 46.70 | 753 | 54 | 0.43 | 325.3 | 36 | 0.27 | 200.8 |
| CTNNB1 | 0.01 | 41.47 | 14.02 | 11.83 | 13.31 | 444 | 81 | 0.65 | 287.7 | 62 | 0.46 | 203.9 |
| SKP1 | 3.03 | 15.78 | 7.07 | 6.27 | 7.06 | 234 | 63 | 0.50 | 117.9 | 25 | 0.19 | 43.3 |
| CSNK2A1 | 0.37 | 10.38 | 9.85 | 4.36 | 4.91 | 284 | 70 | 0.56 | 159.0 | 24 | 0.18 | 50.5 |
| PRKDC | 0.10 | 4.50 | 9.21 | 2.82 | 3.17 | 110 | 66 | 0.53 | 58.1 | 19 | 0.14 | 15.5 |
| HDAC1 | 1.97 | 4.09 | 4.17 | 2.64 | 2.98 | 257 | 39 | 0.31 | 80.2 | 22 | 0.16 | 41.9 |
| YWHAZ | 0.72 | 1.52 | 7.38 | 2.10 | 2.37 | 522 | 109 | 0.87 | 455.2 | 67 | 0.50 | 259.1 |
| YWHAB | 1.04 | 0.96 | 3.22 | 1.33 | 1.50 | 310 | 83 | 0.66 | 205.8 | 33 | 0.24 | 75.78 |
| PSMD2 | 0.14 | 2.23 | 3.78 | 1.29 | 1.45 | 132 | 53 | 0.42 | 56.0 | NA 8 | NA | NA |
| EGFR | 0.18 | 4.43 | 0.35 | 1.12 | 1.27 | 464 | 56 | 0.45 | 207.9 | 43 | 0.32 | 147.8 |
| Total | 93.95 | 86.08 | 60.54 | 75.25 | 84.72 | – | 674 | – | 1953.1 | 331 | – | 1038.5 |
| Gene | RFC Importance MeanDecreaseGini | Norm. Count. H | Norm. Count. L | Connections |
|---|---|---|---|---|
| CAD | 2.64 | 0.39 | 0.04 | 60 |
| PSMD14 | 2.47 | 0.74 | 0.20 | 63 |
| APH1A | 2.19 | 0.68 | 0.22 | 21 |
| PSMD2 | 2.12 | 0.42 | – | 132 |
| SHC1 | 2.08 | 0.71 | 0.16 | 102 |
| TMEFF2 | 2.05 | – | 0.27 | 3 |
| PSMD11 | 2.02 | 0.48 | 0.03 | 66 |
| H2AFZ | 1.98 | 0.84 | 0.27 | 7 |
| PSMB5 | 1.92 | 0.68 | 0.25 | 38 |
| NOTCH1 | 1.55 | 0.28 | 0.04 | 218 |
| Class | H | L | Error Rate |
|---|---|---|---|
| H | 115 | 10 | 0.080 |
| L | 6 | 129 | 0.044 |
Publisher’s Note: MDPI stays neutral with regard to jurisdictional claims in published maps and institutional affiliations. |
© 2022 by the authors. Licensee MDPI, Basel, Switzerland. This article is an open access article distributed under the terms and conditions of the Creative Commons Attribution (CC BY) license (https://creativecommons.org/licenses/by/4.0/).
Share and Cite
Barbosa-Silva, A.; Magalhães, M.; Da Silva, G.F.; Da Silva, F.A.B.; Carneiro, F.R.G.; Carels, N. A Data Science Approach for the Identification of Molecular Signatures of Aggressive Cancers. Cancers 2022, 14, 2325. https://0-doi-org.brum.beds.ac.uk/10.3390/cancers14092325
Barbosa-Silva A, Magalhães M, Da Silva GF, Da Silva FAB, Carneiro FRG, Carels N. A Data Science Approach for the Identification of Molecular Signatures of Aggressive Cancers. Cancers. 2022; 14(9):2325. https://0-doi-org.brum.beds.ac.uk/10.3390/cancers14092325
Chicago/Turabian StyleBarbosa-Silva, Adriano, Milena Magalhães, Gilberto Ferreira Da Silva, Fabricio Alves Barbosa Da Silva, Flávia Raquel Gonçalves Carneiro, and Nicolas Carels. 2022. "A Data Science Approach for the Identification of Molecular Signatures of Aggressive Cancers" Cancers 14, no. 9: 2325. https://0-doi-org.brum.beds.ac.uk/10.3390/cancers14092325