Online Learning of Finite and Infinite Gamma Mixture Models for COVID-19 Detection in Medical Images


1
College of Computer and Information Systems, Umm AlQura University, P.O. Box 715, Makkah 24382, Saudi Arabia
2
Department of Information Technology, College of Computers and Information Technology, Taif University, P.O. Box 11099, Taif 21944, Saudi Arabia
3
The Concordia Institute for Information Systems Engineering (CIISE), Concordia University, Montreal, QC H3G 1T7, Canada
*
Author to whom correspondence should be addressed.
Computers 2021, 10(1), 6; https://0-doi-org.brum.beds.ac.uk/10.3390/computers10010006
Submission received: 22 November 2020
/
Revised: 21 December 2020
/
Accepted: 21 December 2020
/
Published: 27 December 2020
(This article belongs to the Special Issue Artificial Intelligence for Health)
Abstract
:The accurate detection of abnormalities in medical images (like X-ray and CT scans) is a challenging problem due to images’ blurred boundary contours, different sizes, variable shapes, and uneven density. In this paper, we tackle this problem via a new effective online variational learning model for both mixtures of finite and infinite Gamma distributions. The proposed approach takes advantage of the Gamma distribution flexibility, the online learning scalability, and the variational inference efficiency. Three different batch and online learning methods based on robust texture-based feature extraction are proposed. Our work is evaluated and validated on several real challenging data sets for different kinds of pneumonia infection detection. The obtained results are very promising given that we approach the classification problem in an unsupervised manner. They also confirm the superiority of the Gamma mixture model compared to the Gaussian mixture model for medical images’ classification.
1. Introduction
Among the many existing unsupervised learning methods, mixture models have gained increasing interest and have been exploited with success especially for non-Gaussian data modeling [1,2,3,4,5]. A substantial question in mixture modeling is the choice of the component’s densities. Given that Gaussian density is not the suitable approximation for complex data modeling like for biomedical images, as stated in [6], other alternatives such as the Gamma distribution perform significantly better than the majority of parametric models [7]. The Gamma distribution is very attractive given its positive support, its compact analytical form, and its rich and flexible family of distributions, which efficiently cover long-tailed distributions and provide a good approximation to data with outliers.
In the statistical learning context, we can identify different learning approaches for making inference on parameters in mixture models; in particular, deterministic inference via maximum likelihood (ML) or maximum a posteriori (MAP) and non-deterministic inference via Bayesian inference or variational inference [8,9]. Our work here is motivated by the interesting results obtained with the finite Gamma mixture in the case of data clustering and segmentation. This model has proven to be more competitive than several earlier developed parametric models like the Gaussian model. In this work, we go a step further by extending the finite model to the infinite case by assuming a non-parametric prior on the data. Indeed, the consideration of an infinite number of components (i.e., infinite mixture models) could be a better method that we shall investigate in this paper in order to increase the robustness and efficiency of the detection process. Moreover, we propose here to develop three different unsupervised learning methods based on mixtures of the Gamma distribution. Unlike supervised classification algorithms, which are only robust when the size of the data set is very large, our goal here is to show that unsupervised algorithms may be a good alternative and more practical in the case of small data size. Moreover, our choice here is justified since the number of classes in the data set is not often defined in advance. Then, we propose an online extension of these methods to account for fast abnormality detection and prediction, which is an interesting problem given that the model complexity may vary each time new vectors are included in the data set.
X-ray images for medical diagnosis are among the simplest, least expensive, and quickest techniques today. However, it is noteworthy that performing precise and automatic biomedical big data analysis is too difficult and has proven problematic due to various factors like the presence of noise, the lack of contrast, and the non-homogeneous intensities in several modalities. In addition, the diagnosis of medical imaging can be subject to error for inexperienced radiologists, while being tedious for experienced ones [10]. On the other hand, these images present different patterns and symptoms at different stages (early, middle, advanced). For example, it is easy to find COVID-19 symptoms associated with acute respiratory distress syndrome in X-rays with the assistance of radiologists. Nevertheless, this is not easy in the early stage because COVID-19 symptoms can look similar to other viral infections like RSVpneumonia. In this context, we propose to investigate texture image-based features, which are able to provide accurate clues for many types of diseases such as pneumonia (bacterial, viral) or COVID-19 in order to take into account these important issues.
The rest of this paper is organized as follows. Section 2 presents the related works. Section 3 presents the finite mixture model and proposes three approaches to learn our model parameters. The extension to the infinite case is also developed. In addition, online learning is implemented for all approaches. Experimental results and the merits of the developed methods are validated in Section 4. Finally, Section 5 ends the manuscript and discusses future works.
2. Related Works
The artificial intelligence (AI) and machine learning areas of research focus on the study and development of algorithms that imitate human intelligence and teach computers to learn by example. With its success in different areas, especially healthcare, there is great hope that AI and computational image analysis methods can support clinical and academic studies of COVID-19 and future crises. Recently, the World Health Organization (WHO) has declared that COVID-19 is a global public health crisis and the biggest challenge we face in our time. The experience of specialists (doctors, radiologists, and physicians) with this new virus has shown that the detection of pathogenic antibodies is not entirely consistent and could lead to false detection of COVID-19, which can be considered a major threat to the world community. The automatic and fast inspection of confirmed cases of coronavirus is of great necessity due to its infectiousness. However, early detection still remains one of the main problems. To achieve this objective, it is important to develop new intelligent systems to help the screening and tracking of the spread and evolution of the disease.
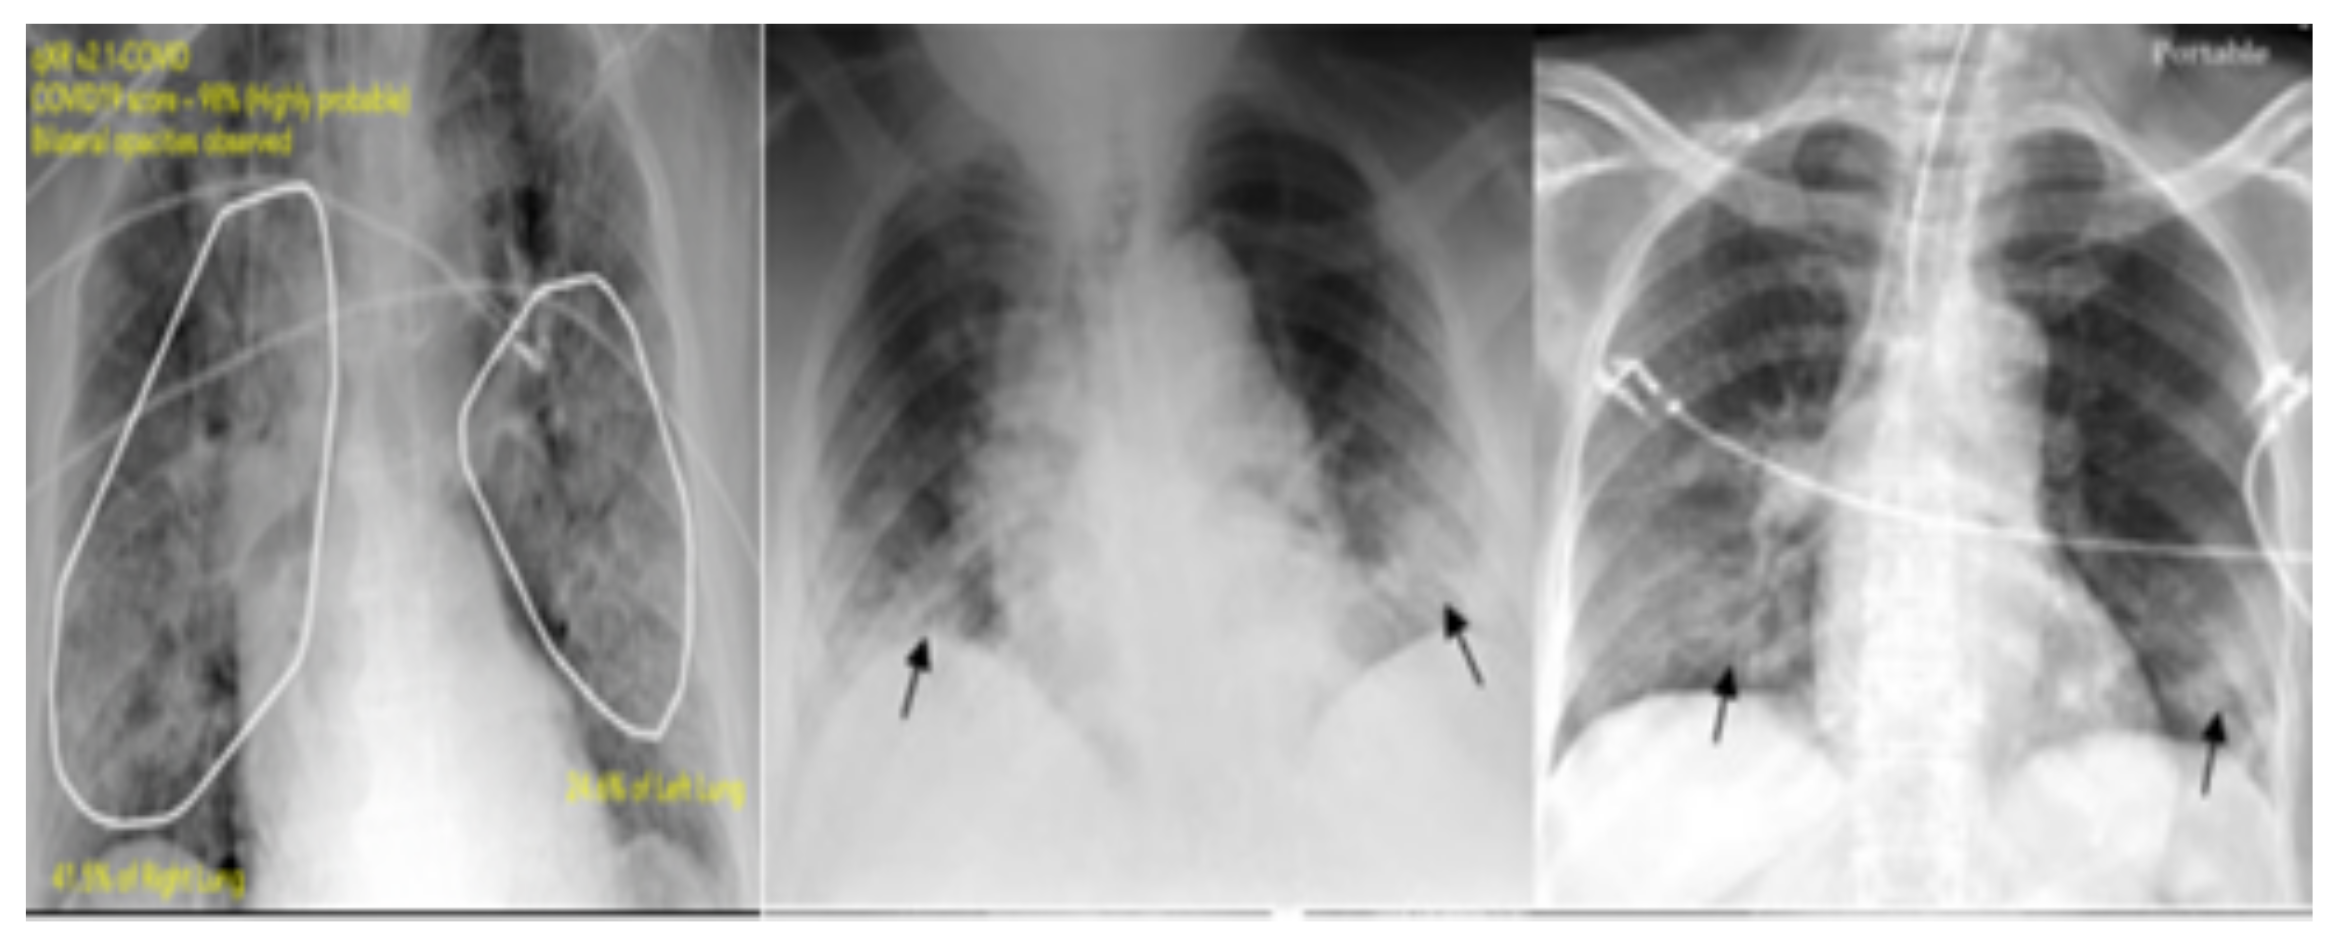
Chest X-ray and computerized tomography (CT) technologies are the best diagnostic standards for detecting pneumonia, which is the most important feature of COVID-19, which is present frequently in the asymptomatic disease stage. X-ray images are less sensitive than CT scans in detecting lung abnormalities, such as the identification of COVID-19 lung disease. Thus, it is important to exploit X-ray images for the diagnosis of the coronavirus since it is one of the simplest and quickest techniques today. Several methods have been developed to solve difficult issues related to this context such as chest X-ray image classification and abnormality detection (like COVID-19 and pneumonia). Given that manual annotation of a large number of biomedical images is impractical and time consuming, computer-aided diagnostic (CAD) systems could assist the radiologists in predicting the presence of abnormalities from these images. In this context, artificial intelligence can support the CAD tool in the diagnosis of COVID-19. In this paper, an automated machine learning CAD system is developed to recognize COVID-19 early. Our CAD system was trained and assessed via four relevant data sets. In this section, we survey some relevant research efforts related to medical image diagnosis. We will focus on those efforts related to chest X-ray images since we chose to apply our proposed model to the challenging task of pneumonia and COVID-19 infection detection. Figure 1 shows the presence of COVID-19 in different chest X-ray images.
Traditional approaches have assisted radiologists in their diagnoses, but the resulting accuracy is poor. For example, an FCM-based classifier has been applied for pneumonia infection detection [12]. This method is based on a feature extraction step through DWT and WFT. The K-nearest neighbor (k-NN) classifier was also applied in this context [13]. However, it fails to segment lung with lesions because of the lack of a reference model. The neural network (NN) and deep NN (DNN) approaches were also investigated to effectively detect some kinds of diseases from X-ray images in [14,15]. In particular, deep learning methods are used to help radiologists to analyze 2D X-ray images and to interpret early malicious lesions [16]. Some other promising works have also been proposed for multi-class lung segmentation using the fully convolutional network (FCN) approach [17] and for semantic lung segmentation using deep learning [18]. Among the other existing methods, active shape models [19] have gained interest in this context and have been successfully applied in conjunction with pixel-based statistical classification techniques. Indeed, a hybrid method has been implemented for better boundary and region of interest detection and delineation [20]. In this work, lung is segmented through a non-rigid registration method between the chest radiograph of the patient and a reference image (which is called also the atlas or anatomical model).
Furthermore, lung features extracted from chest X-ray images show that they help CAD systems immensely in detecting abnormalities and serious diseases like pneumoconiosis. Especially, the pre-trained feature extractor “ResNet50” [21] was exploited with some classifiers such as SVM and CNN for detecting and classifying lung nodule disease in chest CT images. In [22], some irregular features like the shape and size of lungs were extracted with the gray level co-occurrence matrix (GLCM) and then used within the probabilistic neural network (PNN) classifier to accurately classify chest radiographs into the normal or abnormal category. Some other visual feature-based methods such as the Haralick texture have been investigated as robust features for X-ray image classification. These features help distinguish pneumonia-infected lungs from normal ones using for instance a multiple instance learning-based method [23].
On the other hand, other modalities could be investigated like CT scans, which are able to provide more details for further image analysis. For instance, the precise segmentation of pulmonary nodules may assist radiologists in achieving more accurate diagnosis. In this context, the high-resolution computerized CT images are well exploited for pulmonary nodule assessment [24]. They are also used for early diagnosis of lung infection detection, and an interesting work was proposed [25] for segmenting pulmonary nodules in chest CT scans using threshold-based region growing and the connected component analysis method. For the case of high-resolution CT scans, it should be noted that lung segmentation and delineation are difficult tasks, especially for acute respiratory distress syndrome. This difficulty is due to the small amount of contrast at the boundary of the lung.
3. Proposed Method
In this section, we start by presenting the Gamma mixture model, then we develop three learning approaches for this statistical model, the performance of we shall evaluate later in our experiments. We propose also an extension of the finite Gamma mixture model to the infinite multi-dimensional case (i.e., an infinite number of components), which is more effective than the finite model, and then, we investigate this infinite model for medical image classification. Finally, we propose to develop an online setting for the developed learning models in order to deal with new data coming in real time. This process requires updating models incrementally to save time and maintain performance especially for large-scale data sets.
3.1. Model Specification: Finite Gamma Mixture Models
Suppose that a given D-dimensional random positive vector is independent and identically distributed and is drawn from a finite mixture of Gamma distributions; therefore, the associated likelihood function is defined as:
where:
where the total number of samples is represented by and N, the number of classes, isdesigned by M. The set of parameters of the mixture model is defined by , . Here, the mixing proportions are positive and sum to one. represents the multidimensional Gamma distribution (i.e., probability density functions).
If we suppose that the features are conditionally independent (iid), then the Gamma distribution is as follows [26]:
where is a shape parameter and is a rate parameter. denotes the Gamma function. Note that , where and , respectively. For the multidimensional case (here, the dimension), and are the related parameters.
The Gamma distribution effectively takes into account long-tailed distributions thanks to its shape flexibility. This advantage allows it to offer better data approximation. The consideration of the Gamma mixture model in this paper as compared to several other proposed mixture models in the literature is mainly motivated by its excellent results when applied to medical image analysis and in particular X-ray and MRI/fMRI data, as widely discussed in the literature [27].
3.2. Model Learning
Learning finite mixture models has been the topic of extensive scientific mathematical work in the past. Indeed, various approaches have been proposed and can be grouped into two families, namely frequentist (deterministic) and Bayesian techniques.
3.2.1. Deterministic Learning
In deterministic (called also frequentist) approaches, all the model’s parameters are considered as fixed and unknown, and inference is driven by the likelihood of the data [28]. For this reason, the well known technique named maximum likelihood (ML) is generally applied in this case, which can be formalized as the following optimization problem.
It is noted that this ML cannot be determined analytically. The estimate of ML is subject to the constraints related to the mixing weights. In particular, the famous expectation-maximization method can provide several estimates by alternating between two steps (E-step) and (M-step) until convergence based on certain criteria:
- Initialization-step: Initialize the parameters of the Gamma model with initial values.
- 2.
- E-step: Compute the posterior probability as:
- 3.
- M-step: Update the model’s parameters under this condition:
A maximum likelihood framework for the finite Gamma mixture model was developed in [26] and will be considered in our detection framework. Unfortunately, frequentist approaches (such as the maximum likelihood estimator) may have several drawbacks in terms of their dependency on the initialization step and their convergence to local maxima, and not the global ones. To deal with these limitations, we suggest developing a more efficient learning approach in the next section.
3.2.2. Bayesian Learning
Bayesian techniques have been proposed to avoid local optimality, dependency on initialization, and the over-fitting of the deterministic techniques. They are increasingly popular thanks to their flexibility in including prior information when estimating the model’s parameters. It is noted that several Bayesian approximation techniques have been adopted to date such as the Laplace estimator [29] and Markov chain Monte Carlo (MCMC) simulation techniques [30,31]. In particular, the MCMC methods simulate required estimates by running appropriate Markov chains using for instance the Gibbs sampler. In this work, a fully MCMC-based Bayesian method for learning finite and infinite Gamma mixture models is implemented and investigated for image classification and pneumonia infection detection. Our approach is essentially based on Bayes’ theorem, which motivates the combination of prior information (our belief before seeing the data) on the parameters and the information provided by the data to generate the so-called posterior information. The posterior is expressed as:
Here, it is important to introduce the vectors in order to make simple the analysis of the Bayesian inference. Indeed, each observation may be associated with a missing variable . Finally, the fully Bayesian algorithm based on MCMC simulation is summarized as proposed in [32]:
- Initialization
- Step t: For t=1,…
- (a)
- Generate
- (b)
- Generate from
We note that the Bayesian inference approach is very computationally costly, especially when handling several medical images (a huge amount of pixels). On the other hand, despite the efficiency of the MCMC-based algorithm, which is used here to sample from the posterior probability distributions, the sampling process is sometimes too difficult and impractical due to its stochastic nature.
3.2.3. Variational Learning
The third developed learning algorithm is called variational Bayesian inference, which is an efficient alternative to the previous Bayesian learning method [8,33,34]. In this work, we tackle the case of a multi-dimensional problem for variational Bayesian learning to classify biomedical images. Indeed, we take into account the advantage of approximating the posterior distribution through minimizing the Kullback–Leibler (KL) divergence between two distributions: the approximate and the exact posterior. This is can be explained as follows. If we assume that is an approximation of the true posterior distribution of the component parameters , then we compute the dissimilarity between them using the KL divergence as follows:
where:
where:
where . It can be clearly seen that the lower bound is maximized when the KL divergence reaches zero. In [27], the authors proposed a variational learning framework for a mixture of univariate Gamma distributions. The generalization of the learning approach to our mixture model is straightforward since the multi-dimensional Gamma that we are considering is a product of univariate ones. In our case, we followed the variational learning approach proposed in [27], which we shall investigate also in our experimental part.
3.3. Infinite Gamma Mixture Model
In finite mixture models, determining the optimal number of clusters (components) can be seen as one of the most difficult tasks, and solving it can help avoid both underfitting and overfitting issues. Thus, the resolution of this problem can be achieved by extending the finite models to infinite mixtures. In this work, we implement also a Bayesian framework for the infinite Gamma mixture model. Therefore, our method extends the work on finite Gamma mixtures to the infinite case. Indeed, the approach we adopt here is different and is nonparametric since we will allow the number of components to increase to infinity via a particular choice of priors [35,36]. In the finite mixture model presented in the previous section, each D-dimensional random vector is supposed to be drawn from one of K unknown Gamma distributions with parameters . Since the number K is not known, we can allow it to grow with the data. Until now, we have assumed K to be a fixed value. Here, we get over this obstacle by considering that [35]. Thus, is drawn from a mixture of Gamma distributions with infinite components as:
Our implementation of the proposed infinite models for Gamma mixtures is inspired by the steps used in [37] where a purely Bayesian approach was considered and in [3] where a variational inference was performed. Finally, it should be noted that our infinite mixture models implicitly take into account the notion of online learning.
3.4. Online Learning Algorithm
In what follows, we propose an online extension for unsupervised classification for each learning method to deal with new data coming in online mode (i.e., in real time). This process requires updating models incrementally to save time and maintain performance especially for large-scale streaming data sets. In this case, the statistical model’s parameters must be updated accordingly without degrading its efficiency and flexibility. In our case, we assume the database is described with M multivariate Gamma distributions with parameters . At time , we have a new image coming and added to the data set; therefore, the parameters of the different mixture model must be updated. For example, for the case of maximum likelihood learning, we adopted the stochastic gradient ascent method [38] in order to update the model’s parameters. The related equation is given as follows:
4. Experimental Results
4.1. Feature Extraction Step
In this work, we chose texture image-based features that are able to provide accurate clues for many types of diseases such as pneumonia (bacterial, viral) or COVID-19. Indeed, feature extraction methods aim to identify the most relevant information (features) that is representative of the various classes in the image. It is a form of dimensionality reduction, which is essential to pathology detection by reducing ambiguity and improving the accuracy of detection. Sometimes, medical images are not easy to interpret; subsequently, extracting important features will help to provide radiologists with a clear description of both normal and pathological areas in the image. One of the most important features used for biomedical image diagnosis is textures. They represent visual patterns of interest, capture recurring patterns, and provide significant information about the spatial variation in pixel intensities. A texture may be smooth, fine, coarse, or grained according to the tone and structure.
When we use statistical methods to extract texture, the resulting features are called statistical features. They may be based on first-order, second-order, or higher order statistics of the gray level value. Statistical methods are extensively used in medical context and particularly in X-ray image analysis. For some usual applications, notably image classification or data clustering, the use of only gray level value cannot lead to the desired results; however, the use of texture features may provide more effective results [41]. In this work, we focus on investigating a specific texture feature called the “Haralick feature”, which has been applied successfully in several applications [42] and has been shown to be able to give interesting results in terms of X-ray images’ discrimination. The Haralick descriptor is related to second-order statistics. It is mainly estimated by the well known GLCM. The latter is a square matrix of dimension N (number of gray levels in the image) that describes patterns of gray level repetition. It provides a co-occurrence matrix of the joint probability density of the gray levels of two pixels. More specifically, it counts the co-occurrence of neighboring pixels in the image. Indeed, the value of each pixel in the image and the value of its neighbors are counted to determine the new value of its corresponding element in the GLCM matrix. GLCM is also built by obtaining information about the distance and the orientation. Therefore, all texture features are defined on the basis of the GLCM’s elements. Many texture features can be directly computed from the GLCM matrix. For instance, it is possible to compute the following features [43]: contrast (large differences between neighboring pixels), correlation, energy, entropy, difference variance, difference entropy, normalized inverse difference, and the information measure of correlation. Thus, in our work, we favor this descriptor to discriminate and classify abnormalities.
4.2. Data Sets
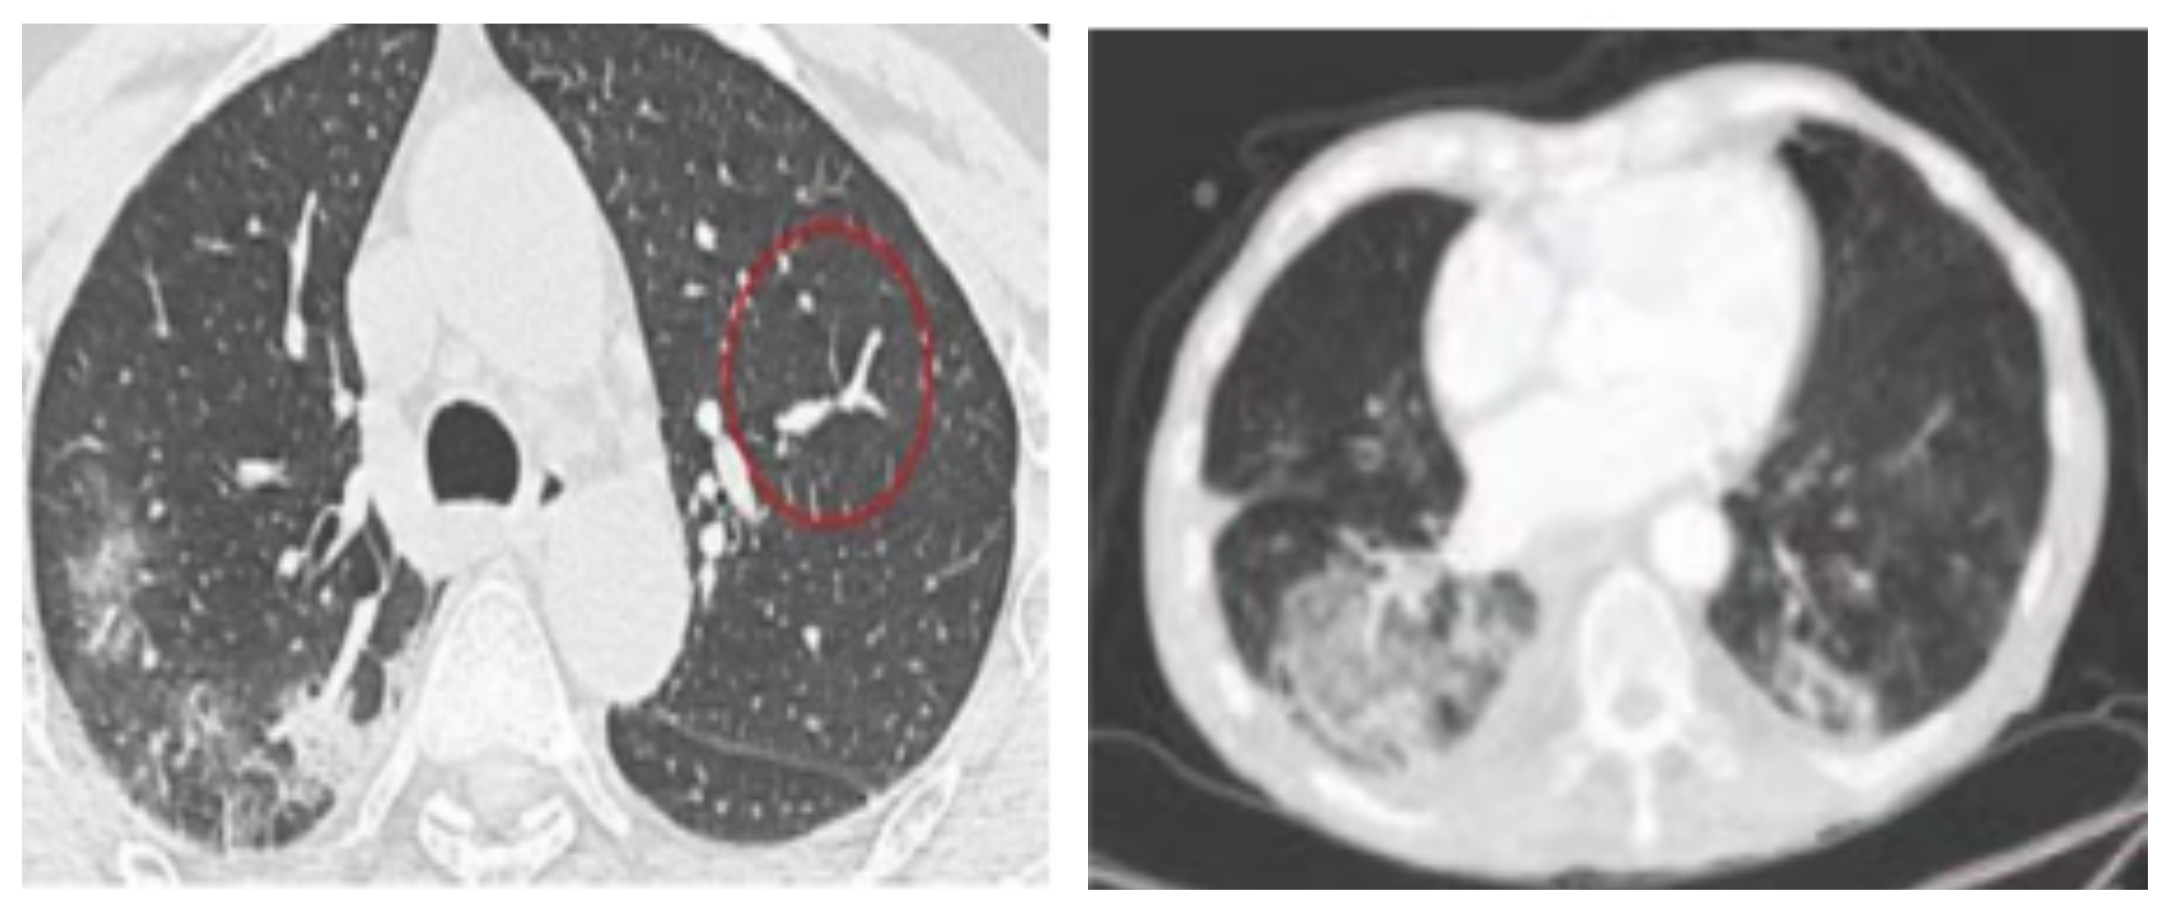
We conducted our experiments on several relevant data sets where three were related to chest X-ray images and the fourth was about CT scans. These data sets are publicly available and shared by well recognized institutions such as the University of Montreal and were obtained from the GitHub repository shared by Dr. Joseph Cohen [44]. The details regarding these data sets are depicted in Table 1. The first CXR-based data set (https://github.com/ieee8023/COVID-chestxray-dataset) [44] contains X-ray images, and it is provided with metadata for every image such as the patient ID, the location, and other annotations. The second data set is called ”Augmented COVID-19”, collected from two data sets available online, Kaggle (https://www.kaggle.com/paultimothymooney/chest-xray-pneumonia) and chest X-ray (CXR), increasing the COVID-19 X-ray images from 48 to 912 images through some image transformations such as rotation, flipping, translation, and scaling. The third data set named “Kaggle” contains two categories (pneumonia/normal) for lung images, and it is used to detect pneumonia. An illustrative sample from this data set is given in Figure 2. We conducted also our experiments on the CT scan data set [45], which contains in total 470 scans where 275 are positive cases for COVID-19 and 195 are negative cases and are labeled as non-COVID-19. The data set was verified by senior radiologists who have performed several diagnoses on many COVID-19 patients. Our goal here is to analyze complex CT scans in order to evaluate the proposed framework. Figure 3a illustrates an example of a CT scan image for a patient with COVID-19.
4.3. Results Analysis
The implemented statistical models were deployed to distinguish between the normal and COVID-19 patients using chest X-ray and CT images. We performed different image processing steps. After processing the data, we extracted a list of statistical parameters. The majority of studies have shown that the primary organ that is affected by this disease is lungs. In our analysis, we focused on extracting the lungs’ area using image thresholding and segmentation processing, and we identified and isolated left and right lungs from chest X-ray images. In order to remove noise from the image, we applied the Gaussian filter. We also applied some filters to extract additional features such as the Gabor filter, GLCM, image heat map features [46], lung abnormality, lung pixel intensity, and the lung affected region based on the heat map.
For performance investigation, we ran the three learning approaches for the finite Gamma mixture model, and we evaluated their performance in terms of overall accuracy (Acc), detection rate (DR), and false positive rate (FPR). Table 2, Table 3, Table 4 and Table 5 show the results for the tested data sets when applying different learning approaches, namely the Gamma mixture model with maximum likelihood (MM-ML), with Bayesian inference (MM-B), and with variational Bayes (MM-V). It is noteworthy that apart from the batch learning approaches, we also included their online counterparts to investigate the ability of the model to learn as new data arrive. The online extension of the ML-, Bayesian-, and variational-based approaches was based on the methodologies that we previously proposed in [40,47,48], respectively.
Regarding the overall Acc for the four data sets (CXR-COVID, CXR-pneumonia, CXR-augmented-COVID, and CT COVID), both the Bayesian and variational learning approaches for the finite Gamma mixture model provide better results than the Gaussian mixture. Indeed, for the CXR-COVID data set, the average accuracy to classify CXR images into COVID-19 or normal patients with Gamma mixture models using different types of learning (i.e., online, Bayesian, and variational) is about 87%, which is better than the other obtained results using Gaussian mixtures (only 83%). For CXR-pneumonia, the average accuracy is 92% for Bayesian and variational learning of Gamma mixtures (MM-B and MM-V), which outperform the rest of the methods notably Bayesian learning of Gaussian mixtures (the Acc of GMM-B is 88%). Thus, according to these results, we can see clearly that the proposed Gamma mixture model provides very encouraging results using both the batch and online learning approaches, as compared for instance to Gaussian-based models, taking into account the difficulty of the unsupervised classification. Likewise, we came to the same conclusions for the other data sets, and we noticed that the average precision increased as the data set size increased. This can be viewed for the CXR-augmented-COVID and CXR-pneumonia data sets, which contain more images than the CXR-COVID and CT COVID data sets. For instance, for the case of the CXR-augmented-COVID data set, our model MM-B is the best with Acc = 91.95% compared to, for example, 85.13% for GMM-ML and 86.77% for GMM-B. Here, the results show also that both batch and online learning models can give approximately comparable performance. By contrast, the Gaussian-based classification obtained the worst performance.
For the case of CT scans (Figure 3), according to Table 5, it is clear that both MM-B and MM-V have superior results compared to other mixtures with an average Acc equal to 82.88%. This superiority may be justified by the flexibility given by the shape parameter of the Gamma mixture. It should be noted here that the lung segmentation step is difficult. Indeed, the presence of acute respiratory distress syndrome and the small amount of contrast at the boundary of lungs can induce errors when segmenting this region of interest. In order to improve this task, we plan to apply a more attractive segmentation method as in [49]. It is noted also that the number of images for this data set is too small. For all these reasons, the obtained results are lower than the previous ones.
In this work, it is important to confirm the merits of the variational formalism, which is able to give very encouraging results with less computational complexity. We note also the merit and efficiency of the online learning extension, which still provides very high results (for all data sets). These findings encourage the choice for the online process, which has the advantage of being used especially for online prediction and detection of several infection forms (such as COVID-19). The online setting will be also very promising to improve the models when new data are collected. In addition, it allows the model to be updated incrementally, saving time and maintaining performance. Therefore, such a choice may help in rapidly detecting COVID-19 infection in images.
We notice also that the infinite extension provides good performance. The results for the finite and infinite mixture are very similar, which can be explained by the fact that we are not really dealing with large data sets. These results are considered very encouraging given that we approach the classification problem in an unsupervised manner. In fact, the flexibility of the Gamma mixture model and the robustness of texture-based features lead to more stable results. In this case, they confirmed that they are able to differentiate between images according to texture characteristics. To improve these results, perhaps more textural features have to be considered within the proposed statistical framework. Please note that several comparative studies have been discussed in the literature (see, for instance, ref. [50]) showing that textures are one of most important well-studied descriptors especially for medical applications [23]. In this work, we did not develop different feature-based techniques that have been published in the state-of-the-art to model textures, which is clearly beyond the scope of this article. Instead, we focused on a significant texture feature named the Haralick descriptor, which has been applied with success in the past.
5. Conclusions
The automatic and precise detection of lung infections such as COVID-19 in chest X-ray (CXR) and CT scan images is a challenging problem and prone to serious errors caused by the presence of artifacts and noise. Indeed, in CXR images, this new infection is shown with blurred boundary contours, different sizes, variable shapes, and uneven density. Early diagnosis can decrease the mortality rate, which is recently in the millions. In this paper, an automated machine learning computer-aided diagnostic (CAD) system is developed to recognize COVID-19 early. In particular, our contribution is mainly based on exploiting both finite and infinite Gamma mixture models for the analysis and classification of CXR and CT scan images. The resulting CAD system was trained and assessed via four relevant data sets related to COVID-19 and pneumonia diseases. In this work, we show that Gamma-based mixture models can be a suitable solution for medical image modeling and classification. The framework provided promising results in both batch and online settings. The online inference results are particularly interesting since they not only ensure the real-time improvement of the learning process by handling data as they arrive, but also open the door to the analysis of large-scale databases. Moreover, infinite models have the advantage of being more general and extensible enough to be applied to large-scale data exhibiting a variety of infections and anomalies. The infinite model would also be favored because it involves a smaller number of parameters to be evaluated than the finite models. Future works could be devoted to extend the proposed framework via nonparametric Bayesian approaches. Other promising future works include the integration of the feature selection mechanism into the statistical model to improve the generalization capabilities and also the integration of generalized Gamma distributions, which may afford more flexibility.
Author Contributions
Conceptualization, H.S., S.B. and N.B.; data curation, S.B.; formal analysis, H.S., S.B. and N.B.; funding acquisition, H.S. and S.B.; investigation, H.S., S.B. and N.B.; methodology, H.S., S.B. and N.B.; project administration, H.S.; resources, H.S.; software, H.S., S.B. and N.B.; validation, H.S., S.B. and N.B.; writing—original draft, H.S. and S.B.; writing—review & editing, N.B. All authors have read and agreed to the published version of the manuscript.
Funding
This work is funded by the Research and Development Grants Program for the National Research Institutions and Centers (GRANTS), the Target Research Program, the Infectious Diseases Research Grant Program, and King Abdulaziz City for Science and Technology (KACST), Kingdom of Saudi Arabia, Grant Number (5-20-01-007-0010).
Data Availability Statement
Acknowledgments
This work was funded by the Research and Development Grants Program for the National Research Institutions and Centers (GRANTS), the Target Research Program, the Infectious Diseases Research Grant Program, and King Abdulaziz City for Science and Technology (KACST), Kingdom of Saudi Arabia, Grant Number (5-20-01-007-0010).
Conflicts of Interest
The authors declare no conflict of interest.
References
- Fan, W.; Sallay, H.; Bouguila, N. Online Learning of Hierarchical Pitman-Yor Process Mixture of Generalized Dirichlet Distributions With Feature Selection. IEEE Trans. Neural Netw. Learn. Syst. 2017, 28, 2048–2061. [Google Scholar] [CrossRef]
- Bourouis, S.; Zaguia, A.; Bouguila, N.; Alroobaea, R. Deriving Probabilistic SVM Kernels From Flexible Statistical Mixture Models and its Application to Retinal Images Classification. IEEE Access 2019, 7, 1107–1117. [Google Scholar] [CrossRef]
- Fan, W.; Bouguila, N. Modeling and Clustering Positive Vectors via Nonparametric Mixture Models of Liouville Distributions. IEEE Trans. Neural Netw. Learn. Syst. 2020, 31, 3193–3203. [Google Scholar] [CrossRef]
- Albuquerque, V.H.C.D.; Gupta, D.; Falco, I.D.; Sannino, G.; Bouguila, N. Special issue on Bio-inspired optimization techniques for Biomedical Data Analysis: Methods and applications. Appl. Soft Comput. 2020, 95, 106672. [Google Scholar] [CrossRef]
- Alroobaea, R.; Rubaiee, S.; Bourouis, S.; Bouguila, N.; Alsufyani, A. Bayesian inference framework for bounded generalized Gaussian-based mixture model and its application to biomedical images classification. Int. J. Imaging Syst. Technol. 2020, 30, 18–30. [Google Scholar] [CrossRef]
- Bourouis, S.; Zaguia, A.; Bouguila, N. Hybrid Statistical Framework for Diabetic Retinopathy Detection. In Proceedings of the Image Analysis and Recognition—15th International Conference, ICIAR 2018, Póvoa de Varzim, Portugal, 27–29 June 2018; pp. 687–694. [Google Scholar]
- Beckmann, C.; Woolrich, M.; Smith, S. Gaussian/Gamma mixture modeling of ICA/GLM spatial maps. Neuroimage 2003, 19. [Google Scholar] [CrossRef]
- Fan, W.; Bouguila, N.; Bourouis, S.; Laalaoui, Y. Entropy-based variational Bayes learning framework for data clustering. IET Image Process. 2018, 12, 1762–1772. [Google Scholar] [CrossRef]
- Najar, F.; Bourouis, S.; Zaguia, A.; Bouguila, N.; Belghith, S. Unsupervised Human Action Categorization Using a Riemannian Averaged Fixed-Point Learning of Multivariate GGMM. In Proceedings of the Image Analysis and Recognition—15th International Conference, ICIAR 2018, Póvoa de Varzim, Portugal, 27–29 June 2018; pp. 408–415. [Google Scholar]
- Sannino, G.; Bouguila, N.; Pietro, G.D.; Celesti, A. Artificial Intelligence for Mobile Health Data Analysis and Processing. Mob. Inf. Syst. 2019, 2019, 2673463:1–2673463:2. [Google Scholar] [CrossRef] [Green Version]
- Jacobi, A.; Chung, M.; Bernheim, A.; Eber, C. Portable chest X-ray in coronavirus disease-19 (COVID-19): A pictorial review. Clin. Imaging 2020, 64, 35–42. [Google Scholar] [CrossRef]
- Parveen, N.; Sathik, M.M. Detection of pneumonia in chest X-ray images. J. Ray Sci. Technol. 2011, 19, 423–428. [Google Scholar] [CrossRef]
- Van Ginneken, B.; Stegmann, M.B.; Loog, M. Segmentation of anatomical structures in chest radiographs using supervised methods: A comparative study on a public database. Med. Image Anal. 2006, 10, 19–40. [Google Scholar] [CrossRef] [PubMed] [Green Version]
- Greenspan, H.; van Ginneken, B.; Summers, R.M. Guest Editorial Deep Learning in Medical Imaging: Overview and Future Promise of an Exciting New Technique. IEEE Trans. Med. Imaging 2016, 35, 1153–1159. [Google Scholar] [CrossRef]
- Litjens, G.; Kooi, T.; Bejnordi, B.E.; Setio, A.A.A.; Ciompi, F.; Ghafoorian, M.; van der Laak, J.A.W.M.; van Ginneken, B.; Sánchez, C.I. A survey on deep learning in medical image analysis. Med. Image Anal. 2017, 42, 60–88. [Google Scholar] [CrossRef] [PubMed] [Green Version]
- Gordienko, Y.; Gang, P.; Hui, J.; Zeng, W.; Kochura, Y.; Alienin, O.; Rokovyi, O.; Stirenko, S. Deep learning with lung segmentation and bone shadow exclusion techniques for chest X-ray analysis of lung cancer. In Proceedings of the International Conference on Computer Science, Engineering and Education Applications, San Francisco, CA, USA, 23–25 October 2018; pp. 638–647. [Google Scholar]
- Novikov, A.A.; Lenis, D.; Major, E.A. Fully convolutional architectures for multiclass segmentation in chest radiographs. IEEE Trans. Med. Imaging 2018, 37, 1865–1876. [Google Scholar] [CrossRef] [Green Version]
- Zhao, B.; Feng, J.; Wu, X.; Yan, S. A survey on deep learning-based fine-grained object classification and semantic segmentation. Int. J. Autom. Comput. 2017, 14, 119–135. [Google Scholar] [CrossRef]
- Xu, T.; Mandal, M.K.; Long, R.; Cheng, I.; Basu, A. An edge-region force guided active shape approach for automatic lung field detection in chest radiographs. Comput. Med. Imaging Graph. 2012, 36, 452–463. [Google Scholar] [CrossRef]
- Candemir, S.; Jaeger, S.; Palaniappan, K.; Musco, J.P.; Singh, R.K.; Xue, Z.; Karargyris, A.; Antani, S.; Thoma, G.; McDonald, C.J. Lung Segmentation in Chest Radiographs Using Anatomical Atlases With Nonrigid Registration. IEEE Trans. Med. Imaging 2014, 33, 577–590. [Google Scholar] [CrossRef]
- Da Nóbrega, R.V.M.; Filho, P.P.R.; Rodrigues, M.B.; da Silva, S.P.P.; Júnior, C.M.J.M.D.; de Albuquerque, V.H.C. Lung nodule malignancy classification in chest computed tomography images using transfer learning and convolutional neural networks. Neural Comput. Appl. 2020, 32, 11065–11082. [Google Scholar] [CrossRef]
- Zotin, A.; Hamad, Y.; Simonov, K.; Kurako, M. Lung boundary detection for chest X-ray images classification based on GLCM and probabilistic neural networks. In Proceedings of the 23rd International Conference KES Knowledge-Based and Intelligent Information & Engineering Systems, Budapest, Hungary, 4–6 September 2019; pp. 1439–1448. [Google Scholar]
- Melendez, J.; van Ginneken, B.; Maduskar, P.; Philipsen, R.H.H.M.; Reither, K.; Breuninger, M.; Adetifa, I.M.O.; Maane, R.; Ayles, H.; Sánchez, C.I. A Novel Multiple-Instance Learning-Based Approach to Computer-Aided Detection of Tuberculosis on Chest X-Rays. IEEE Trans. Med. Imaging 2015, 34, 179–192. [Google Scholar] [CrossRef]
- Liu, S.; Liu, H.; Li, P.; Jiang, L. Application of high-resolution CT images information in complicated infection of lung tumors. J. Infect. Public Health 2019, accepted. [Google Scholar] [CrossRef]
- Lassen, B.; Jacobs, C.; Kuhnigk, J.; Van Ginneken, B.; Van Rikxoort, E. Robust semi-automatic segmentation of pulmonary subsolid nodules in chest computed tomography scans. Phys. Med. Biol. 2015, 60, 1307. [Google Scholar] [CrossRef] [PubMed]
- Bouguila, N.; Almakadmeh, K.; Boutemedjet, S. A finite mixture model for simultaneous high-dimensional clustering, localized feature selection and outlier rejection. Expert Syst. Appl. 2012, 39, 6641–6656. [Google Scholar] [CrossRef]
- Llera, A.; Vidaurre, D.; Pruim, R.H.R.; Beckmann, C.F. Variational Mixture Models with Gamma or Inverse-Gamma Components. arXiv 2016, arXiv:1607.07573. [Google Scholar]
- Najar, F.; Bourouis, S.; Bouguila, N.; Belghith, S. Unsupervised learning of finite full covariance multivariate generalized Gaussian mixture models for human activity recognition. Multimed. Tools Appl. 2019, 78, 18669–18691. [Google Scholar] [CrossRef]
- Husmeier, D. The Bayesian Evidence Scheme for Regularizing Probability-Density Estimating Neural Networks. Neural Comput. 2000, 12, 2685–2717. [Google Scholar] [CrossRef]
- Husmeier, D.; Penny, W.D.; Roberts, S.J. An empirical evaluation of Bayesian sampling with hybrid Monte Carlo for training neural network classifiers. Neural Netw. 1999, 12, 677–705. [Google Scholar] [CrossRef]
- Bourouis, S.; Al-Osaimi, F.R.; Bouguila, N.; Sallay, H.; Aldosari, F.; Al Mashrgy, M. Bayesian inference by reversible jump MCMC for clustering based on finite generalized inverted Dirichlet mixtures. Soft Comput. 2018, 23, 5799–5813. [Google Scholar] [CrossRef]
- Congdon, P. Applied Bayesian Modelling; John Wiley and Sons: Hoboken, NJ, USA, 2003. [Google Scholar]
- Tan, S.L.; Nott, D.J. Variational approximation for mixtures of linear mixed models. J. Comput. Graph. Stat. 2014, 23, 564–585. [Google Scholar] [CrossRef] [Green Version]
- Fan, W.; Sallay, H.; Bouguila, N.; Bourouis, S. Variational learning of hierarchical infinite generalized Dirichlet mixture models and applications. Soft Comput. 2016, 20, 979–990. [Google Scholar] [CrossRef]
- Elguebaly, T.; Bouguila, N. Generalized Gaussian mixture models as a nonparametric Bayesian approach for clustering using class-specific visual features. J. Vis. Commun. Image Represent. 2012, 23, 1199–1212. [Google Scholar] [CrossRef]
- Bourouis, S.; Laalaoui, Y.; Bouguila, N. Bayesian frameworks for traffic scenes monitoring via view-based 3D cars models recognition. Multimed. Tools Appl. 2019, 78, 18813–18833. [Google Scholar] [CrossRef]
- Bouguila, N.; Ziou, D. A Dirichlet process mixture of generalized Dirichlet distributions for proportional data modeling. IEEE Trans. Neural Netw. 2010, 21, 107–122. [Google Scholar] [CrossRef] [PubMed]
- Yao, J.F. On Recursive Estimation in Incomplete Data Models. Statistics 2000, 34, 27–51. [Google Scholar] [CrossRef]
- Sato, M. Online Model Selection Based on the Variational Bayes. Neural Comput. 2001, 13, 1649–1681. [Google Scholar] [CrossRef]
- Fan, W.; Bouguila, N. Online variational finite Dirichlet mixture model and its applications. In Proceedings of the 11th International Conference on Information Science, Signal Processing and their Applications—ISSPA 2012, Montreal, QC, Canada, 2–5 July 2012; pp. 448–453. [Google Scholar]
- Xie, J.; Jiang, Y.; Tsui, H. Segmentation of kidney from ultrasound images based on texture and shape priors. IEEE Trans. Med. Imaging 2005, 24, 45–57. [Google Scholar]
- Haralick, R.M.; Shanmugam, K.S.; Dinstein, I. Textural Features for Image Classification. IEEE Trans. Syst. Man Cybern. 1973, 3, 610–621. [Google Scholar] [CrossRef] [Green Version]
- Pourghassem, H.; Ghassemian, H. Content-based medical image classification using a new hierarchical merging scheme. Comput. Med. Imaging Graph. 2008, 32, 651–661. [Google Scholar] [CrossRef]
- Cohen, J.P.; Morrison, P.; Dao, L. COVID-19 image data collection. arXiv 2020, arXiv:2003.11597. [Google Scholar]
- Zhao, J.; Zhang, Y.; He, X.; Xie, P. COVID-CT Dataset: A CT scan data set about COVID-19. arXiv 2020, arXiv:2003.13865. [Google Scholar]
- Sabhadiya, P.; Desai, V.; Sorathiya, N. COVID-CAM: A Method of Detection COVID using Active Map Classification, CNN and Deep Learning. Int. J. Comput. Appl. 2020, 176, 7–13. [Google Scholar] [CrossRef]
- Bouguila, N.; Ziou, D. Online clustering via finite mixtures of Dirichlet and minimum message length. Eng. Appl. Artif. Intell. 2006, 19, 371–379. [Google Scholar] [CrossRef]
- Fan, W.; Bouguila, N. Online Learning of a Dirichlet Process Mixture of Beta-Liouville Distributions Via Variational Inference. IEEE Trans. Neural Netw. Learn. Syst. 2013, 24, 1850–1862. [Google Scholar] [CrossRef] [PubMed]
- Bourouis, S.; Channoufi, I.; Alroobaea, R.; Rubaiee, S.; Andejany, M.; Bouguila, N. Color object segmentation and tracking using flexible statistical model and level-set. Multimed. Tools Appl. 2020. [Google Scholar] [CrossRef]
- Smith, G.; Burns, I. Measuring texture classification algorithms. Pattern Recognit. Lett. 1997, 18, 1495–1501. [Google Scholar] [CrossRef]
Figure 1.
Chest X-ray images showing different patients with varying degrees of COVID-19 pneumonia [11].
Figure 1.
Chest X-ray images showing different patients with varying degrees of COVID-19 pneumonia [11].

Figure 2.
Example chest X-ray images of four different cases. First row: normal (healthy) patient. Second row: images with bacterial pneumonia. Third row: images with viral pneumonia. Fourth row: images with COVID-19. These images were collected form the CXR-COVID-19 data set [44] and the Kaggle data set.
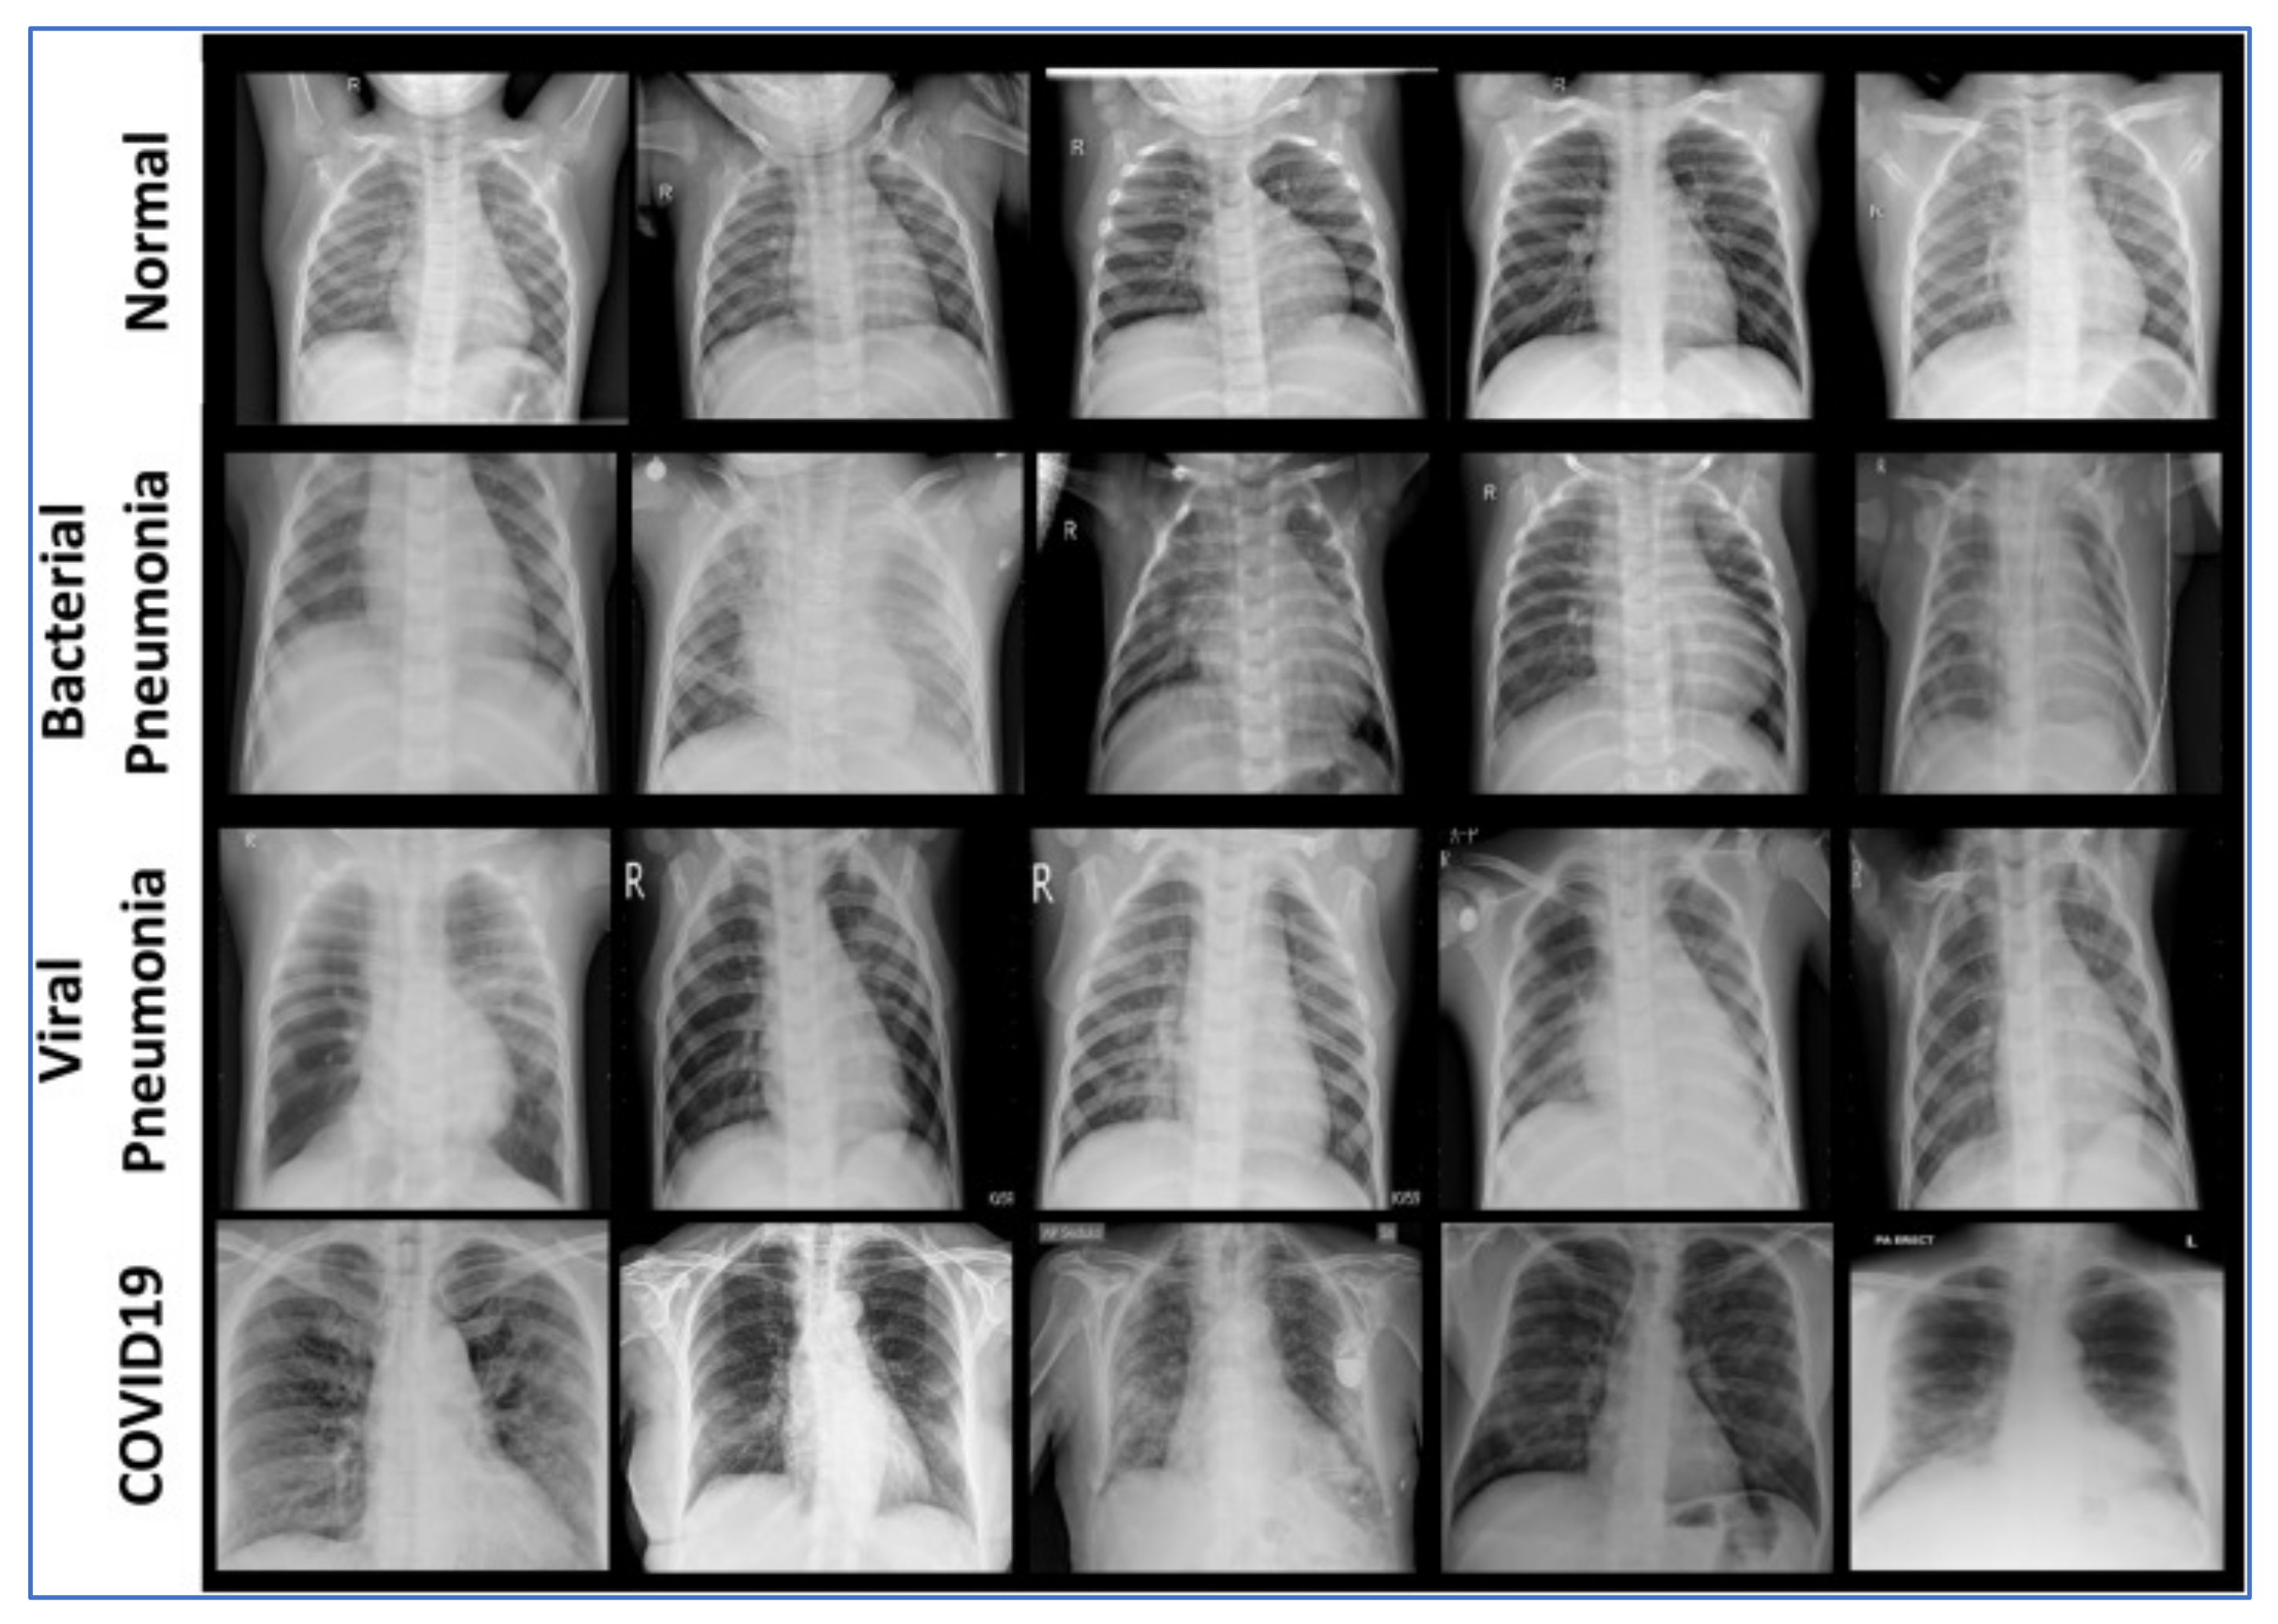
Figure 3.
Example of CT scan images. (left) COVID-19 patient and (right) non-COVID case.


Table 1.
Data sets. CXR, chest X-ray.
| Data/Class | Train | Validation | Test | Total |
|---|---|---|---|---|
| CXR data statistics. | ||||
| Non-COVID-19 | 70 | 20 | 18 | 108 |
| COVID-19 | 328 | 80 | 26 | 434 |
| Total | 398 | 100 | 44 | 542 |
| Augmented data statistics. | ||||
| Non-COVID-19 | 512 | 100 | 300 | 912 |
| COVID-19 | 512 | 100 | 300 | 912 |
| Kaggle pneumonia data statistics. | ||||
| Normal | 1341 | 8 | 234 | 1583 |
| Pneumonia | 3875 | 8 | 390 | 4273 |
| Total | 5216 | 16 | 624 | 5856 |
| CT scan data statistics. | ||||
| Non-COVID | 146 | 15 | 34 | 195 |
| COVID-19 | 183 | 57 | 35 | 275 |
| Total | 329 | 72 | 69 | 470 |
Table 2.
Overall accuracy for the CXR-COVID data set. DR, detection rate; B, Bayesian inference; V, variational.
Table 2.
Overall accuracy for the CXR-COVID data set. DR, detection rate; B, Bayesian inference; V, variational.
| Approach/Metrics | Acc (%) | DR (%) | FPR (%) |
|---|---|---|---|
| GMM-ML | 82.11 | 81.02 | 0.18 |
| GMM-B | 83.44 | 82.14 | 0.17 |
| GMM-V | 83.40 | 82.09 | 0.17 |
| MM-ML | 85.22 | 83.76 | 0.16 |
| MM-B | 87.45 | 85.52 | 0.14 |
| MM-V | 87.21 | 85.43 | 0.14 |
| OnMM-ML | 85.11 | 83.51 | 0.16 |
| OnMM-B | 87.33 | 85.02 | 0.14 |
| OnMM-V | 87.03 | 85.09 | 0.14 |
| inGMM-B | 83.42 | 82.11 | 0.17 |
| inMM-B | 87.34 | 85.01 | 0.14 |
| inMM-V | 87.01 | 85.06 | 0.14 |
Table 3.
Overall accuracy for the CXR-pneumonia data set.
| Approach/Metrics | Acc (%) | DR (%) | FPR (%) |
|---|---|---|---|
| GMM-ML | 87.66 | 85.80 | 0.13 |
| GMM-B | 88.90 | 86.98 | 0.11 |
| GMM-V | 88.12 | 86.41 | 0.12 |
| MM-ML | 90.54 | 88.54 | 0.10 |
| MM-B | 92.67 | 90.04 | 0.08 |
| MM-V | 92.61 | 90.01 | 0.08 |
| OnMM-ML | 90.03 | 88.12 | 0.10 |
| OnMM-B | 92.12 | 89.88 | 0.08 |
| OnMM-V | 92.06 | 89.81 | 0.10 |
| inGMM-B | 88.91 | 86.96 | 0.11 |
| inMM-B | 92.69 | 90.06 | 0.08 |
| inMM-V | 92.62 | 90.03 | 0.08 |
Table 4.
Overall accuracy for the CXR-augmented-COVID data set.
| Approach/Metrics | Acc (%) | DR (%) | FPR (%) |
|---|---|---|---|
| GMM-ML | 85.13 | 83.99 | 0.14 |
| GMM-B | 86.77 | 84.08 | 0.13 |
| GMM-V | 86.84 | 84.93 | 0.13 |
| MM-ML | 90.24 | 89.14 | 0.10 |
| MM-B | 91.95 | 93.44 | 0.09 |
| MM-V | 91.66 | 89.91 | 0.08 |
| OnMM-ML | 90.08 | 88.33 | 0.09 |
| OnMM-B | 90.32 | 89.17 | 0.09 |
| OnMM-V | 90.24 | 89.20 | 0.09 |
| inGMM-B | 86.78 | 84.09 | 0.13 |
| inMM-B | 90.31 | 89.14 | 0.09 |
| inMM-V | 90.21 | 89.20 | 0.09 |
Table 5.
Overall accuracy for the CT COVID data set.
| Approach/Metrics | Acc (%) | DR (%) | FPR (%) |
|---|---|---|---|
| GMM-ML | 78.45 | 76.35 | 0.22 |
| GMM-B | 79.11 | 77.70 | 0.20 |
| GMM-V | 79.32 | 76.74 | 0.20 |
| MM-ML | 81.05 | 80.71 | 0.20 |
| MM-B | 82.88 | 81.13 | 0.20 |
| MM-V | 82.77 | 81.33 | 0.18 |
| OnMM-ML | 80.66 | 88.55 | 0.20 |
| OnMM-B | 81.11 | 79.21 | 0.19 |
| OnMM-V | 81.06 | 79.53 | 0.19 |
| inGMM-B | 79.10 | 77.67 | 0.20 |
| inMM-B | 81.10 | 79.19 | 0.19 |
| inMM-V | 81.05 | 79.51 | 0.19 |
Publisher’s Note: MDPI stays neutral with regard to jurisdictional claims in published maps and institutional affiliations. |
© 2020 by the authors. Licensee MDPI, Basel, Switzerland. This article is an open access article distributed under the terms and conditions of the Creative Commons Attribution (CC BY) license (http://creativecommons.org/licenses/by/4.0/).
Share and Cite
MDPI and ACS Style
Sallay, H.; Bourouis, S.; Bouguila, N. Online Learning of Finite and Infinite Gamma Mixture Models for COVID-19 Detection in Medical Images. Computers 2021, 10, 6. https://0-doi-org.brum.beds.ac.uk/10.3390/computers10010006
AMA Style
Sallay H, Bourouis S, Bouguila N. Online Learning of Finite and Infinite Gamma Mixture Models for COVID-19 Detection in Medical Images. Computers. 2021; 10(1):6. https://0-doi-org.brum.beds.ac.uk/10.3390/computers10010006
Chicago/Turabian StyleSallay, Hassen, Sami Bourouis, and Nizar Bouguila. 2021. "Online Learning of Finite and Infinite Gamma Mixture Models for COVID-19 Detection in Medical Images" Computers 10, no. 1: 6. https://0-doi-org.brum.beds.ac.uk/10.3390/computers10010006
Note that from the first issue of 2016, this journal uses article numbers instead of page numbers. See further details here.