Article

A Novel Simulation Platform for Underwater Data Muling Communications Using Autonomous Underwater Vehicles

1
INESC TEC and Faculdade de Engenharia, Universidade do Porto, Rua Dr. Roberto Frias s/n, 4200-465 Porto, Portugal
2
INESC TEC and Instituto Superior de Engenharia do Porto, Politécnico do Porto, Rua Dr. António Bernardino de Almeida 431, 4200-072 Porto, Portugal
*
Authors to whom correspondence should be addressed.
Submission received: 6 July 2021 / Revised: 6 September 2021 / Accepted: 7 September 2021 / Published: 22 September 2021

Abstract

:
Autonomous Underwater Vehicles (AUVs) are seen as a safe and cost-effective platforms for performing a myriad of underwater missions. These vehicles are equipped with multiple sensors which, combined with their long endurance, can produce large amounts of data, especially when used for video capturing. These data need to be transferred to the surface to be processed and analyzed. When considering deep sea operations, where surfacing before the end of the mission may be unpractical, the communication is limited to low bitrate acoustic communications, which make unfeasible the timely transmission of large amounts of data unfeasible. The usage of AUVs as data mules is an alternative communications solution. Data mules can be used to establish a broadband data link by combining short-range, high bitrate communications (e.g., RF and wireless optical) with a Delay Tolerant Network approach. This paper presents an enhanced version of UDMSim, a novel simulation platform for data muling communications. UDMSim is built upon a new realistic AUV Motion and Localization (AML) simulator and Network Simulator 3 (ns-3). It can simulate the position of the data mules, including localization errors, realistic position control adjustments, the received signal, the realistic throughput adjustments, and connection losses due to the fast SNR change observed underwater. The enhanced version includes a more realistic AML simulator and the antenna radiation patterns to help evaluating the design and relative placement of underwater antennas. The results obtained using UDMSim show a good match with the experimental results achieved using an underwater testbed. UDMSim is made available to the community to support easy and faster evaluation of underwater data muling oriented communications solutions and to enable offline replication of real world experiments.

1. Introduction

The sea not only offers extremely harsh conditions for the operation of traditional activities such as fishing and transportation but also for new activities such as environmental monitoring and deep-sea mining, requiring expensive resources and logistics especially with respect to those underwater. Sustained ocean observations in real time and close to real time analysis of ocean parameters are fundamental to the understanding of ocean processes, not only for scientific purposes but also for increasing industrial, technological, environmental, and societal applications. Ocean observation systems can be composed by in situ measurements using sensors mounted on ships or remote sensing systems, such as stationary observatories and AUVs, that capture the spatial and temporal variations of ocean, seafloor, and sub-seafloor properties. Stationary observatories, such as the GEOSTAR-class [1] and EMSO (EGIM) [2] shown in Figure 1, are able to carry long-term geophysical, geochemical, and oceanographic observations up to abyssal depths (4000 m). Autonomous Underwater Vehicles (AUVs) are seen as a safe and cost-effective platform for performing a myriad of underwater missions [3,4]. For instance, in the implementation of the European Marine Strategy Framework Directive, AUVs are seen as a tool for habitat mapping, identification of geomorphological features, and detection of marine litter for promoting biodiversity preservation and the good environmental status of marine waters. They not only collect marine data that are difficult or impossible for research vessels to collect but also allow a much less expensive and, therefore, more frequent data acquisition. Thus, they are ideal for the acquisition of longer time series data.
AUVs and stationary observatories are equipped with multiple sensors which, combined with their long endurance, can produce large amounts of data, especially when video and bathymetric data are captured. For instance, the multibeam surveys with AUVs are usually set to autonomous missions of 24 h, surveying a specific area. All the acquired data are retrieved and analysed once the mission is finished and the AUV is recovered [3]. Multibeam and side-scan sonars are frequently acquired simultaneously. The data volume is in the order 800 MB/day for multibeam data and 10 GB/day for side-scan data. The collected data need to be transferred to the surface to be processed and analyzed. When considering for instance deep-sea operation, surfacing frequently is unpractical due not only to the time and energy spent but also to the disturbance induced relative to the original mission.
AUVs typically upload the data at the end of the mission, which causes delay in data processing and visualization and introduces significant dead-times between consecutive missions. This delay precludes possible adjustments in the AUV’s mission (or other AUV’s mission in a multiple-vehicle mission) due to the inability of onboard devices to process the collected data in real-time. Enabling broadband communications between the AUV and a central station so that the collected data can be timely uploaded along the mission is the solution for this problem.
Current underwater communications solutions can only provide either long-range narrowband communications or short-range broadband communications. Acoustic communications are the most commonly used solution. However, despite the long-range capability, their high propagation delay and low bitrate render them unsuitable for timely video transmission and transfer of high data volumes [5]. Optical communications, using LEDs or lasers, are able to increase the throughput to tens of Mbit/s. Despite the technological advancements, the practical underwater optical communications range is limited to tens of meters due to the water turbidity and the need of line-of-sight and proper beam alignment mechanisms. Radio Frequency (RF) communications offer the same broadband communications capabilities as optical communications, without the need of line-of-sight or beam alignment. However, RF signals suffer from strong attenuation underwater, limiting the practical use of broadband RF communications to a few meters.
GROW is a pioneering solution that aims to overcome the limitations of current underwater communications technologies and provide long-range, broadband underwater wireless communications between a Survey Unit (SU)—e.g., deep sea lander and survey AUV—and a Central Station Unit (CSU) at the surface—e.g., buoy, vessel, and Autonomous Surface Vehicle [6]. The GROW concept is illustrated in Figure 2. At the core of the concept is a Delay Tolerant Network (DTN) [7,8] composed of small and agile AUVs—data mules—equipped with (1) high bitrate wireless communications (e.g., RF and optical) for short-range data transfer and (2) long-range low bitrate acoustic communications for control purposes. The data mules, traveling back and forth between the SU and the CSU, create a virtual bidirectional communications link. The GROW solution has been tested in lab environment using an underwater testbed composed of one SU, one CSU, and two Data Mule Units (DMUs) [9,10]. The experimental results obtained show that it outperforms current acoustic communications by achieving equivalent throughputs up to 150 times higher within the typical range of operation of the acoustic communications. Underwater DTNs have been studied by different research groups [11,12,13]; however, most of the work has been focused on routing protocols for opportunistic and predicted contact between nodes, rather than on solutions for high bitrate wireless transfer. Autonomous underwater data muling systems have been considered in a few works [14,15]. However, all of them used data muling to retrieve data from static nodes. The GROW solution advances the state of the art by considering data retrieval from mobile AUVs.
The ability to accurately simulate the data mules’ motion and the communications network performance is relevant for studying how a data muling system is affected by the variation of parameters such as the number of data mules, the distance between the CSU and the SU, the amount of data to be transferred, and the control laws for a timely and accurate approach.
The main contribution of this paper is an enhanced version of UDMSim, which is a simulation platform for underwater data muling oriented systems that combines the AML and ns-3 simulators. This new version considers the following:
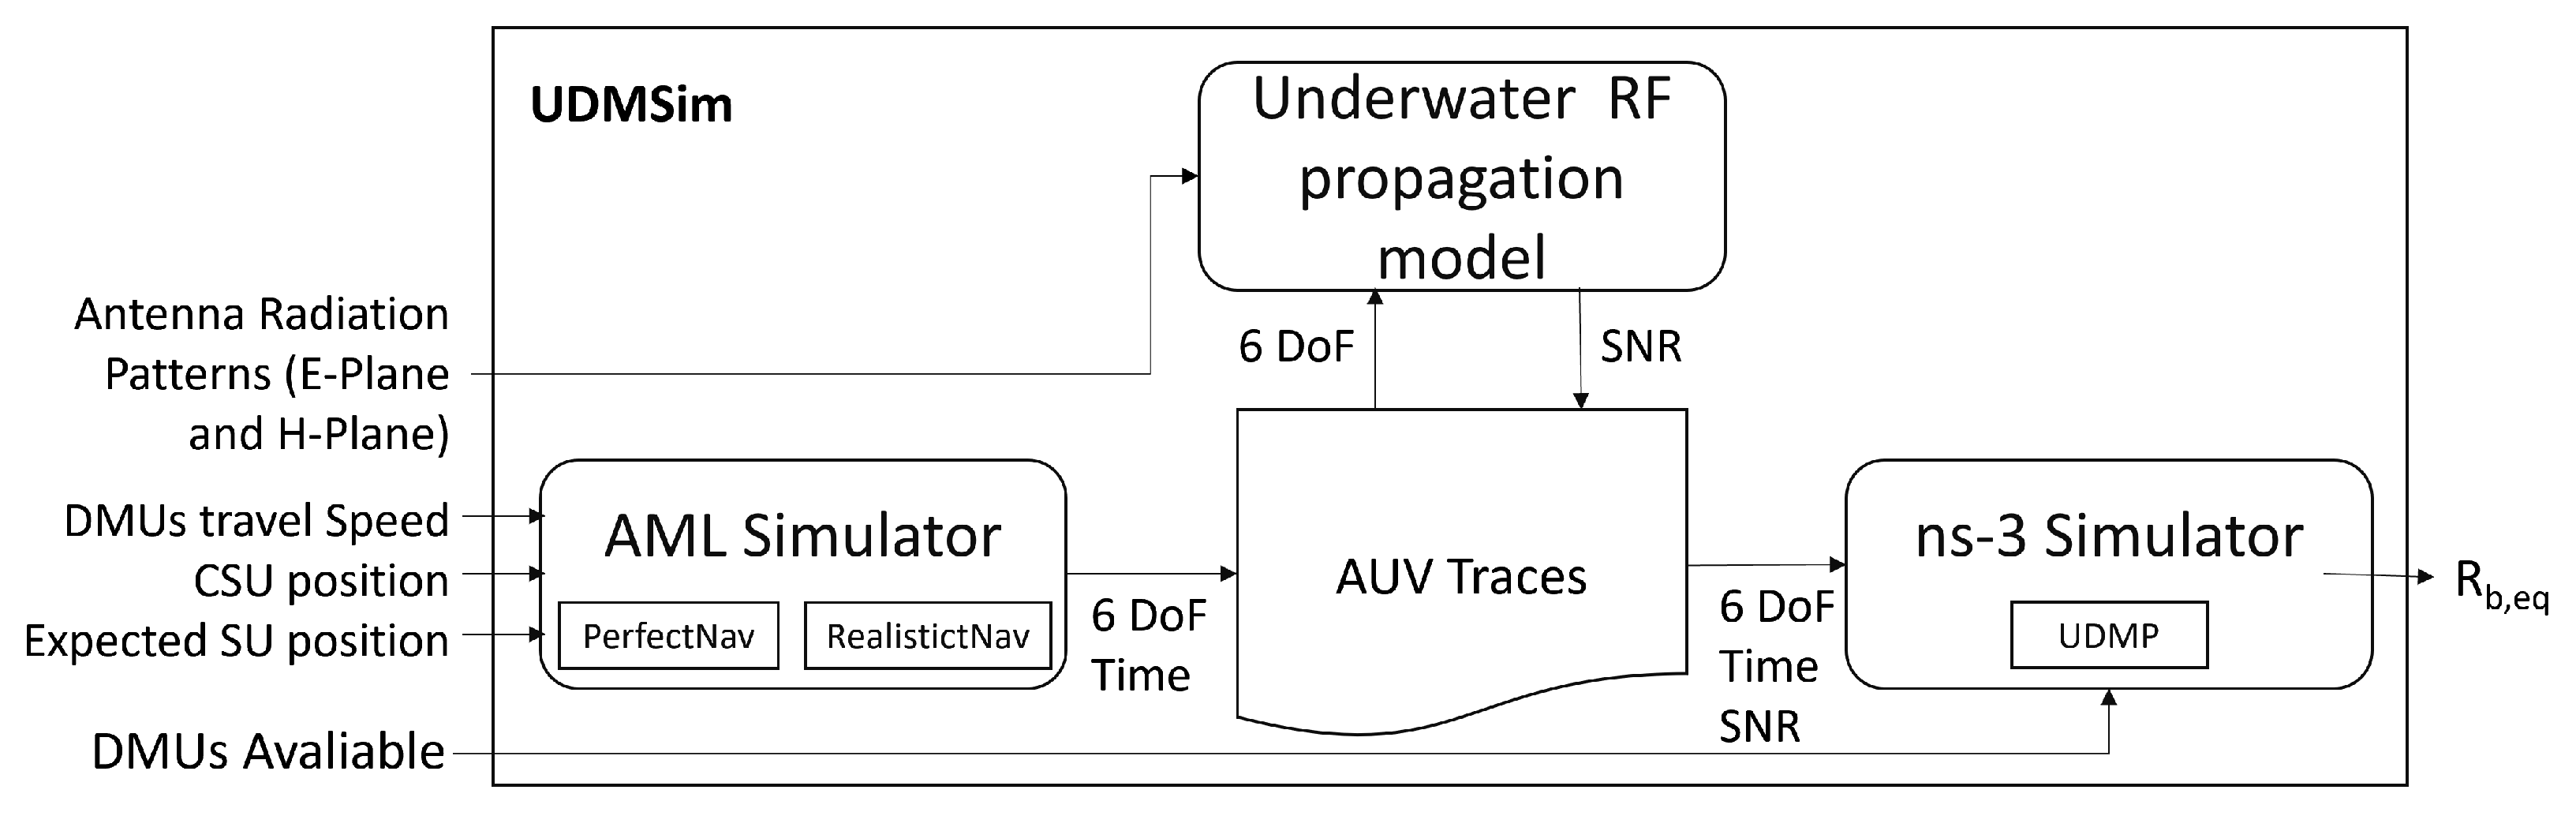
  • A more realistic AML simulator, considering the designed suite of sensors and emulating their expected performances;
  • The simulation of the designed estimation layer and the control under the influence of measurement noise;
  • The inclusion of the antenna radiation patterns to help in evaluating the design and relative positioning of underwater antennas.
UDMSim is validated against a theoretical model and lab experiments. The results show a good match between UDMSim, the theoretical model, and the experimental results obtained using an underwater lab testbed considering no localization errors. UDMSim is also capable of reproducing scenarios with localization errors, either simulated or from real traces. UDMSim is made available to the community [6] to support easy and faster evaluation of data muling oriented underwater communications solutions such as GROW and enables offline replication of real world experiments.
The rest of the paper is organized as follows. Section 2 presents the related work. Section 3 provides an overview of the GROW solution. Section 4 presents the simple theoretical model of a data muling oriented system. Section 5 presents the UDMSim. Section 6 evaluates the equivalent throughput results. Section 7 draws the conclusions and points out future work directions.

2. Related Work

The demand for underwater wireless communications is being pushed by AUV-based underwater missions. However, the design of broadband and reliable underwater wireless communications able to download Gbytes of data captured during a mission is still a challenge [16,17,18]. In this section, we present the different underwater communications technologies available in the state of the art and provide an overview of previous work regarding underwater delay-tolerant networks and underwater data muling, used mainly in underwater wireless sensor networks (UWSN) scenarios. Moreover, we provide some insight on how an AUV is able to navigate and localize in underwater scenarios.

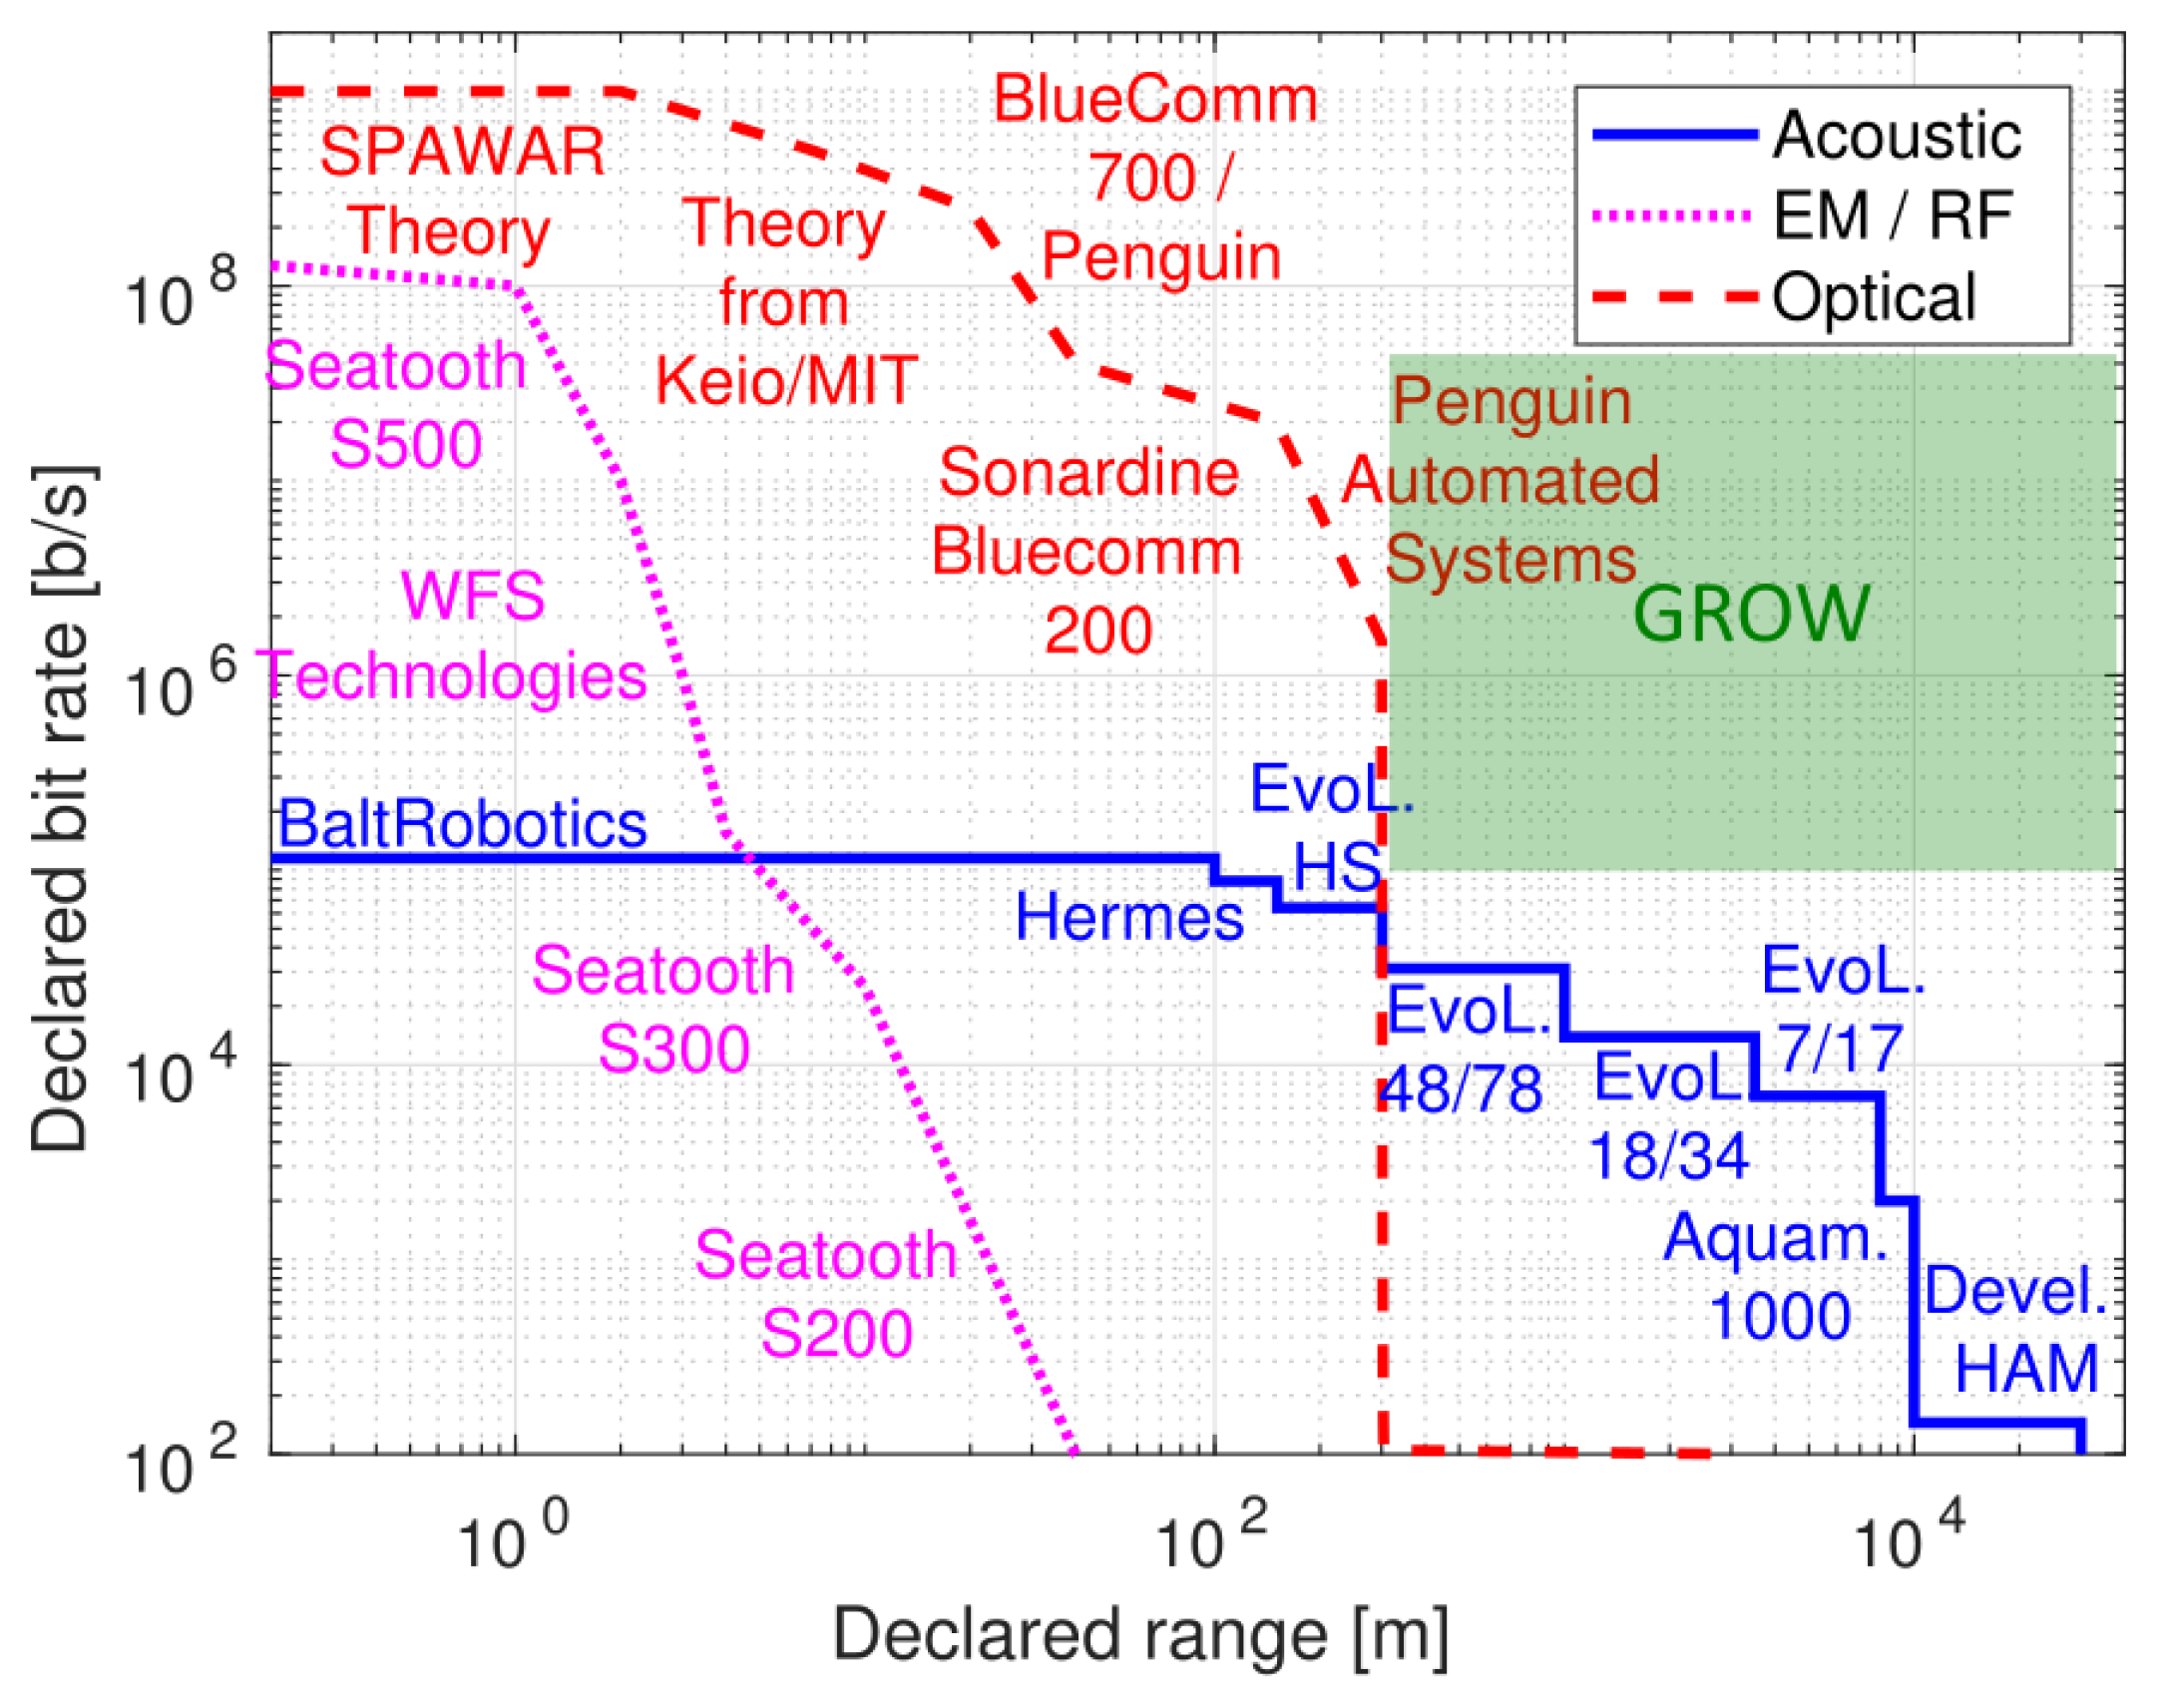
2.1. Underwater Communications Technologies

Underwater wireless communications can be performed using three different technologies: acoustic, optical, and RF [17]. Acoustic communications are the main solution for underwater environment [16,17]. While they enable kilometer ranges, the low propagation speed of sound in water and the kbit/s data rates make acoustic communications unsuitable for applications with high bitrate requirements, e.g., HD video transmission [19]. In [5], the authors provide a comprehensive comparison between current off-the-shelf acoustic modems and some experimental solutions available. In Table 1, we can observe that most of the commercial devices can only provide rates in the order of some kbit/s, being the fastest at 35 kbit/s. We can also observe that the devices that are developed by research groups are in line with the commercial products. From Table 1, we can observe that one modem exceeds these values; however, the 1–10 Mbit/s data rate is achieved due to the combination with optical communications [20]. It is also important to observe from Table 1 that the high power consumption of the commercial acoustic modems, which range from 1.8 to 300 W during transmission, can have a significant impacts on the endurance of autonomous vehicles and underwater observatories, which are typically battery-powered.
Optical communications, namely underwater optical wireless communications (UOWC) or Underwater Free Space Optical Communication (uFSO), are able to provide throughputs up to Gbit/s, as shown in Figure 3 [21,22,23]. Moreover, Optical Communication Systems can be compact, flexible and consume less power than acoustic systems. However, when used for medium-range communications, optical communications are severely affected by turbidity and require clear line-of-sight and beam alignment mechanisms, making them unfeasible in many scenarios [24,25] and limiting its practical usage to tens of meters [26]. Despite these limitations, optical modems have shown bitrates up to 250 Mbit/s and ranges up to 200 m, such as SA Photonic Neptune [27].
Despite the strong attenuation underwater, Radio Frequency (RF) communications based on the IEEE 802.11 standard can be used for short-range communications [17,28,29], matching the performance of UVLC without the need of line-of-sight [24] nor alignment algorithms [17]. Both the theoretical and experimental evaluations carried out found that 802.11 underwater networks at 2.4 GHz achieve few centimeter ranges. By employing sub-GHz frequencies, RF attenuation reduced progressively, increasing the communications range up to 5 m in freshwater and up to 1.8 m in seawater, with throughputs up to 550 kbit/s at 70–100 MHz [30]. These results prove the feasibility of IEEE 802.11 networks for short-range and high bitrate communications using VHF/UHF bands.

2.2. Underwater Delay-Tolerant Networks

The use of Delay-Tolerant Networks (DTNs) [32] is becoming very common in underwater scenarios. DTNs consist in a type of networks especially designed to support long communication delays and intermittent connection between nodes in extreme environments. This concept implementation is generally based on a technique known as store and forward message switching. This method consists in moving entire data packets (or fragments) from one storage place in one node to other storage place in another node, similar to what happens in the classical postal mail systems. For this purpose, nodes that are part of a DTN implementation, such as router devices, should always have persistent storage since a link to a next hop may be unreachable for a considerable amount of time. The protocol used in this kind of network, which implements the store-and-forward technique mentioned above, is called the Bundle Protocol (BP), defined in [33]. In the protocol stack, BP runs below the application layer. The interface defined between the BP and the protocol suite is called convergence layer adapter. As the name suggests, the data units defined in BP are called Bundles and include the following: (1) a header consisting of one or more DTN blocks inserted by the BP agent; (2) a source-application’s user data, including control information sent from source node to destination node defining how to process, store, dispose of, and otherwise, handle the user data; and (3) an optional bundle trailer, composed of zero or more DTN blocks.
Although the first applications of the DTN concept were related to interplanetary communications, several works have already explored the idea of using DTNs in almost every type of environment where a permanent end-to-end path between the communications nodes is not possible to maintain, as in underwater environments. In [34,35], experimental tests using different bundle protocol implementations were conducted, where acoustic modems were used to perform the communications between the underwater nodes in both cases. The use of the DTN concept in these environments was proven to improve the communications performance with any of the two tested implementations when compared to a typical point-to-point network architecture. The same conclusion was found in [10,36,37].

2.3. Underwater Data Muling

Underwater data muling using AUVs and DTNs can overcome the limitations of current underwater communications technologies [15,38,39,40]. In [15,41,42], the authors demonstrated that data muling in underwater sensor networks using AUVs is a very useful approach for long-term environmental monitoring and surveillance. Using small and agile AUVs combined with short-range high throughput communications, the solution proposed in the GROW project [6] enables a broadband virtual link between a fixed or mobile SU and a CSU.
Despite the long delays and disruption generally experienced in data muling processes, the interest in several complex applications such as video streaming solutions has increased in recent years. It has already been proven that streaming large amounts of data is possible [43]. Moreover, there is even a DTN framework specifically designed for video streaming purposes, called Bundle Streaming Service (BSS) [44,45]. BSS supports two different types of connection: (1) a best-effort option for close to real-time video streaming; and (2) a reliable transport option, giving the user the possibility of replaying the video later in its integral form. Recently, the concepts of data muling, underwater wireless communications and video streaming were combined in [46], addressing the issue of long-range video transfer in underwater scenarios with promising results.

2.4. AUV Navigation and Localization

Using AUVs to fetch data underwater might enable much higher data rates but the potential of such a solution needs to be evaluated realistically, including not only data transfer simulation but also realistic motion of the AUVs under practical circumstances. The motion of an AUV is affected by the control algorithms and by the localization information or more generally by state estimation. While long-range navigation is a modest problem under the data muling scenario, short-range navigation might have a strong impact on the overall data rates, depending on the employed technology, for ensuring adequate proximity between the DMUs and the SU. Some recent works have looked into the latter problem mostly in the context of AUV docking [47], inspection, intervention [48], and maintenance. However, the tracking performances are hard to model, as they depend on (1) many variables related to control and estimation, (2) random errors corrupting the data from sensors, and (3) often unpredictable environmental disturbances.

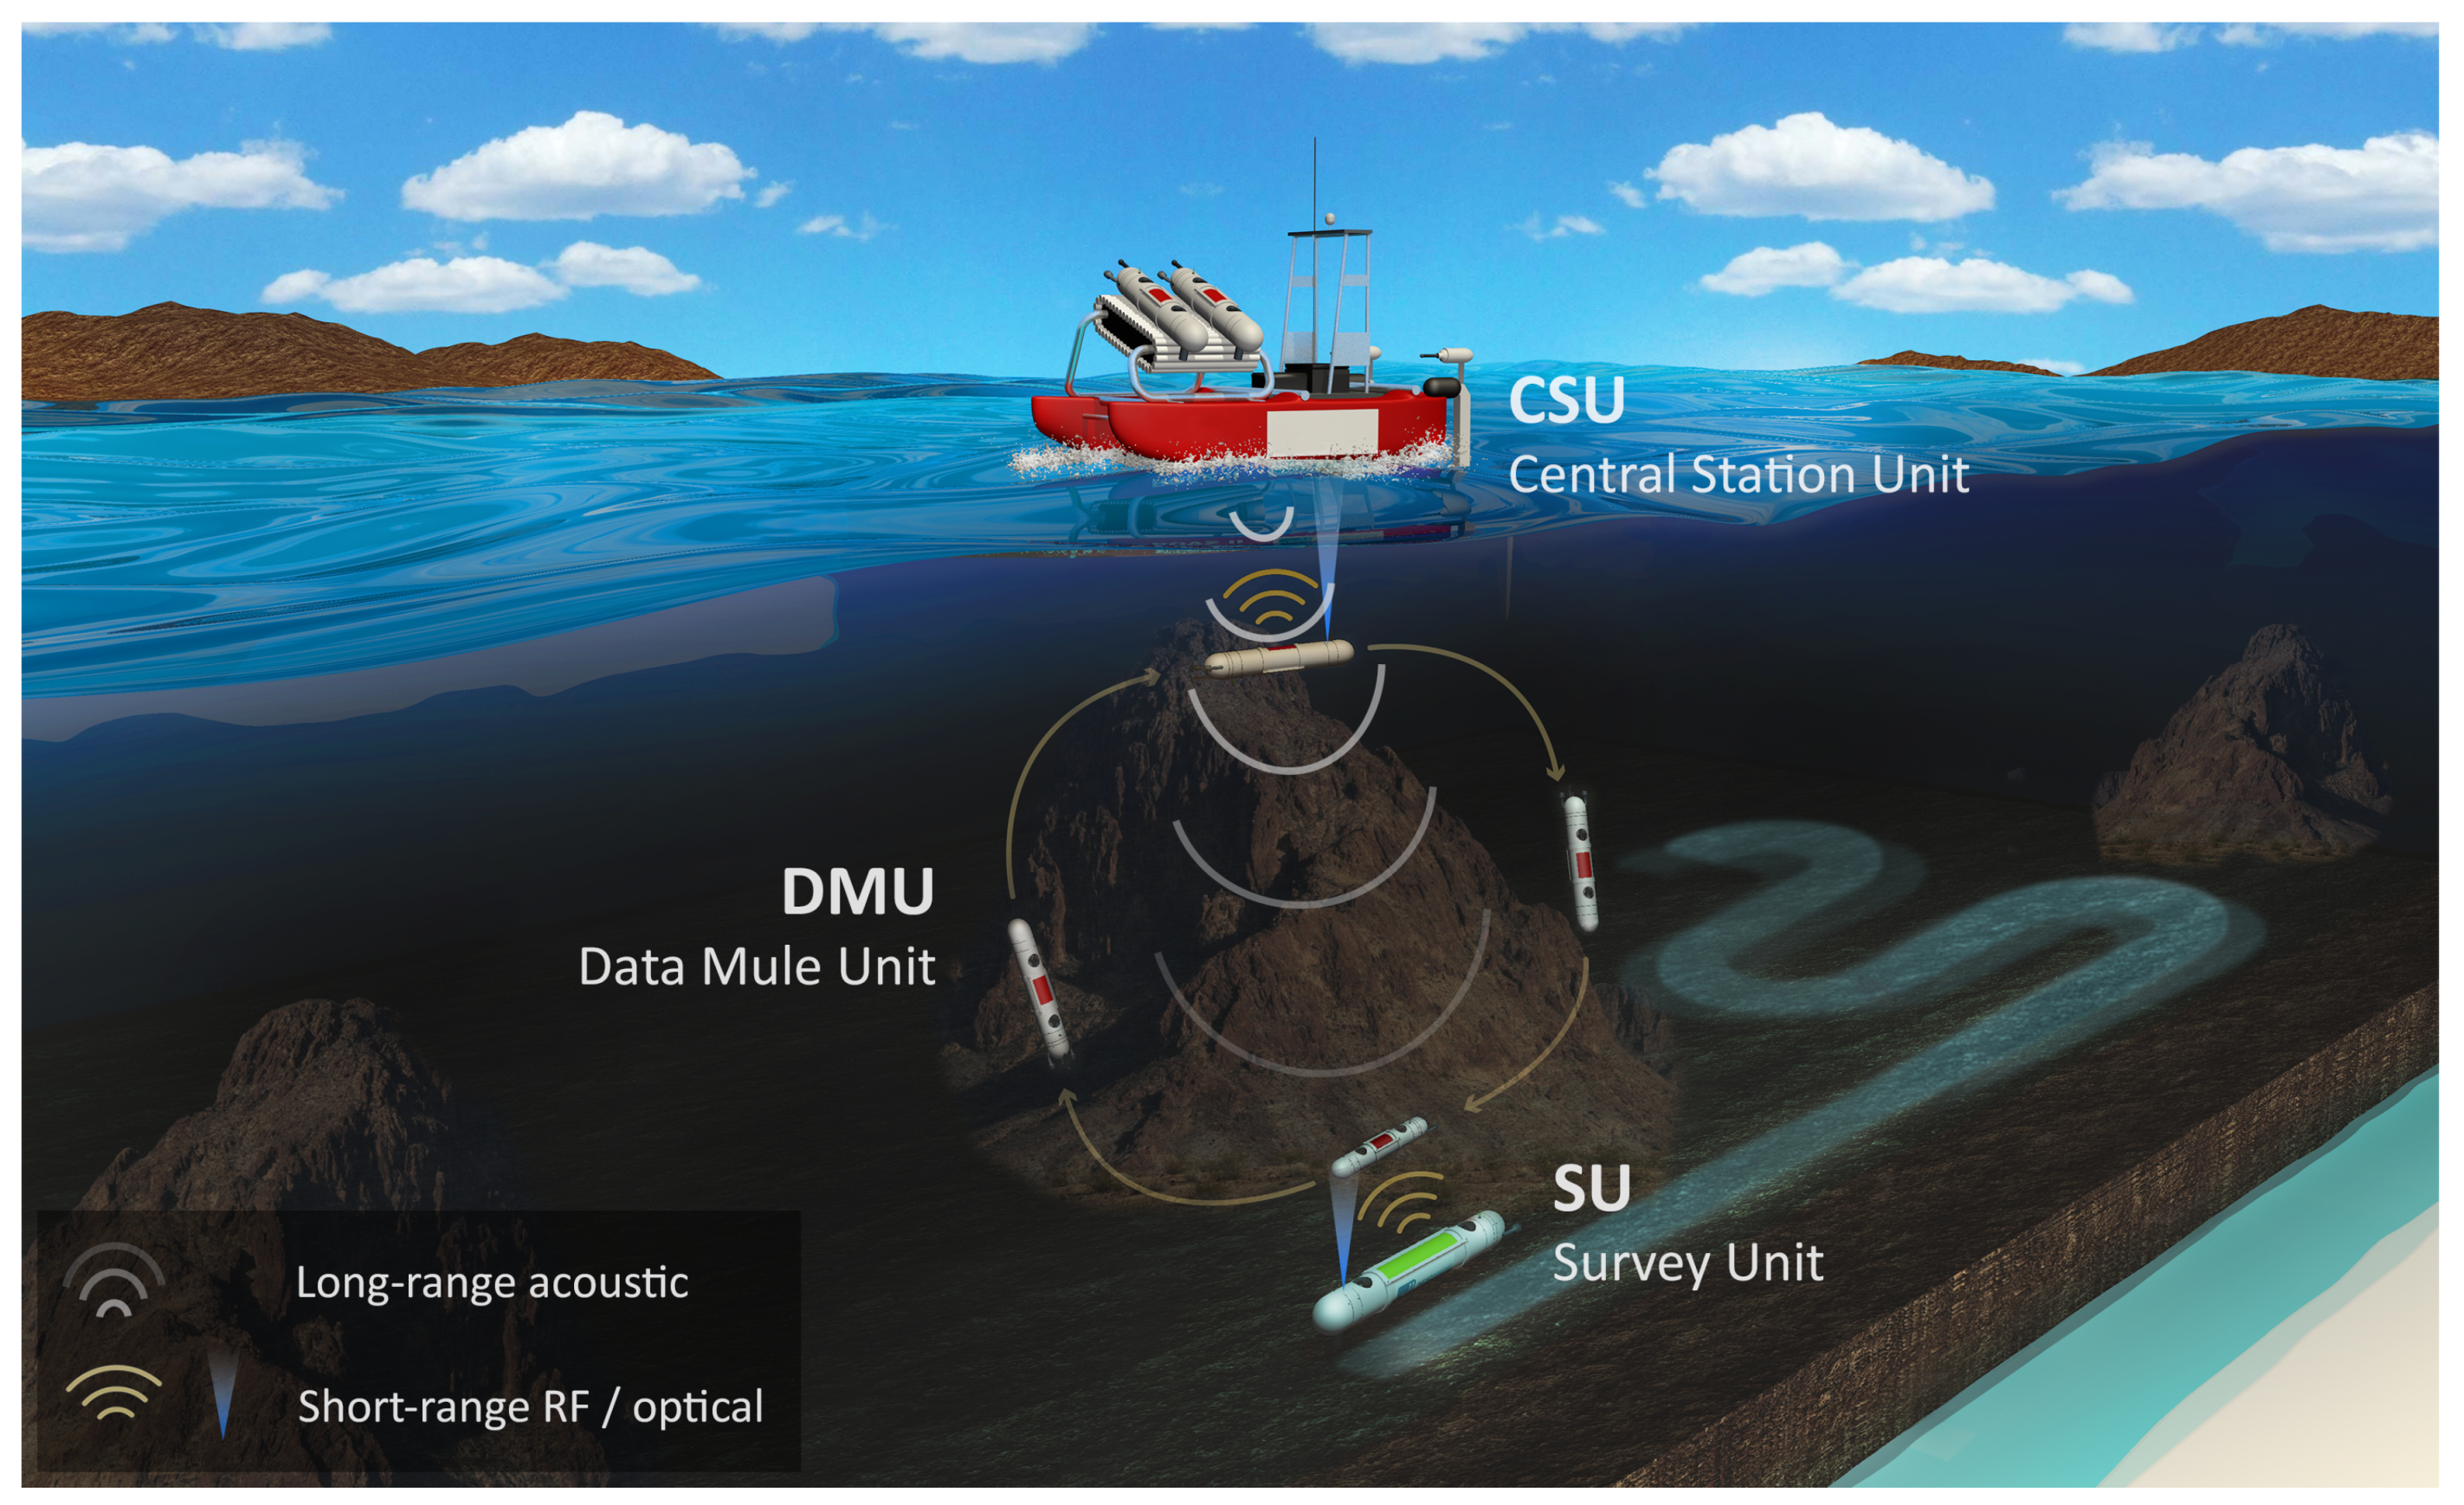
3. GROW Solution Overview

GROW is a pioneering solution that aims to overcome the limitations of current underwater communications technologies. It enables long-range, broadband underwater wireless communications between an underwater Survey Unit (SU) and a Central Station Unit (CSU) at the surface through the use of one or more Data Mule Units (DMUs) [6]. In this section we present an overview of the GROW solution, including its communications and AUV localization components.

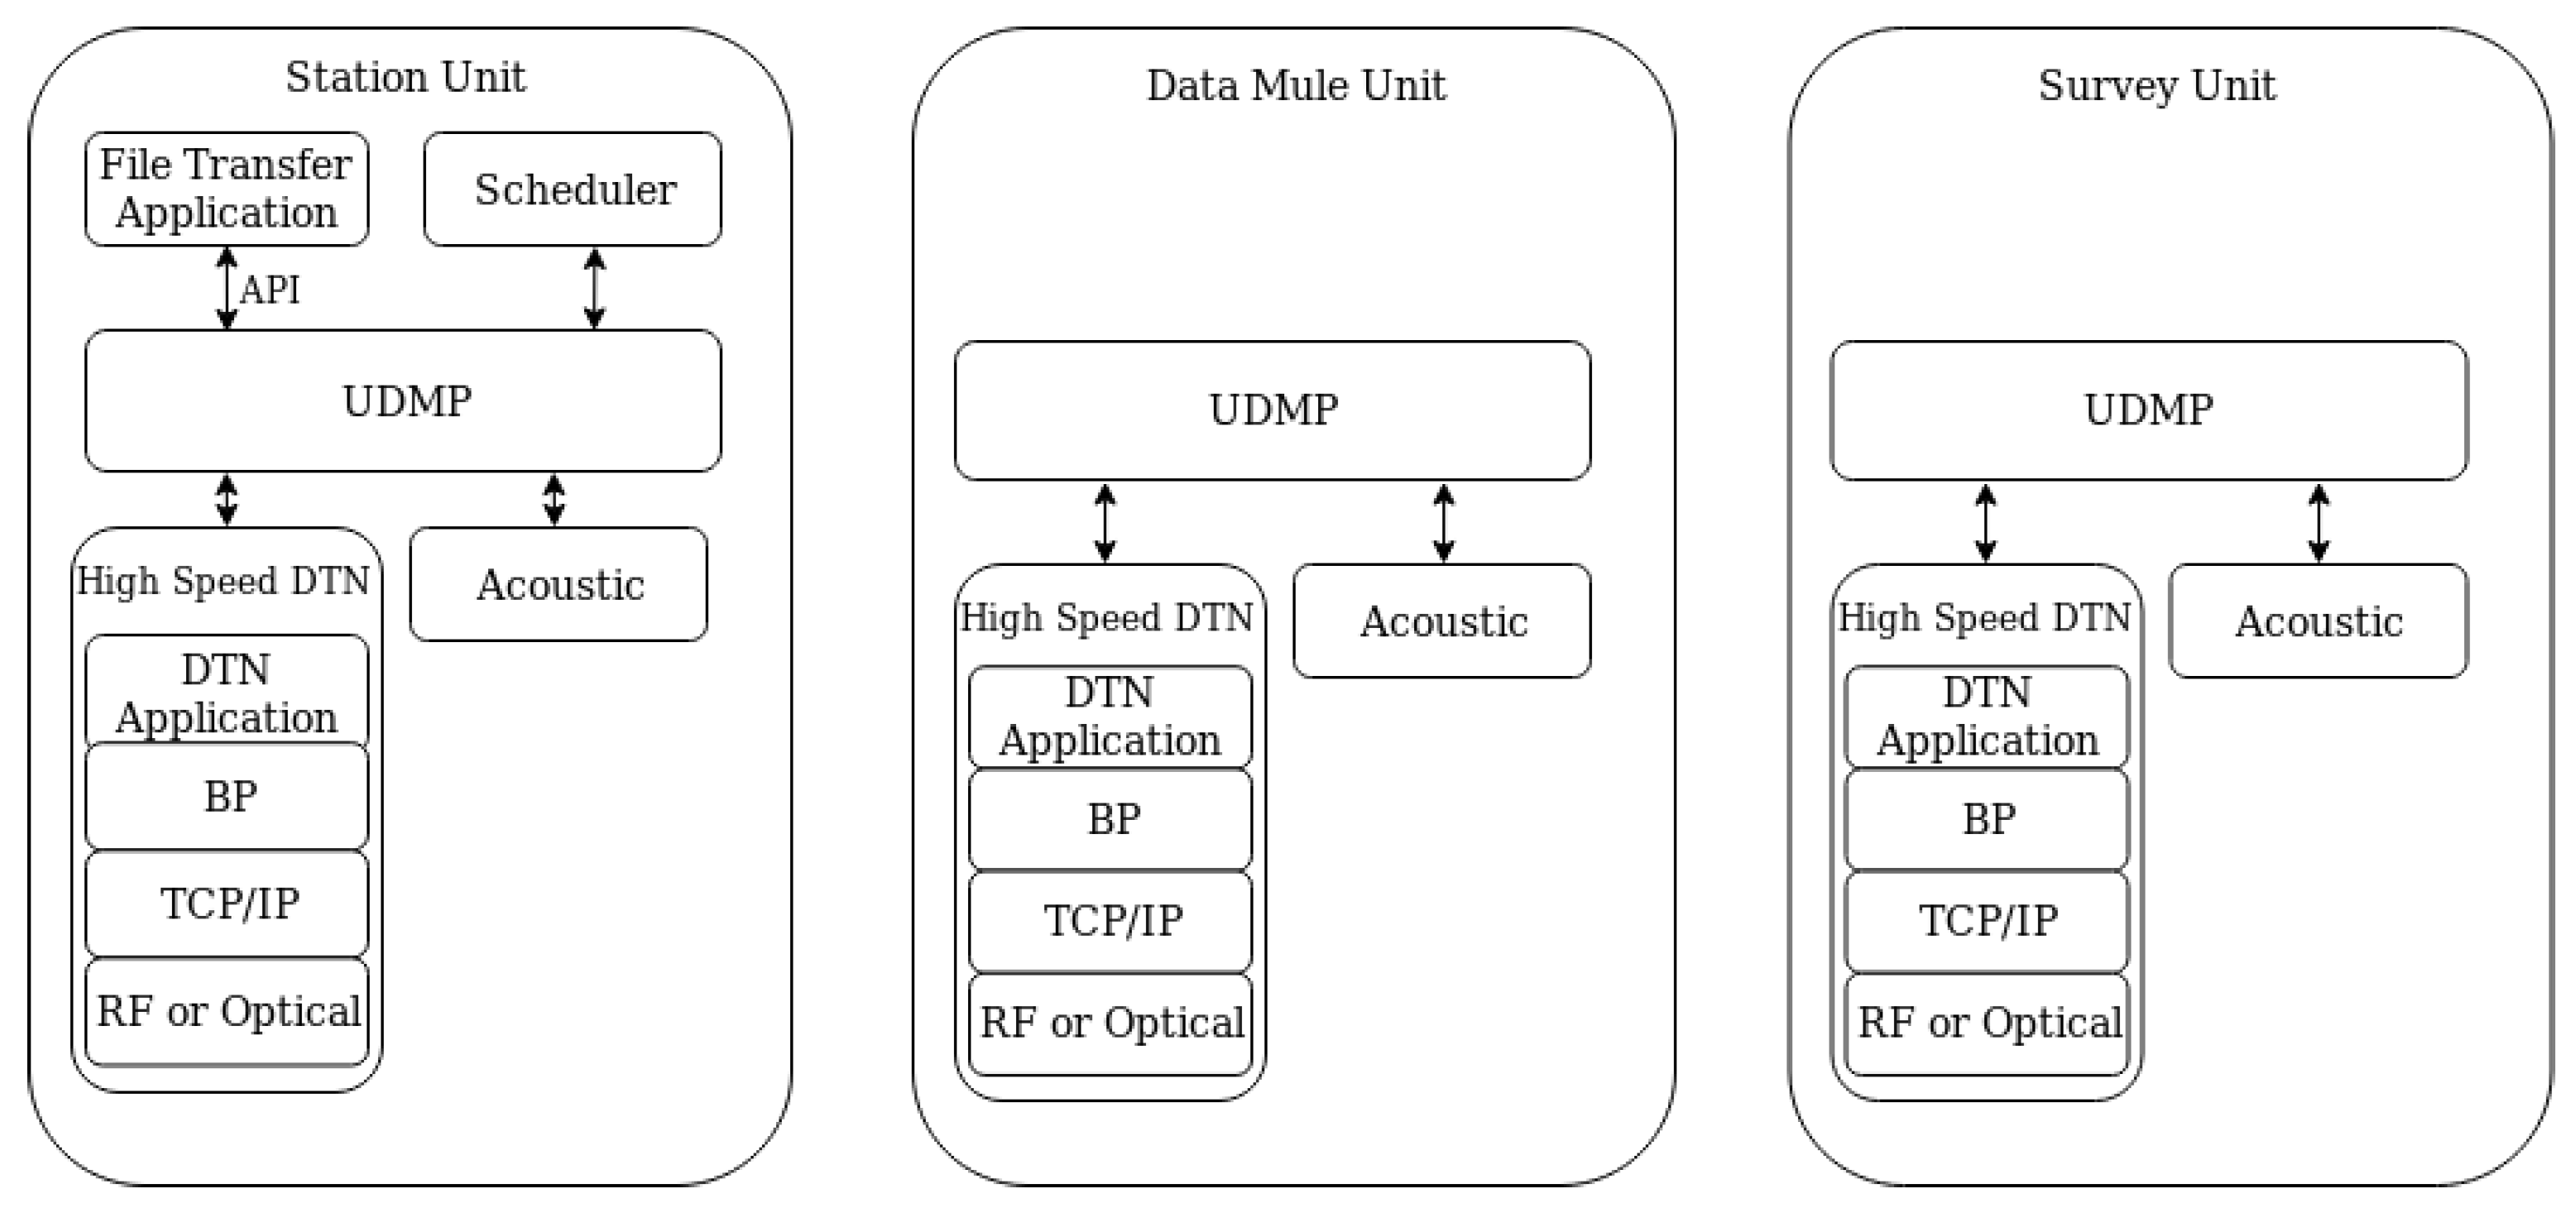
3.1. Communications Solution

Long-range underwater wireless communications rely on narrowband acoustic communications [5,17], which are unsuitable for uploading large amounts of data from an AUV. Although other technologies such as optical and RF are able to provide higher throughputs [24,28], they are affected by turbidity and strong attenuation, respectively, limiting their practical usage to short-range communications.
The GROW solution, illustrated in Figure 2, addresses this problem by employing AUVs that operate as data mules between a fixed or mobile SU that acquires and logs the data—e.g., deep sea lander and survey AUV—and a CSU such as buoy, vessel, and Autonomous Surface Vehicle (ASV). The CSU is assumed to be equipped with a permanent connection to an onshore station, reachable through the Internet. It is responsible for scheduling the available DMUs. The DMUs are small and agile AUVs that establish a virtual bi-directional communications link between the CSU and the SU by traveling back and forth between them. This will fill the gap shown in the top right corner of the plot of Figure 3.
The GROW solution considers two different communications technologies: a broadband, short-range communications link (optical or RF) used for data download from the SU to the DMU and upload from the DMU to the CSU; and a narrowband, long-range acoustic communications link for controlling the DMUs. Due to the intermittent connectivity of the short-range communications link, protocols designed for delay/disruption tolerant wireless networks are used.
Due to the short distance required between the DMU and the mobile SU for enabling high bitrate underwater communications, GROW addresses the challenges of the following: (1) homing to a mobile target with uncertain or possibly corrupted information on its future trajectory; and (2) precise positioning of an AUV with regard to a mobile target accommodating strong disturbances induced by the motion of the DMU with regard to the mobile target (the SU).
The correct scheduling of the DMUs is a key factor for the GROW system performance. In [9], we have proposed the Underwater Data Muling Protocol (UDMP), a communications protocol that enables the control and scheduling of the DMUs within the GROW framework for a file transfer application. The UDMP communications stack is presented in Figure 4 and runs on every node of the network. The scheduler defines the number of DMUs deployed and their sequence. UDMP is then responsible for handling all the control messages over the acoustic network according to the scheduler commands. It is also responsible for handling the split and reconstruction of the data chunks sent over the DTN.

3.2. Localization Solution

During operations, AUVs require an estimate of their locations. Other variables might also be relevant (e.g., linear velocity). All these variables are usually combined on a so-called state vector that includes important data for guidance and control purposes. Given an initial guess of the state vector, the AUV may resort to mathematical models to estimate the state over the mission. However, models are generally inaccurate and may result in significant errors (some meters for location) in a matter of a few seconds or minutes. Even if very accurate models could be run in real-time, external disturbances are usually unpredictable, which result in the same problem of divergence from the real state. Therefore, sensors are employed to measure variables (e.g., pressure and magnetic direction) that relate to state variables. These measurements are then used to correct the errors of the state variables. However, the measurements of these sensors are imperfect as they suffer from biases, noise, and quantization effects in addition to being sampled at discrete asynchronous intervals. Thus, analytical determination of state variables is impractical.
To deal with the problem, filters are commonly employed to fuse measurements from sensors and mathematical models. The Kalman Filter (KF) and its variants—Extended Kalman Filter (EKF) and Unscented Kalman Filter (UKF)—are standard solutions in many applications (e.g., GPS localization). Other options include particle filters, Bayes filters, and the Expectation Maximization (EM) algorithm. These provide a framework that complies with most of the characteristics mentioned above. For the present work, an EKF was implemented, taking into account the nonlinear nature of the differential equations that govern the motion of the AUV, as well as the nonlinear relation between measurements and state variables. The EKF framework includes two stages, as illustrated in Figure 5: prediction based on mathematical models of the dynamics and update when measurements from sensors are used to correct the state vector. For the purpose of this work, the following state variables were considered:
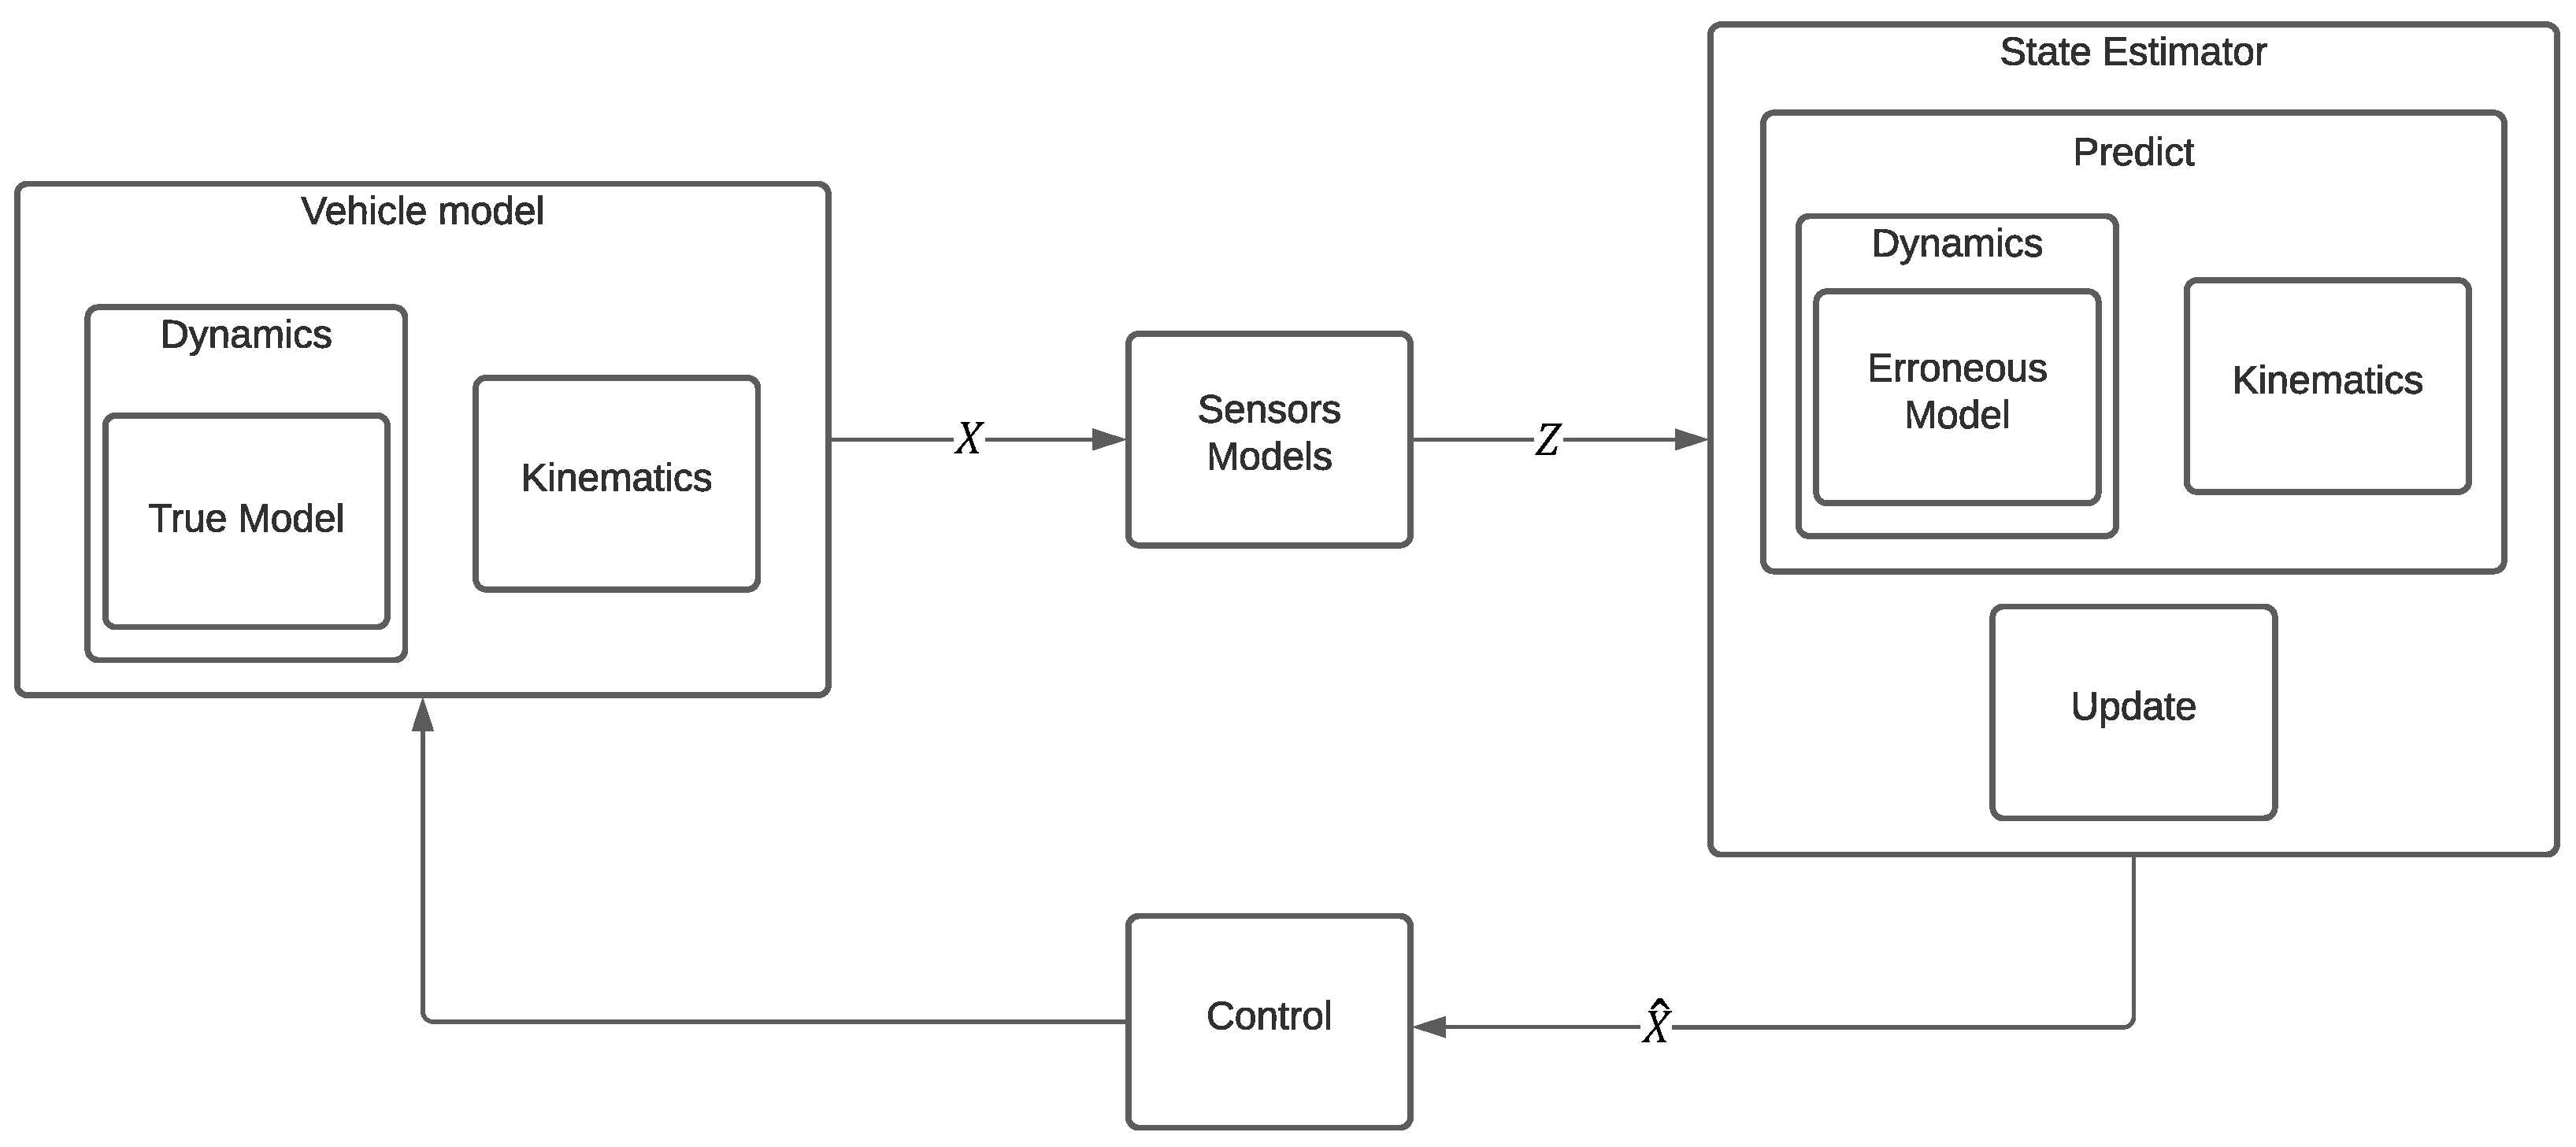
  • Absolute three-dimensional position—represented in Cartesian coordinates in a global frame;
  • Attitude—represented in the form of a unit quaternion;
  • Linear velocities—expressed on the axes of the reference frame attached to the AUV body;
  • Angular velocities—expressed on the axes of the reference frame attached to the AUV body;
  • Absolute three-dimensional position of the target.
Kinematics and dynamics models are used for predicting the state based on previous state and actuation, i.e., forces applied by the thrusters. The following sensor suite is assumed in the context of this work:
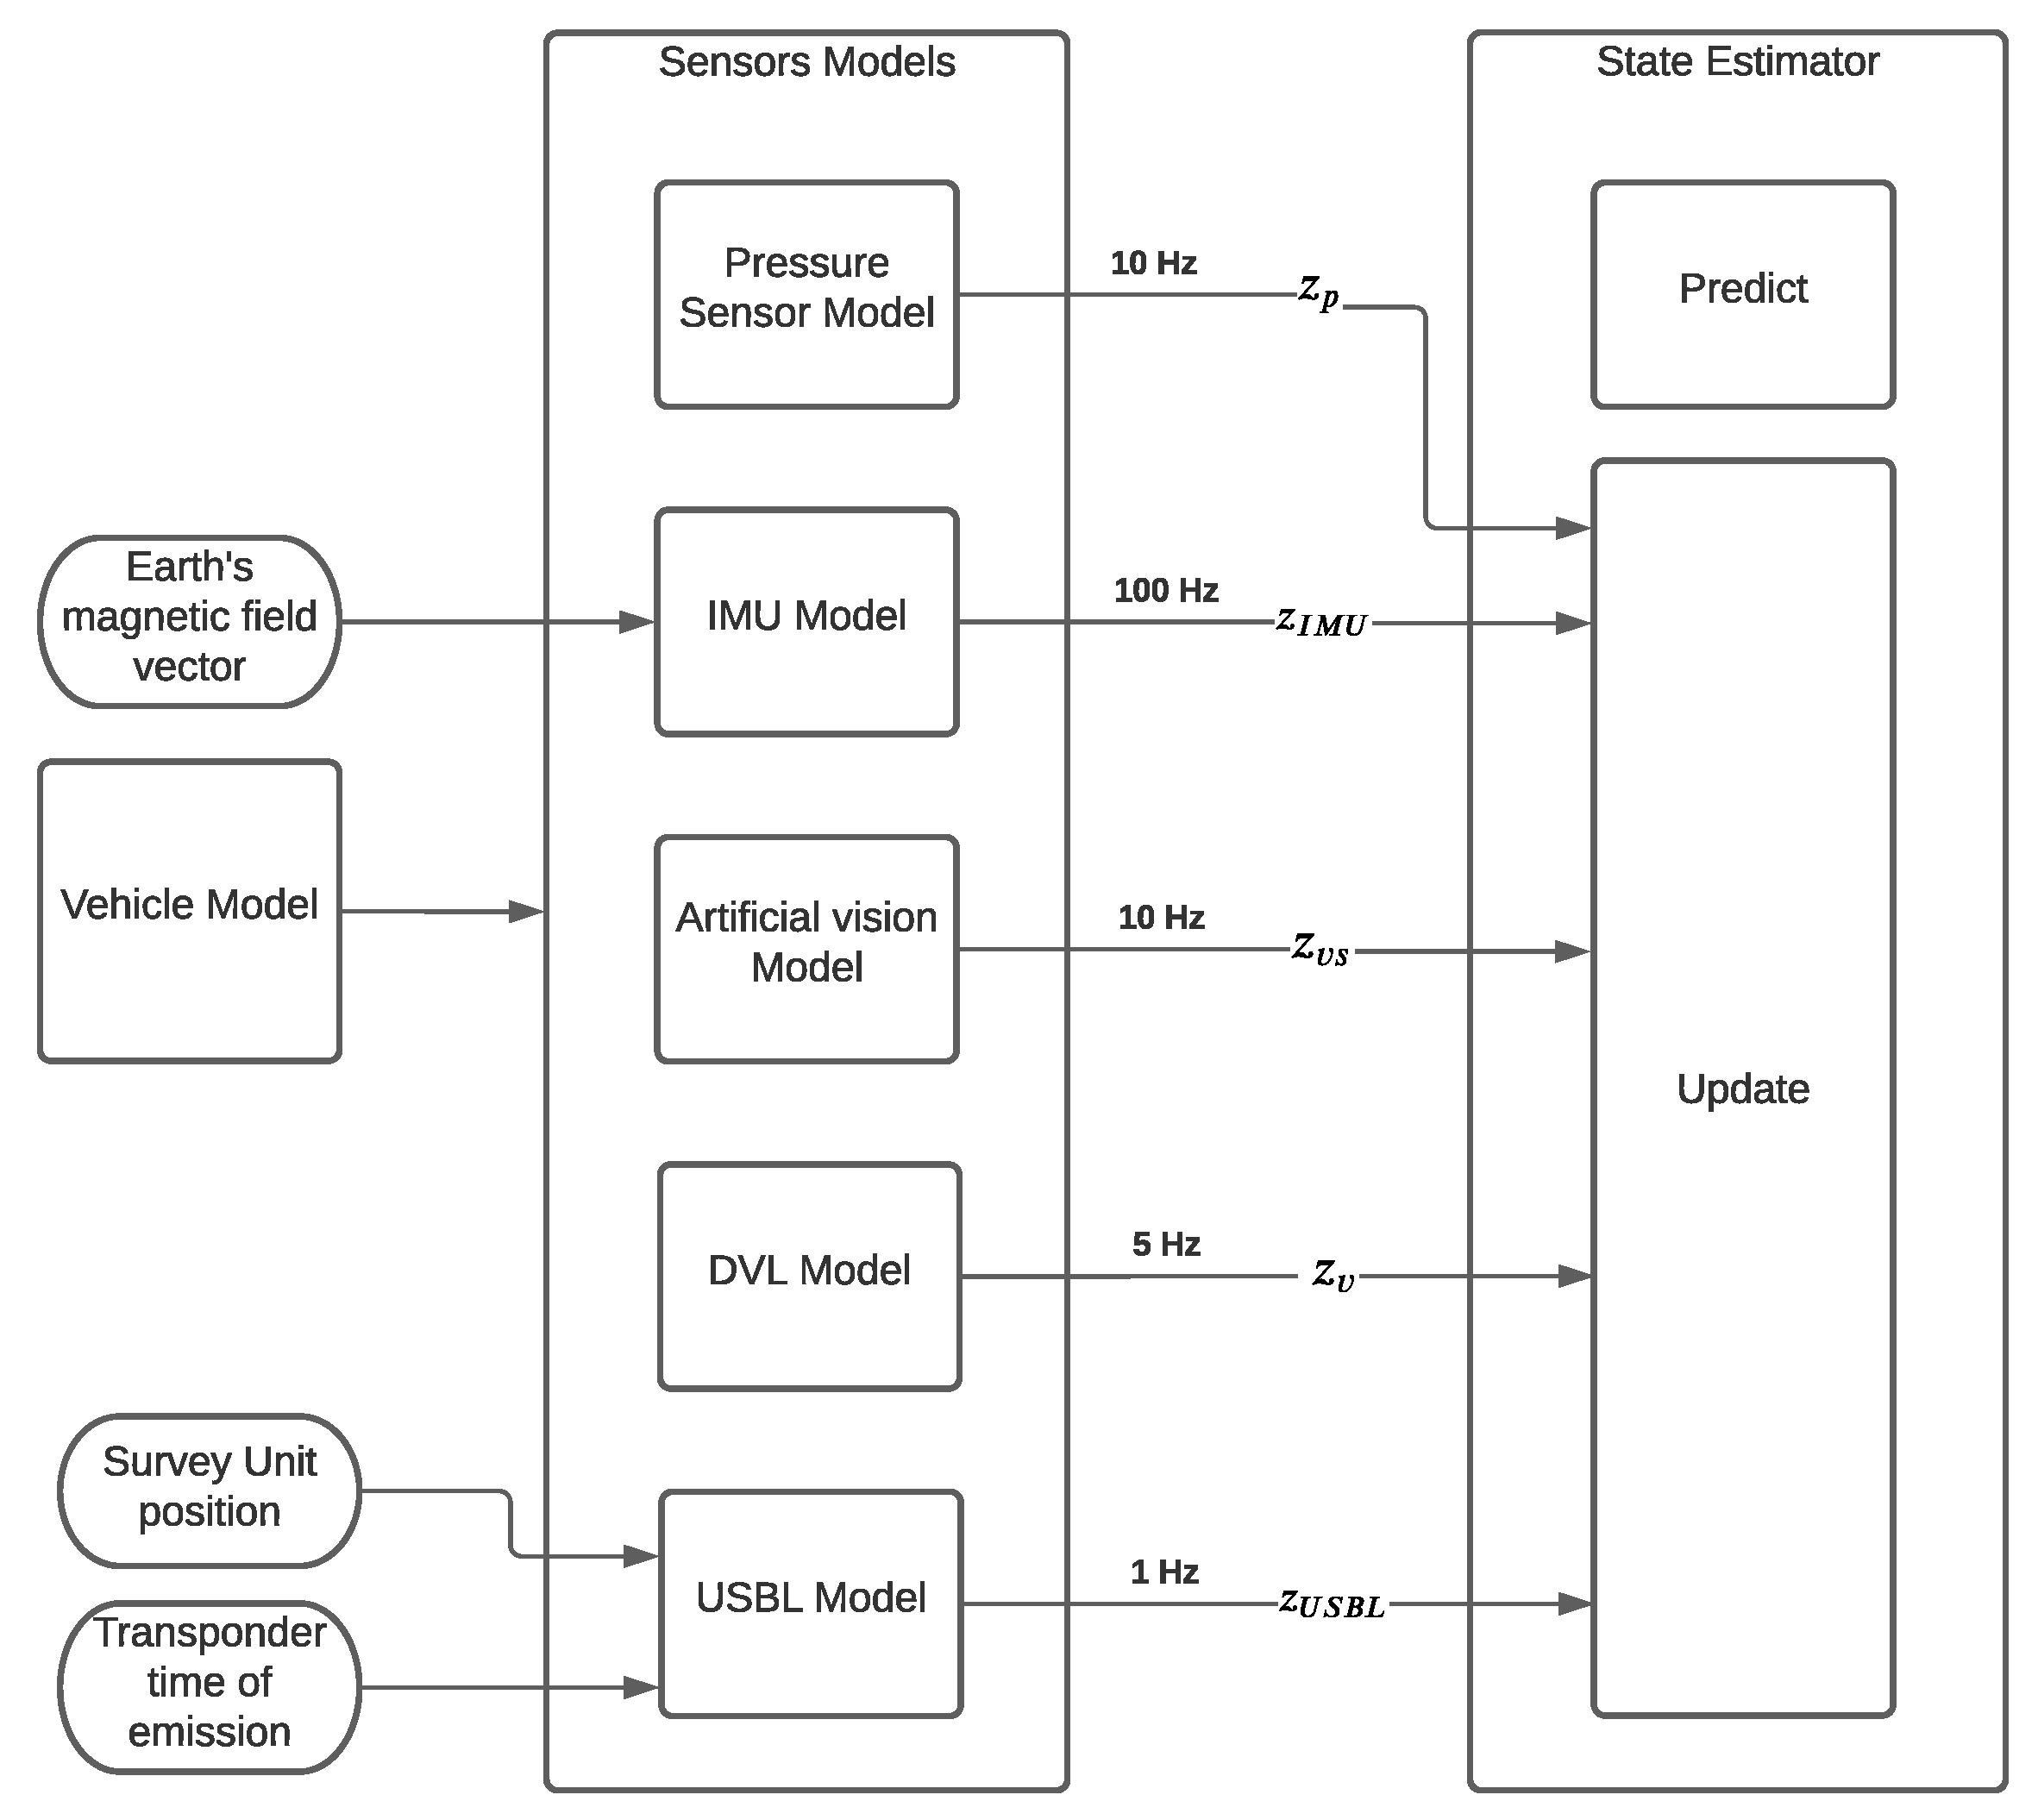
  • Acoustic receivers—considering an Ultra-Short BaseLine (USBL) configuration to measure bearing and range;
  • Artificial vision-based system—at shorter ranges, for more precise localization, an artificial vision-based system measures the relative position with respect to visual markers;
  • Inertial Measurement Unit (IMU)—composed of a three-axes gyroscope, a three-axes magnetometer, and a three-axes accelerometer, mainly used for attitude calculation;
  • Pressure sensor—a pressure sensor is used for depth measurement;
  • Doppler Velocity Log—a Doppler Velocity Log (DVL) is used for measurements of three-dimensional linear velocities.

4. Simple Theoretical Model

The equivalent throughput ( R b , e q ) is the main metric for evaluating the performance of a data muling solution such as GROW. This is defined by Equation (1), which considers the transferred data (in bits) between the SU and the CSU over the time (in seconds) the data took to be transferred.
R b , e q = D a t a s i z e T D R
In Equation (1), Datasize is the number of bits transferred. T D R is given by Equation (2) and depends on the following: (1) the undocking time T u , which represents the time for the DMU to move away from the CSU or the SU; (2) the travel time T t , which in turn depends on the distance between the SU and the CSU and the travel speed of the DMU; (3) the number of DMUs N available; (4) the docking time T d , which is the time that the high precision acoustic relative positioning and maneuvering system takes for approaching and accompanying the SU or the CSU; and (5) the transfer time ( T S R ), which is the time required for the file (or a chunk of the file) to be transferred over the short-range and high speed underwater link. In turn, the transfer time depends on the data size and the short-range link throughput. When compared with a typical communications system, the docking, undocking, and travel times can be seen as the propagation delay, while the short-range transfer to and from the DMU can be seen as the transmission delay.
T D R = T u + T t + N × T d + T S R N + T u + T t + T d + T S R N
Despite being a simple deterministic model, without localization errors or other external factors are considered, this simple model shows the theoretical limits of a data muling solution and establishes a baseline for performance comparison.

5. Underwater Data Muling Simulator (UDMSim)

Performing experiments underwater is expensive and complex in terms of logistics. Thus, it is important to be able to predict the performance of the data muling solution when different parameters are varied, such as the number of DMUs, the distance between the CSU and the SU, and the amount of data to be fetched from the SU. UDMSim is a simulation platform for underwater data muling oriented systems that combines the AUV Motion and Localization (AML) simulator with ns-3 and goes beyond the simple mathematical model presented in Section 4. In what follows, we describe each of these components. The UDMSim block diagram is shown in Figure 6. UDMSim is made available to the community [6] to support the evaluation of underwater data muling oriented communications solutions.

5.1. AUV Motion and Localization Simulator

The overall structure of the AML simulator is presented in Figure 7. AML implements a six degrees of freedom (DoFs) model of the AUV [49,50]. The model is based on the standard nonlinear dynamics and kinematics equations for an underwater vehicle [51] whose parameters have been previously derived and validated. This provides a realistic simulation of the vehicle although the exact models are very difficult or even impossible to derive. Along with the vehicle model, a target-tracking control algorithm running onboard the (real) vehicle is emulated, having the reference position (SU) and its own state (position and velocity) as inputs. The algorithm generates actuation commands to the thrusters on the output side. AML outputs a set of traces that define the “real” 6-axis position of the AUV (x, y, z, yaw, pitch, and roll) over the mission.
In general, underwater vehicles do not know their location perfectly. Their pose estimation relies on state estimators that fuse data coming from multiple sensors. As the sensors are corrupted by noise and other undesired effects, as described in Section 3.2, the resulting estimate is imperfect. This adds a time-varying error to the true state. Moreover, it has impact on the vehicle tracking performance as the controllers rely on the estimate to generate actuation commands. Although an appropriate choice of sensors may mitigate the problem, there is no way to circumvent estimate errors. Additionally, the enhanced estimation model, illustrated in Figure 7, is deliberately set with parameters that differ from the nominal model, aiming at bringing more realism to the simulation when compared with the previous models presented in [52]. In this model, the parameters were deliberately set with errors up to 50% of their nominal values. Details on the derivation of the extended Kalman filter and on the control laws are beyond the scope of this article. The simulation is run on Matlab Simulink, with a timestep of 10 m s , employing an ODE4 solver. The measurements from the sensors are set to be periodically output, at a constant rate.
In simulation, each sensor block receives as inputs the state variables from the vehicle model and other quantities such as the magnetic field vector and the absolute position of the SU. Then, it outputs the corresponding measurement to feed the EKF state estimator, as shown in Figure 8. To bring more realism to the simulation, it should be noted that some sensors may not provide measurements over the entire mission. For example, the camera tracks artificial markers that are assumed to be undetectable at distances over 2 m . This takes into account the common visibility issues found in the underwater environment due to turbidity and rapid attenuation of optical waves. Moreover, the measurements are not available when the markers fall outside the field of view of the camera. The pressure sensor measurement is modeled as a Gaussian distribution with a mean corresponding to the pressure of the column of water and a standard deviation to model the measurement error.
The IMU is modeled as a three-axes accelerometer, a three-axes gyroscope, and a three-axes magnetometer. The measurements of the accelerometers account for the acceleration of the vehicle, as well as for the effects of gravity. The measurement variances of the accelerometers and gyroscopes are calculated based on the bandwidth and the noise power spectral density of the sensors. Each measurement of accelerometers and gyroscopes is further added to a constant bias. The magnetometers measurements are based on the Earth’s magnetic field mapped in the varying referential frame of the vehicle. The magnetometer variance is modeled as the total root mean square noise of the sensor.
The USBL measurements are composed of a set of times of arrival (TOAs) to each of the four hydrophones in the USBL receiver located in the DMU. The TOAs are calculated based on a simulated time of emission with an emission frequency of 1 Hz that corresponds to the emission times of the transponder’s signal located in the SU. To simulate the measurements, the USBL model also considers the position of each hydrophone, the sound speed in seawater, and the SU’s position. Each TOA is corrupted with an error following a Gaussian distribution. For what concerns velocity sensing, the DVL measures the body velocity with respect to the surrounding water, in the longitudinal and transversal axes. A Gaussian distribution with the same variance for the noise on the two axes is assumed. The relative three-dimensional position of the vehicle’s camera with respect to the visual marker attached to the SU is provided by an artificial vision module. The measurements on the three axes are equally affected by a Gaussian noise.
Table 2 summarizes the sensors models parameters. These are either based on technical specifications from manufacturers or on previous experimental results from which it was possible to characterize the performances of the sensors.

5.2. ns-3 Based Simulator

By using the traces provided by the AML simulator, UDMSim considers a trace-based network simulation in ns-3 [53], an open-source, discrete-event network simulator mainly used for research and educational purposes. The trace-based simulation approach was presented in [54]. It consists of a technique that feeds ns-3 with traces, including node positions and Signal-to-Noise Ratio (SNR) at the receiver. It provides more accurate results and allows reproducing real-world experiments.
Despite offering several models for devices and protocols for wired and wireless networks, ns-3 lacks native underwater optical and RF propagation models. Therefore, the RF underwater model presented in [28] was used in UDMSim. The SNR value was computed in Matlab and added to each entry of the trace provided by AML. This step was necessary to meet the requirements of the ns-3 TraceBasedPropagationLossModel. Through the trace-based simulation approach, the native mobility and propagation models of ns-3 were replaced by the position of the AUV and SNR provided by the trace file imported into ns-3. Higher layers were simulated using native ns-3 modules. This enhanced version of the UDMSim includes the antenna radiation patterns (E-Plane and H-Plane) imported as a single .ant file with a one degree resolution. This allows evaluating antenna performance across the mission for different antenna location and design, especially during the docking and undocking procedures, where misalignments are prone to occur.
The ns-3 simulator implements the state machine of the GROW UDMP protocol, including an out-of-band acoustic signalling channel to enable the control of the DMUs and a broadband short-range RF for data transfer. Figure 9 shows the message sequence diagram for two DMUs [9]. The UDMP starts by requesting the data size using the control link, and it splits the data file into different chunks according to the number of DMUs available (two in this case). The DMUs depart from the CSU according to the positions defined in the traces. When the DMU reaches a distance of 2 m from the SU, a docking request is sent. If successful, the DMU continues its approach. When the short-range link is available, the ns-3 BulkSendApplication transfers the respective chunk of data. Due to the sharp SNR decay with the distance, the Minstrel auto rate mechanism is used and the data exchange application is monitored and restarted if the association between the DMU and SU is lost or in the case where the TCP retransmission timeout is exceeded. When the transfer is complete, the DMU performs the same process in reverse order. Upon the completion of the data upload to the CSU, ns-3 computes the equivalent throughput R b , e q , taking into consideration the overhead of the DTN stack.
Considering the modular architecture of UDMSim, new sensors and navigation modes can be added to the AML Simulator, allowing simulating different types of AUVs. Moreover, despite the usage of RF as short-range technology, other underwater propagation models, such as optical and short-range acoustic communications, can be considered if supported by ns-3.

6. Evaluation Results

The UDMSim was validated in two different seawater scenarios. The first scenario—docked—considers that the DMU is physically docked or is very close (≤10 cm) to the SU through the use of a docking station or an umbilical antenna, similar to the refuel system of a jet plane. This scenario is more suitable for stationary SUs, such as a sea lander or an observatory, and allows the usage of a 20 MHz radio channel based on IEEE 802.11 g/n point-to-point link that may operate at a carrier frequency ranging from 40 MHz to 2.4 GHz, as demonstrated in [30]. The second scenario—1 m apart—considers that the DMU approaches and tries to maintain a 1 m distance from the SU, which can be fixed or mobile; an example of a fixed SU is shown in Figure 10. In this case, according to the attenuation of RF signals underwater, especially in seawater [28], carrier frequencies in the range 10–20 MHz should be used. To minimize the SNR differences of the OFDM subcarriers across the IEEE 802.11 channel and since it is not possible to use a 20 MHz channel on a 10 MHz carrier, the bandwidth was reduced in this case to 5 MHz.
In order to evaluate the impact of the localization errors on the communications system, two sets of simulations were run. The first considered perfect localization—PerfectNav. The second relied on a state estimator using imperfect measurements from sensors—RealisticNav—an enhanced version of the ImperfectNav presented in [52]. The outputs of the simulator on the realistic localization are the true poses of the DMU and SU, which are imported to ns-3 by using the TraceBasedPropagationLossModel. Figure 11 shows the distance and SNR when the DMU travels 1000 m from the CSU to the SU on the 1 m apart scenario and the corresponding SNR variation for the PerfectNav and RealisticNav. We can observe that the distance between the DMU and the SU decreases in a linear manner across the journey, and there is no connectivity until the two nodes are close to each other.
Figure 12 shows a closer view of the final approach, where we can see the position error, the strong SNR variations, and even connection losses (SNR ≤ 0), which have a negative impact on the short-range throughput. In Figure 13, we can also observe the effect of different antenna alignments on the SNR. UDMSim is able to consider the radiation pattern of the antenna on the DMU and SU and compute the SNR along the mission. We then compare different dipole positions to the isotropic antenna case, i.e., considering that the antenna has a uniform, unitary gain in all directions. If two vertical dipoles are used, perpendicular to the DMU and SU and similar to the ones used in [55], we can observe that the SNR decreases when compared with the isotropic antenna. Since the DMU has a negative pitch, the antennas are not aligned; thus, its gain is reduced. We should also take into consideration the azimuth, since the H-plane of the antenna might change from freshwater to seawater [55]. In this case, the azimuth did not have a significant impact on the SNR. By averaging the negative pitch of the AUV and performing an elevation compensation of the dipole on the AUV by 65 (relative to the perpendicular of the vehicle), we were able to achieve an SNR closer to the isotropic antenna. Using two vertical dipoles or one vertical and one horizontal dipole resulted in significant SNR losses. Depending on the scenario considered, other type of antennas can be analyzed by UDMSim, such as loop antennas [56]. The optimization of the antenna beam, either physically or by electrical beamforming, is out of the scope of this work.
The UDMSim results were compared against the theoretical results obtained using Equation (1) and the parameters of Table 3 for one and two DMUs [9], a TxPower of 30 dBm, and two dBi loop antennas. The simulation results were also compared with experimental results obtained by using a underwater testbed composed of two DMUs, one SU, and one CSU, as shown in Figure 14 [9]. Watertight cylinders were used, and a 2.4 GHz IEEE 802.11n network was employed for the short-range link. Two different data sizes were considered: 200 MB and 500 MB. The maximum data were limited by the DTN implementation used in the testbed (IBR-DTN) [57]. Since the Wi-Fi card driver used only supported 20 and 40 MHz channels, experimental results were only obtained for the docked scenario. Each ns-3 simulation was repeated five times with different seeds and the results were averaged. The confidence intervals obtained were short. For the sake of visualization, they are not represented in Figure 12, Figure 13, Figure 14 and Figure 15.
Figure 15 shows the equivalent throughput ( R b , e q ) over distance between 100 m and 5000 m for 1 DMU, considering the transfer of 200 and 500 MB of data for the docked scenario. We can observe that UDMSim matches the experimental and theoretical values for PerfectNav (no localization errors). Due to the position errors of RealisticNav, as seen in Figure 12, the link quality changes accordingly and so does the short-range throughput. UDMSim is able to simulate this phenomenon where the RealisticNav can exceed the theoretical model, especially for ranges below 500 m, due to the fact that high SNR results in higher short-range throughput, making the data exchange faster than expected. We can also observe that the equivalent throughput increases with the amount of data to be exchanged since the travel time has the major impact on the equivalent throughput R b , e q .
When considering two DMUs for the docked scenario, we can observe in Figure 16 that UDMSim also matches the theoretical and experimental results. The usage of two DMUs increases the equivalent throughput, which is more noticeable for short distances, where the data transfer time is more relevant.
The equivalent throughput for the 1 m apart scenario is shown in Figure 17. With an SNR around 15 dB, the theoretical short-range throughput is 3 Mbit/s. Although this value was fixed in the theoretical model, the Minstrel auto rate mechanism available in ns-3 was kept active in UDMSim; this can justify the slightly higher results obtained for PerfectNav and RealisticNav for the 500 MB case. RealisticNav still shows sometimes lower equivalent throughput due to the signal variations, which in some cases results in TCP timeouts and re-associations, providing the realism lacking in the simple theoretical model presented in Section 4.
When deploying two DMUs for the 1 m apart scenario, we can observe in Figure 18 that the UDMSim results also match the theoretical values, with a 28% equivalent throughput increase for PerfectNav at 100 m and 10% equivalent throughput for RealisticNav. Although this margin fades out along the distance, UDMSim is able to simulate the advantage of using multiple DMUs for exchanging large amounts of data.
These results show that UDMSim is a powerful tool for the validation of underwater communications solutions based on data muling. Although GROW was a pioneer on a mobile SU approach, other data muling oriented solutions can be evaluated using UDMSim. Due to the specific DTN implementation used in our lab testbed, which limited the data exchange analysis to 500 MB, UDMSim was able to simulate larger amounts of data, which brought up the advantages of a data muling solution even more for underwater communications when compared with point-to-point acoustic, for instance. The experimental values obtained using the lab testbed considered no localization errors, which are very unlikely in a real scenario. In this case, UDMSim will be an important tool, since the position and signal variations make it difficult to derive an accurate theoretical system model, especially for distances up to some hundreds of meters. For distances over 1 km, the simple theoretical model provides a good approximation since the travel time is the predominant factor. UDMSim can also benefit from other traces as input, including traces captured from real experiments, allowing offline replication of real world in simulation environment.

7. Conclusions

The harshness of the sea environment is pushing the use of AUVs as a cost-effective and safe alternative to perform underwater missions. AUVs may collect large amounts of data from their onboard sensors that needs to be transferred to shore. A data muling solution outperforms the current long-range narrowband communications solutions.
In this paper, we proposed an enhanced version of the UDMSim, which is a simulator for data muling oriented underwater communications that combines a more realistic AUV Motion and Localization simulator with ns-3. UDMSim matches the results obtained using a simple theoretical model and the lab experimental results when no localization errors are considered. When localization errors are taken into account, UDMSim is able to reproduce them and simulate the signal and connection losses that will occur in real environment, thus enabling the evaluation of underwater data muling oriented communications in more realistic conditions. Moreover, we have shown that UDMSim is now able to simulate the effect of the antenna radiation patterns on the SNR during the mission, thus helping to evaluate the design and relative placement of underwater antennas. Future work includes new AUV control laws for more accurate simulations, a relative positioning system to cope with mobile SUs, and the comparison of UDMSim results with experimental results obtained in real environment.

Author Contributions

Conceptualization, F.B.T., B.M.F., R.C.; funding acquisition, F.B.T., B.M.F., N.A.C., J.C.A., R.C.; investigation, All authors; methodology, All authors; supervision, R.C.; All authors have read and agreed to the published version of the manuscript.

Funding

This work is financed by the FCT—Fundação para a Ciência e a Tecnologia (Portuguese Foundation for Science and Technology) within project GROW (PTDC/EEI-COM/29466/2017). The first author would like to thank the support from the FCT—Fundação para a Ciência e a Tecnologia (Portuguese Foundation for Science and Technology) under the scholarship SFRH/BD/88080/2012.

Institutional Review Board Statement

Not applicable.

Data Availability Statement

All data has been present in main text.

Conflicts of Interest

The authors declare no conflict of interest.

References

  1. Favali, P.; Beranzoli, L.; De Santis, A. SEAFLOOR OBSERVATORIES: A New Vision of the Earth from the Abyss; Springer Science & Business Media: New York, NY, USA, 2015. [Google Scholar]
  2. Sarradin, P.M.; Legrand, J.; Moreau, B.; Lanteri, N.; Cannat, M. Technical parameters, data from the COSTOF2 of the EGIM, EMSO-Azores observatory, 2017–2018. AGRIS 2018. Available online: https://www.seanoe.org/data/00455/56627/ (accessed on 6 July 2021).
  3. Venkatesan, R.; Tandon, A.; DAsaro, E.; Atmanand, M.A. (Eds.) Observing the Oceans in Real Time; Springer: Berlin, Germany, 2018. [Google Scholar] [CrossRef]
  4. Wynn, R.B.; Huvenne, V.A.; Le Bas, T.P.; Murton, B.J.; Connelly, D.P.; Bett, B.J.; Ruhl, H.A.; Morris, K.J.; Peakall, J.; Parsons, D.R.; et al. Autonomous Underwater Vehicles (AUVs): Their past, present and future contributions to the advancement of marine geoscience. Mar. Geol. 2014, 352, 451–468. [Google Scholar] [CrossRef] [Green Version]
  5. Sendra, S.; Lloret, J.; Jimenez, J.M.; Parra, L. Underwater Acoustic Modems. IEEE Sens. J. 2016, 16, 4063–4071. [Google Scholar] [CrossRef]
  6. GROW Project. Available online: https://grow.inesctec.pt (accessed on 2 July 2021).
  7. Rahman, R.; Frater, M. 5-Delay-tolerant networks (DTNs) for underwater communications. In Advances in Delay-Tolerant Networks (DTNs); Rodrigues, J., Ed.; Woodhead Publishing: Oxford, UK, 2015; pp. 81–103. [Google Scholar] [CrossRef]
  8. Khabbaz, M.J.; Assi, C.M.; Fawaz, W.F. Disruption-Tolerant Networking: A Comprehensive Survey on Recent Developments and Persisting Challenges. IEEE Commun. Surv. Tutor. 2012, 14, 607–640. [Google Scholar] [CrossRef]
  9. Teixeira, F.B.; Moreira, N.; Campos, R.; Ricardo, M. Data Muling Approach for Long-Range Broadband Underwater Communications. In Proceedings of the 2019 International Conference on Wireless and Mobile Computing, Networking and Communications (WiMob), Barcelona, Spain, 21–23 October 2019; pp. 1–4. [Google Scholar] [CrossRef]
  10. Moreira, N. Data Muling for Broadband and Long Range Wireless Underwater Communications. Master’s Thesis, Faculdade de Engenharia da Universidade do Porto, Porto, Portugal, 2019. Available online: https://hdl.handle.net/10216/121806 (accessed on 6 July 2021).
  11. Cho, H.H.; Chen, C.Y.; Shih, T.K.; Chao, H.C. Survey on underwater delay/disruption tolerant wireless sensor network routing. IET Wirel. Sens. Syst. 2014, 4, 112–121. [Google Scholar] [CrossRef] [Green Version]
  12. Rahim, M.S.; Casari, P.; Guerra, F.; Zorzi, M. On the performance of delay—Tolerant routing protocols in underwater networks. In Proceedings of the OCEANS 2011 IEEE—Spain, Santander, Spain, 6–9 June 2011; pp. 1–7. [Google Scholar] [CrossRef]
  13. Guo, Z.; Colombi, G.; Wang, B.; Cui, J.H.; Maggiorini, D.; Rossi, G.P. Adaptive Routing in Underwater Delay/Disruption Tolerant Sensor Networks. In Proceedings of the 2008 Fifth Annual Conference on Wireless on Demand Network Systems and Services, Garmisch-Partenkirchen, Germany, 23–25 January 2008; pp. 31–39. [Google Scholar] [CrossRef]
  14. Hansen, J.; Fourie, D.; Kinsey, J.C.; Pontbriand, C.; Ware, J.; Farr, N.; Kaiser, C.L.; Tivey, M. Autonomous acoustic-aided optical localization for data transfer. In Proceedings of the OCEANS 2015—MTS/IEEE Washington, Washington, DC, USA, 19–22 October 2015; pp. 1–7. [Google Scholar] [CrossRef]
  15. Dunbabin, M.; Corke, P.; Vasilescu, I.; Rus, D. Data muling over underwater wireless sensor networks using an autonomous underwater vehicle. In Proceedings of the 2006 IEEE International Conference on Robotics and Automation, (ICRA 2006), Orlando, FL, USA, 15–19 May 2006; pp. 2091–2098. [Google Scholar] [CrossRef] [Green Version]
  16. Jouhari, M.; Ibrahimi, K.; Tembine, H.; Ben-Othman, J. Underwater Wireless Sensor Networks: A Survey on Enabling Technologies, Localization Protocols, and Internet of Underwater Things. IEEE Access 2019, 7, 96879–96899. [Google Scholar] [CrossRef]
  17. Che, X.; Wells, I.; Dickers, G.; Kear, P.; Gong, X. Re-evaluation of RF electromagnetic communication in underwater sensor networks. IEEE Commun. Mag. 2010, 48, 143–151. [Google Scholar] [CrossRef]
  18. Lurton, X. An Introduction to Underwater Acoustics; Springer: Berlin/Heidelberg, Germany, 2010. [Google Scholar]
  19. Freitas, P. Evaluation of Wi-Fi Underwater Networks in Freshwater. Master’s Thesis, Faculdade de Engenharia da Universidade do Porto, Porto, Portugal, 2014. Available online: https://repositorio-aberto.up.pt/handle/10216/75691 (accessed on 6 July 2021).
  20. Farr, N.; Bowen, A.; Ware, J.; Pontbriand, C.; Tivey, M. An integrated, underwater optical /acoustic communications system. In Proceedings of the OCEANS’10 IEEE SYDNEY, Sydney, Australia, 24–27 May 2010; pp. 1–6. [Google Scholar] [CrossRef]
  21. Saeed, N.; Celik, A.; Al-Naffouri, T.Y.; Alouini, M.S. Underwater optical wireless communications, networking, and localization: A survey. Ad Hoc Netw. 2019, 94, 101935. [Google Scholar] [CrossRef] [Green Version]
  22. Kaushal, H.; Kaddoum, G. Underwater Optical Wireless Communication. IEEE Access 2016, 4, 1518–1547. [Google Scholar] [CrossRef]
  23. Han, S.; Noh, Y.; Liang, R.; Chen, R.; Cheng, Y.J.; Gerla, M. Evaluation of underwater optical-acoustic hybrid network. China Commun. 2014, 11, 49–59. [Google Scholar] [CrossRef]
  24. Cossu, G.; Corsini, R.; Khalid, A.M.; Balestrino, S.; Coppelli, A.; Caiti, A.; Ciaramella, E. Experimental demonstration of high speed underwater visible light communications. In Proceedings of the 2nd International Workshop on Optical Wireless Communications (IWOW), Newcastle Upon Tyne, UK, 21 October 2013. [Google Scholar] [CrossRef]
  25. Tang, S.; Dong, Y.; Zhang, X. On Link Misalignment for Underwater Wireless Optical Communications. IEEE Commun. Lett. 2012, 16, 1688–1690. [Google Scholar] [CrossRef]
  26. Brundage, H. Designing a Wireless Underwater Optical Communication System. Ph.D. Thesis, Massachusetts Institute of Technology, Cambridge, MA, USA, 2010. Available online: http://hdl.handle.net/1721.1/57699 (accessed on 6 July 2021).
  27. SA Photonic Neptune. Available online: http://www.saphotonics.com/wp-content/uploads/2017/02/Neptune-Datasheet.pdf (accessed on 2 July 2021).
  28. Teixeira, F.; Freitas, P.; Pessoa, L.; Campos, R.; Ricardo, M. Evaluation of IEEE 802.11 Underwater Networks Operating at 700 MHz, 2.4 GHz and 5 GHz. In Proceedings of the International Conference on Underwater Networks & Systems—WUWNET, Rome, Italy, 12–14 November 2014; ACM Press: New York, NY, USA, 2014. [Google Scholar] [CrossRef]
  29. Teixeira, F.; Campos, R.; Ricardo, M. IEEE 802.11 Rate Adaptation Algorithms in Underwater Environment. In Proceedings of the 10th International Conference on Underwater Networks & Systems, WUWNET ’15, Arlington, VA, USA, 22–24 October 2015; Association for Computing Machinery: New York, NY, USA, 2015. [Google Scholar] [CrossRef]
  30. Teixeira, F.; Santos, J.; Pessoa, L.; Pereira, M.; Campos, R.; Ricardo, M. Evaluation of Underwater IEEE 802.11 Networks at VHF and UHF Frequency Bands using Software Defined Radios. In Proceedings of the 10th International Conference on Underwater Networks & Systems—WUWNET, Arlington, VA, USA, 22–24 October 2015; ACM Press: New York, NY, USA, 2015. [Google Scholar] [CrossRef]
  31. Campagnaro, F.; Francescon, R.; Casari, P.; Diamant, R.; Zorzi, M. Multimodal underwater networks: Recent advances and a look ahead. In Proceedings of the International Conference on Underwater Networks & Systems, Halifax, NS, Canada, 6–8 November 2017; pp. 1–8. [Google Scholar]
  32. Burleigh, S.; Hooke, A.; Torgerson, L.; Durst, R.; Scott, K.; Fall, K.; Weiss, H. RFC 4838, Delay-Tolerant Networking Architecture. 2007. Available online: https://datatracker.ietf.org/doc/html/rfc4838/ (accessed on 6 July 2021).
  33. Scott, K.; Burleigh, S. RFC 5050, Bundle Protocol Specification. 2007. Available online: https://datatracker.ietf.org/doc/html/rfc5050 (accessed on 6 July 2021).
  34. Kebkal, V.; Kebkal, K.; Kebkal, O.; Komar, M. Experimental results of Delay-Tolerant Networking in underwater acoustic channel using S2C modems with embedded sandbox on-board. In Proceedings of the OCEANS 2015—Genova, Genova, Italy, 18–21 May 2015; pp. 1–6. [Google Scholar] [CrossRef]
  35. Su, Y.; Fan, R.; Jin, Z. ORIT: A Transport Layer Protocol Design for Underwater DTN Sensor Networks. IEEE Access 2019, 7, 69592–69603. [Google Scholar] [CrossRef]
  36. Soares, L. Wireless Underwater Broadband and Long Range Communications using Underwater Drones as Data Mules. Master’s Thesis, University of Porto, Porto, Portugal, 2017. Available online: https://hdl.handle.net/10216/106809 (accessed on 6 July 2021).
  37. Loureiro, J.P. High Definition Wireless Video Streaming using Underwater Data Mules. Master’s Thesis, Faculdade de Engenharia da Universidade do Porto, Porto, Portugal, 2021. Available online: https://repositorio-aberto.up.pt/handle/10216/133682 (accessed on 6 July 2021).
  38. Doniec, M.; Topor, I.; Chitre, M.; Rus, D. Autonomous, Localization-Free Underwater Data Muling Using Acoustic and Optical Communication. In Experimental Robotics: The 13th International Symposium on Experimental Robotics; Desai, J.P., Dudek, G., Khatib, O., Kumar, V., Eds.; Springer International Publishing: Heidelberg, Germany, 2013; pp. 841–857. [Google Scholar] [CrossRef] [Green Version]
  39. Raspante, F. Underwater mobile docking of autonomous underwater vehicles. In Proceedings of the 2012 Oceans, Hampton Roads, VA, USA, 14–19 October 2012; pp. 14–19. [Google Scholar] [CrossRef]
  40. Zwolak, K.; Wigley, R.; Bohan, A.; Zarayskaya, Y.; Bazhenova, E.; Dorshow, W.; Sumiyoshi, M.; Sattiabaruth, S.; Roperez, J.; Proctor, A.; et al. The Autonomous Underwater Vehicle Integrated with the Unmanned Surface Vessel Mapping the Southern Ionian Sea. The Winning Technology Solution of the Shell Ocean Discovery XPRIZE. Remote Sens. 2020, 12, 1344. [Google Scholar] [CrossRef] [Green Version]
  41. Chan, C.Y.; Motani, M. An Integrated Energy Efficient Data Retrieval Protocol for Underwater Delay Tolerant Networks. In Proceedings of the OCEANS 2007—Europe, Aberdeen, UK, 18–21 June 2007; pp. 1–6. [Google Scholar] [CrossRef]
  42. Magistretti, E.; Kong, J.; Lee, U.; Gerla, M.; Bellavista, P.; Corradi, A. A Mobile Delay-Tolerant Approach to Long-Term Energy-Efficient Underwater Sensor Networking. In Proceedings of the 2007 IEEE Wireless Communications and Networking Conference, Hong Kong, China, 11–15 March 2007; pp. 2866–2871. [Google Scholar] [CrossRef]
  43. Morgenroth, J.; Pögel, T.; Wolf, L. Live-Streaming in Delay Tolerant Networks. In Proceedings of the 6th ACM Workshop on Challenged Networks, CHANTS ’11, Las Vegas, NV, USA, 23 September 2011; Association for Computing Machinery: New York, NY, USA, 2011; pp. 67–68. [Google Scholar] [CrossRef] [Green Version]
  44. Lenas, S.A.; Burleigh, S.C.; Tsaoussidis, V. Reliable Data Streaming over Delay Tolerant Networks. In International Conference on Wired/Wireless Internet Communication; Koucheryavy, Y., Mamatas, L., Matta, I., Tsaoussidis, V., Eds.; Springer: Berlin/Heidelberg, Germany, 2012; pp. 358–365. [Google Scholar] [CrossRef]
  45. Lenas, S.A.; Burleigh, S.C.; Tsaoussidis, V. Bundle streaming service: Design, implementation and performance evaluation. Trans. Emerg. Telecommun. Technol. 2015, 26, 905–917. [Google Scholar] [CrossRef]
  46. Loureiro, J.P.; Teixeira, F.B.; Campos, R. Underwater High Definition Wireless Video Streaming using Data Muling. In Proceedings of the 2021 Joint EuCNC & 6G Summit, Porto, Portugal, 8–11 June 2021. [Google Scholar]
  47. Page, B.R.; Mahmoudian, N. AUV Docking and Recovery with USV: An Experimental Study. In Proceedings of the OCEANS 2019—Marseille, Marseille, France, 17–20 June 2019; pp. 1–5. [Google Scholar] [CrossRef]
  48. Palomeras, N.; Peñalver, A.; Massot-Campos, M.; Negre, P.L.; Fernández, J.J.; Ridao, P.; Sanz, P.J.; Oliver-Codina, G. I-AUV Docking and Panel Intervention at Sea. Sensors 2016, 16, 1673. [Google Scholar] [CrossRef] [PubMed]
  49. Ferreira, B.; Matos, A.; Cruz, N.; Pinto, M. Modeling and control of the MARES autonomous underwater vehicle. Mar. Technol. Soc. J. 2010, 44, 19–36. [Google Scholar] [CrossRef]
  50. Cruz, N.A.; Matos, A.C. The MARES AUV, a Modular Autonomous Robot for Environment Sampling. In Proceedings of the OCEANS 2008, Quebec City, QC, Canada, 15–18 September 2008; pp. 1–6. [Google Scholar] [CrossRef] [Green Version]
  51. Fossen, T.I. Guidance and Control of Ocean Vehicles. Ph.D. Thesis, University of Trondheim, Trondheim, Norway, 1999. Available online: http://resolver.tudelft.nl/uuid:2ea31f56-6db4-475b-afe6-d146cebbd7e9 (accessed on 6 July 2021).
  52. Teixeira, F.B.; Moreira, N.; Abreu, N.; Ferreira, B.; Ricardo, M.; Campos, R. UDMSim: A Simulation Platform for Underwater Data Muling Communications. In Proceedings of the 2020 16th International Conference on Wireless and Mobile Computing, Networking and Communications (WiMob), Thessaloniki, Greece, 12–14 October 2020; pp. 1–6. [Google Scholar] [CrossRef]
  53. Nsnam. ns3—A Discrete-Event Network Simulator for Internet Systems. Available online: http://www.nsnam.org (accessed on 6 July 2021).
  54. Fontes, H.; Campos, R.; Ricardo, M. A Trace-Based Ns-3 Simulation Approach for Perpetuating Real-World Experiments. In Proceedings of the Workshop on Ns-3; Association for Computing, WNS3 ’17, Porto, Portugal, 13–14 June 2017; Machinery: New York, NY, USA, 2017; pp. 118–124. [Google Scholar] [CrossRef]
  55. Inácio, S.I.; Pereira, M.R.; Santos, H.M.; Pessoa, L.M.; Teixeira, F.B.; Lopes, M.J.; Aboderin, O.; Salgado, H.M. Dipole antenna for underwater radio communications. In Proceedings of the 2016 IEEE Third Underwater Communications and Networking Conference (UComms), Lerici, Italy, 30 August–1 September 2016; pp. 1–5. [Google Scholar] [CrossRef]
  56. Inácio, S.I.; Pereira, M.R.; Santos, H.M.; Pessoa, L.M.; Teixeira, F.B.; Lopes, M.J.; Aboderin, O.; Salgado, H.M. Antenna design for underwater radio communications. In Proceedings of the OCEANS 2016—Shanghai, Shanghai, China, 10–13 April 2016; pp. 1–6. [Google Scholar] [CrossRef] [Green Version]
  57. IBRDTN. Available online: https://github.com/ibrdtn/ibrdtn (accessed on 6 July 2021).
Figure 1. EGIM observatory deployed in July 2017 and recovered in August 2018 at the Lucky Strike hydrothermal vent site [1,2].
Computers 10 00119 g001
Figure 2. The GROW concept, which consists of Data Mule Units that operate between a Survey Unit and a Central Station Unit.
Computers 10 00119 g002
Figure 3. Bit rate over range for different underwater acoustic, optical and RF systems and the area filled by the GROW solution (based on [31]).
Computers 10 00119 g003
Figure 4. The UDMP protocol stack.
Computers 10 00119 g004
Figure 5. Block diagram of the iterative Extended Kalman Filter: prediction step and update step upon sensor measurement.
Computers 10 00119 g005
Figure 6. UDMSim block diagram.
Computers 10 00119 g006
Figure 7. AML simulator block diagram.
Computers 10 00119 g007
Figure 8. Block diagram of sensors in the AUV simulator. The real state and known external quantities (left-hand side) are used to simulate the sensors. The sensors feed the state estimator at different rates.
Computers 10 00119 g008
Figure 9. Message sequence diagram for two Data Mule Units.
Computers 10 00119 g009
Figure 10. 3Three-dimensional simulation of a DMU approaching an SU.
Computers 10 00119 g010
Figure 11. Distance and SNR of a DMU travelling 1000 m from the CSU to the SU using PerfectNav and RealisticNav.
Computers 10 00119 g011
Figure 12. A closer look on DMU approaching the SU for a 1000 m distance using PerfectNav and RealisticNav.
Computers 10 00119 g012
Figure 13. The SNR effect on antenna alignment on DMU approaching the SU for a 1000 m distance using RealisticNav.
Computers 10 00119 g013
Figure 14. Testbed used to evaluate the GROW solution.
Computers 10 00119 g014
Figure 15. Equivalent throughput for one DMU on the docked scenario.
Computers 10 00119 g015
Figure 16. Equivalent throughput for two DMUs in the docked scenario.
Computers 10 00119 g016
Figure 17. Equivalent throughput for one DMU in the 1 m apart scenario.
Computers 10 00119 g017
Figure 18. Equivalent throughput for two DMUs in the 1 m apart scenario.
Computers 10 00119 g018
Table 1. Comparison of commercial devices and research devices [5].
Underwater Acoustic
Modem
ModulationCarrier
Frequency
BandwidthData RateTX Power
Consumption
RX Power
Consumption
Idle Power
Consumption
Max.
Distance
DEVICES DEVELOPED BY RESEARCH GROUPS
A. Sánchez et al.FSK320 Hz and
10 kHz
1 kHz96 bps and
2400 bps
12 mW24 mW3 μ W100 m
N. Farr et al.n/an/an/a1–10 Mbpsn/an/an/a100 m
B. Benson et al.FSK35 kHz6 kHz200 bps750 mWn/a35 mW350 m
A. Sánchez et al.FSK85 kHzn/a1 kbps108 mW24 mW8.1 μ W240 m
E. M. Sözer et al.n/a9–14 kHz75 kHz1.2 kbpsn/an/an/a2000 m
N. Nowsheen et al.BPSK80 kHzn/a80 kbpsn/an/an/a50 m
I. Vasilescu et al.FSK30 kHzn/a300 bpsn/an/an/a400 m
L. Wu et al.FSK9 kHzn/a1900 bpsn/an/an/a200 m
COMMERCIAL DEVICES
Aquatec AQUAModem 1000n/a9.75 kHz4.5 kHz2000 bps20 W0.6 W1 mW5000 m
DSPComm AquaComm Marlinn/a23 kHz14 kHz480 bps1.8 W0.252 W1.8 mW1000 m
DSPComm AquaComm Makon/a23 kHz14 kHz240 bps1.8 W0.252 W1.8 mW100 m
DSPComm AquaComm Orcan/a14 kHz100 kHz100 bps0.252 W1.8 W25.2 mW3000 m
Desert Star Systems SAM-1n/a37.5 kHz9 kHz154 bps32 W0.168 Wn/a1000 m
EvoLogics S2CR 48/78 USBLn/a48–78 kHz30 kHz31,200 bps18 W1.1 W2.5 mW1000 m
EvoLogics S2CR 40/80 USBLn/a38–64 kHz26 kHz27,700 bps40 W1.1 W2.5 mW1000 m
EvoLogics S2CR 18/34 WiSEn/a18–34 kHz16 kHz13,900 bps35 W1.3 W2.5 mW3500 m
EvoLogics S2CR 12/24 USBLn/a13–24 kHz11 kHz9200 bps15 W1.1 W2.5 mW6000 m
EvoLogics S2CR 7/17 USBLn/a7–17 kHz10 kHz6900 bps40 W1.1 W2.5 mW8000 m
LinkQuest UWM1000n/a35,695 Hz17.85 kHz17,800 bps1 W0.75 W8 mW3500 m
LinkQuest UWM2000n/a35,695 Hz17.85 kHz17,800 bps2 W0.8 W8 mW1500 m
LinkQuest UWM2000Hn/a35,695 Hz17.85 kHz17,800 bps2 W0.8 W8 mW1500 m
LinkQuest UWM2200n/a71.4 kHz35.7 kHz35,700 bps6 W1 W12 mW1000 m
LinkQuest UWM3000n/a10 kHz5 kHz5000 bps12 W0.8 W8 mW3000 m
LinkQUest UWM3000Hn/a10 kHz5 kHz5000 bps12 W0.8 W8 mW3000 m
LinkQuest UWM4000n/a17 kHz8.5 kHz8500 bps7 W0.8 W8 mW4000 m
LinkQuest UWM10000n/a10 kHz5 kHz5000 bps40 W0.8 W9 mW1000 m
Teledyne Benthos Atm9xxPSK11.5 kHz
18.5 kHz
24.5 kHz
5 kHz15,360 bps20 W0.768 W16.8 mW6000 m
Teledyne Benthos Atm9xxMFSK11.5 kHz
18.5 kHz
24.5 kHz
5 kHz2400 bps20 W0.768 W16.8 mW6000 m
Teledyne Benthos Atm88xPSK11.5 kHz
18.5 kHz
5 kHz15,360 bps84 W0.756 W16.8 mW6000 m
Teledyne Benthos Atm88xFSK11.5 kHz
18.5 kHz
5 kHz2400 bps84 W0.756 W16.8 mW6000 m
TriTech MicronModemn/a22 kHz4 kHz40 bps7.92 W0.72 Wn/a500 m
uComm Underwter Acoustic Modemn/a26 kHzn/a9000 bps40 W60 mW3 mW3000 m
AM-OFDM-SOFDM21–27 kHzn/a1600 bps5–20 W0.7 W0.13 mW4000 m
MATS 3G 12 KHZn/a10–15 kHzn/aUp to 7400 bps75 W0.6 W40 mW15 km
GPM 3000 Acoustic ModemDSSSn/an/aUp to 1200 bps300 W1.8 W0.08 W25 km
Table 2. Sensor model parameters.
SensorUpdate Rate (HZ)Measurement BiasMeasurement Variance
Pressure100 Pa 9.80   ×   10 2   Pa 2
Accelerometer100 1.47   ×   10 4   ms 2 3.46   ×   10 4   m 2 s 4
Gyroscope100 3.49   ×   10 2   rad s 1 1.55   ×   10 5   rad 2 s 2
Magnetometer1000 T 1   ×   10 6   T 2
USBL10 s 3.6   ×   10 11   s 2
Artificial Vision100 m 6.25   ×   10 4   m 2
DVL50 m s 2 2.5   ×   10 3   m 2 s 2
Table 3. Parameters associated with the DMUs traveling between the CSU and the SU.
ParameterValue
Undocking time ( T u )1 s
Docking time ( T d )17 s
Data Mule Unit travel speed1.05 m/s
Number of Data Mule Units available1–2
Average short-range link throughput (20 MHz channel)27 Mbit/s
Publisher’s Note: MDPI stays neutral with regard to jurisdictional claims in published maps and institutional affiliations.

