
IoTSAS: An Integrated System for Real-Time Semantic Annotation and Interpretation of IoT Sensor Stream Data


1
Faculty of Contemporary Sciences and Technologies, South East European University, 1200 Tetovo, North Macedonia
2
Faculty of Electrical and Computer Engineering, University of Prishtina, 10000 Prishtinë, Kosovo
*
Author to whom correspondence should be addressed.
Computers 2021, 10(10), 127; https://0-doi-org.brum.beds.ac.uk/10.3390/computers10100127
Submission received: 6 September 2021
/
Revised: 3 October 2021
/
Accepted: 4 October 2021
/
Published: 11 October 2021
(This article belongs to the Special Issue Real-Time Systems in Emerging IoT-Embedded Applications)
Abstract
:Sensors and other Internet of Things (IoT) technologies are increasingly finding application in various fields, such as air quality monitoring, weather alerts monitoring, water quality monitoring, healthcare monitoring, etc. IoT sensors continuously generate large volumes of observed stream data; therefore, processing requires a special approach. Extracting the contextual information essential for situational knowledge from sensor stream data is very difficult, especially when processing and interpretation of these data are required in real time. This paper focuses on processing and interpreting sensor stream data in real time by integrating different semantic annotations. In this context, a system named IoT Semantic Annotations System (IoTSAS) is developed. Furthermore, the performance of the IoTSAS System is presented by testing air quality and weather alerts monitoring IoT domains by extending the Open Geospatial Consortium (OGC) standards and the Sensor Observations Service (SOS) standards, respectively. The developed system provides information in real time to citizens about the health implications from air pollution and weather conditions, e.g., blizzard, flurry, etc.
1. Introduction
The IoT is the network of objects or things containing technologies embedded with electronics, software, and sensors in order to enable these objects to be sensitive to the environment in which they are placed and to collect observed data and to transmit it to a centralized server in the form of streaming data, called sensor stream data [1]. Furthermore, sensors are accessible, discoverable, and controllable via the web, which is enabled by the Sensor Web. The standardization for the Sensor Web is defined by the Open Geospatial Consortium (OGC), named Sensor Web Enablement (SWE), which is divided into two parts: SWE information model (which includes Observations & Measurements (O&M), Transducer Model Language (TransducerML or TML), and Sensor Model Language (SensorML)); and SWE service model (which includes Sensor Observations Service (SOS), Web Notification Services (WNS), Sensor Alert Service (SAS), and Sensor Planning Service (SPS)) [2,3].
Complexity, dynamicity, standardization, generalization, and the large volume of unstructured sensor data streams are the major challenges for processing in real time. In addition, heterogeneous, distributed, and non-standard infrastructure and poor data representation have resulted in many sensor data streams being locked inside specific proprietary applications that are inaccessible to the wider community. Therefore, extracting contextual information essential for situational knowledge from the sensor stream data is very difficult (remains a significant burden for the IoT), especially when processing and interpretation of these data are required in real time [4,5,6,7]. Therefore, the objective of this research paper is the development of techniques for integration and interpretation of the semantic annotations into sensor stream data in real time.
In this context, adding semantic annotations into sensor stream data is expected to provide a better understanding and more meaningful descriptions to enable application areas of IoT to become much more intelligent [8]. Thus, what has been performed in this research paper is the development of several different annotations that are integrated in real time into the sensor stream data (in two IoT domains: air quality monitoring and weather alerts) and their interpretation in real time, informing citizens about the health implications of air pollution and weather conditions, e.g., blizzard, flurry, etc.
The main contributions of this paper are as follows:
- Developed annotation techniques for real-time integration of semantic into heterogeneous sensor stream data within the context of IoT.
- Developed techniques to enable interpreting semantically annotated of the context.
- An integrated system named IoTSAS that demonstrates the utility of the proposed research idea, which is tested in two IoT domains, such as air quality monitoring and weather alerts monitoring.
- The validity of IoTSAS and the proposed system architecture through the real sensor stream data from the World Air Quality Index is proved. Moreover, the performance of the system has been tested by 1,000,000 sensors observations at the same time.
The remainder of the paper is organized as follows. Section 2 introduces the proposed system: an overview of the system architecture, system implementation (including six modules of the system, such as real-time processing of integration and interpretation of semantics into sensor stream data module, data modeling module, IoT management metadata module, weather alerts and air quality monitoring modules, and Application Programming Interface (API) for external systems module), system network architecture, system security, and a sensor stream data simulator. Section 3 presents system testing results focused on system performance testing. Finally, Section 4 summarizes the paper and describes future research directions.
Related Work
The IoT represents an active scientific research field due to its importance in different domain applications. Sensors are one of the most important components of the IoT. Raw sensor stream data are useless unless properly annotated. Therefore, by adding semantic annotations with concept definitions from ontologies, the interpretations and understanding of sensor stream data are possible [8]. Sensor stream data that are stored in the repository (data store) as static data and then integrated with semantics are defined as non-real-time semantic annotation, while the real-time integration of sensor data as dynamic data with semantics is defined as real-time semantic annotation [1]. Our IoTSAS system works based on real-time semantic annotation.
Based on several literature reviews [1,9,10,11] for semantic sensor technologies in the IoT, there are still gaps in extracting new knowledge from sensor stream data, especially in the annotation of IoT heterogeneous sensor stream data with semantic in real time, which is the main objective of this paper.
In the following, some works are presented that address the issue of IoT semantics.
In paper [12], the integrations and analyzation of multiple heterogeneous streams of sensor data are explained with the goal of creating meaningful abstractions or features. They have implemented a framework, based on Semantic Web technologies, that creates annotations (e.g., blizzard, flurry, rain shower, and rain storm) from sensor steam data in real time. In this paper, the SPARQL rule is used to integrate semantic annotations into sensor stream data, while Spark Streaming is used for this purpose in our paper, which has shown better results, as observed in Section 3 “System Testing Results”. Furthermore, in our research paper and the annotations considered in the paper [12] also include other annotations from air quality monitoring of the IoT domain, such as AQI index, air pollution level, and health implications, and their interpretation is performed in real time.
In paper [13], a generic window-based IoT streaming data integration (ISDI) approach is proposed to deal with IoT data in different formats and subsequently introduced the algorithms to integrate IoT streaming data obtained from multiple sources. The ISDI is developed in Java on NetBeans IDE and is used as a time-based library, named Joda-Time. Unlike our approach, no stream processing system (such as Spark Streaming, Storm, Kafka, etc.) to support real-time and near real-time analytics for the streaming data sets is used. Therefore, our system has shown better performance, as presented in the Section 3. “System Testing Results”.
In paper [14], an IoT-Stream system for semantically annotating streams is presented. IoT-Stream is a lightweight semantic model, fully compatible and as an extension of the well-known SSN ontology (Semantic Sensor Network ontology), for stream annotations which facilitates the implementation of IoT applications dealing with stream sensory data.
In paper [15], a dynamic dashboarding platform for continuous monitoring of industrial fleets tackled both aforementioned problems by adopting Semantic Web of Things technologies. Aggregations, visualizations, and sensors can be discovered automatically, since they are provided as Representational State Transfer (RESTful) web services on a Web Thing Model compliant gateway. The gateway is designed to provide semantic annotations of the Web Things, which describes what their abilities are.
In paper [16], the applicability of semantic technologies in the IoT is presented for ad hoc integration and processing of heterogeneous data sources for static and streaming data, providing more flexible and efficient processing techniques. The conceptual architecture is based on the OpenIoT framework, extended with continuous query processing and IoT intelligence. In paper [17], a new Purpose-Oriented Situation-Aware Access Control (PO-SAAC) framework for software services is presented. The practical applicability of the PO-SAAC framework is demonstrated by the implementation of a software in the healthcare domain.
2. Proposed System
2.1. System Architecture—An Overview
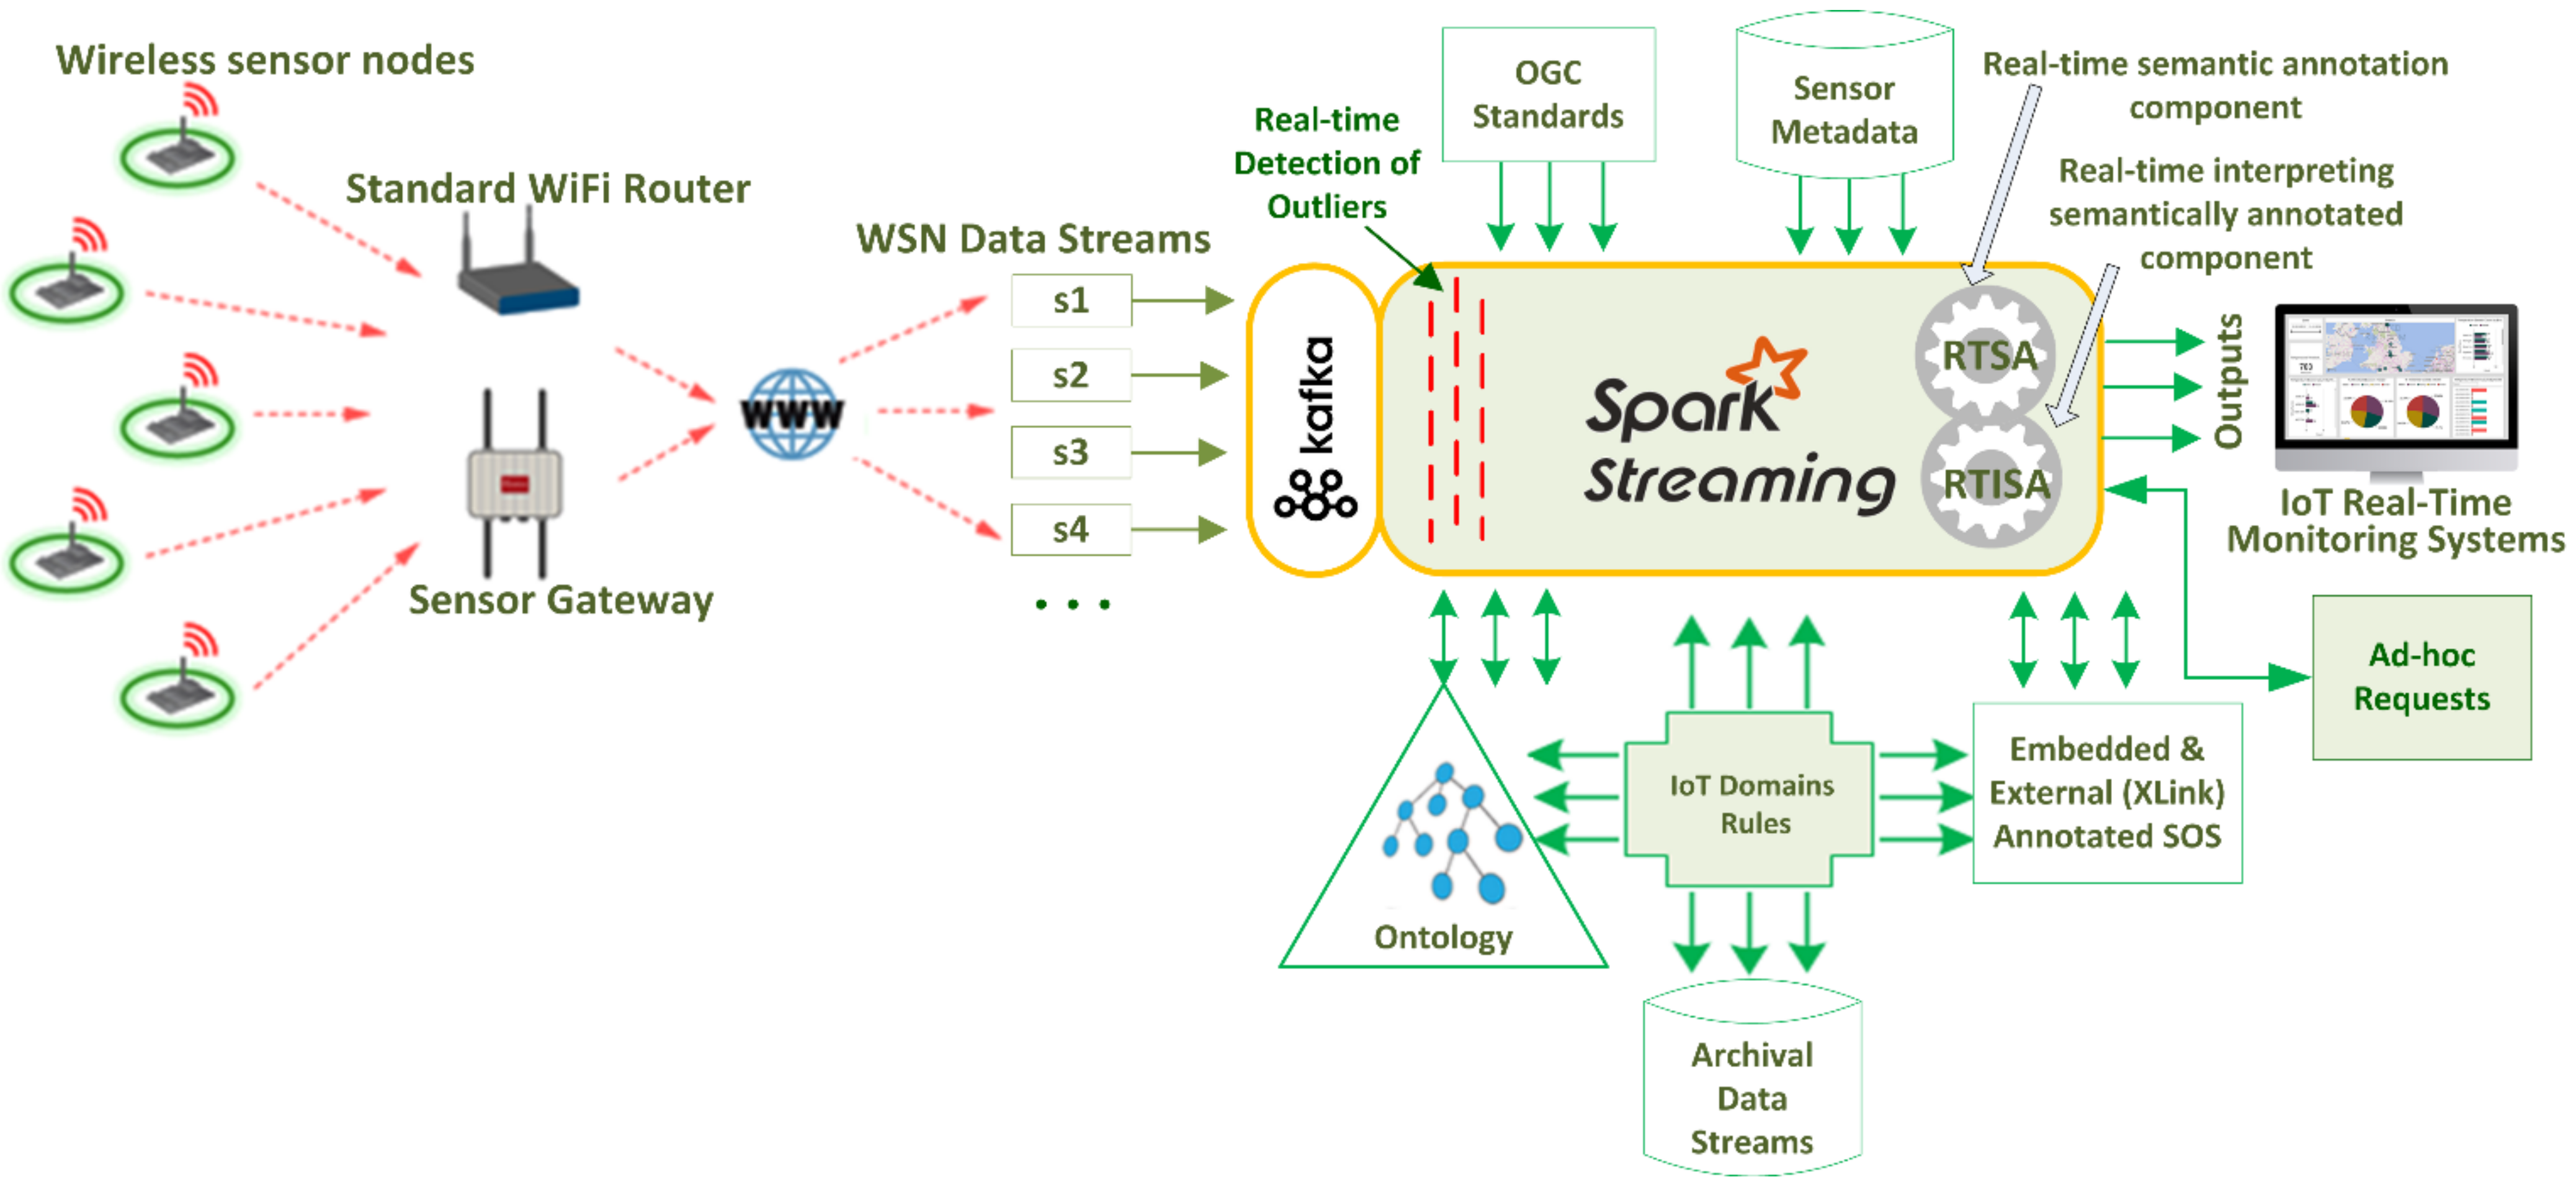
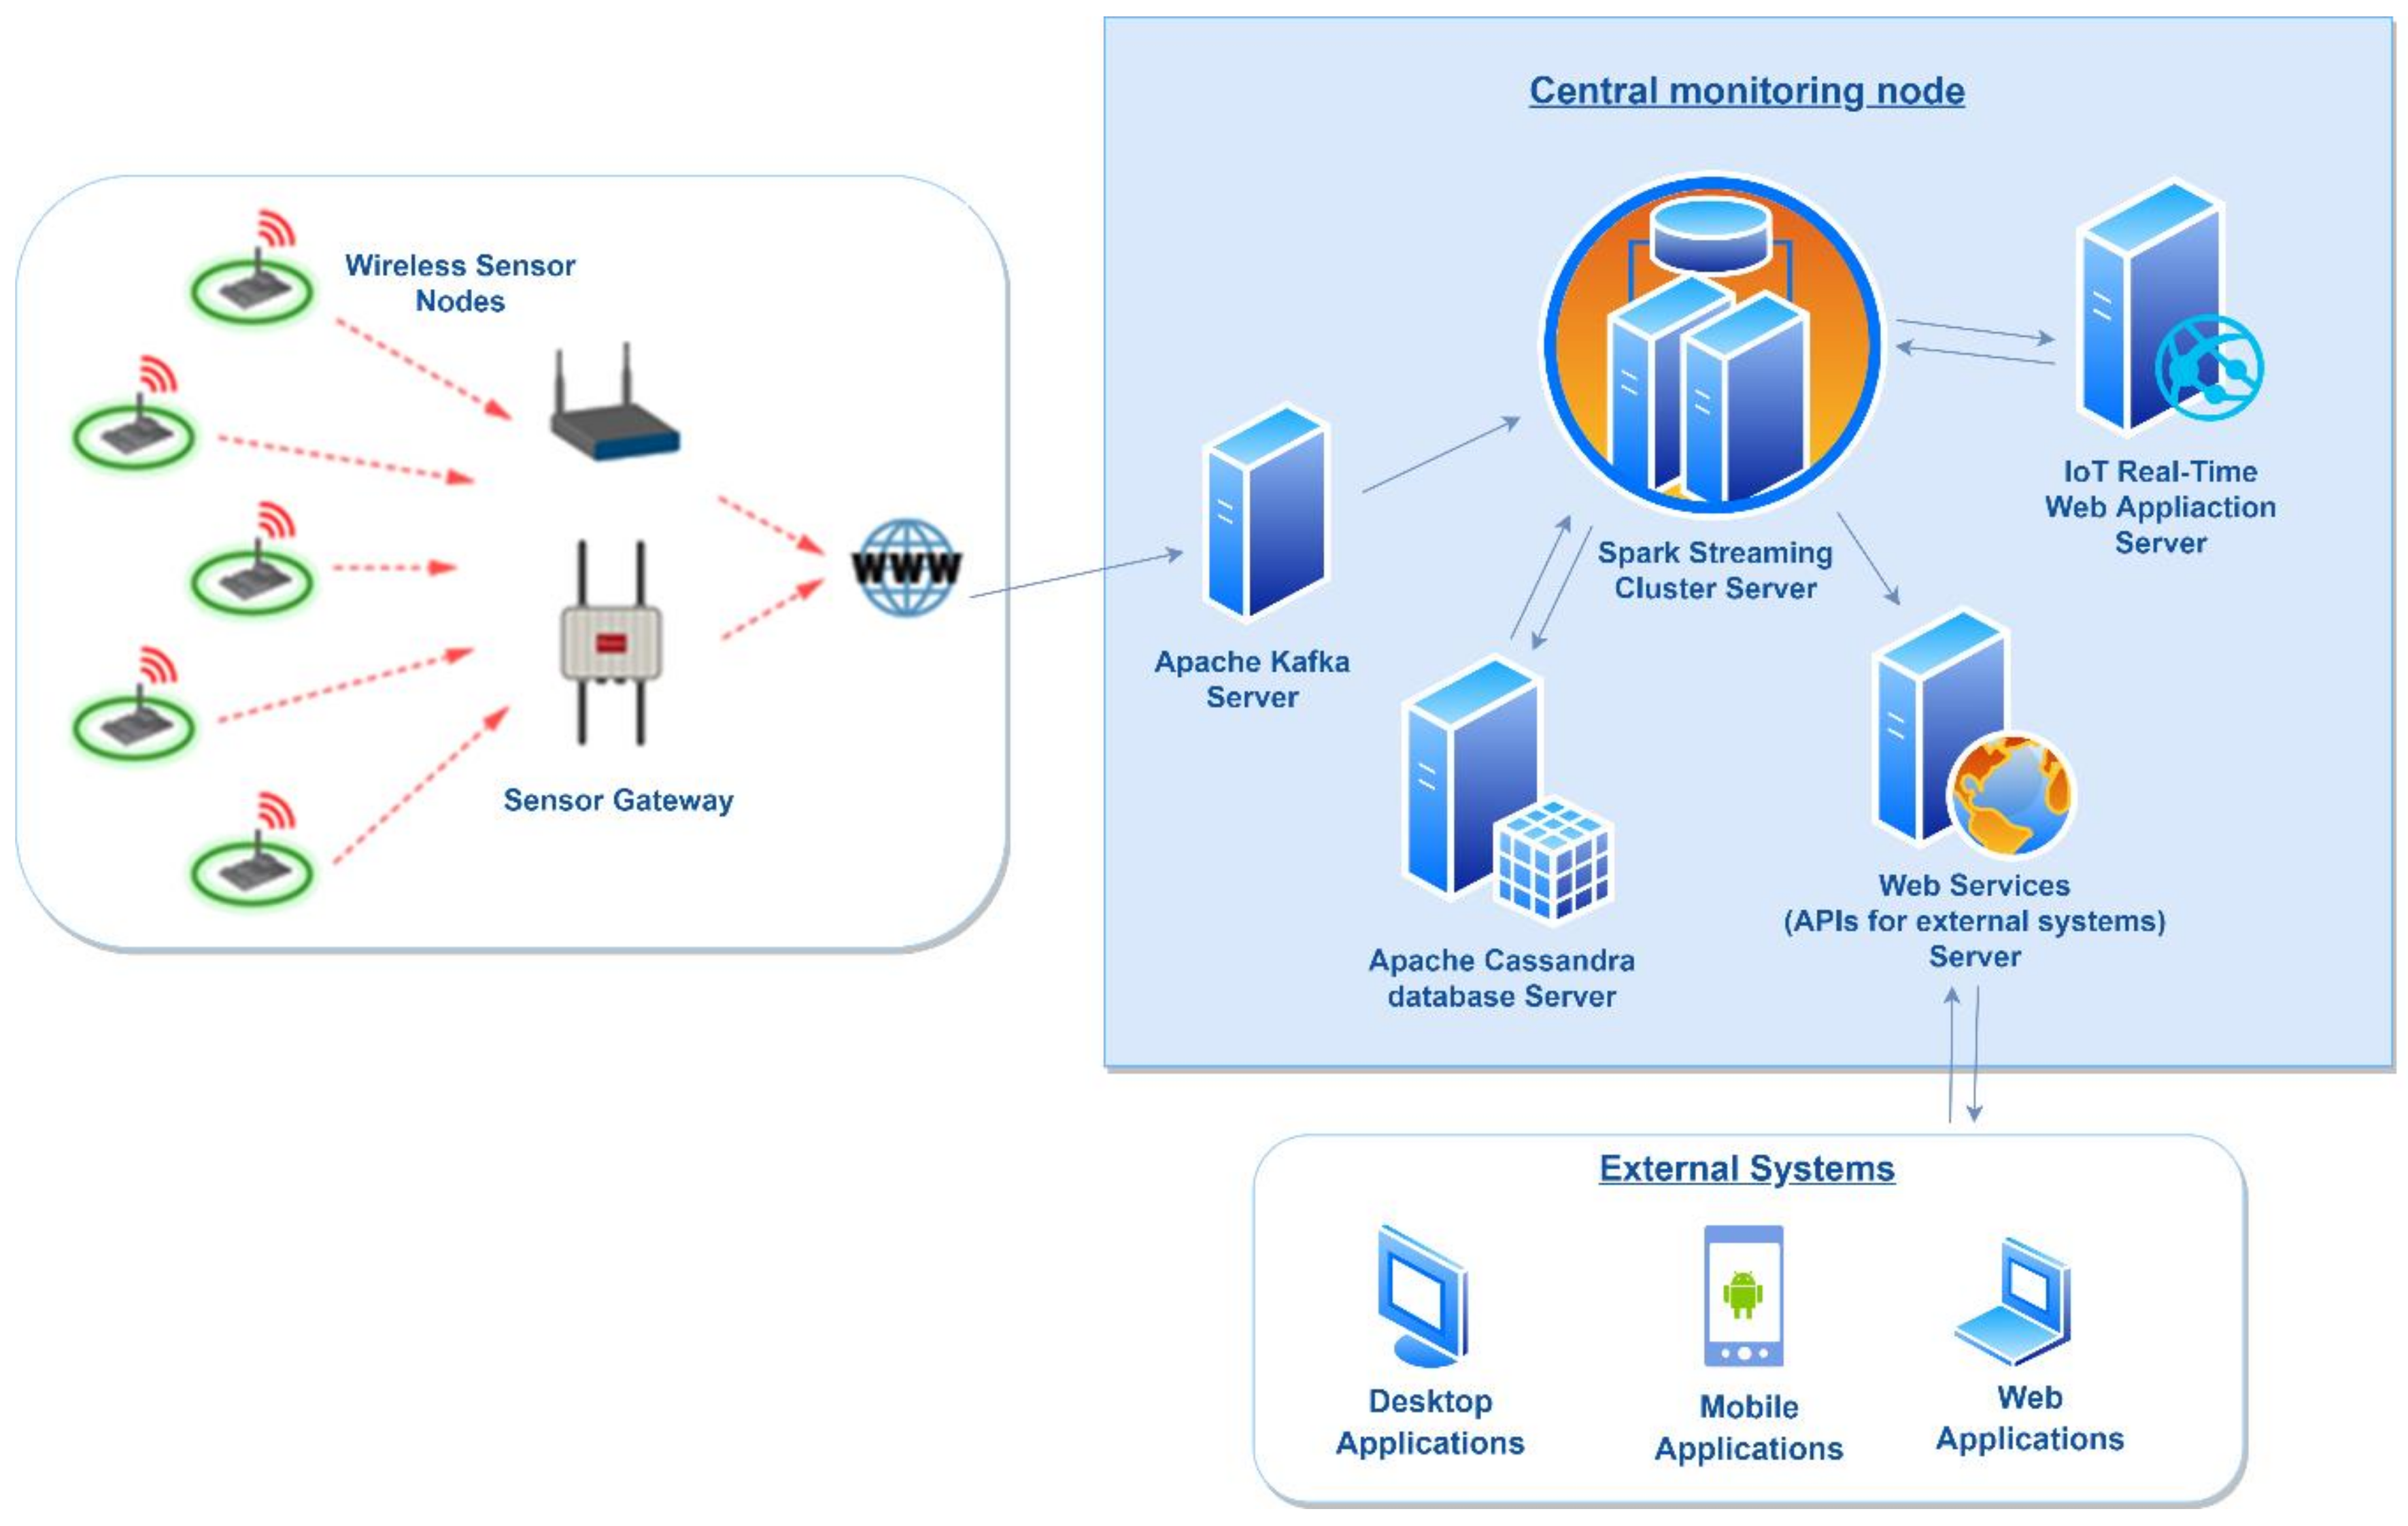
In Figure 1, an overview of the system architecture for real-time integration and interpretation of semantics into heterogeneous sensor stream data within the context of the Internet of Things is presented. The proposed real-time semantic annotation system utilizes Spark Streaming, Apache Kafka, Apache Cassandra database, and SOS O&M standards.
The heterogeneous sensor stream data forming the IoT-based sensor device is wirelessly transmitted to serve as the “producer” for the Kafka server. The “producer” client publishes streams of data to Kafka “topics” distributed across one or more cluster nodes/servers called “brokers”. The published streams of data from Kafka are then processed by Apache Spark Streaming in parallel and real time.
The Kafka server is utilized to receive various formats of sensor data streams (e.g., text, binary, JavaScript Object Notation (JSON), Extensible Markup Language (XML), etc.) and to transform them in a particular format that will be processed by Spark Streaming. The transformed sensor data stream will relay real-time detection process of outliers, which is implemented inside Spark Streaming. A data stream object is considered an outlier if it does not conform to the expected behavior, which corresponds to either noise or anomaly. Outliers can arise due to different reasons such as mechanical faults, other changes in the system, fraudulent behavior, instrument error, human error, or natural deviation.
The sensor data streams that are not identified as outliers for further semantic annotations processing pass to the Real-Time Semantic Annotation (RTSA) component, which is developed inside Spark Streaming. Next, the interpretation of the semantic annotations is performed by the other component called Real-Time Interpreting Semantically Annotated (RTISA), which additionally is developed inside Sparking Streaming.
The explanation of these two components is as follows:
- Real-Time Semantic Annotation (RTSA) enables real-time integration of semantics into heterogeneous sensor stream data within the context of the Internet of Things. RTSA uses sensor metadata, archival data streams, and mining data streams for adding semantic annotations with concept definitions from ontologies or other semantic sources, which allows the understanding of senor data and metadata elements. The semantic annotations are implemented into SOS O&M by using stakes, such as External XML Linking Language (XLink) or Embedded to add annotations in XML files. External annotations can point to extra sources of information (e.g., a file) or to Uniform Resource Name (URN), while Embedded annotations are only a single value-scalar of semantic annotation.
- Real-Time Interpreting Semantically Annotated (RTISA) enables real-time interpretation of semantics from heterogeneous sensor observation data and sensor metadata within the context of the Internet of Things. In other words, it executes and interprets stake annotated expressions, such as External (XLink) or Embedded.
The enriched sensor data stream with the semantic annotations results are stored in the database (in our case Cassandra database) and are displayed in IoT Real-Time Monitoring Systems. It is worth mentioning that Spark Streaming will process sensor data stream in the format of OGC standards such as SWE, respectively, version 2.0 of the SOS standard (SOS 2.0 relies on the OGC O&M) to encode semantic annotations and data gathered by sensors [2].
Furthermore, as shown in Figure 1, our system architecture supports ad hoc requests (queries executed ad hoc from users). An ad hoc request is a question asked once about the current state of a stream or streams.
The real-time processing aspects that characterize the IoTSAS system involves a continual input of heterogeneous sensor stream data, processed with semantic annotations and interpretations, and output of data in format of SOS O&M standards and served to IoT real-time monitoring systems, with very short latency requirements for processing.
2.2. Implementation
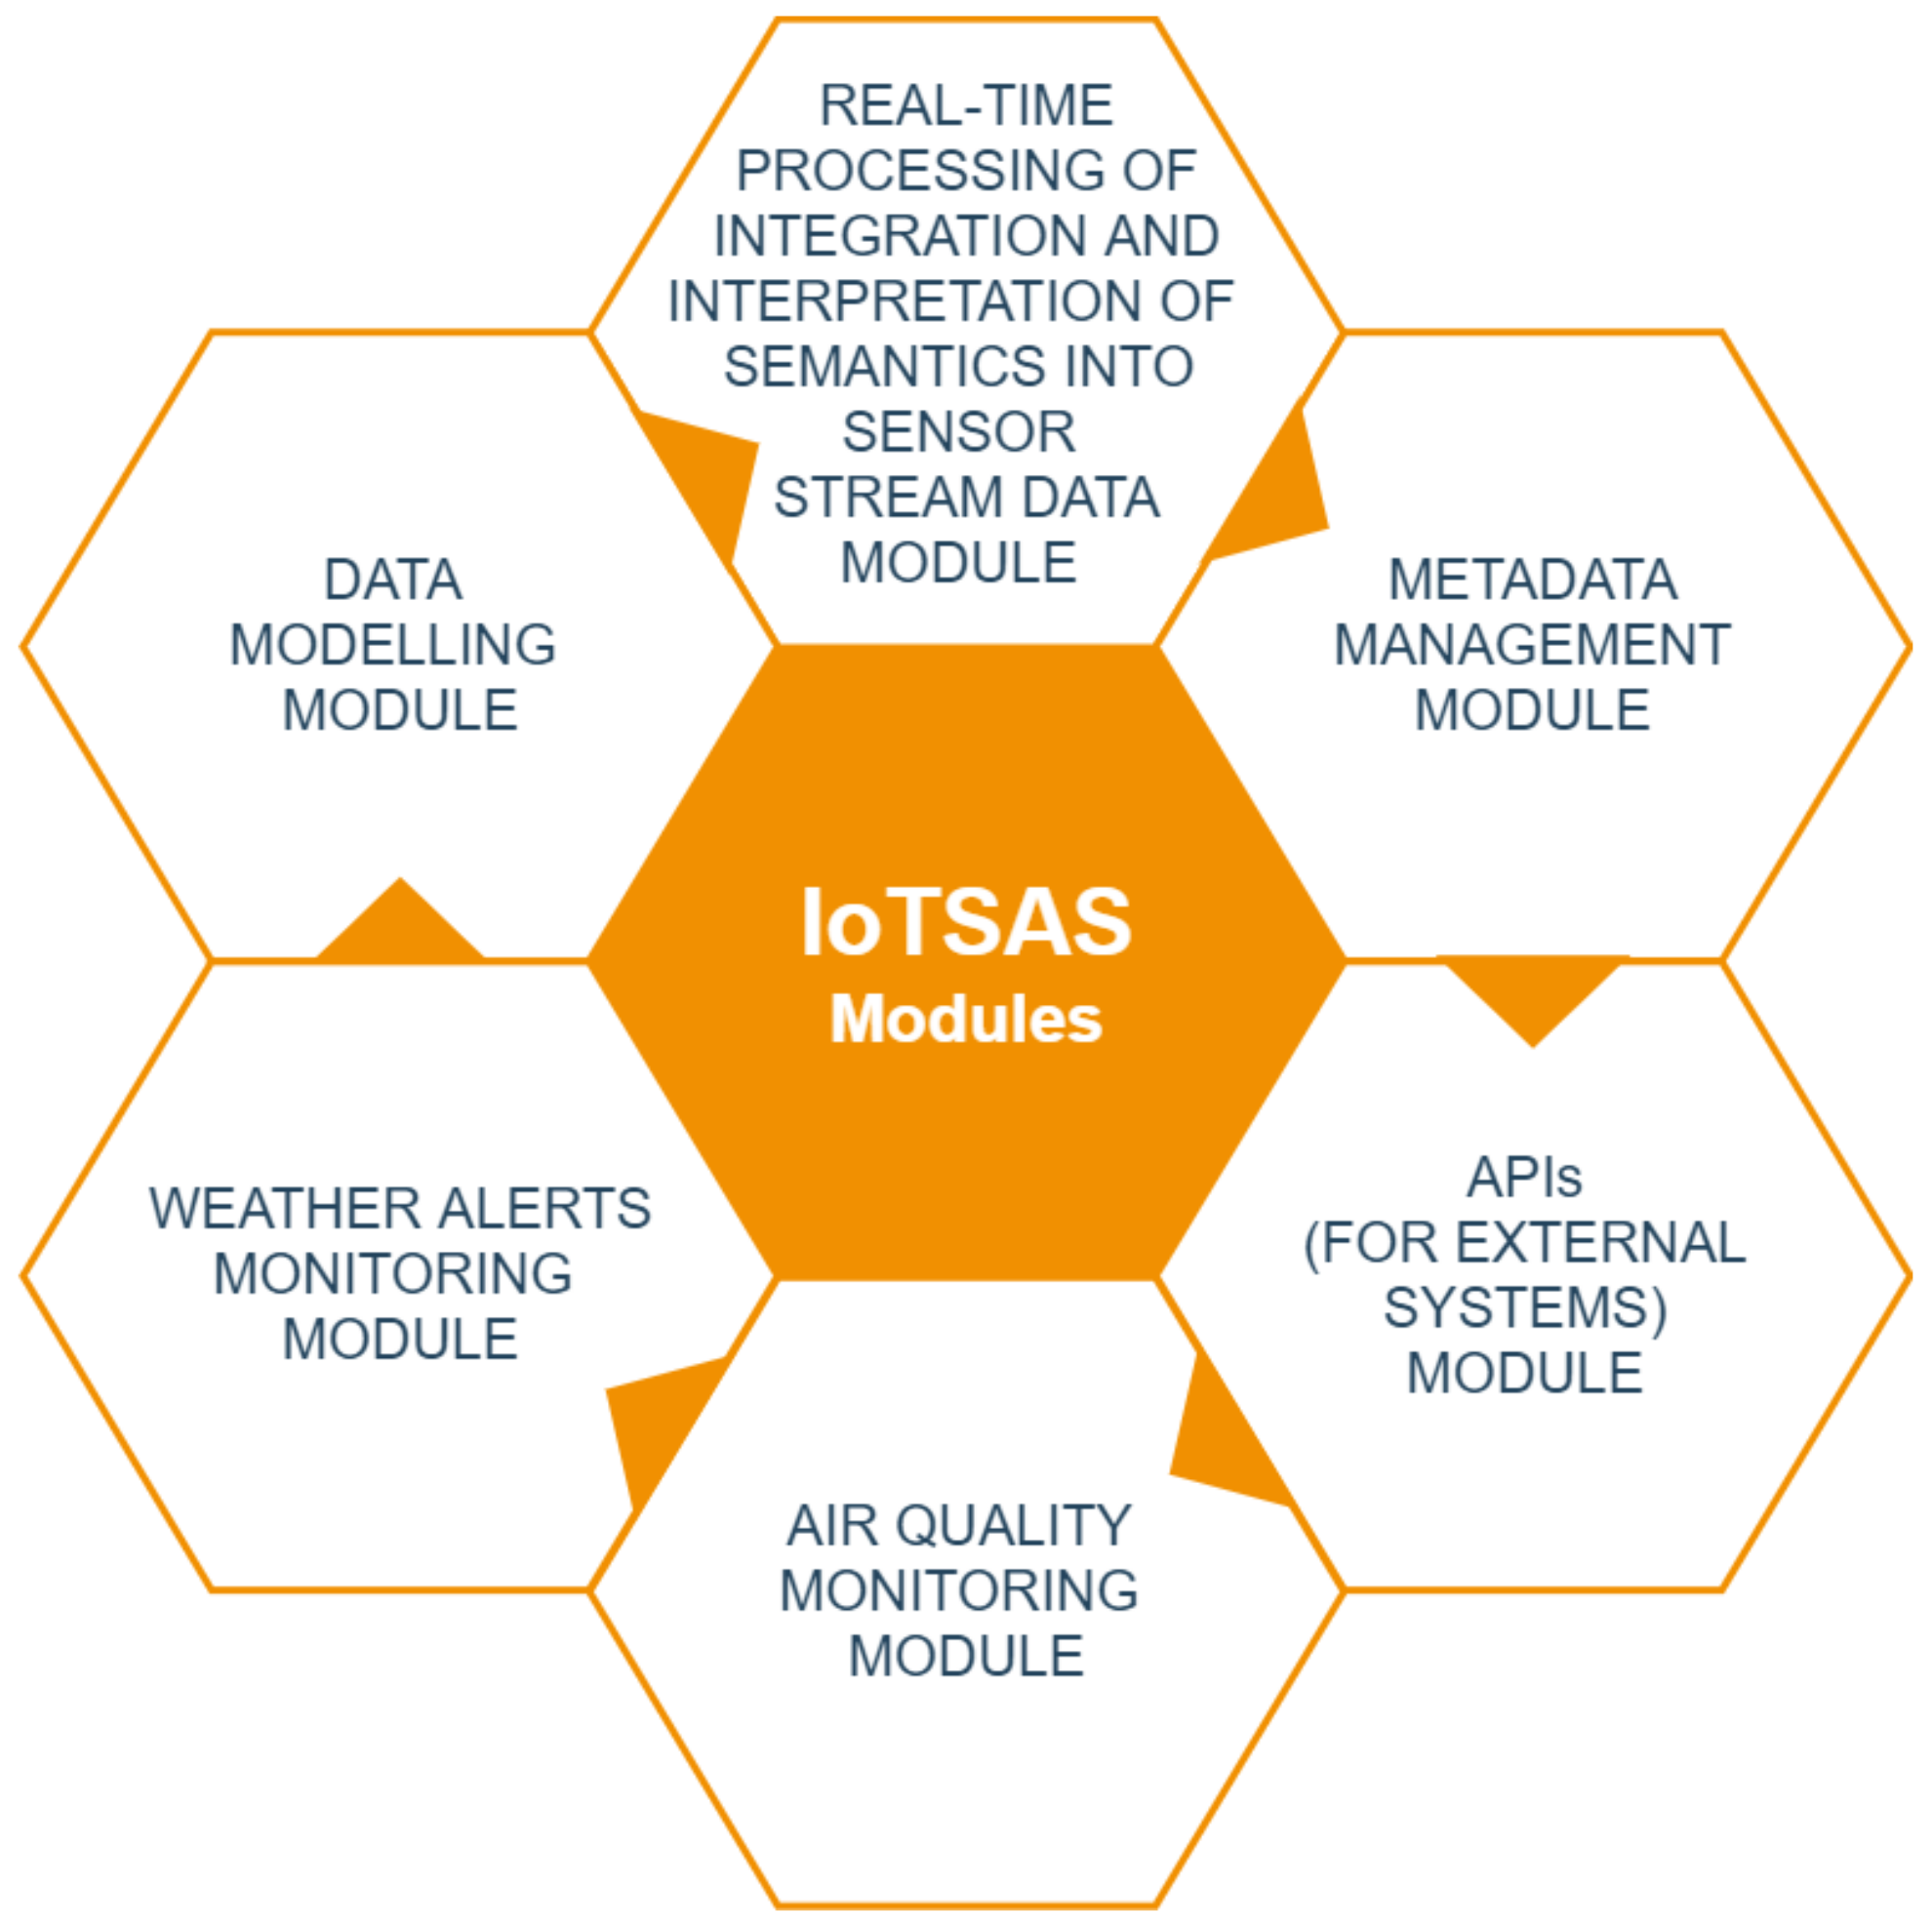
To validate the proposed model and techniques for integration and interpretation of the semantic annotation in real time into heterogeneous sensor observation data and metadata with context in the IoT, a prototype system named IoT Semantic Annotations System (IoTSAS) is implemented, which contains modules, as shown in Figure 2: real-time processing of integration semantics into sensor stream data module, metadata management module, air quality and weather alerts monitoring module, data modelling module, and APIs module (for external systems).
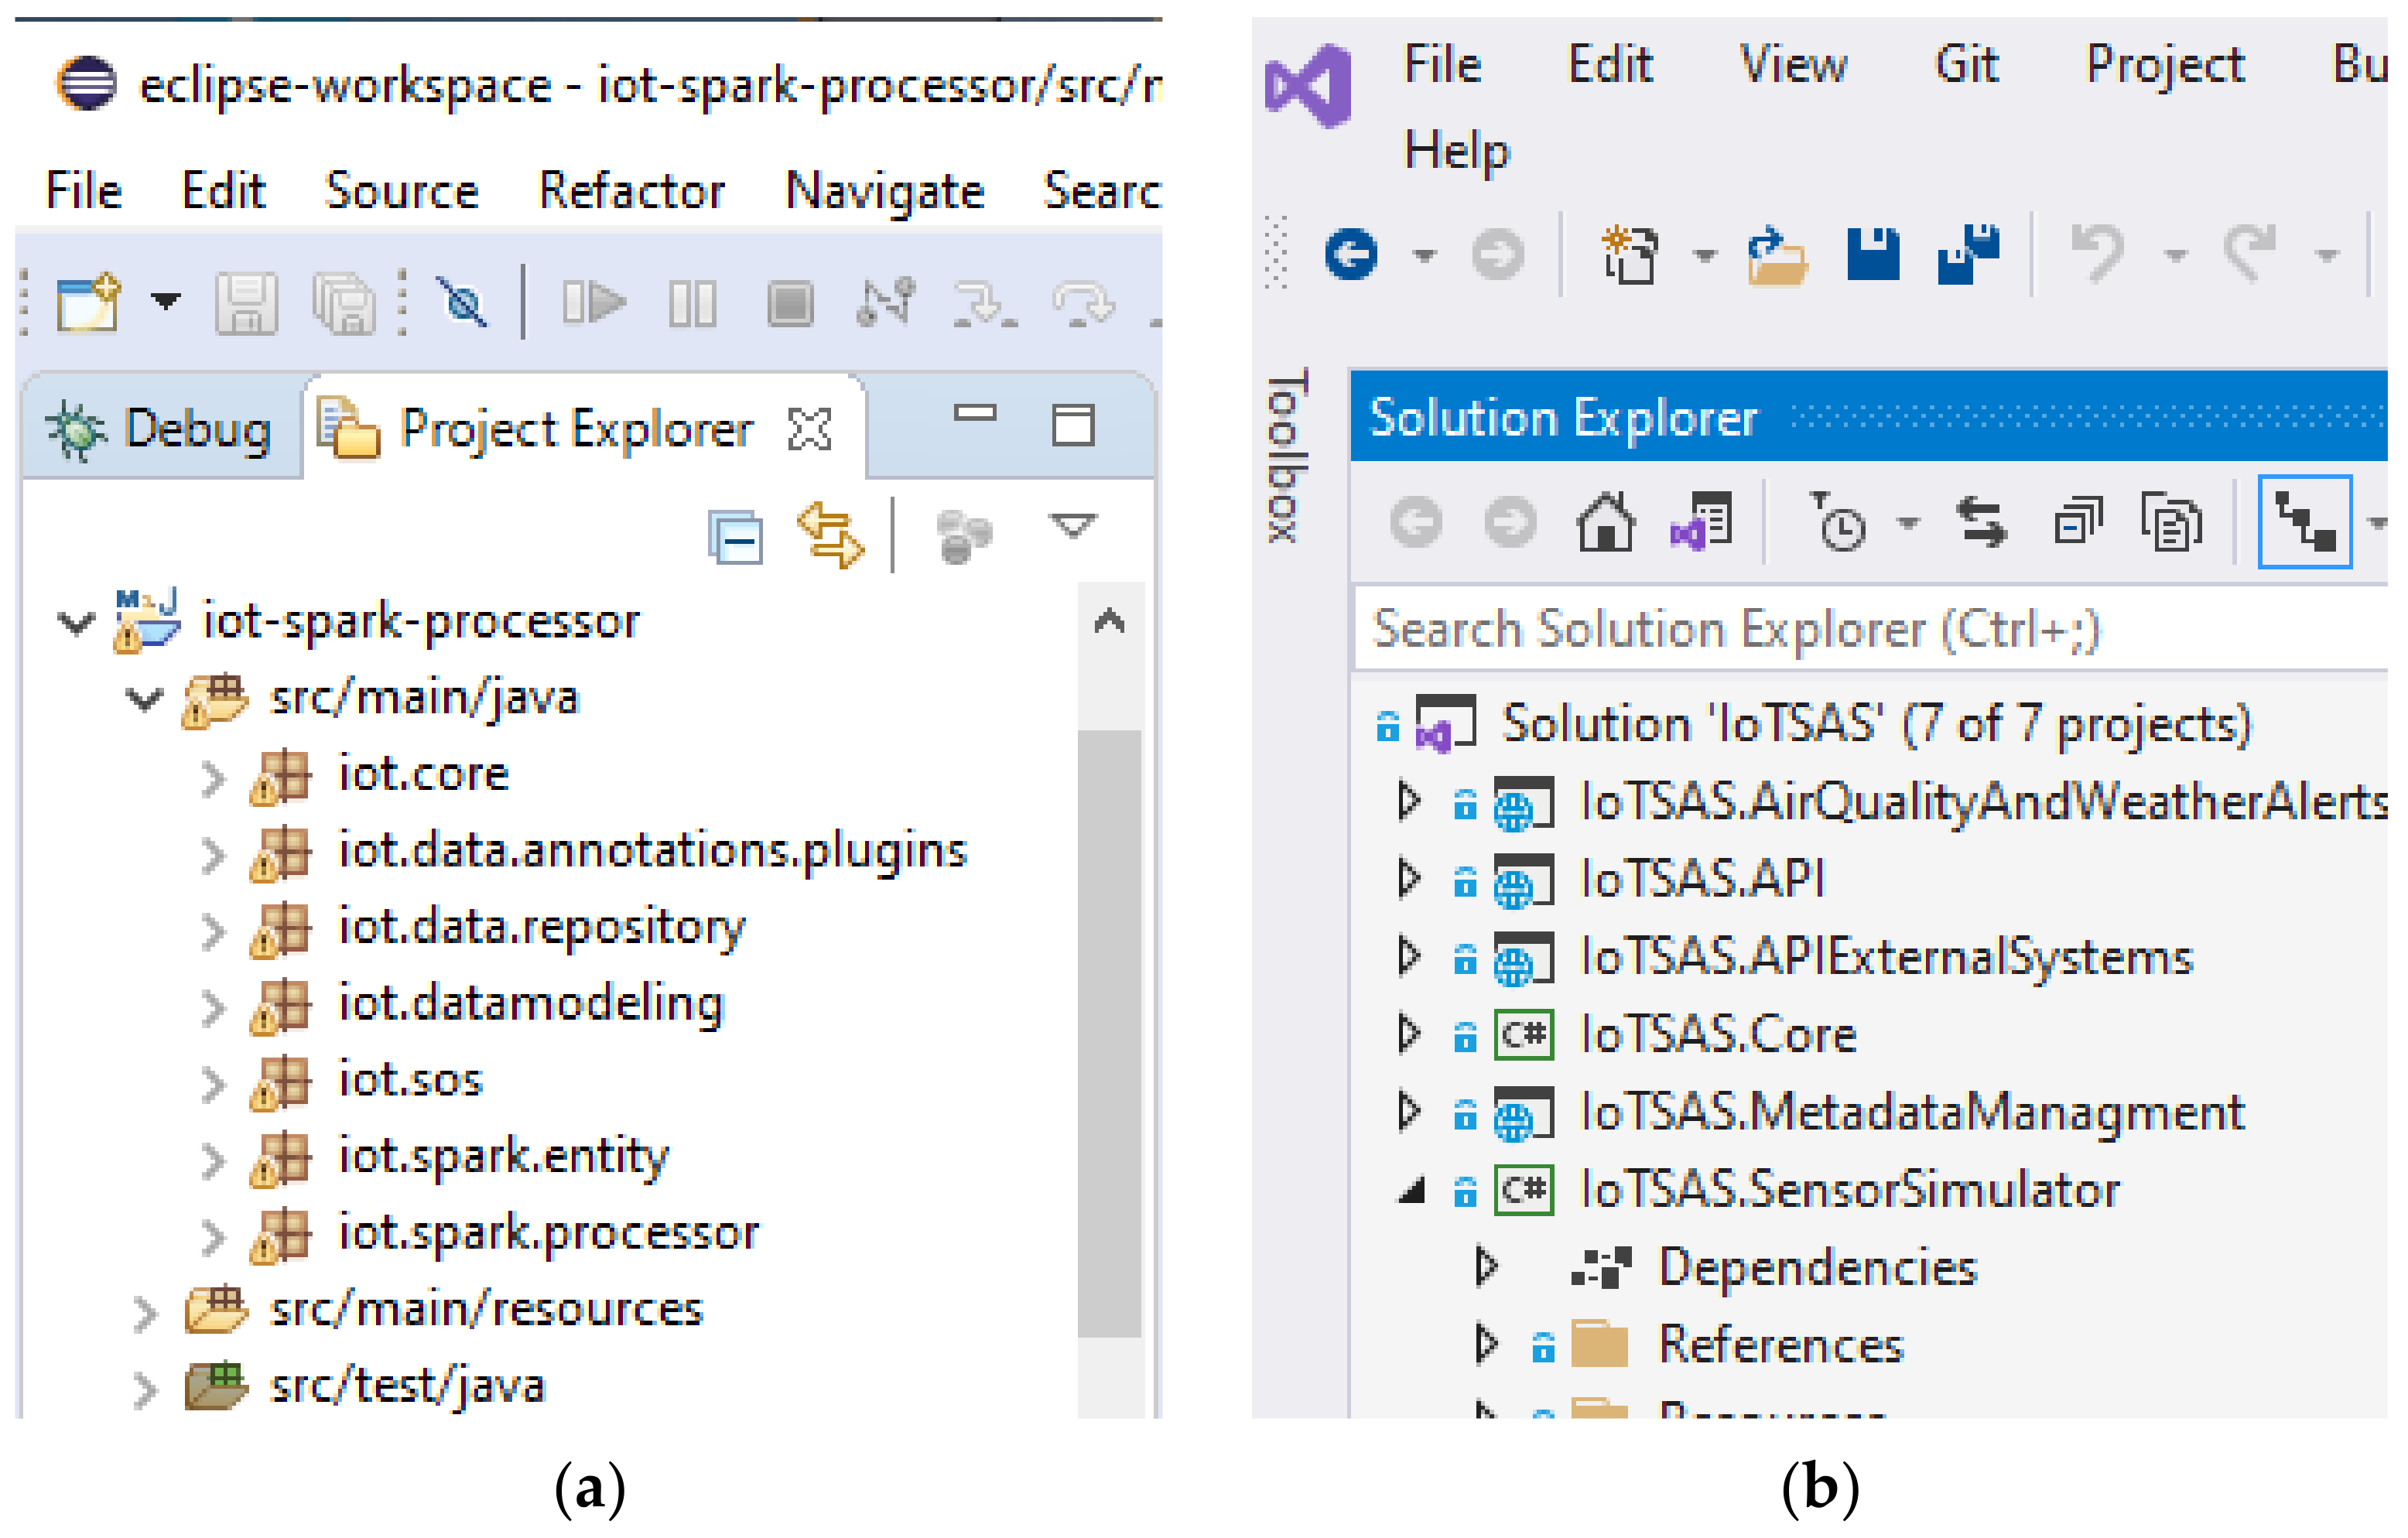
The real-time processing of integration and interpretation of semantics into sensor stream data is the core module that is developed in Spark Streaming. Since the Spark Streaming programs can be written in one of the following languages, such as Java, Scala, or Python (introduced in Spark 1.2), we have chosen the Java language using Eclipse. As shown in Figure 3a, the Java packages of this module include the following:
- iot.core: Input IoT Data Stream, IoT Data Stream Decoder, IoT Domain, Query Processor, and Real Time Outlier Detection;
- iot.data.annotations.plugins: Air Quality Annotations and Weather Alerts Annotations;
- iot.data.repository: Archival IoT Data Stream Annotation Repository, Archival IoT Data Stream Repository, Cassandra Utils, Cassandra Connector, Processor IoT Data Stream Repository, Working IoT Data Stream Annotation Repository, and Working IoT Data Stream Repository;
- iot.datamodeling: Data Modeling, Create Keyspace, Create Processor IoT Data Streams Model, Create Working IoT Data Streams Model, Create Working IoT Data Stream Annotations Model, Create Archival IoT Data Streams Model, Create Archival IoT Data Stream Annotations Model, and Create Invalid IoT Data Stream;
- iot.sos: Get Observation Response, and Register Sensor;
- iot.spark.entity: Archival IoT Data Stream, Archival IoT Data Stream Annotation, Invalid IoT Data Stream, IoT Annotation, IoT Data Stream, IoT Sensing Node Device, IoT Sensor, Ontology Classes, Ontology Source, Parameters, Processor IoT Data Stream, Sensing Node, Sensing Node Device, Working IoT Data Stream, and Working IoT Data Stream Annotation;
- iot.spark.processor: IoT Spark Processor, RTISAE Engine, and RTSAE Engine.
The development of other modules is performed in .Net Core C# based on the performance [18] and our long experience in .Net C# technology. As shown in Figure 3b, the .NET C# contains the following solutions:
- IoTSAS.AirQualityAndWeatherAlertsMonitoring;
- IoTSAS.API;
- IoTSAS.APIExternalSystems;
- IoTSAS.Core;
- IoTSAS.MetadataManagment;
- IoTSAS.SensorSimulator.
In the following, each of the modules are described.
2.2.1. Real-Time Processing of Integration and Interpretation of Semantics into Sensor Stream Data Module
Real-time processing of integration and interpretation semantics into sensor stream data module is the core component that provides the functionality of the system. As mention in Section 2.1 “System Architecture”, it utilizes Apache Kafka, Spark Streaming, Apache Casandra database, and SOS O&M standards.
Figure 4 illustrates the high-level view of architectural components of the system. The heterogeneous sensors observed data are sent in different formats in Apache Kafka. In Apache Kafka, a Kafka Producer is implemented that consumes different format of sensor data and converts them into a suitable format and then publishes them to Kafka topics. A Kafka topic is identified by its name, which is part of a global namespace of that Kafka cluster. A topic in Kafka represents a queue or a logical collection of messages written by one more Kafka producers and read by one or more Kafka consumers. Kafka converts all messages into byte arrays. The communications between the producers, consumers, and clusters in Kafka use the Transmission Control Protocol (TCP). A Kafka broker contains one or more topics that are in turn divided into one or more partitions.
Kafka cluster transformed sensor data stream transmitted to Spark Streaming for further processing. Spark Streaming divides the sensor data stream into batches of 50 milliseconds called Discretized Stream (DStreams), which internally is a sequence of Resilient Distributed Datasets (RDDs), one for each batch interval.
Spark Streaming divides the sensor data stream into batches of 50 milliseconds called DStreams, which internally is a sequence of RDDs, one for each batch interval. Each RDD contains the sensor stream data received during the batch interval. The sensor stream data contained in RDD are partitioned, and operations are performed in parallel on the data cashed in memory by providing high performance at scale in partitioning and minimizing disk I/O. The RDD sensor stream data by using the filter function are filtered to remove outliers. Then, by using the transform function, RDD sensor stream data are transformed to WorkingIoTDataStream by adding an identifier that uniquely identifies the observation (sensor stream data) and an entry timestamp that notes that the sensor stream data have arrived at the Stream Processor. After that, RDDs are mapped to the IoT domain (air quality monitoring or water quality monitoring) and by using developed plugins through the RTSA (Real-Time Semantic Annotation) component, the RDD sensor stream data are enriched with semantic annotations from Web Ontology Language (OWL) source. Then, by using RTISA (Real-Time Interpreting Semantically Annotated), the components are executed, and stake annotated expressions are interpreted. Finally, by using the transform function, RDDs annotated with semantic are transformed to SOS O&M standards and serve IoT real-time monitoring systems and are stored in the Cassandra database, as shown in Figure 4.
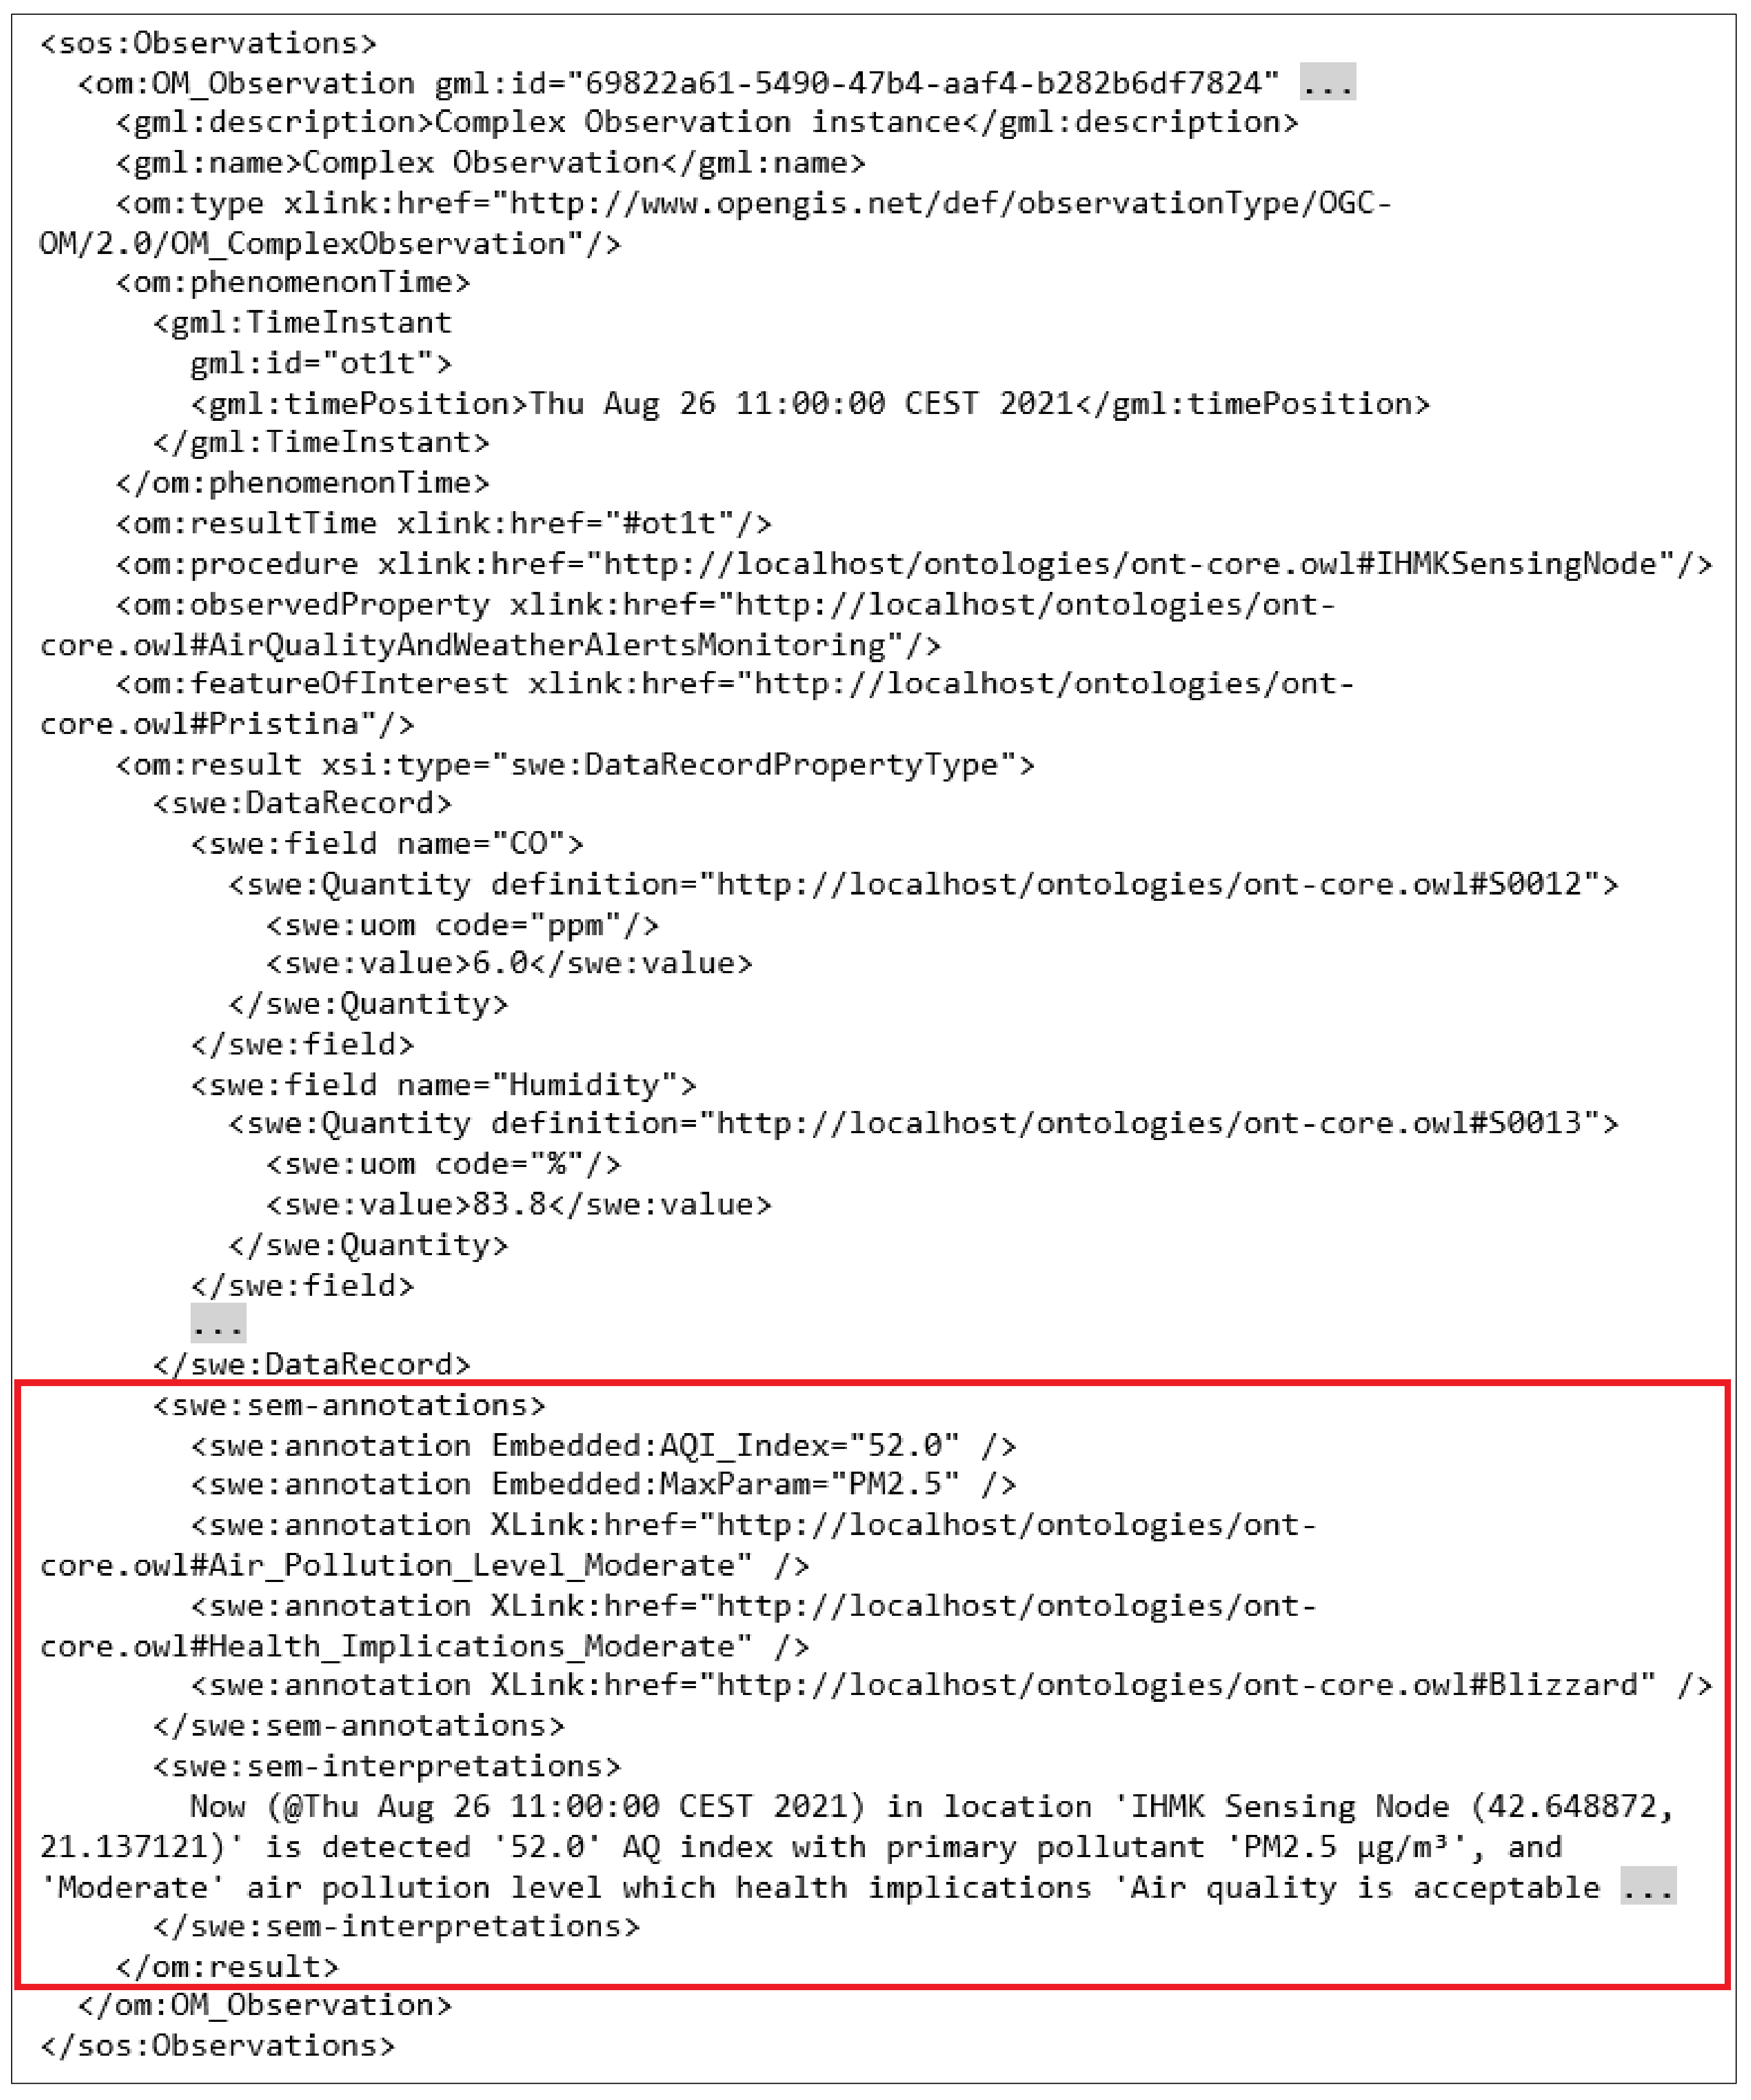
A SOS O&M observation comprises zero or multiple OM_Observation entries, and each store an instance of an observation. In our solution, a complex observation SOS O&M is implemented. In the following, common complex observation properties are presented:
- gml:identifier (mandatory): This identifies or refers to a specific observation. In our case, it is a generated by the Universally Unique Identifier (UUID), e.g., 69822a61-5490-47b4-aaf4-b282b6df7824), of observation;
- om:phenomenonTime (mandatory): This describes the time instant or time period for which the observation contains sensor data;
- om:resultTime (mandatory): This provides the time when the result became available (often, this is identical to the phenomenonTime);
- om:procedure (mandatory): The identifier of the sensing node instance that has generated the observation;
- om:observedProperty (mandatory): The IoT domain of phenomenon that was observed;
- om:featureOfInterest (mandatory): An identifier of the geometric feature (e.g., sensor station) to which the observation is associated;
- om:result (mandatory): The observed values. The type of the result is swe:DataRecordPropertyType.
Figure 5 shows the complex observation SOS O&M standard document, which contains two extra elements, that we have developed:
- swe:sem-annotations: This element contains one or more annotation empty elements, which can be embedded or xlink. The annotation elements are created by Real-Time Semantic Annotation (RTSA) component;
- swe:sem-interpretations: This element contains the interpretation of sensor observed data. The interpreted information is created by the Real-Time Interpreting Semantically Annotated (RTISA) component.
2.2.2. Data Model Implementation
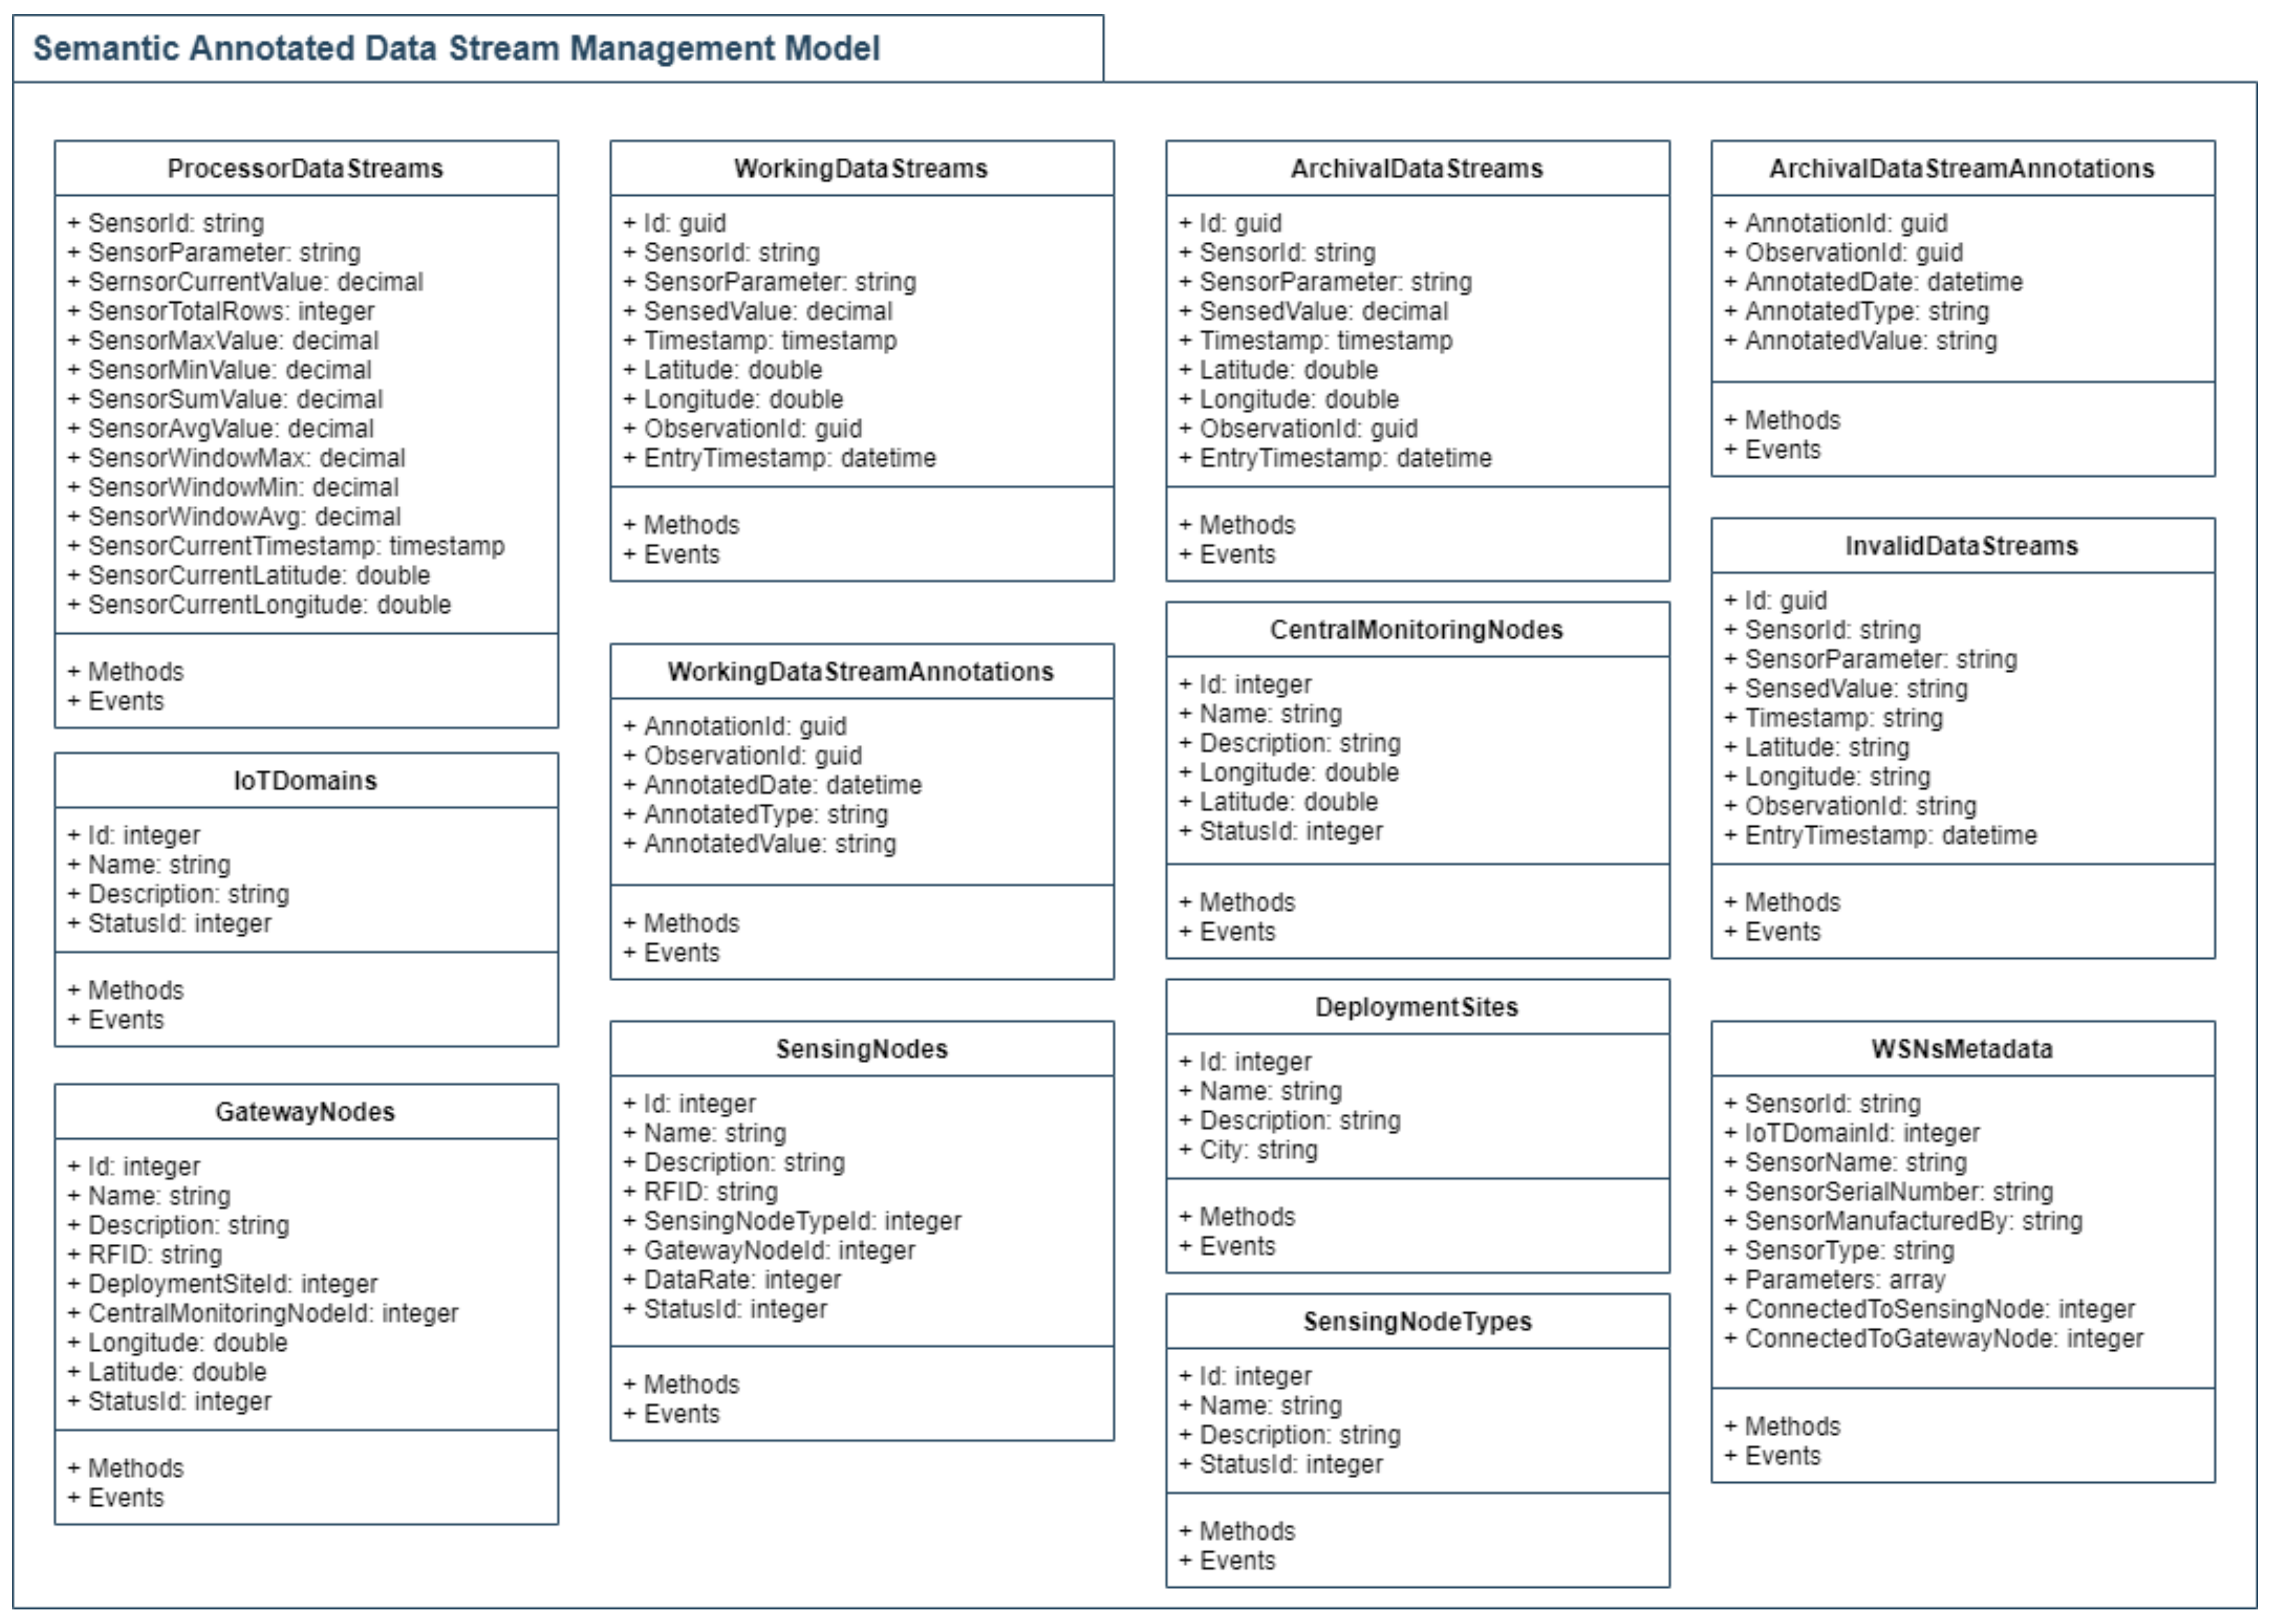
The data model is developed in Apache Cassandra database and contains the following components: Processor Data Streams (stores a summary data of each sensor for Stream Processor operations), Working Data Streams (a fixed sliding window that stores 15 last measured values for each sensor), Working Data Stream Annotations (stores semantic annotations of Working Data Streams observations data), Archival Data Streams (archives sensor stream data for generating reports and different statistics), Archival Data Stream Annotations (archives semantic annotations of sensor stream data), Invalid Data Streams (stores invalid sensor stream data that are classified as outlier), and WSNs Metadata (known as static data that store data and metadata about sensors, sensors types, sensing nodes, gateway nodes, central monitoring nodes, etc.).
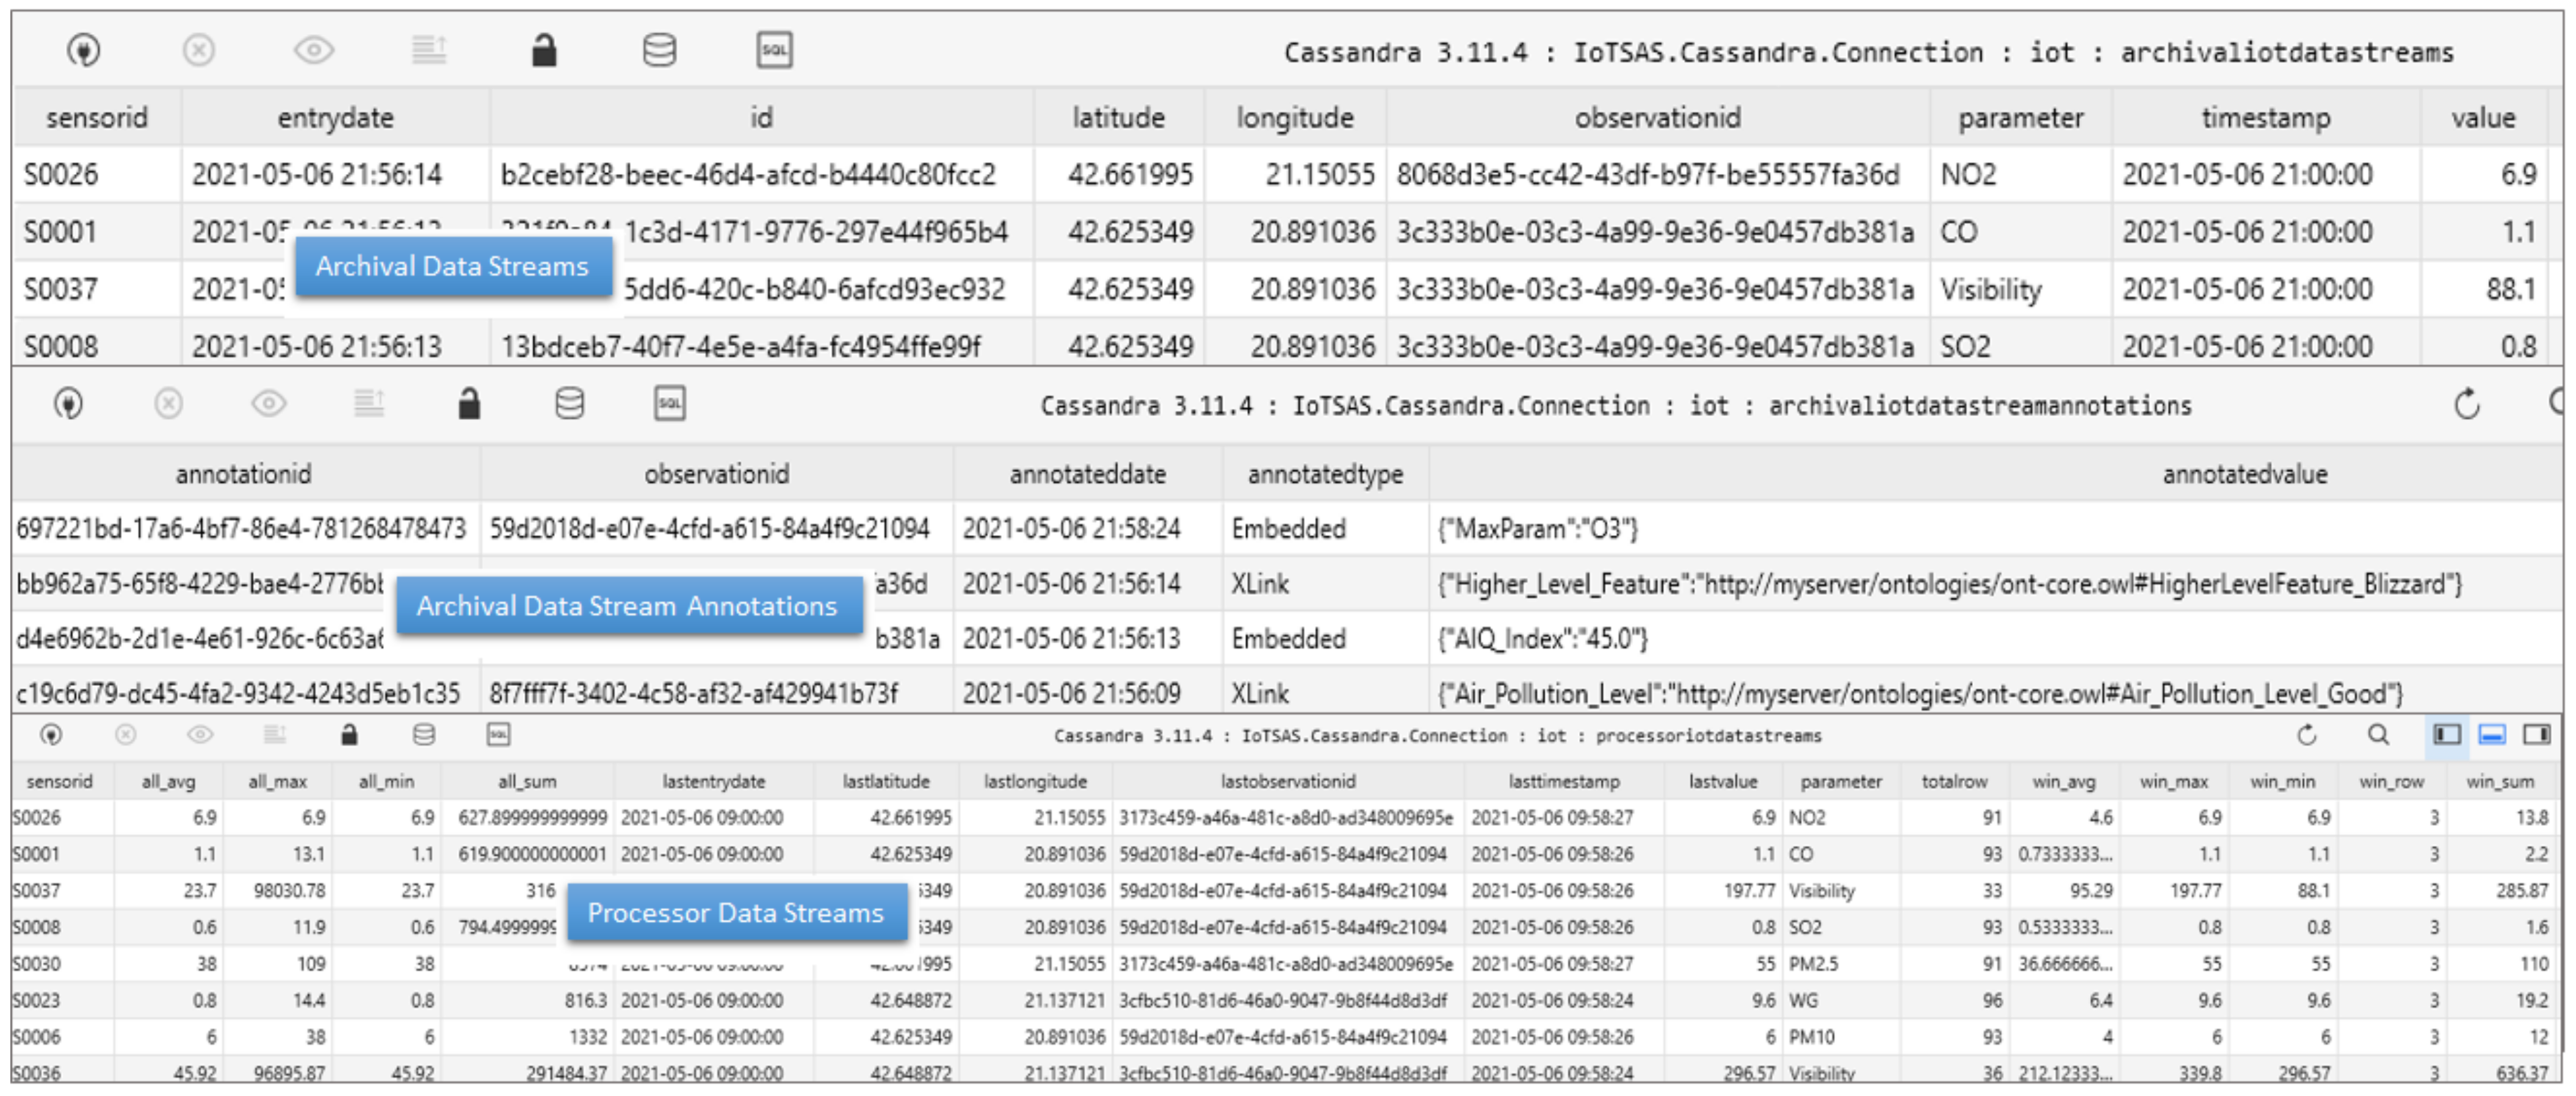
Data modeling diagram of each component is presented in Figure 6. Each component has its attributes, methods, and events. In order to explain more clearly how the data of the Archival Data Stream, Archival Data Stream Annotations, and Process Data Streams are stored in the Apache Cassandra database, their details are presented in Figure 7.
2.2.3. IoT Management Metadata Module
The IoT management metadata module provides the management of data called static data, such as the following:
- Devices metadata;
- Nodes metadata;
- Phenomenon (parameters) metadata.
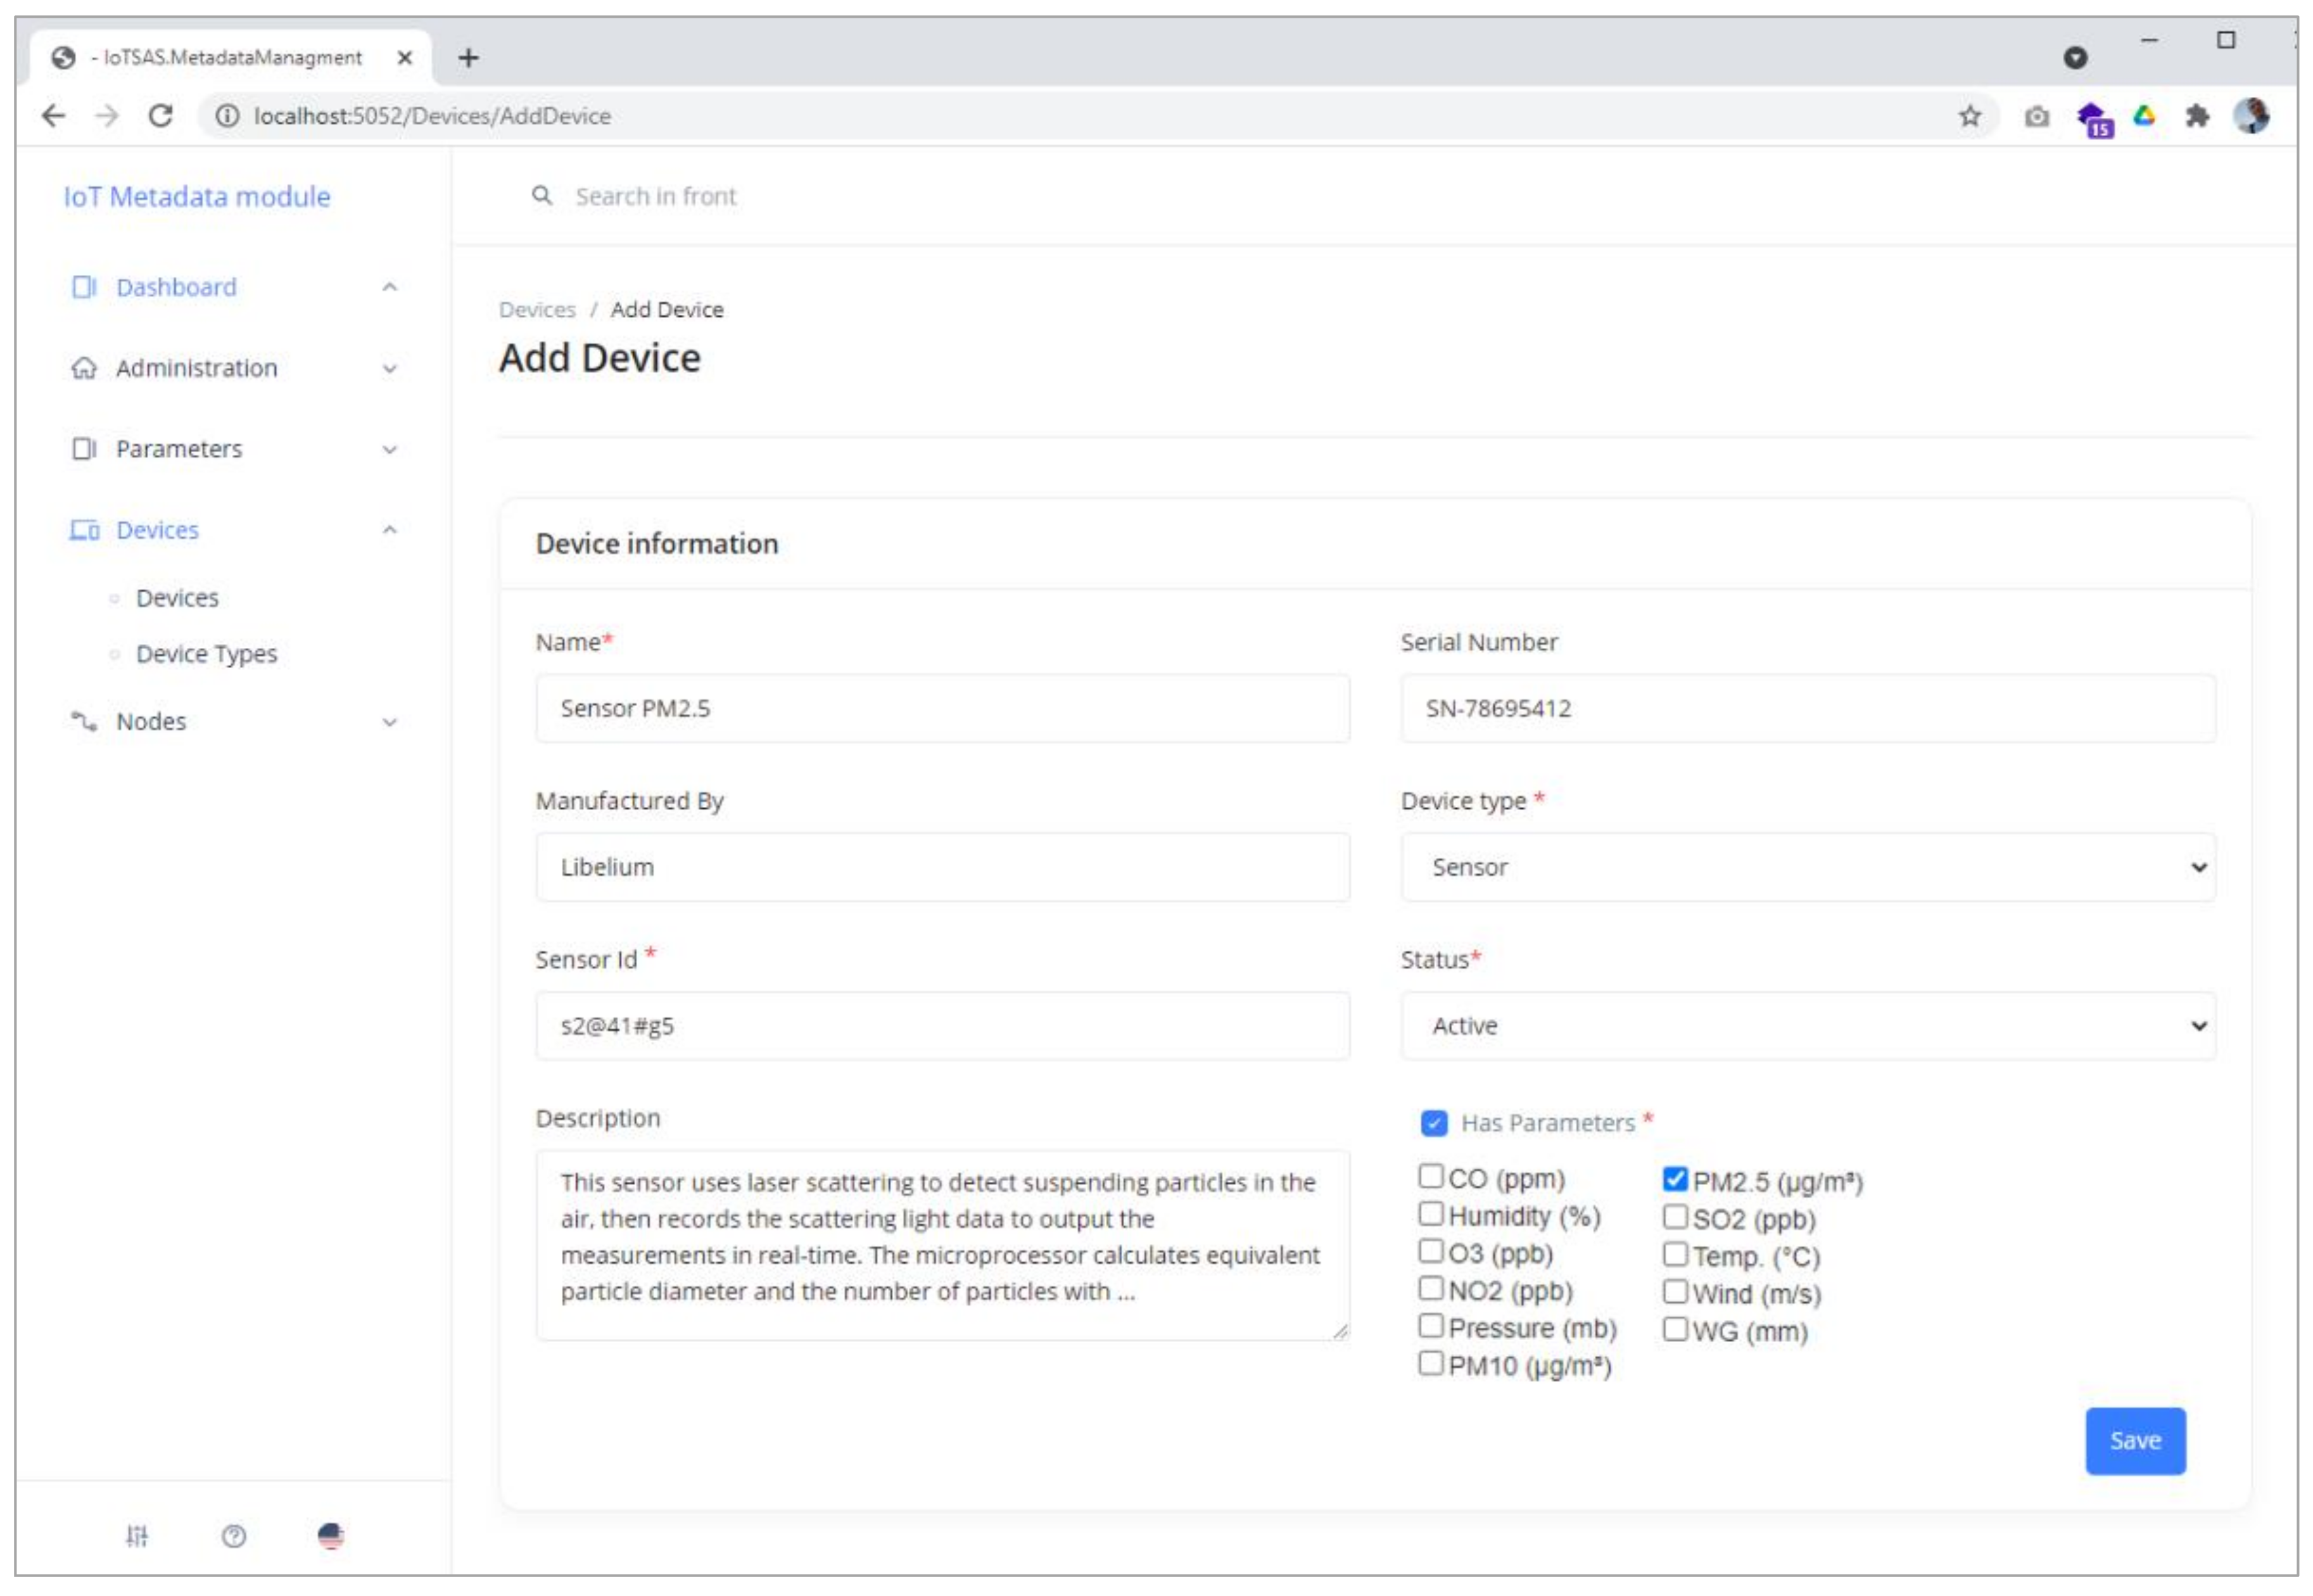
Devices metadata include data about device types, such as the following: sensor, servers, clusters, microcontrollers, cables, etc., and data about devices, as shown in Figure 8, such as name of device, a description, serial number of device, sensor ID (when device type is sensor), manufacturer, status of devices (active or passive), and parameters which the device measures, such as CO (ppm), Humidity (%), O3 (ppb), NO2 (ppb), Pressure (mb), PM10 (µg/m3), PM2.5 (µg/m3), SO2 (ppb), etc.
Nodes metadata include data about WSN nodes, such as the following:
- Sensing node types such as static sensor nodes to perform monitoring missions in the region of interest or mobile sensor nodes to perform monitoring in different locations;
- Deployment sites include the name of deployment site, description, and municipality in which the sensors are deployed;
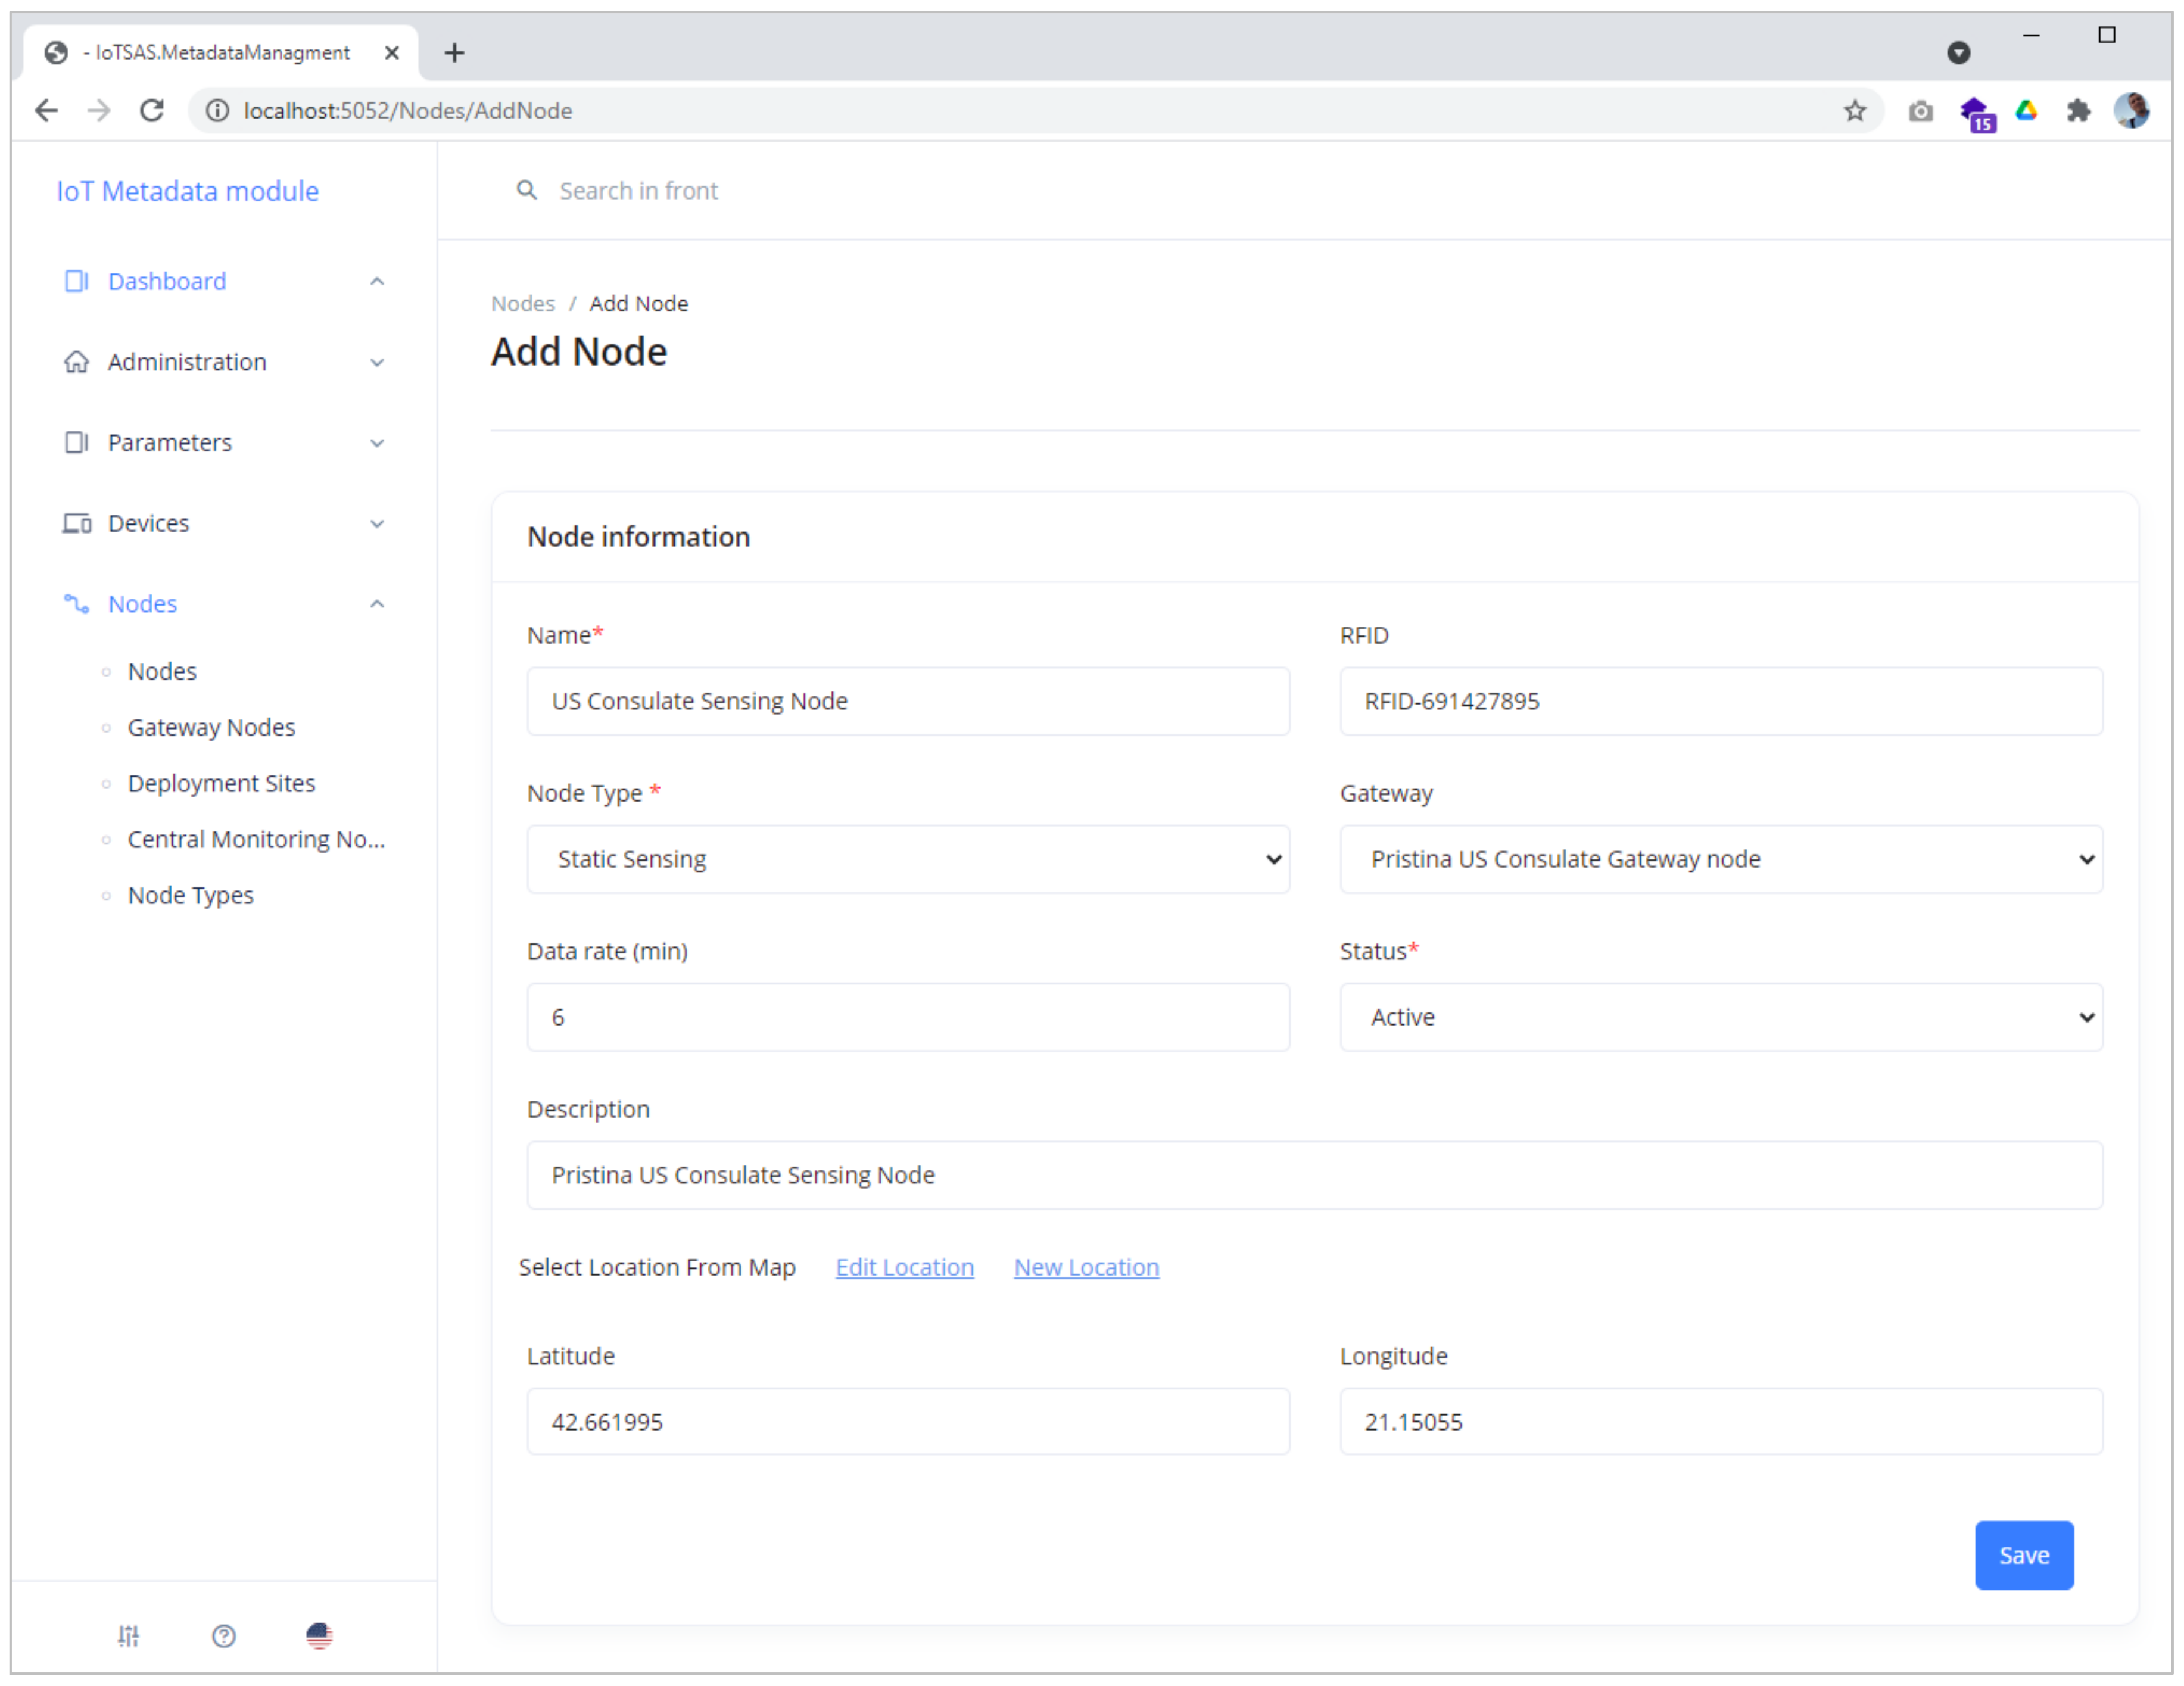
- Sensing nodes include data of sensing nodes, as shown in Figure 9, such as the name of sensing node, description, RIFD, node type, municipality, deployment site, data rate (in minutes), node status as either active or passive, geographical position, and to which gateway node they sent data;
- Gateway nodes include data such as name of gateway node, description, municipality, deployment site, status node, and geographical position and to which central monitoring node they sent data;
- Central monitoring nodes include data such as the name of central monitoring node, description, status node, and geographical position;
Phenomenon metadata include data about phenomenon, such as the following:
- Parameter types include data about parameter types: hydro morphological, physico-chemical, biological, specific synthetic, specific non synthetic, air quality, etc.;
- Sub parameter types include data about sub parameter types: hydrological regime, river continuity, morphological conditions, thermal conditions, oxygenation conditions, salinity, acidification status, nutrient conditions, invertebrate fauna, fish, phytobenthos, macrophytes, phytoplankton, air pollution, etc.;
- Parameters includes data such as the following: name of parameter (e.g., Carbon Monoxide (CO), Humidity, Ozone (O3), Nitrogen Dioxide (NO2), Pressure (p), pm10, pm25, Sulphur Dioxide (SO2), Temperature, Wind, Water Gauge, etc.), unit of phenomenon (e.g., ppm, %, ppb, mb, µg/m3, °C, m/s, mm, etc.), and range of values.
2.2.4. Weather Alerts and Air Quality Monitoring
An IoT real-time air quality and weather alerts monitoring system is developed to visualize sensor stream data and their semantic annotations based on web platform. Sensor data of Hydrometeorological Institute of Kosovo (HMIK), Pristina US Consulate, Rilindja-Pristina, and Peje are used through the World Air Quality Index API (AQI API). The AQI API can be used for advanced programmatic integration, such as the following: access to more than 11,000 station-level and 1000 city-level data, station name and coordinates, search station by name, geo-location query based on latitude/longitude, individual Air Quality Index (AQI) for all pollutants, current weather conditions, etc. [19].
Input Different Format Sensor Stream Data
The system receives raw sensor stream data from AQI API in JSON format, as presented in Figure 10, which supports measuring in real time the following parameters: PM10 (pm10), Nitrogen Dioxyde (no2), PM25 (pm25), Carbon Monoxide (co), Humidity (h), Sulphur Dioxide (so2), Ozone (o3), Pressure (p), Temperature (t), Water Gauge (wg), and Wind (w). JSON data contains also attributes such as the following: data (station data: idx—unique ID for the city monitoring station; aqi—real time air quality information; time—measurement time information; s—local measurement time; and tz—station time zone); city (information about the monitoring station: name—name of the monitoring station; geo—latitude/longitude of the monitoring station; and url—url for the attribution link); attributions (EPA Attribution for the station); and iaqi (measurement time information: pm25—individual AQI for the PM2.5; v—individual AQL for the PM2.5).
Data received by sensors every 60 minutes, through AQI API, are represented in corresponding numerical formats, e.g., in −3.8 (°C), for temperature parameter.
Integration and Interpretation of Semantic Annotations to the Sensor Stream Data
In the developed system, different semantic annotations for sensor stream data are developed, such as the following:
- #Blizzard;
- #Flurry;
- #Rain_Storm;
- #Rain_Shower;
- #AQI_Index;
- #Air_Pollution_Level;
- #Health_Implications.
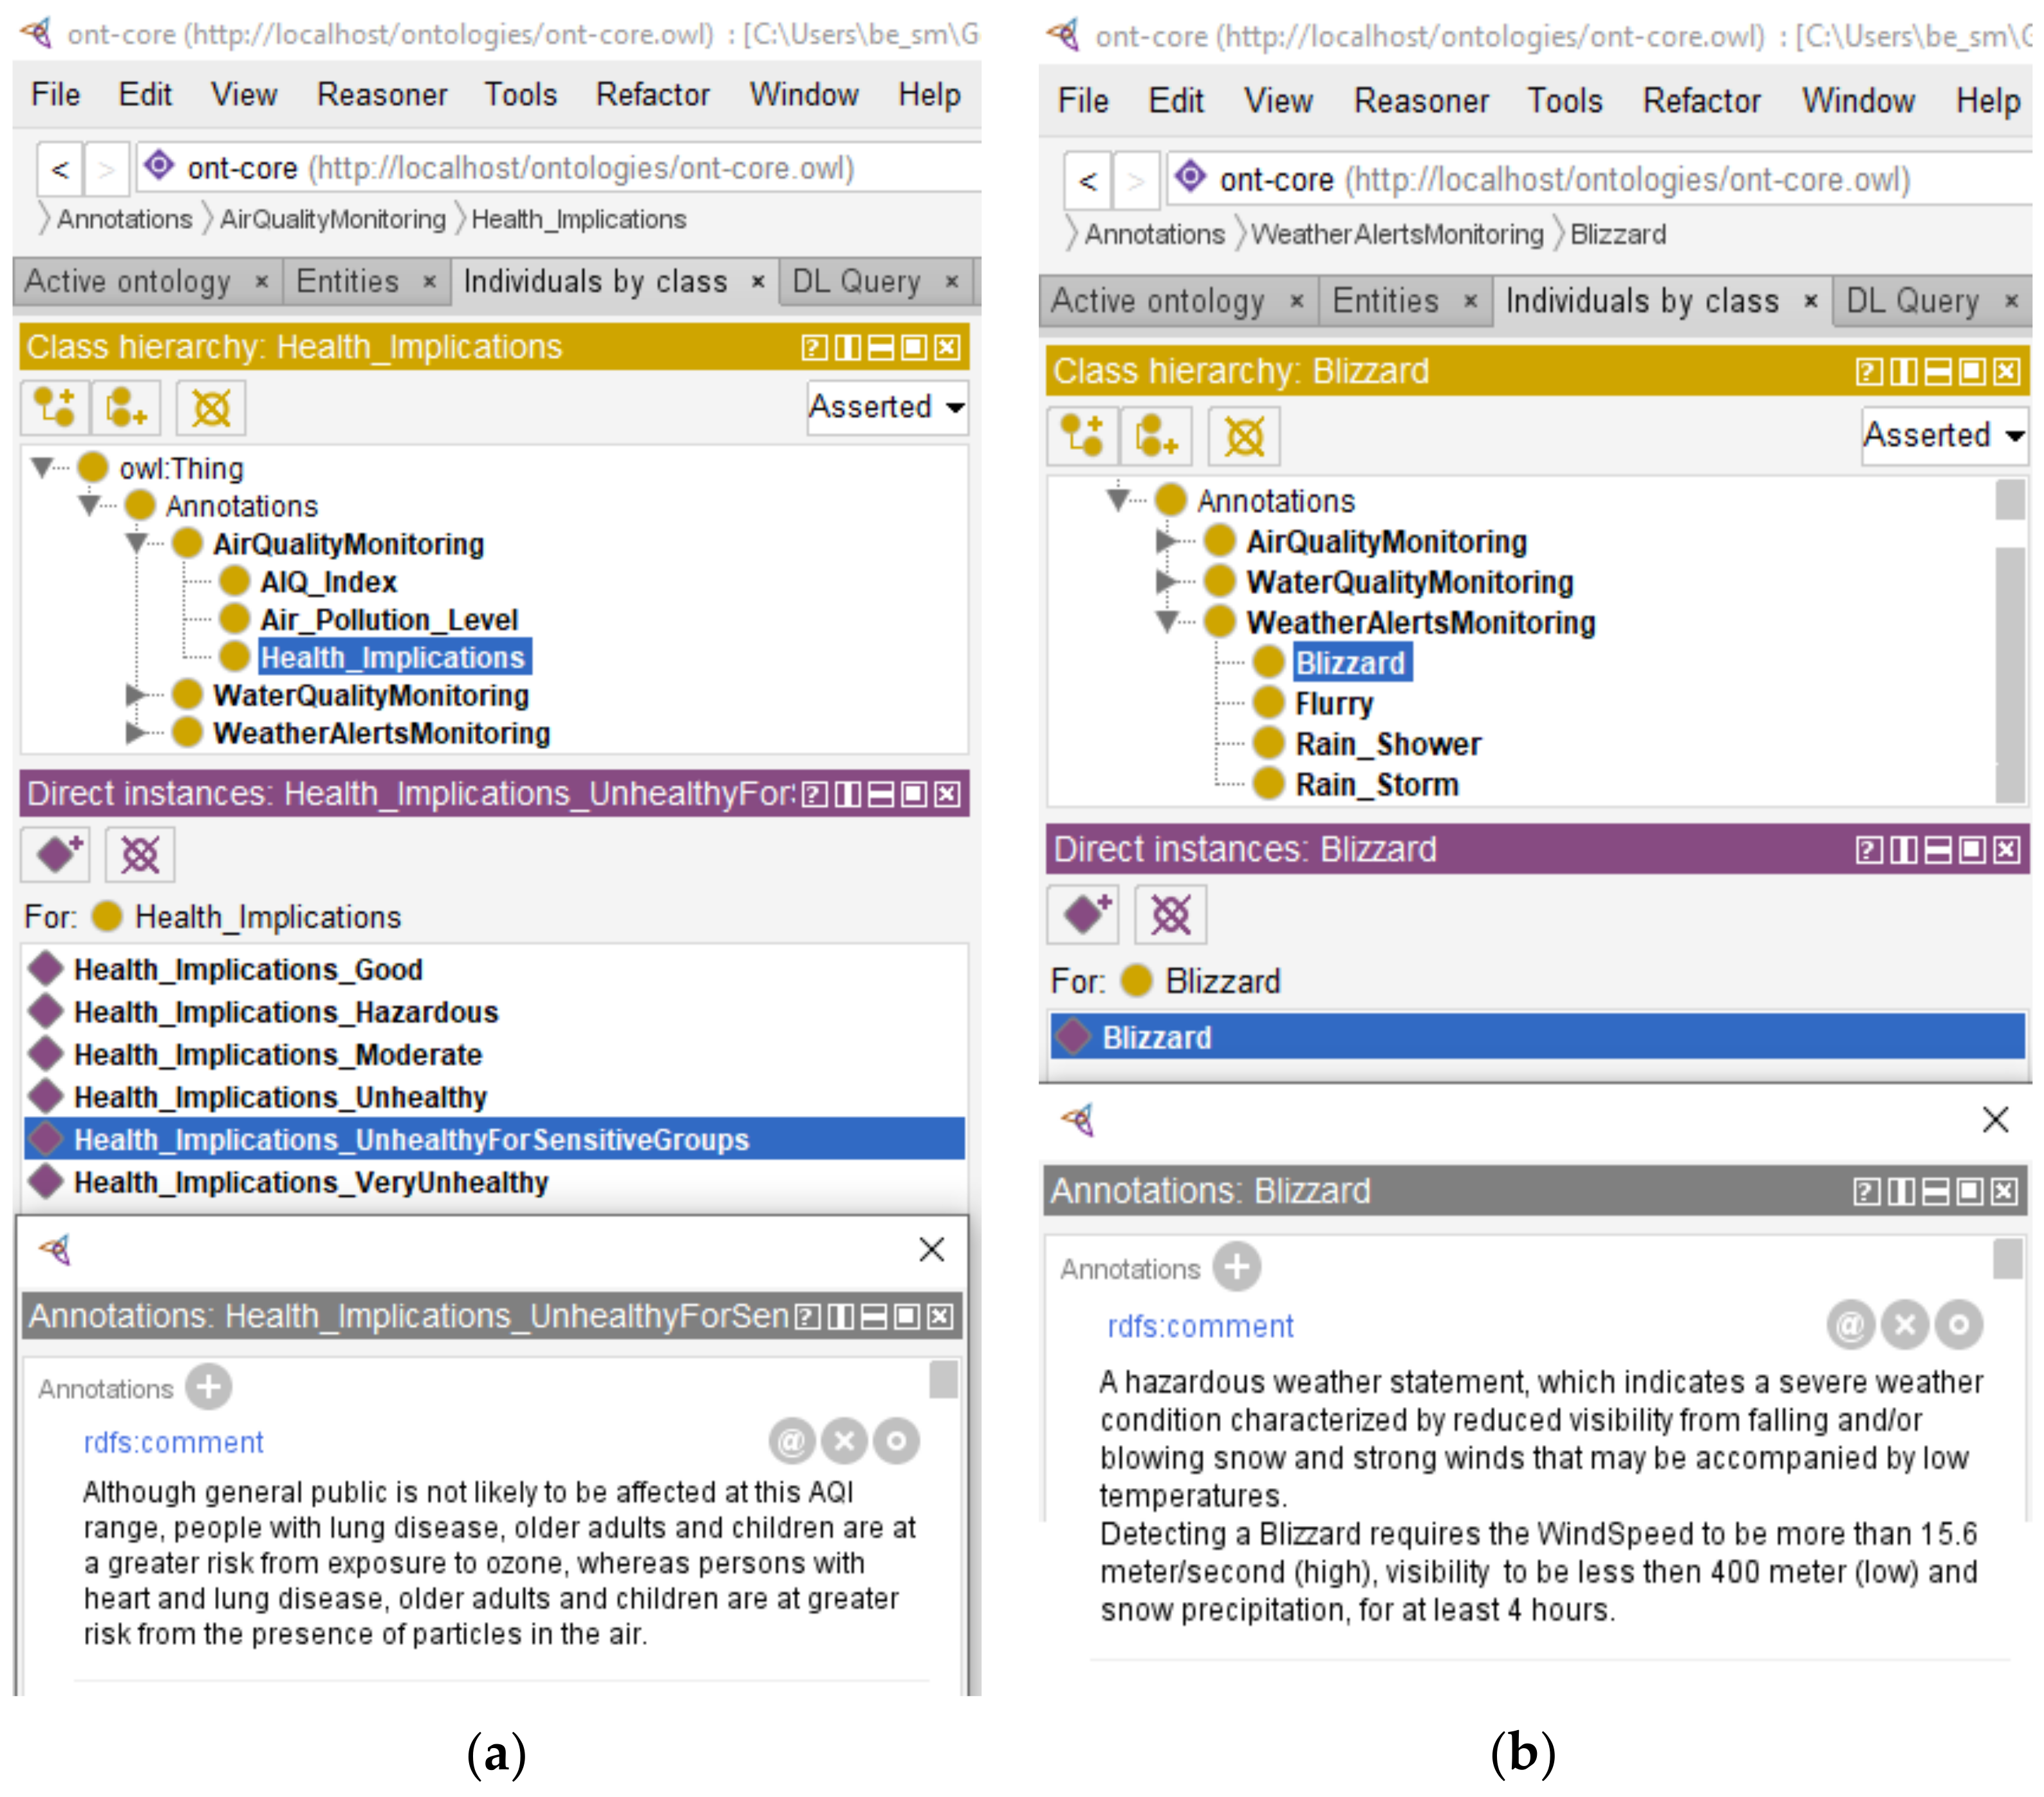
#Blizzard annotation detecting a Blizzard requires the WindSpeed to be more than 15.6 m/s (high), visibility to be less than 400 m (low), and snow precipitation for at least 4 h, as presented Equation (1).
BLIZZARD =
WindSpeed (a) ≥ 15.6 m/s (High) ꓥ Duration (a) > 4 h ꓥ
Precipitation (b) = Snow ꓥ Duration (b) > 4 h ꓥ
Visibility (c) < 4 m (Low) ꓥ Duration (c) > 4 h
WindSpeed (a) ≥ 15.6 m/s (High) ꓥ Duration (a) > 4 h ꓥ
Precipitation (b) = Snow ꓥ Duration (b) > 4 h ꓥ
Visibility (c) < 4 m (Low) ꓥ Duration (c) > 4 h
#Flurry annotation: detecting a Flurry requires the WindSpeed to be less than 15.6 m/s (low), visibility to be less than 4 m (low), and snow precipitation, for at least 4 h, as presented Equation (2).
FLURRY =
WindSpeed (a) < 15.6 m/s (Low) ꓥ Duration (a) > 4 h ꓥ
Precipitation (b) = Snow ꓥ Duration (a) > 4 h ꓥ
Visibility (c) < 4 m (Low) ꓥ Duration (c) > 4 h
WindSpeed (a) < 15.6 m/s (Low) ꓥ Duration (a) > 4 h ꓥ
Precipitation (b) = Snow ꓥ Duration (a) > 4 h ꓥ
Visibility (c) < 4 m (Low) ꓥ Duration (c) > 4 h
#Rain_Storm annotation: detecting a RainStorm requires the WindSpeed to be more than 15.6 m/s (high), temperature greater than 0 °C, and rain precipitation, as presented Equation (3).
RAIN STORM =
WindSpeed (a) ≥ 15.6 m/s (High) ꓥ
Precipitation (b) = Rain ꓥ
Temperature (c) > 0 °C
WindSpeed (a) ≥ 15.6 m/s (High) ꓥ
Precipitation (b) = Rain ꓥ
Temperature (c) > 0 °C
#Rain_Shower annotation: detecting a RainShower requires the WindSpeed to be less than 15.6 m/s (low), temperature greater than 0 °C and rain precipitation, as presented Equation (4).
RAIN SHOWER =
WindSpeed (a) < 15.6 m/s (Low) ꓥ
Precipitation (b) = Rain ꓥ
Temperature (c) > 0 °C
WindSpeed (a) < 15.6 m/s (Low) ꓥ
Precipitation (b) = Rain ꓥ
Temperature (c) > 0 °C
#AQI_Index annotation is an index for reporting daily air quality and informs us on how clean the air or how polluted the air is. The United States Environmental Protection Agency (EPA) calculates the AQI for five major air pollutants regulated by the Clean Air Act: ground-level ozone, particle pollution (also known as particulate matter), carbon monoxide, sulfur dioxide, and nitrogen dioxide. The AQI range values is from 0 to 500. According to EPA, the higher the AQI value, the greater the level of air pollution and the greater the health center (take the maximum of all individual AQI), as presented Equation (5).
AQI = max(AQIPM2.5, AQIPM10, AQIO3, …)
#Air_Pollution_Level annotation is based on the AQI value. It is divided into six “Air Quality Index Levels of Health Concern” categories: Good (AQI is 0 to 50), Moderate (AQI is 51 to 100), Unhealthy for Sensitive Groups (101 to 150), Unhealthy (AQI is 151 to 200), Very Unhealthy (AQI is 201 to 300), and Hazardous (AQI is 301 to 500).
#Health_Implications annotation: Each of six categories described above corresponds to a different level of health concert. The #Health Implications annotation denotes what they mean, for example, the ”Unhealthy for Sensitive Groups” category means the following: “Although the general public is not likely to be affected at this AQI range, people with lung disease, older adults, and children are at a greater risk from exposure to ozone, whereas persons with heart and lung disease, older adults, and children are at greater risk from the presence of particles in the air.” The ”Moderate” category means the following: “Air quality is acceptable; however, for some pollutants there may be a moderate health concern for a very small number of people who are unusually sensitive to air pollution.”
The above described annotations are developed into ontology named IoT semantic annotations ontology. Figure 11a presents air quality monitoring annotations, while Figure 11b presents weather alerts monitoring. It is worth mentioning that for execution of the Simple Protocol and RDF Query Language (SPARQL) query over the IoT semantic annotations ontology, the Java library called ‘Jena Ontology API’ has been used.
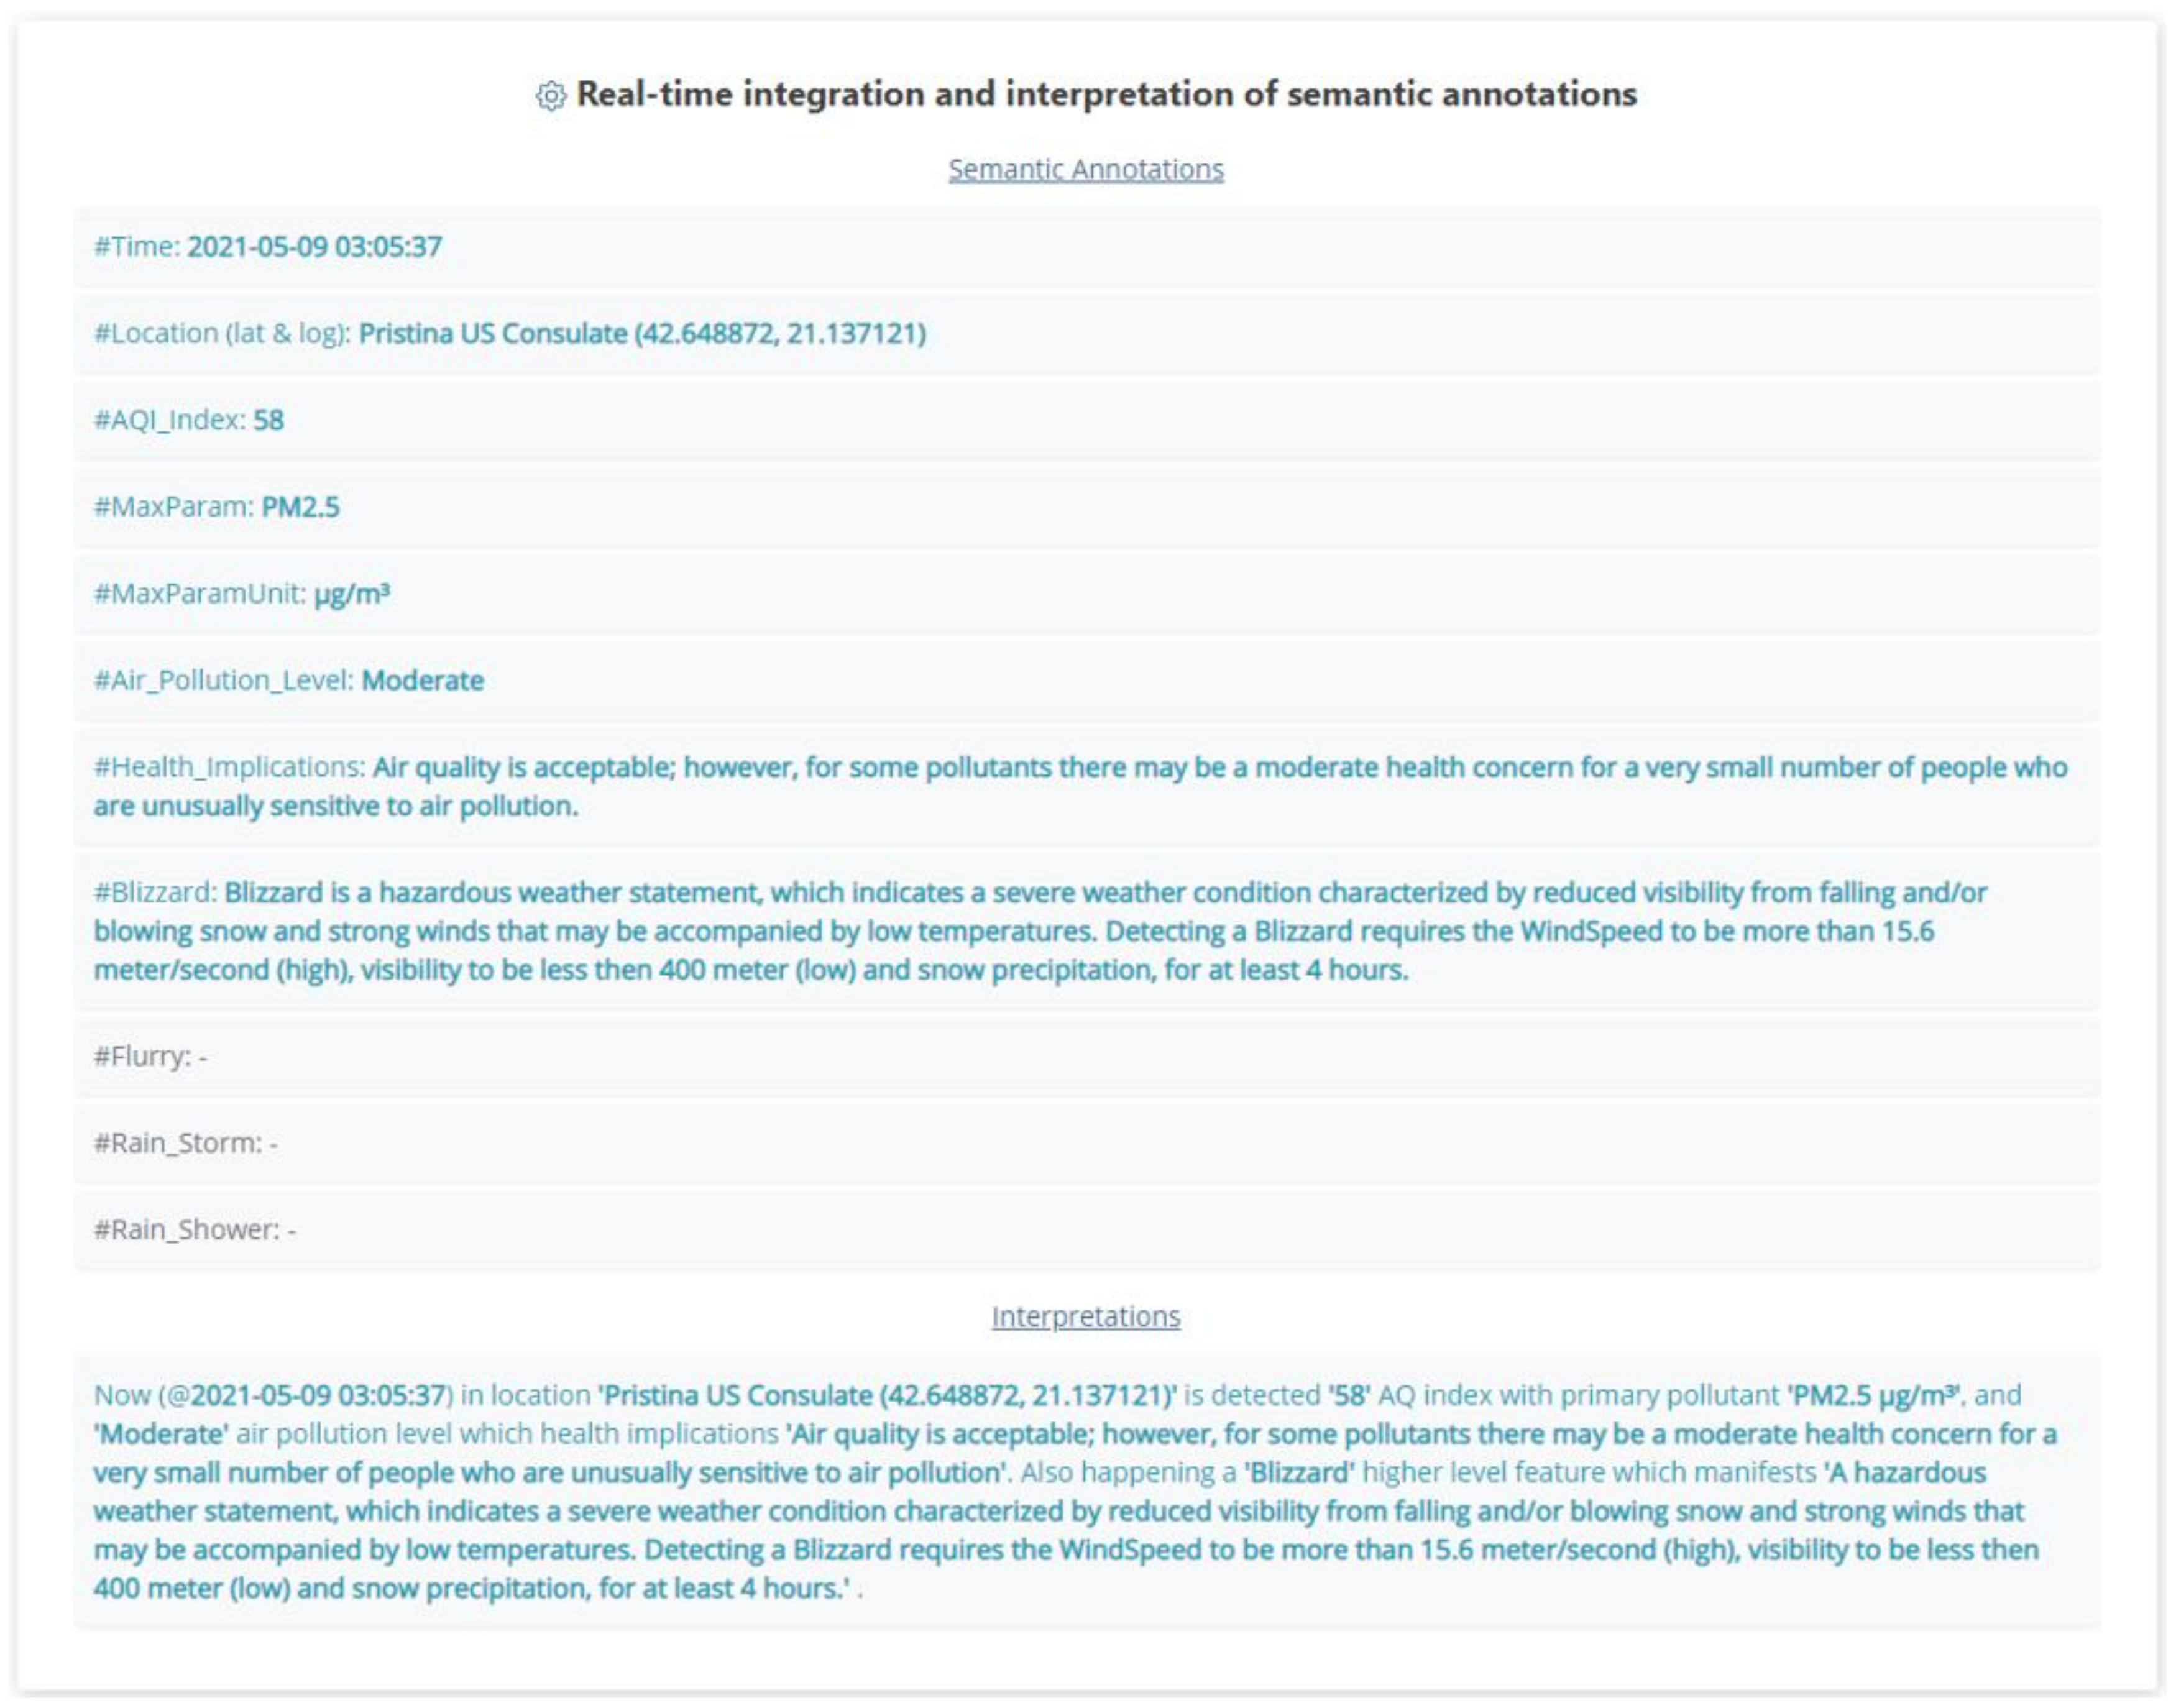
After the real-time integration of semantics into heterogeneous sensor stream data with context in the IoT, the real-time interpretation of the sensor stream data is performed through the RTISA (Real-Time Interpreting Semantically Annotated) component in order to provide better understanding and to infer new knowledge from the sensor stream data. In this study, by using the integrated semantic annotated stakes, the following interpretation pattern is developed:
Now (@[#timestamp]) in location [#location(lat, long)] is detected [#AQI_index] with AQ index with primary pollutant [#MaxParam] [#MaxParamUnit] and [#Air_Pollution_Level] air pollution level with health implications [#Health_Implications]. Moreover, a [#HigherLevelFeature] higher level feature is happening, which manifests [#HigherLevelFeature_Indicates].
Outputs for Users
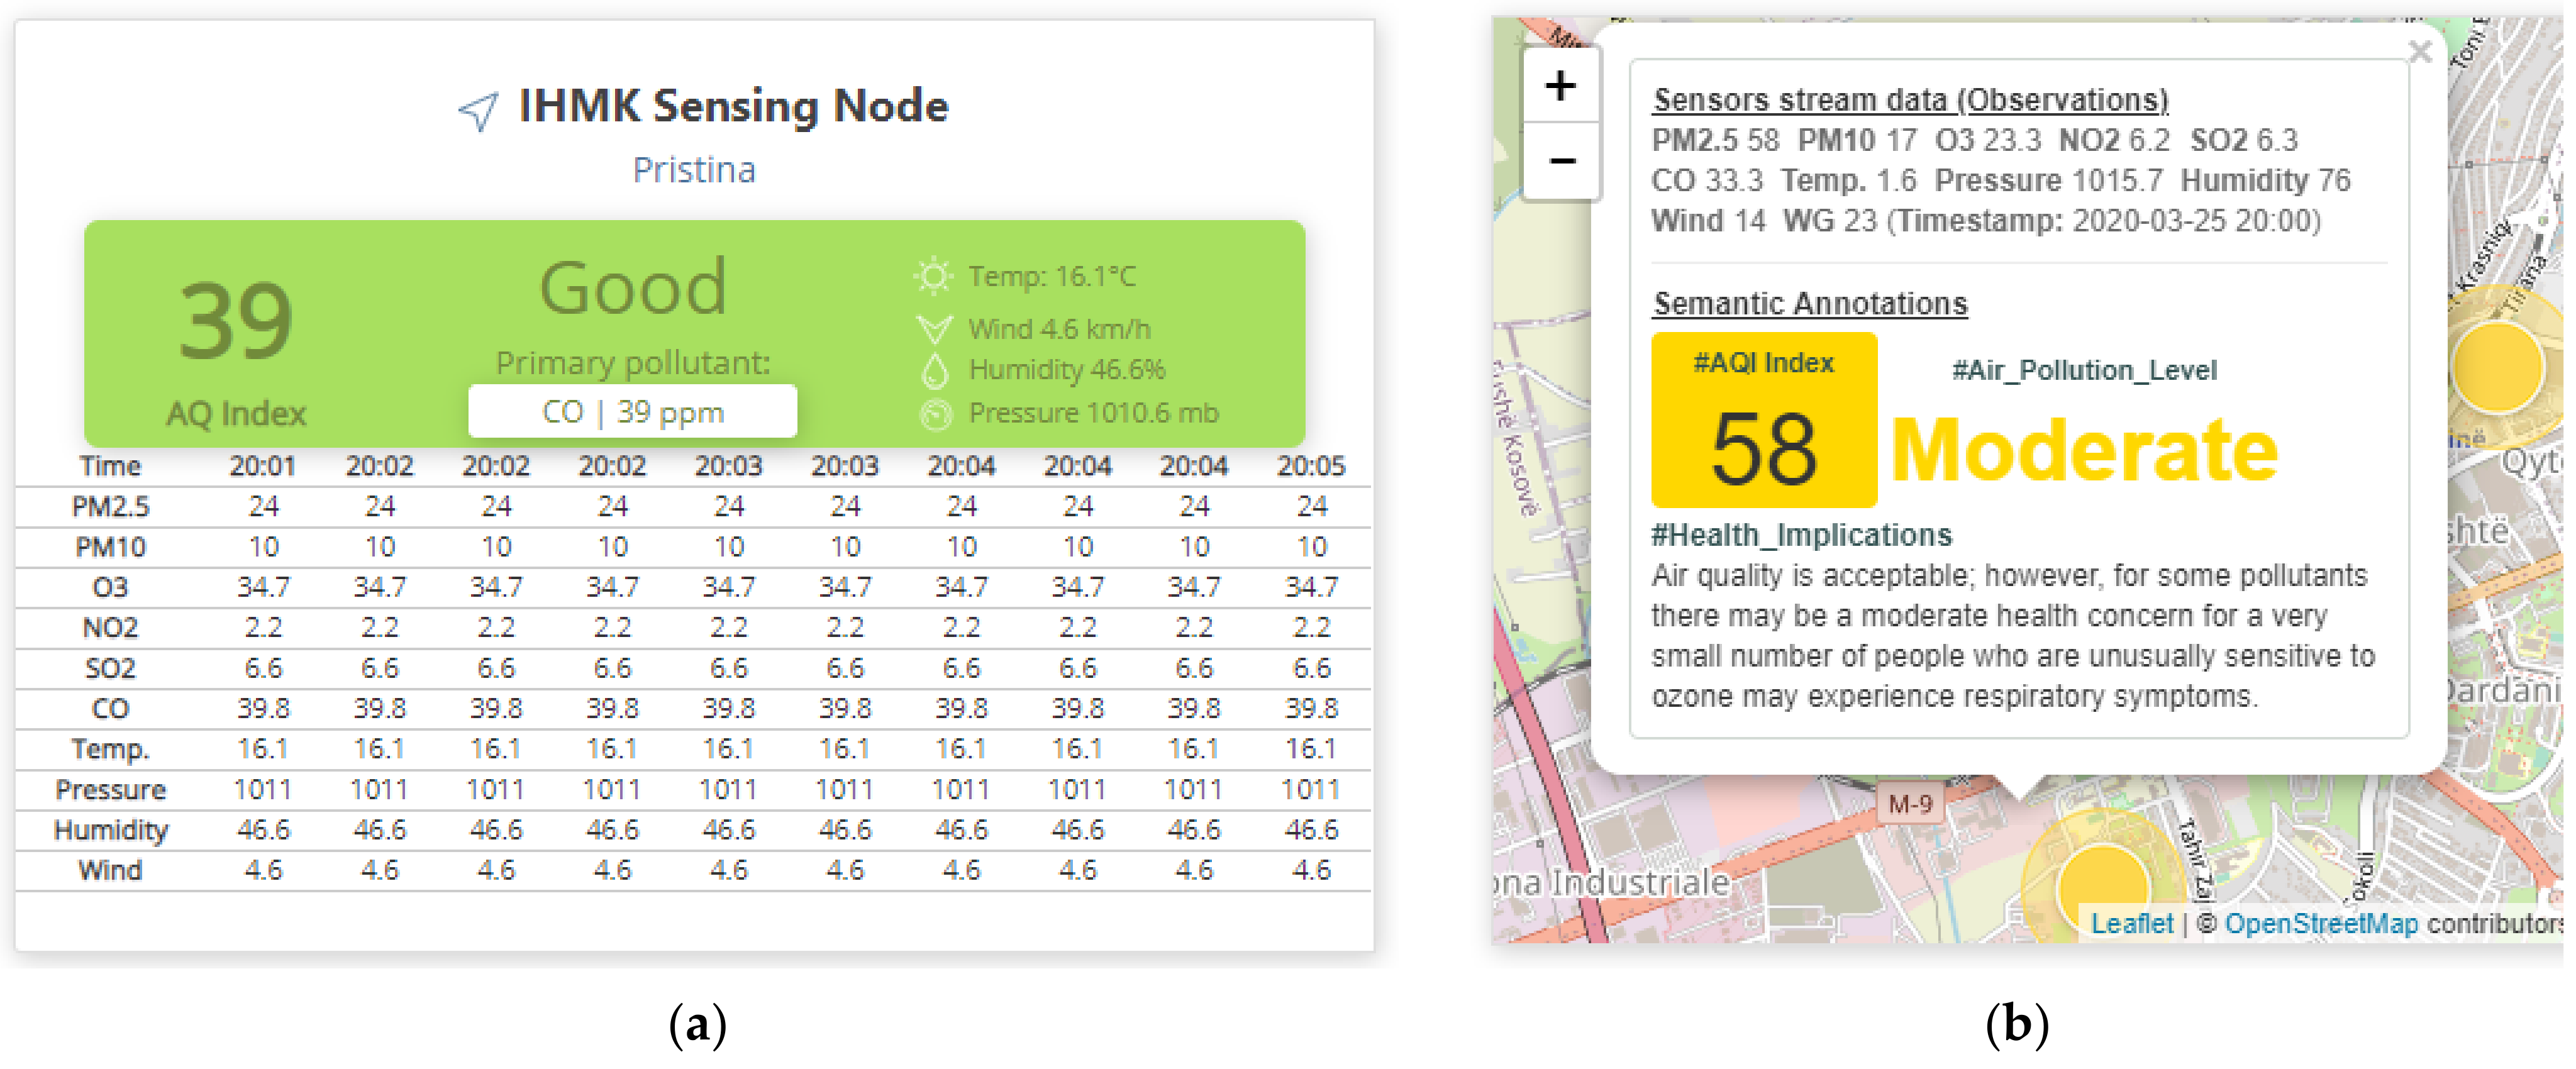
To display the heterogeneous sensor stream data and their semantic annotations and interpretation, a real time IoT application in the ASP.NET Core Model View Controller (MVC) is developed. To read data from Apache Casandra database, the “DataStax C# for Apache Cassandra” is used, while Leaflet is used to display the data in the map. As shown in Figure 12a,b and Figure 13, the users can observe the quality of air pollution for the chosen sensing node, including the latest measurement values obtained for that sensing node, such as PM2.5, PM10, O3, NO2, SO2, CO, Temperature, Pressure, Humidity, Wind, and Water Gauge; semantic annotations, such as #AQI Index, #Air Pollution Level, #Health Implications, #Higher Level Feature; and the interpretations of the semantic annotations, such as the following, are developed.
Now (@2021-08-22 13:18:17) in location ‘Pristina US Consulate (42.648872, 21.137121)’ is detected ‘58’ AQ index with primary pollutant ‘PM2.5 µg/m3’ and ‘Moderate’ air pollution level with health implications ‘Air quality is acceptable; however, for some pollutants there may be a moderate health concern for a very small number of people who are unusually sensitive to air pollution’. Moreover, a ‘Blizzard’ higher level feature is happening which manifests ‘A hazardous weather statement, which indicates a severe weather condition characterized by reduced visibility from falling and/or blowing snow and strong winds that may be accompanied by low temperatures. Detecting a Blizzard requires the Wind Speed to be more than 15.6 m/s (high), visibility to be less than 4 m (low) and snow precipitation, for at least 4 h’ .
2.2.5. APIs for External Systems
To share sensor metadata and sensor observed data (with semantic annotations) with IoT real-time monitoring external systems, an ASP.NET Web API, named IoTSAS.API, is developed. ASP.NET Web API is an extensible framework for building Hypertext Transfer Protocol (HTTP) services than can be accessed and consumed from any client including platforms such as desktop applications, console applications, web applications, mobile devices applications, etc. It is works similarly to the ASP.NET MVC web application except that is sends data (in JSON, XML, Binary Javascript Object Notation (BSON), or other format) as a response instead of html view.
2.3. System Network Architecture
The overall design of the system network architecture is shown in Figure 14, which includes the following:
- Apache Kafka Server: Apache Kafka operates and receives streaming observed data sent by sensors;
- Spark Streaming Cluster Server: core system (developed in Apache Spark Streaming) is installed;
- Apache Cassandra database Server: all data are stored;
- IoT Real-Time Web Application Server. These are hosted in Internet Information Services (IIS) modules such as the following: weather alerts monitoring module, air quality monitoring module, and metadata management module;
- Web Services Server: these are deployed APIs for external systems.
2.4. IoTSAS System Security
As for the security aspect of the IoTSAS system, in addition to the sensor metadata that are registered in the Metadata Management Module, each sensor is assigned a secret code. When sending the observed data, the sensor also sends this secret code as information to be identified.
To provide security in data encryption when communicating modules in networks, the Secure Sockets Layer (SSL) protocol is used. Users’ access to Metadata management module, weather alerts monitoring modules, and air quality monitoring modules is provided by using credentials such as username and password. The password is encrypted by using the .NET System.Security.Cryptography.SHA512 library, respectively, and the Hash Based Message Authentication Code Secure Hashing Algorithm 512 (HMACSHA512) hash function. A salt is added to the hashing process to force their uniqueness and to increase password complexity. To prevent Structured Query Language (SQL) injection attacks, the Language Integrated Query (LINQ) to Entities .Net 5.0 is used because LINQ is not vulnerable to SQL injection.
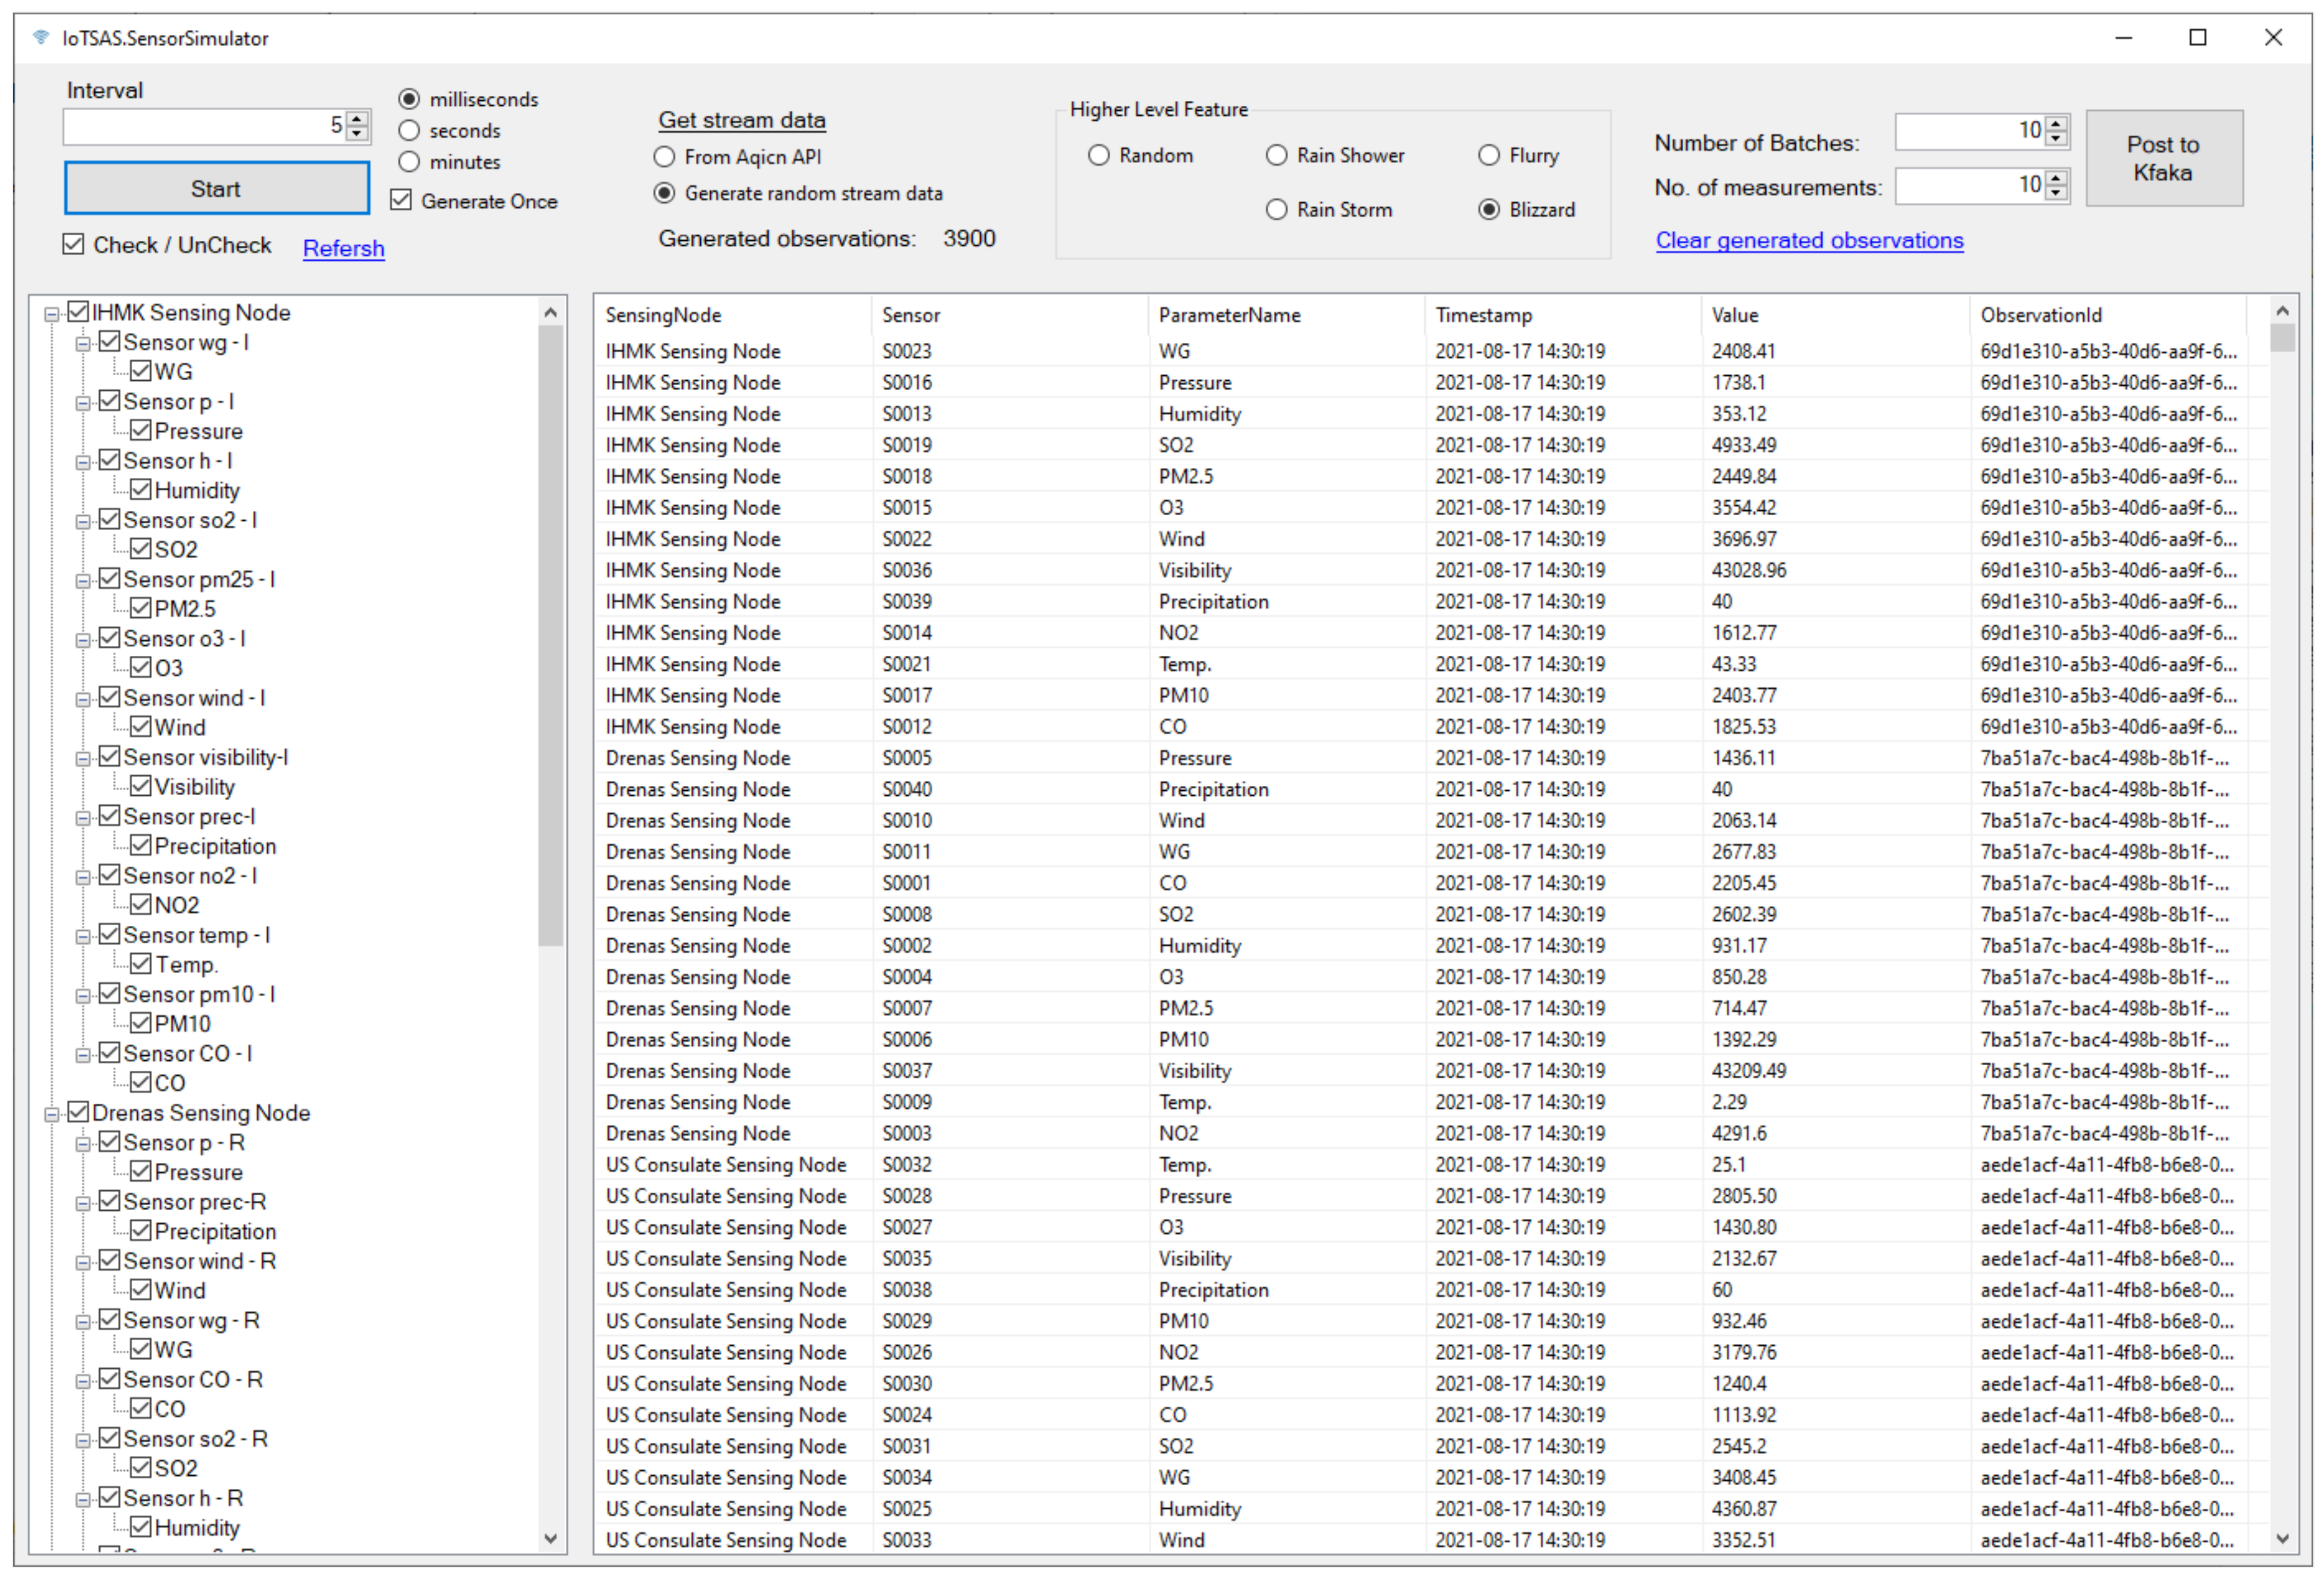
2.5. Sensor Stream Data Simulator
To test the performance of the IoTSAS system, simulating a huge amount of sensor stream data was necessary. Therefore, to accomplish this, a sensor stream data simulator, is developed, as shown in Figure 15. The simulator generates pseudo-random sensor stream data by using Random C# class (https://docs.microsoft.com/en-us/dotnet/api/system.random?view=net-5.0, accessed on 26 September 2021) in certain ranges that are defined for each parameter (phenomenon) in the metadata module. For example, the range of possible temperature values generated by the simulator is from −25 °C to 45 °C, according to [20]. As shown in Figure 15, the simulator can be configured to generate data at different intervals of milliseconds, seconds, or minutes. Moreover, specific sensor nodes can be selected to generate sensor stream data and higher level features, e.g., Blizzard can be selected to generate data from sensors that cause this phenomenon. The simulator is able to generate sensor stream data in batches and can send them for processing in the IoTSAS system.
3. System Testing Results
The testing of six modules, such as (a) real-time processing of integration semantics into sensor stream data module; (b) metadata management module; (c) air quality and (d) weather alerts monitoring module; (e) data modelling module; and (f) APIs module (for external systems) is performed on five testing phases.
Unit test is based exactly on the system’s specification and has covered the results of errors made during the coding phase.
Integration test is where the complete integration of the six modules is tested based on a prepared test scenario. Furthermore, Data Flow testing is performed in this phase, including each step-by-step process.
System test: As in the previous phase, all modules are ensured to work together without any errors. Furthermore, at this point the system is tested on whether it meets all the requirements and the security issues of the application, such as security level (encryption of modules communications, SQL Injections, and XSS—Cross Site Scripting), data confidentiality, access controls, and immunity.
Acceptance test (alpha and beta): in this phase, the system is tested with real data from sensors of the Hydrometeorological Institute of Kosovo (HMIK), Pristina US Consulate, Rilindja-Pristina, and Peje, as mentioned in Section 2.3.
Performance testing: By using the simulator (described in Section 2.5), it was possible to test the performance of the IoTSAS system. Testing is performed in network architecture, as shown in Figure 14. The technical specifications of the hardware environment, in which the test is performed, are presented in Table 1.
Table 2 shows the results of the IoTSAS system performance test. The tests are performed for different generated sensors observations data and are repeated three times to obtain more accurate averages considering the current load of the processor, memory in use by active processes, network, etc.
Figure 16a presents the test performance of 100 to 10,000 generated sensors observation data. The average time required for real-time processing of 100 observations by annotating with semantics and interpreting them is 0.123 s, while the average time required for processing of 10,000 observations is 1.37 s.
In Figure 16b, the volume testing is presented, which determines the efficiency of the IoTSAS system performance with large volume of generated sensors observations data. The average time required for real-time processing of 500,000 observations by annotating with semantics and interpreting them is 67.63 s, while the average time required for processing of 1,000,000 observations is 138 s.
Based on the World Air Quality Index database, the statistics of monitoring stations in different European countries by area have been obtained and analyzed. As shown in Table 3, there are a total of 2510 monitoring stations in European countries which continuously send hourly observed data to the World Air Quality Index database. The maximum number of observed phenomena (parameters) for monitoring station is 13, which means that we have a maximum of 13 sensors observations data for one monitoring station. Therefore, this means that we have a maximum of 32,630 sensors observation data in Europe with 2510 monitoring stations. If these sensors observation data are sent to the server at the same time, the IoTSAS system will process, annotate, and interpret in real-time in less than 50 s.
If we calculate for 76,923 monitoring stations with 13 parameters for each monitoring station (1,000,000 sensors observations/13 parameters per station), which send observed data at the same time (all at once), then it means that the IoTSAS system will be able to process, annotate, and interpret within 138 s based on the test results, which indicates good system performance.
A comparative analysis of IoTSAS system performance and the existing systems is presented in Table 4. In paper [12], in which hardware is not specified, the required time to process 1104 observations is over 200 s, while the IoTSAS system requires only 0.35 s for the same number of observations in our environment. In paper [16], the required time to process 10,000 sensor observations is over 2.5 s, and our system processes sensor observations in 1.37 s. In paper [13], the required time to process 56,570 records is approximately 60 s, while our system takes approximately 7 s for the same number of observations. Based on these results, we can say that the developed IoTSAS system provides good performance.
4. Conclusion and Future Research
In the IoT technologies, Wireless Sensor Networks (WSNs) have a key role in continuously producing and transmitting data in the stream format to the central server for further processing. Recently, semantics are becoming a key component in different IoT domains to annotate sensor stream data and to provide a better understanding, interpretation, and more meaningful descriptions that enable IoT application areas to become much more intelligent.
In this paper, an integrated system of real-time semantic annotated and interpreted IoT sensor stream data, named IoTSAS, is presented. First, an overview of the system architecture composed by two main components is given: (a) Real-Time Semantic Annotation (RTSA) component, which enables a real-time integration of semantics into heterogeneous sensor stream data with context in the IoT, and (b) Real-Time Interpreting Semantically Annotated (RTISA) component, which enables real-time interpretation of semantics from heterogeneous sensor observation data. Next, the technologies such as Apache Kafka, Spark Streaming, Apache Cassandra database, and standards such as OGC Sensor Web Enablement, which are utilized to build the IoTSAS system, are described. Then, the implementation of the six system modules is provided: (1) real-time processing of integration and interpretation of semantics into sensor stream data module; (2) data modelling module; (3) IoT management metadata module; (4) weather alerts and (5) air quality monitoring modules; and (6) APIs for external systems module. The validity of IoTSAS and the proposed system architecture through the real sensor stream data from the World Air Quality Index API is provided as well. Finally, to test the IoTSAS performance, a sensor stream data simulator is developed. Based on the performance testing results of the 1,000,000 sensors observations data, the IoTSAS system processed real-time by annotating with semantics and interpreting the semantic annotations only for 138 s, which proves the validity of high system performance.
The contributions of this paper in the context of semantic annotations and interpretations, sensor stream data, and IoT scientific research are as follows: The SOS O&M standards are extended by adding two extra elements, swe:sem-annoations and swe:sem-intepretations; different semantic annotations such as #Blizzard, #Flurry, #Rain_Storm, #Rain_Shower, #AQI_Index, #Air_Pollution_Level, and #Health_Implications in weather alerts and air quality monitoring IoT domains are developed; a semantic annotated data stream management model is developed which can be used by other IoT scientific researcher to store their IoT sensor data; the developed system provides information in real-time to citizens about the health implications from air pollution and weather conditions, e.g., blizzard, flurry, etc. As of now, these are the contributions of this paper, but the research can progress as in the following directions in the future:
- To more advanced annotation techniques for integration and interpretation of the semantic annotations in real time into heterogeneous sensor observation data and metadata within the context of the Internet of Things, such as XPath annotations;
- To implement a module illustrating a healthcare monitoring use case through which it will be possible to monitor patients in real time and will notify doctors about changes in their patients’ health condition;
- To extend the proposed system architecture for supporting insert sensor with XML request by using standards of Sensor Web Enablement (SWE), respectively; version 2.0 of the Sensor Observations Service (SOS) standard relies on the Open Geospatial Consortium (OGC);
- To advance the components Outlier Stream Validator and Stream Classificator of the proposed model by implementing some advanced outlier detection algorithms for real time unsupervised anomaly detection.
Author Contributions
Conceptualization, B.S., L.A. and F.I.; methodology, B.S.; software, B.S.; validation, B.S., F.I. and L.A.; formal analysis, B.S.; investigation, B.S.; resources, B.S.; writing—original draft preparation, B.S.; writing—review and editing, F.I. All authors have read and agreed to the published version of the manuscript.
Funding
This research received no external funding.
Institutional Review Board Statement
Not applicable.
Informed Consent Statement
Not applicable.
Data Availability Statement
Data is contained within the article.
Conflicts of Interest
The authors declare no conflict of interest.
References
- Sejdiu, B.; Ismaili, F.; Ahmedi, L. Integration of semantics into sensor data for the IoT—A Systematic Literature Review. Int. J. Semant. Web Inf. Syst. 2020, 16, 1–25. [Google Scholar] [CrossRef]
- OGC, Open Geospatial Consortium. Available online: https://www.ogc.org (accessed on 1 February 2021).
- Sheth, A.; Henson, C.; Sahoo, S.S. Semantic Sensor Web. IEEE Internet Comput. 2008, 12, 78–83. [Google Scholar] [CrossRef]
- Shi, F.; Li, Q.; Zhu, T.; Ning, H. A Survey of Data Semantization in Internet of Things. Sensors 2018, 18, 313. [Google Scholar] [CrossRef] [PubMed] [Green Version]
- Gao, L.; Bruenig, M.; Hunter, J. Estimating Fire Weather Indices via Semantic Reasoning over Wireless Sensor Network Data Streams. ArXiv 2014, arXiv:abs/1411.2186. [Google Scholar] [CrossRef] [Green Version]
- Pacha, S.; Murugan, S.R.; Sethukarasi, R. Semantic annotation of summarized sensor data stream for effective query processing. J. Supercomput. 2020, 6, 4017–4039. [Google Scholar] [CrossRef]
- Tu, D.Q.; Kayes, A.S.M.; Rahayu, W. IoT streaming data integration from multiple sources. Computing 2020, 102, 2299–2329. [Google Scholar] [CrossRef]
- Sejdiu, B.; Ismaili, F.; Ahmedi, L. A real-time integration of semantics into heterogeneous sensor stream data with context in the Internet of Things. Int. Conf. Softw. Technol. 2020, 11, 376–383. [Google Scholar]
- Rhayem, A.; Mhiri, A.; Gargouri, F. Semantic Web Technologies for the Internet of Things: Systematic Literature Review. Internet Things 2020, 11, 100206. [Google Scholar] [CrossRef]
- Honti, G.M.; Abonyi, J. A Review of Semantic Sensor Technologies in Internet of Things Architectures. Complexity 2019, 2021, 1–22. [Google Scholar] [CrossRef] [Green Version]
- Krishnamurthi, R.; Kumar, A.; Gopinathan, D.; Nayyar, A.; Qureshi, B. An Overview of IoT Sensor Data Processing, Fusion, and Analysis Techniques. Sensors 2020, 20, 6076. [Google Scholar] [CrossRef]
- Patni, H.K.; Henson, C.A.; Cooney, M.; Sheth, A. Demonstration: Real-Time Semantic Analysis of Sensor Streams. Proc. 4th Int. Workshop Semant. Sens. Netw. 2011, 11, 119–122. [Google Scholar]
- Tu, D.Q.; Kayes, A.S.; Rahayu, W.; Nguyen, K. ISDI: A New Window-Based Framework for Integrating IoT Streaming Data from Multiple Sources. AINA 2019, 11, 142. [Google Scholar]
- Elsaleh, T.; Enshaeifar, S.; Rezvani, R.; Acton, S.T.; Janeiko, V.; Bermudez-Edo, M. IoT-Stream: A Lightweight Ontology for Internet of Things Data Streams and Its Use with Data Analytics and Event Detection Services. Sensors 2020, 20, 953. [Google Scholar] [CrossRef] [PubMed] [Green Version]
- Vanden, H.S.; Moens, P.; Van Herwegen, J.; De Paepe, D.; Steenwinckel, B.; Verstichel, S.; Ongenae, F.; Van Hoecke, S. A Dynamic Dashboarding Application for Fleet Monitoring Using Semantic Web of Things Technologies. Sensors 2020, 11, 1152. [Google Scholar] [CrossRef] [PubMed] [Green Version]
- Ali, M.I.; Ono, N.; Kaysar, M.; Griffin, K.; Mileo, A. A Semantic Processing Framework for IoT-Enabled Communication Systems. In The Semantic Web-ISWC 2015. ISWC 2015; Lecture Notes in Computer Science; Springer: Cham, Switzerland, 2015; Volume 9367. [Google Scholar]
- Kayes, A.S.M.; Han, J.; Colman, A. PO-SAAC: A Purpose-Oriented Situation-Aware Access Control Framework for Software Services. In Advanced Information Systems Engineering; Lecture Notes in Computer Science; Springer: Cham, Switzerland, 2014; Volume 8484. [Google Scholar]
- Dhalla, H.K. A Performance Comparison of RESTful Applications Implemented in Spring Boot Java and MS.NET Core. In Proceedings of the Virtual Conference on Engineering, Science and Technology (ViCEST), Kuala Lumpur, Malaysia, 12–13 August 2020. [Google Scholar]
- Aqicn, API–Air Quality Programmatic APIs. Available online: https://aqicn.org/api (accessed on 3 February 2021).
- NASA. NASA Earth Observatory. Available online: https://earthobservatory.nasa.gov (accessed on 4 August 2021).
Figure 1.
An overview of the system architecture.

Figure 2.
IoTSAS (IoT Semantic Annotations System) modules.

Figure 3.
IoTSAS Solution workspaces: (a) Java packages of core module; and (b) .Net C# projects of other modules.
Figure 3.
IoTSAS Solution workspaces: (a) Java packages of core module; and (b) .Net C# projects of other modules.

Figure 4.
Real-time processing of integration and interpretation of semantics into sensor stream data.
Figure 4.
Real-time processing of integration and interpretation of semantics into sensor stream data.

Figure 5.
Complex observation SOS O&M standard document (with semantic annotations and interpretations).
Figure 5.
Complex observation SOS O&M standard document (with semantic annotations and interpretations).

Figure 6.
Diagram of data modeling implementation.

Figure 7.
Data of the Archival Data Streams, Archival Data Stream Annotations, and Process Data Streams.
Figure 7.
Data of the Archival Data Streams, Archival Data Stream Annotations, and Process Data Streams.

Figure 8.
IoTSAS Metadata Management module—adding new device.

Figure 9.
IoTSAS Metadata Management module—adding new sensing node.

Figure 10.
Input sensor stream data—JSON format.

Figure 11.
IoT semantic annotations ontology for the following: (a) air quality monitoring and (b) weather alerts monitoring.
Figure 11.
IoT semantic annotations ontology for the following: (a) air quality monitoring and (b) weather alerts monitoring.

Figure 12.
System outputs: (a) monitoring air quality pollution; (b) map view.

Figure 13.
System outputs: Real-time integration and interpretation of semantic annotations.

Figure 14.
Network architecture of IoTSAS.

Figure 15.
Sensor stream data simulator.

Figure 16.
Test performance of (a) 100–10,000 sensors observations data and (b) 20,000–1,000,000 sensors observations data.
Figure 16.
Test performance of (a) 100–10,000 sensors observations data and (b) 20,000–1,000,000 sensors observations data.


Table 1.
Technical specifications of the hardware environment.
| Server | Processor | RAM Memory | OS |
|---|---|---|---|
| Spark Streaming Cluster Server | Intel® Xeon® CPU x5570 @ 2.93GHz (4 CPUs), ~2.9GHz | 32GB | Windows Server 2016 Datacenter 64-bit (10.0, Build 14393) |
| Apache Cassandra database Server | Intel® Xeon® CPU x5570 @ 2.93GHz (4 CPUs), ~2.9GHz | 32GB | Windows Server 2016 Datacenter 64-bit (10.0, Build 14393) |
| Apache Kafka Server | Intel® Core™ i5-4200M CPU @ 2.50GHz (4 CPUs), ~2.5GHz | 8GB | Windows 10 Pro 64-bit (10.0, Build 19042) |
| IoT Real-Time Web Application Server | Intel® Core™ 2 Duo CPU e7500 @ 2.93GHz (2 CPUs), ~2.9GHz | 16GB | Windows Server 2019 Datacenter 64-bit(10.0, Build 17763) |
| Web Services Server | Intel® Xeon® CPU E5-2650 v4 @ 2.20GHz (4 CPUs), ~2.2GHz | 6GB | Windows Server 2012 Standard 64-bit (6.3, Build 9600) |
Table 2.
Results of the IoTSAS system performance test.
| No. of Observations | Test 1 (Second) | Test 2 (Second) | Test 3 (Second) | AVG (Second) |
|---|---|---|---|---|
| 100 | 0.122 | 0.118 | 0.128 | 0.123 |
| 500 | 0.184 | 0.154 | 0.207 | 0.182 |
| 1000 | 0.287 | 0.281 | 0.269 | 0.279 |
| 5000 | 0.901 | 0.909 | 0.897 | 0.902 |
| 10,000 | 1.417 | 1.372 | 1.329 | 1.373 |
| 20,000 | 2.587 | 2.558 | 2.807 | 2.65 |
| 50,000 | 6.634 | 6.698 | 6.511 | 6.61 |
| 100,000 | 14.257 | 14.443 | 14.257 | 14.32 |
| 150,000 | 21.376 | 21.317 | 21.749 | 21.48 |
| 250,000 | 35.245 | 36.131 | 34.508 | 35.29 |
| 500,000 | 67.934 | 66.927 | 68.029 | 67.63 |
| 1,000,000 | 141.07 | 139.33 | 134.18 | 138.20 |
Table 3.
Statistics of monitoring stations in different European countries by area.


Table 4.
Performance comparison of existing systems vs. IoTSAS system.
| Paper [12] | Paper [16] | Paper [13] | |
|---|---|---|---|
| Hardware | N/A | 8-cores of 2.13 GHz processor and 64 GB RAM | 3.4 GHz CPU, 4 Core(s) and 8 logical processors with 16GB RAM |
| Number of Sensors/Observations | 1104 | 10,000 | 56,570 |
| Average processing time (seconds) | >200 s | >2.5 s | ~60 s |
| Our IoTSAS system (average processing time in environment, presented inTable 1) | 0.35 s | 1.37 s | ~7 s |
Publisher’s Note: MDPI stays neutral with regard to jurisdictional claims in published maps and institutional affiliations. |
© 2021 by the authors. Licensee MDPI, Basel, Switzerland. This article is an open access article distributed under the terms and conditions of the Creative Commons Attribution (CC BY) license (https://creativecommons.org/licenses/by/4.0/).
Share and Cite
MDPI and ACS Style
Sejdiu, B.; Ismaili, F.; Ahmedi, L. IoTSAS: An Integrated System for Real-Time Semantic Annotation and Interpretation of IoT Sensor Stream Data. Computers 2021, 10, 127. https://0-doi-org.brum.beds.ac.uk/10.3390/computers10100127
AMA Style
Sejdiu B, Ismaili F, Ahmedi L. IoTSAS: An Integrated System for Real-Time Semantic Annotation and Interpretation of IoT Sensor Stream Data. Computers. 2021; 10(10):127. https://0-doi-org.brum.beds.ac.uk/10.3390/computers10100127
Chicago/Turabian StyleSejdiu, Besmir, Florije Ismaili, and Lule Ahmedi. 2021. "IoTSAS: An Integrated System for Real-Time Semantic Annotation and Interpretation of IoT Sensor Stream Data" Computers 10, no. 10: 127. https://0-doi-org.brum.beds.ac.uk/10.3390/computers10100127
Note that from the first issue of 2016, this journal uses article numbers instead of page numbers. See further details here.