
Evaluating GraphQL and REST API Services Performance in a Massive and Intensive Accessible Information System


1
Department of Information Systems, Hasanuddin University, Makassar 90245, Indonesia
2
Department of Computer Science, Pancasakti University, Makassar 90132, Indonesia
3
Department of Computer Science and Networks, Kyushu Institute of Technology, Iizuka 820-8502, Japan
*
Author to whom correspondence should be addressed.
Computers 2021, 10(11), 138; https://0-doi-org.brum.beds.ac.uk/10.3390/computers10110138
Submission received: 20 September 2021
/
Revised: 22 October 2021
/
Accepted: 22 October 2021
/
Published: 27 October 2021
Abstract
:Currently, most middleware application developers have two choices when designing or implementing Application Programming Interface (API) services; i.e., they can either stick with Representational State Transfer (REST) or explore the emerging GraphQL technology. Although REST is widely regarded as the standard method for API development, GraphQL is believed to be revolutionary in overcoming the main drawbacks of REST, especially data-fetching issues. Nevertheless, doubts still remain, as there are no investigations with convincing results in evaluating the performance of the two services. This paper proposes a new research methodology to evaluate the performance of REST and GraphQL API services with two main ideas as novelties. The first novel method is the evaluation of the two services is performed on the real ongoing operation of the management information system, where massive and intensive query transactions take place on a complex database with many relationships. The second is the fair and independent performance evaluation results obtained by distributing client requests and synchronizing the service responses on the two virtually separated parallel execution paths for each API service, respectively. The performance evaluation was investigated using basic measures of QoS (Quality of Services), i.e., response time, throughput, CPU load, and memory usage. We use the term efficiency in comparing the evaluation results to capture differences in their performance measures. The statistical hypothesis parameters test using the two-tails paired t-test, and boxplot visualization was also given to confirm the significance of the comparison results. The results showed REST is still faster up to 50.50% in response time and 37.16% for throughput, while GraphQL is very efficient in resource utilization, i.e., 37.26% for CPU load and 39.74% for memory utilization. Therefore, GraphQL is the right choice when data requirements change frequently, and resource utilization is the most important consideration. REST is used when some data are frequently accessed and called by multiple requests.
1. Introduction
For the past two decades, Representational State Transfer (REST) has been considered the standard architecture for designing and implementing Application Programming Interfaces (APIs) as back-end applications or server-side web services. However, it is believed that the practical use of REST in the API world will soon change due to the potential emergence of GraphQL. Most middleware application developers today are at a crossroads whether they should stick with REST or face the challenges of the emergent GraphQL technology when building and implementing APIs. GraphQL is considered a revolutionary technology because of its simplicity of use and its ability to reduce workload problems on the server; hence, it can overcome the main drawbacks of REST in data retrieval [1,2,3,4]. However, there are still a lot of doubts and talk about GraphQL when compared to its predecessor REST. This doubt arises because there have been no convincing experimental investigation results in evaluating the performance of REST and GraphQL API services that support Quality of Service (QoS).
The REST API is built on several endpoints to determine data retrieval since those endpoints are called frequently. Having multiple endpoints increases the number of client–server calls for data retrieval, which may be more efficient than using a single endpoint. Therefore, the REST response speed is considered adequate but requires a lot of computational resources such as process loading and memory consumption [5,6,7]. On the other hand, a GraphQL API built with a single endpoint is a little slow at running complex database queries that have multiple relationships. However, this problem was addressed by exposing the graph structure for the data service. The advantage of retrieving data on a single endpoint can result in efficient server resource workloads such as CPU load and memory usage. Simply put, it is nothing more than a query language for building API services. Although GraphQL query language is not tied to any particular database or storage engine, it is supported by existing code and data. GraphQL is positioned on the server side which executes the query using the system type defined for the data. This API technology was developed by Facebook in 2012 and immediately boomed among web application developers when the technology was published in 2015 [8,9,10,11].
The performance comparison of REST and GraphQL has been reported in some experimental papers. However, the results were mostly from simulations or execution of simple application development; therefore, the results were either inconclusive or inconsistent. Experiments have tested basic operations in network services, i.e., displaying, adding, editing, and deleting data [12]. The performance tests were measured using the JMeter tool. The results showed no difference in performance in adding, editing, and deleting data for both services. Differences in performance for display operations were observed under heavy load conditions. GraphQL had a better performance in downloading small amount of data, while REST indicated a higher performance in downloading large amounts of data [12]. Contradictory results were obtained in [13]: the migration to GraphQL resulted in an improved performance in terms of the average number of requests per second and data transfer rate for two-thirds of the applications tested. However, it was found that the performance of the services after migration for GraphQL was below REST. Both REST and GraphQL architectures showed a similar performance for more trivial workloads [13]. Another comparative analysis on real website samples using REST and GraphQL architectures in terms of different Internet connection qualities, code complexity, and the required number of requests is presented in [14]. For different Internet connection speeds, they analyzed the number of different records in the database and the total time required to show users the desired content on the website. Their results showed that GraphQL provides a significant reduction in the total time and number of HTTP requests compared to REST technology, which is very important for the user experience and the quality of web applications [14]. A more contrasting result based on a decision model showed more differences between REST and GraphQL technologies in [15]. In their conclusion, REST results in a much more flexible and GraphQL solution that is easy to use but more restrictive for developers. GraphQL also requires an implementation that sets some restrictions on which languages may be used whereas REST does not [15].
This paper proposes a new research methodology to evaluate the performance of REST and GraphQL API services with two main ideas as novelties.. The first novel method is the evaluation of the two services is performed on the real ongoing operation of the management information system, where massive and intensive query transactions take place on a complex database with many relationships. The data source for this investigation is primary data from transaction queries on a Management Information System of the Hasanuddin University Research and Community Service Institute, called SIM-LP2M [10]. Therefore, the results of the performance evaluations, derived from real client transaction activities that cannot be repeated, are not simulations, and must be carefully and accurately conducted in such a way as to not interfere with the operation of the running system. The second novel method is the fair and independent performance evaluation results obtained for both API services. In this method, the request synchronization node plays an important role in distributing client requests and synchronizing service responses to two parallel execution paths for each API service. The execution path resides in a separate virtual machine connected to a single-database engine hosting two identical and isolated schemas. For each performance measurement result, the findings of the performance evaluation are given and discussed. The statistical hypothesis parameters test using the two-tails paired t-test and boxplot visualization is also given to confirm the significance of the comparison results. This research is expected to contribute to researchers and developers working on information systems or middleware applications that use REST services and the GraphQL API.
The remainder of this paper is organized as follows: Section 2 describes the materials and methods used in the performance evaluation study of two API service technologies. The experimental design used in this work, including the evaluated architecture and implementation of REST and GraphQL, is described in Section 3. Then, Section 4 presents the experimental performance evaluation results and discusses the comparison of these results. Section 5 concludes the paper.
2. Materials and Methods
2.1. Evaluated System Architecture
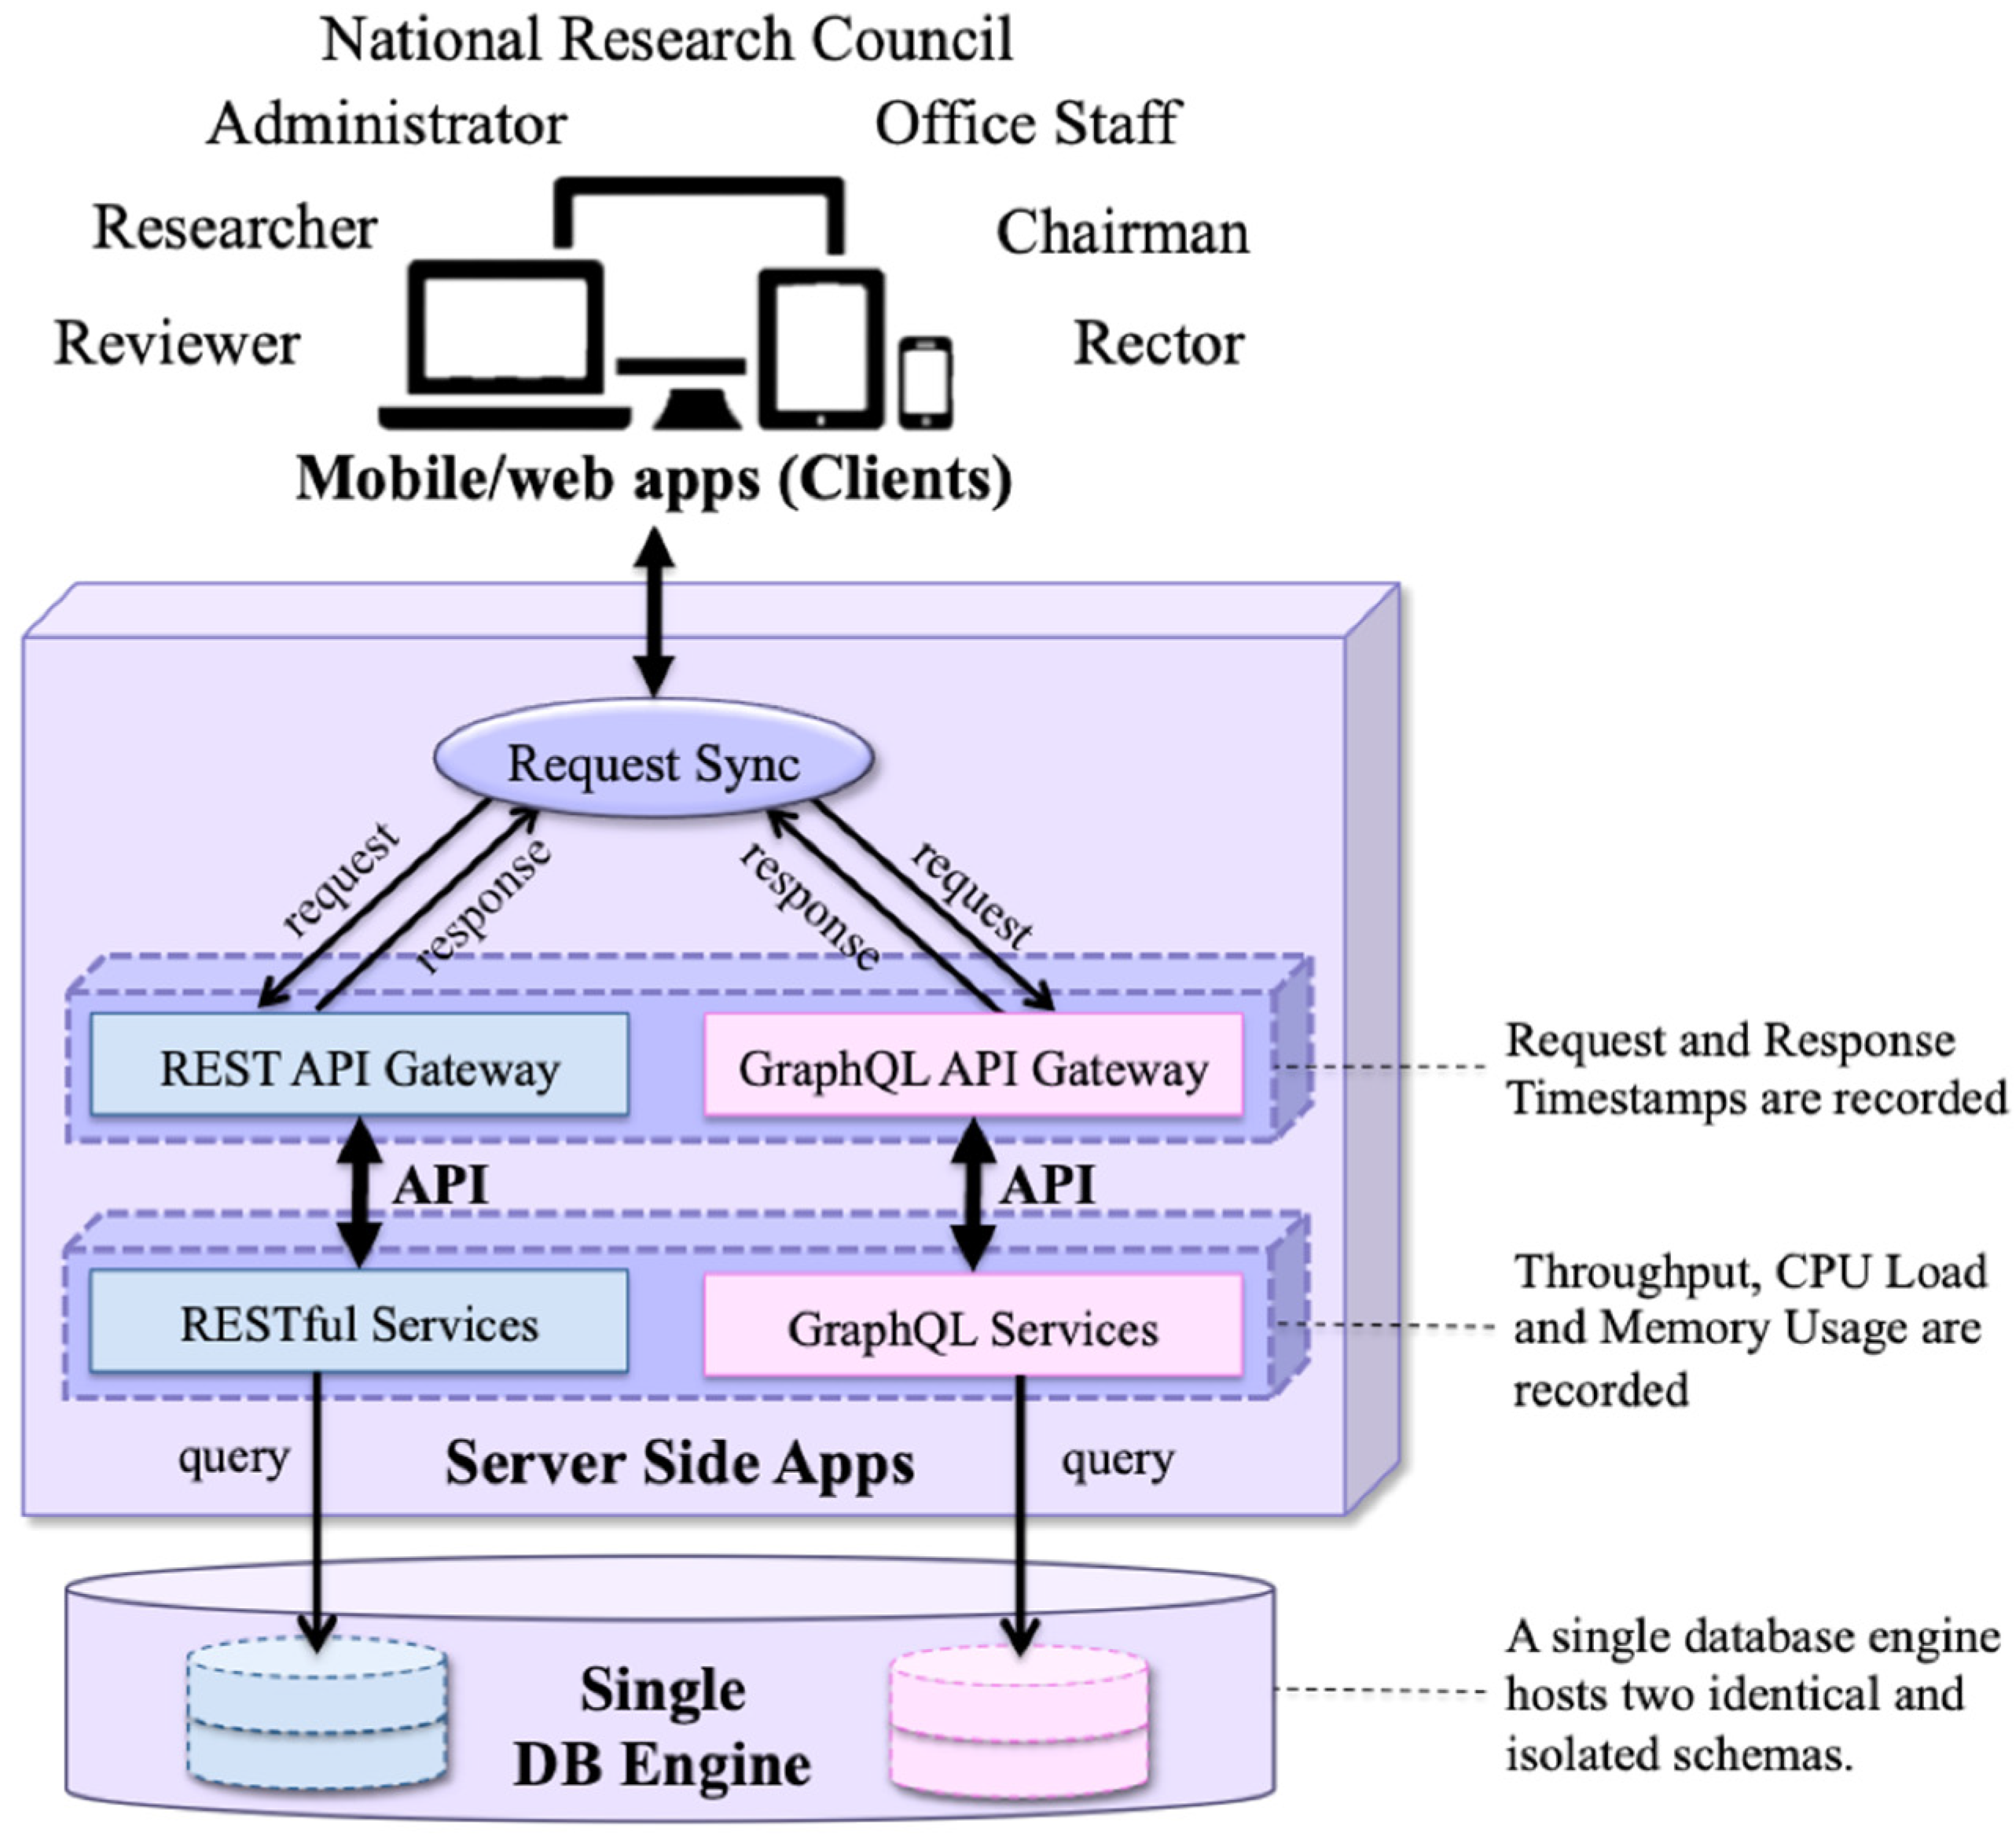
The performance investigation for both REST and GraphQL API services is evaluated in two independent monolithic information system architectures. The architecture of these two client–server services only handles requests made to the endpoint as per the REST and GraphQL specifications. The two services are separated via request sync when a client triggers a series of actions or transactions using the SIM-LP2M system. The synced transaction requests from clients are then distributed in parallel to each API gateway for the respective REST and GraphQL services. The API gateway serves as an entry point to provide secure and unified access as well as manage incoming and outgoing traffic to each API service. Without a gateway, transactions would just be a segmented collection of related APIs and certainly less effective than a unified API, which can also provide identity validation services for performance evaluation. The API services are bounded to a single-database engine that hosts two identical and isolated schemas virtually for both REST and GraphQL. Thus, we can evaluate the performance of both services fairly and independently. The connection between the server and the client is made using the Hypertext Transfer Protocol (HTTP) [16]. The illustration of the evaluated system architecture is depicted in Figure 1.
The SIM-LP2M is deployed in 3 entities, i.e., web/mobile applications or clients, web services (server side applications), and database (persistent storage resource). Clients of the system consist of 7 actors, i.e., rector of the university, chairman of LP2M, members of the National Research Council of the university, office, staffs, administrators, reviewers, and researchers. Each actor has their own privileged tasks and some restrictions in accessing and modifying data. Restriction access to the data attributes in the database is implemented according to the designed RACI (Responsible, Accountable, Consulted, and Informed) matrix. This matrix is also used as the basis in designing the class diagrams for database tables and methods/procedures for each user [16].
Although the proposed method is designed to evaluate the architecture of two independent monolithic information systems (due to the aim of this paper being to compare the performance of REST and GraphQL), this method can be further extended to more developed work related to evaluate the performance of multiple applications with service technologies or even microservices. Performance evaluation is important and indispensable for optimizing resource services such as cloud computing technology that applies multi-architectural patterns with various microservices, especially models that provide a Back-end as a Service (BaaS) platform [17]. To this end, we can take advantage of the API Gateway’s role in handling requests and responses to manage various transactions in the database engine. The development of this method is very interesting to be discussed and investigated further to measure the scalability and availability of the provided services. We leave this issue as one of the most important aspects for the future work.
2.2. Data Sources
The primary data source originates from requests directed to the API gateways and services that generate queries to the database as a result of client activities on the system. When there are a series of actions or transactions to the database such as CREATE, READ, UPDATE, and DELETE (CRUD), they are first synchronized and then distributed in parallel to the REST and GraphQL API gateways, respectively. Therefore, data related to response time are counted by the differences between request and response timestamps recorded in the API gateway. Meanwhile, other data related to throughput, CPU load, and memory utilization are measured on API service activities. The implementation of CRUD actions from the front-end application to the API gateways are expressed in HTML methods, i.e., CREATE (PUT/POST), READ (GET), UPDATE (PUT/POST/PATCH), and DELETE (DELETE). To ensure data validity despite errors and failures, the properties of ACID (Atomicity, Consistency, Isolation, and Durability) are applied to database transactions.
The performance data are evaluated from the real transaction activities in the SIM-LP2M system that is quite complex and very diverse. These activities include the research proposal submissions, administrative desk evaluations, evaluation of research presentations, budget justification, evaluation of proposal revisions, evaluation of the proposal score, reviewer selection, decisions of grant recipients, monitoring and evaluation (research progress and final results), reporting activities, etc. Along with these activities, the SIM-LP2M system intensively and massively accesses the database server with various actors and tasks. Since the performance data are primary and they are derived from the real operational of client transaction activities, they are not simulations, cannot be repeated, and must be carefully and accurately conducted in such a way that does not interfere with the operation of the running system.
2.3. Application Programming Interface (API)
The context of Application Programming Interfaces (APIs) in the field of software engineering and information systems is very different and refers to the interface elements of an application that can be called or executed at various levels of abstraction in a system. To further narrow the scope, this paper limits the API in context as a backend-side functionality that queries specific data on a persistent storage resource via an interface defined as API web services. The web services concept appears to bridge existing information systems (middleware) without disputing the difference in the platforms used by each source [3,6,15,18]. In building web services, the technologies most often applied are Simple Object Access Protocol (SOAP), Representational State Transfer (REST), and, most recently, GraphQL.
2.3.1. Representational State Transfer (REST)
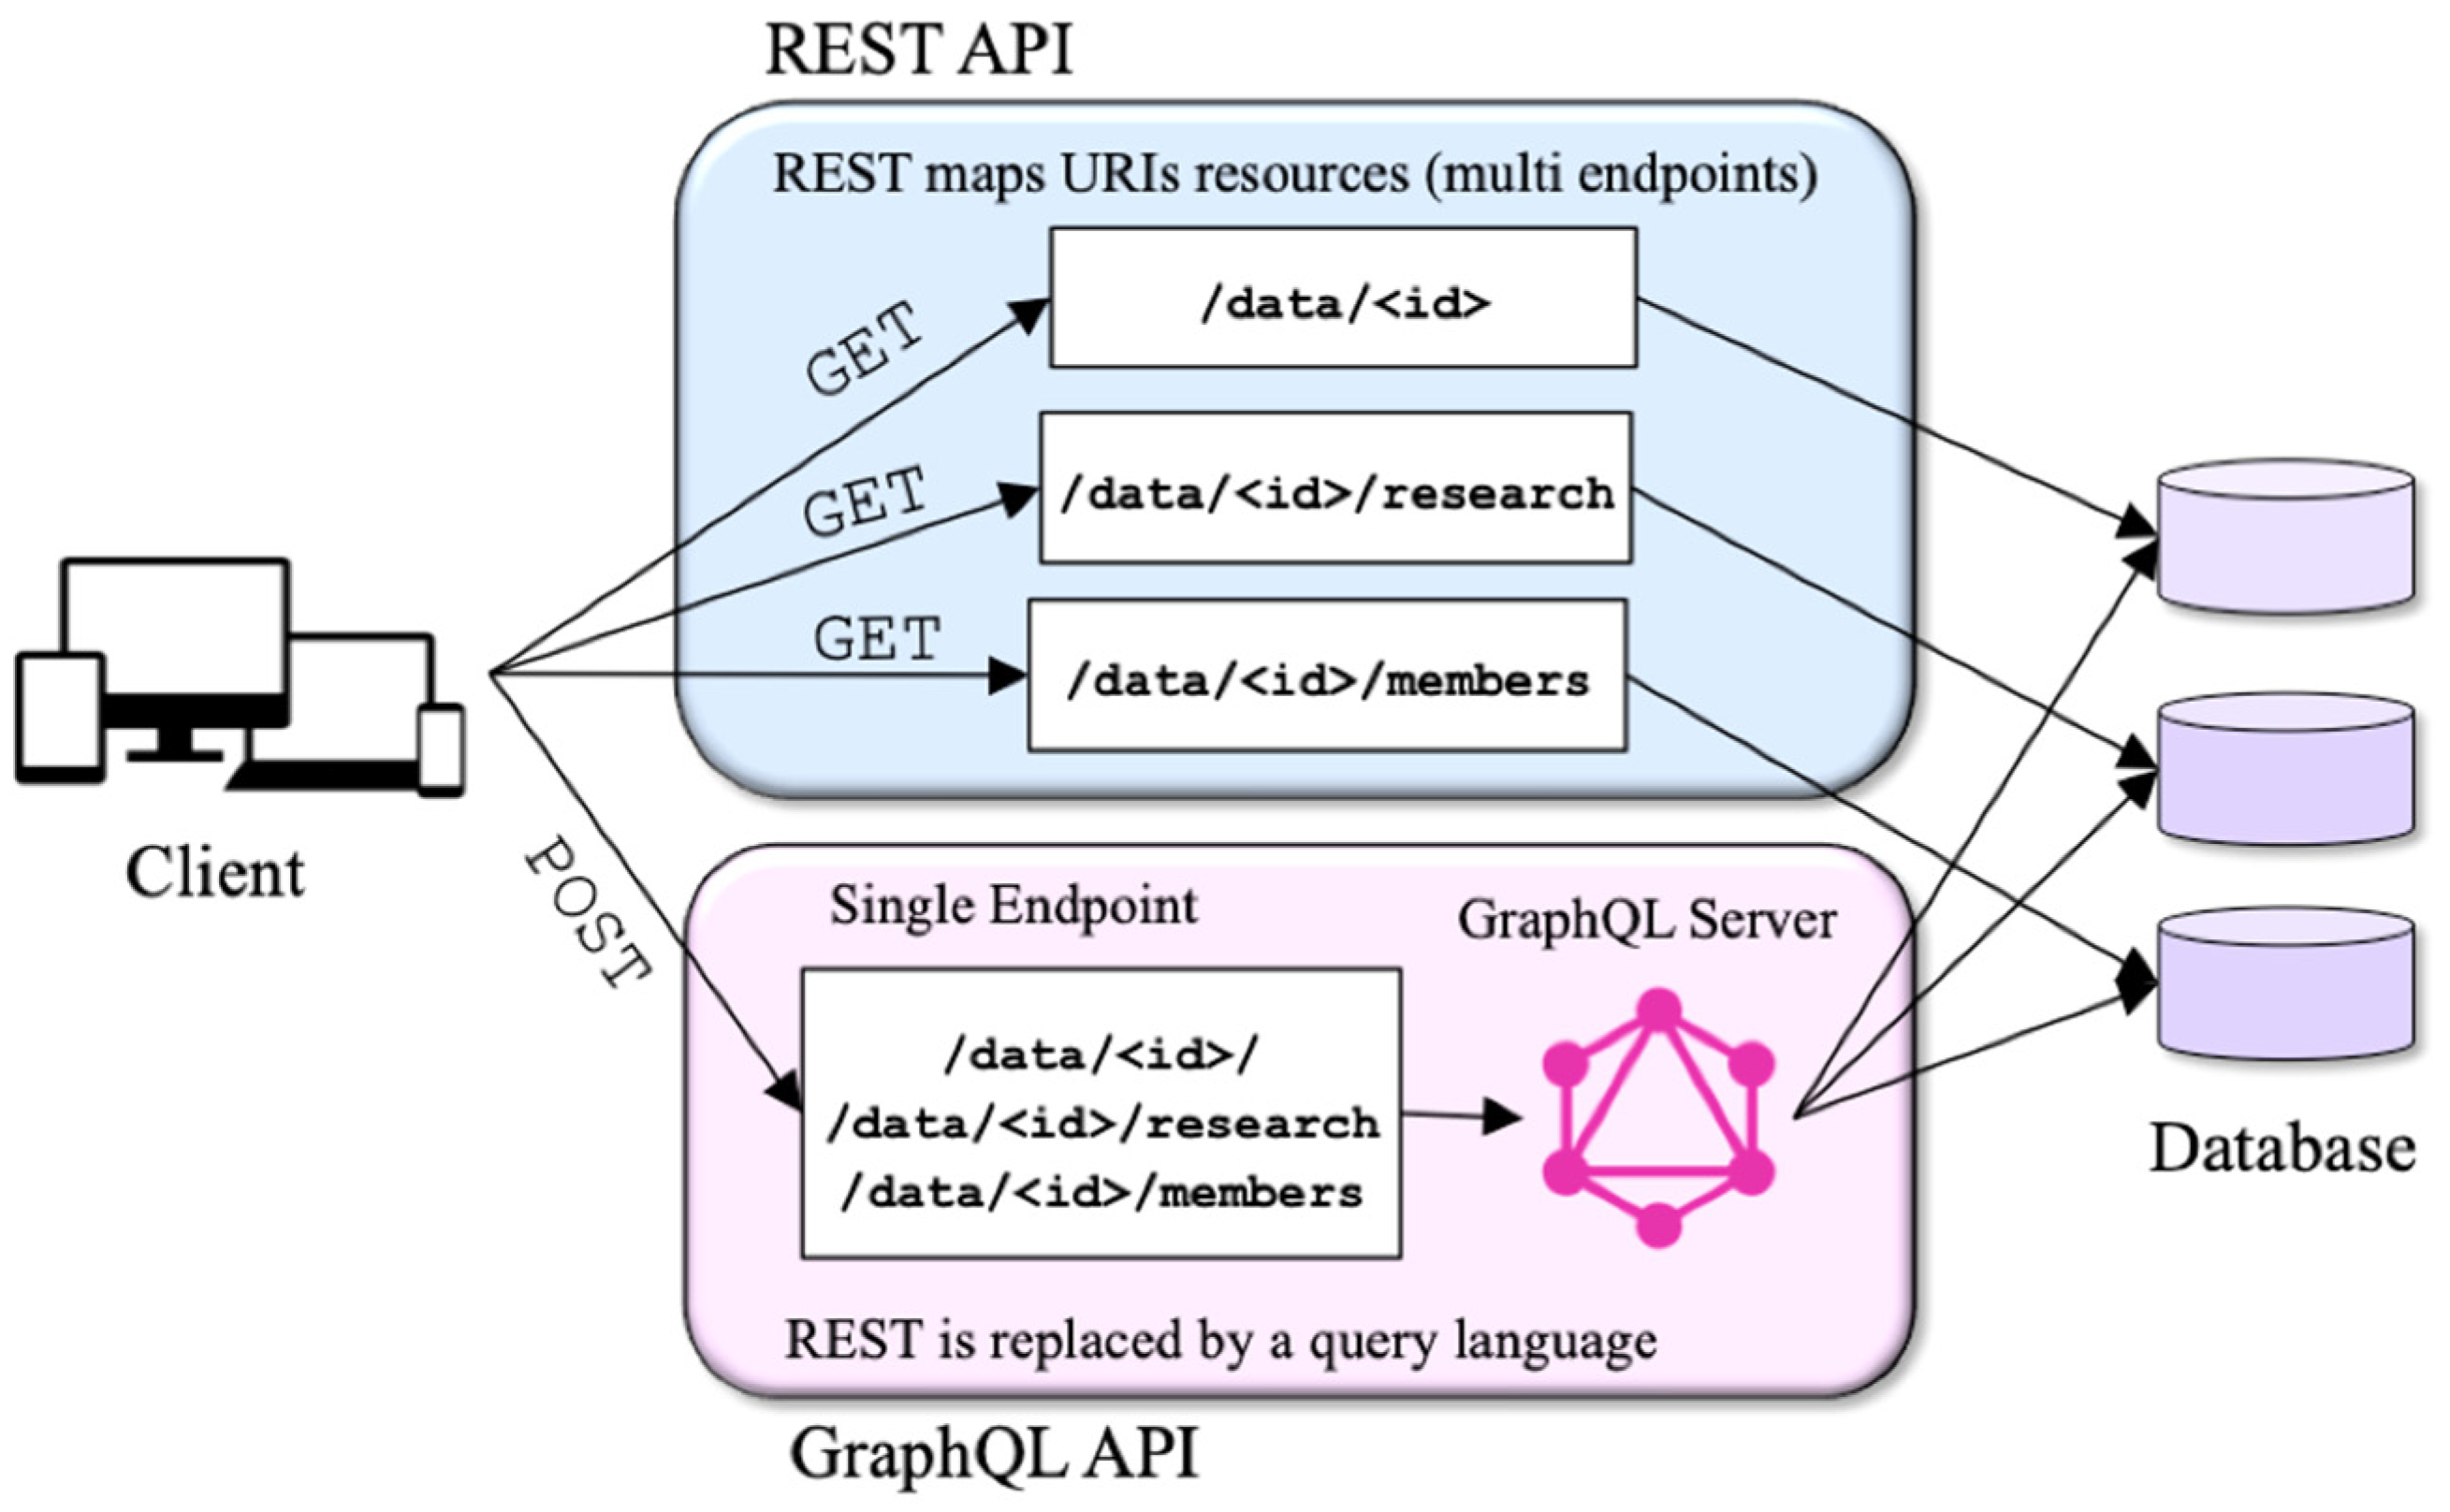
REST is still the popular API design architecture used to implement web services that use the HTTP protocol for server–client communication in web applications. Creating an API with this concept is simple, easy, and flexible to accept since it is not bound by a specific transfer protocol. REST works by providing a path or endpoint to access a resource (data source), and the endpoint is used whenever a client wants to access the resource. The server sends a representation of the requested resource state to the client that mostly in JSON (JavaScript Object Notation) or XML (eXtensible Markup Language) format. REST API typically gathers data by accessing multiple endpoints. For instance, let a client want to fetch the data of a researcher that includes the id, research titles, and members of a research project. Firstly, these could be /data/<id> endpoints to fetch the initial user data. Secondly, there is a /data/<id>/research endpoint that returns all research titles for a user. The third endpoint is then /data/<id>/members, which returns a list of members per user.
In essence, the REST APIs server is stateless, which means the client is responsible for storing all application state-related client side information. The client needs to send state information to the server whenever needed. The client and server can operate independently at REST, which means the state information can be overridden and all data retrieved from the server can be cached on the client side in such a way that the overall performance can be improved. The REST APIs are based on 5 different HTTP methods, i.e., GET to retrieve data, POST to update data on the server, PUT to update property values, PATCH to modify a resource, and DELETE to delete the resource. The main REST design principles are addressability, uniform interface, and statelessness. REST overcomes acceptance by specifying an endpoint in the directory structure via various URIs to extract data [5,6,7,18,19].
2.3.2. GraphQL
GraphQL is a query language for an API, a new approach that leverages services in the query language released in 2015 by Facebook [8]. It is not tied to any specific database or storage engine, but it is instead backed by your existing code and data. In essence, GraphQL has only one endpoint, which is HTTP POST request. In GraphQL, we simply send a single query to the GraphQL server that includes the concrete data requirements. The server then responds with a JSON object where these requirements are fulfilled. For instance, let us use the same activity explained in the previous REST subsection, where the client wants to fetch the researcher data that includes the id, research title, and members of the research project. Then, the client only specifies exactly which data it needs in a query and sends a request using the HTTP POST method.
In GraphQL, the client sends customized POST request to fetch the only needed data. In other words, clients have the power to define what type of data to fetch from the database. It helps when the client needs a flexible response format to avoid extra massive data transfer. It is also supported in various popular programming languages such as Python, C#, JavaScript, etc. Two things are the most important part of GraphQL, i.e., Schema and Resolver function. GraphQL requires 3 important parts that must be defined firstly, i.e., mutation as a place to update, input, and delete data, query for calling data, and type to describe the type of field/data [8,10,11,20,21,22].
2.3.3. Architectural Difference of REST and GraphQL
The main difference between REST and GraphQL APIs technology is the availability of the number of endpoints when they are handling requests. GraphQL tries to collect every request to one place, whereas the REST is built such that each resource is handled by some specific endpoints. The REST configuration creates a complicated situation whenever there is a change on the back-end, and it causes an adjustment to the front-end to query the exact endpoint for the desired resource. On the other hand, GraphQL takes some time when the request is handled at a single endpoint to find the right resource [1,3,12,13,16,22]. Figure 2 illustrates the difference between REST and GraphQL architecture.
2.4. Performance Measurements
Web services have proven to be easier to implement and superior to other similar technologies available today. Web service performance concerns not only how fast requests can be processed and served but also other performances in terms of load, stress, and service durability. Service speed requirements are mostly determined using throughput and response time measurements. Meanwhile, web service workload performance is more easily demonstrated through CPU load and memory usage. Obviously, the response time and throughput depend on the workload the web server is experiencing at the time [12,14,16,23,24]. Therefore, this paper evaluates 4 basic performance measures that clearly distinguish the two technologies based on their natural purpose. The four performances are response time, throughput, CPU load, and memory utilization. They are the most common metrics that can be tracked as good baseline data points and most needed in achieving QoS. Later in the Results and Discussion section, the efficiency of the results of the performance evaluation of the two technologies is evaluated because it is a comparative measure for the discussion of the two technologies. We use the following Equation (1) to compute the efficiency of performance measures.
where and are the results of the REST and GraphQL performance measurements, respectively.
3. Experiment Design
3.1. Data Model
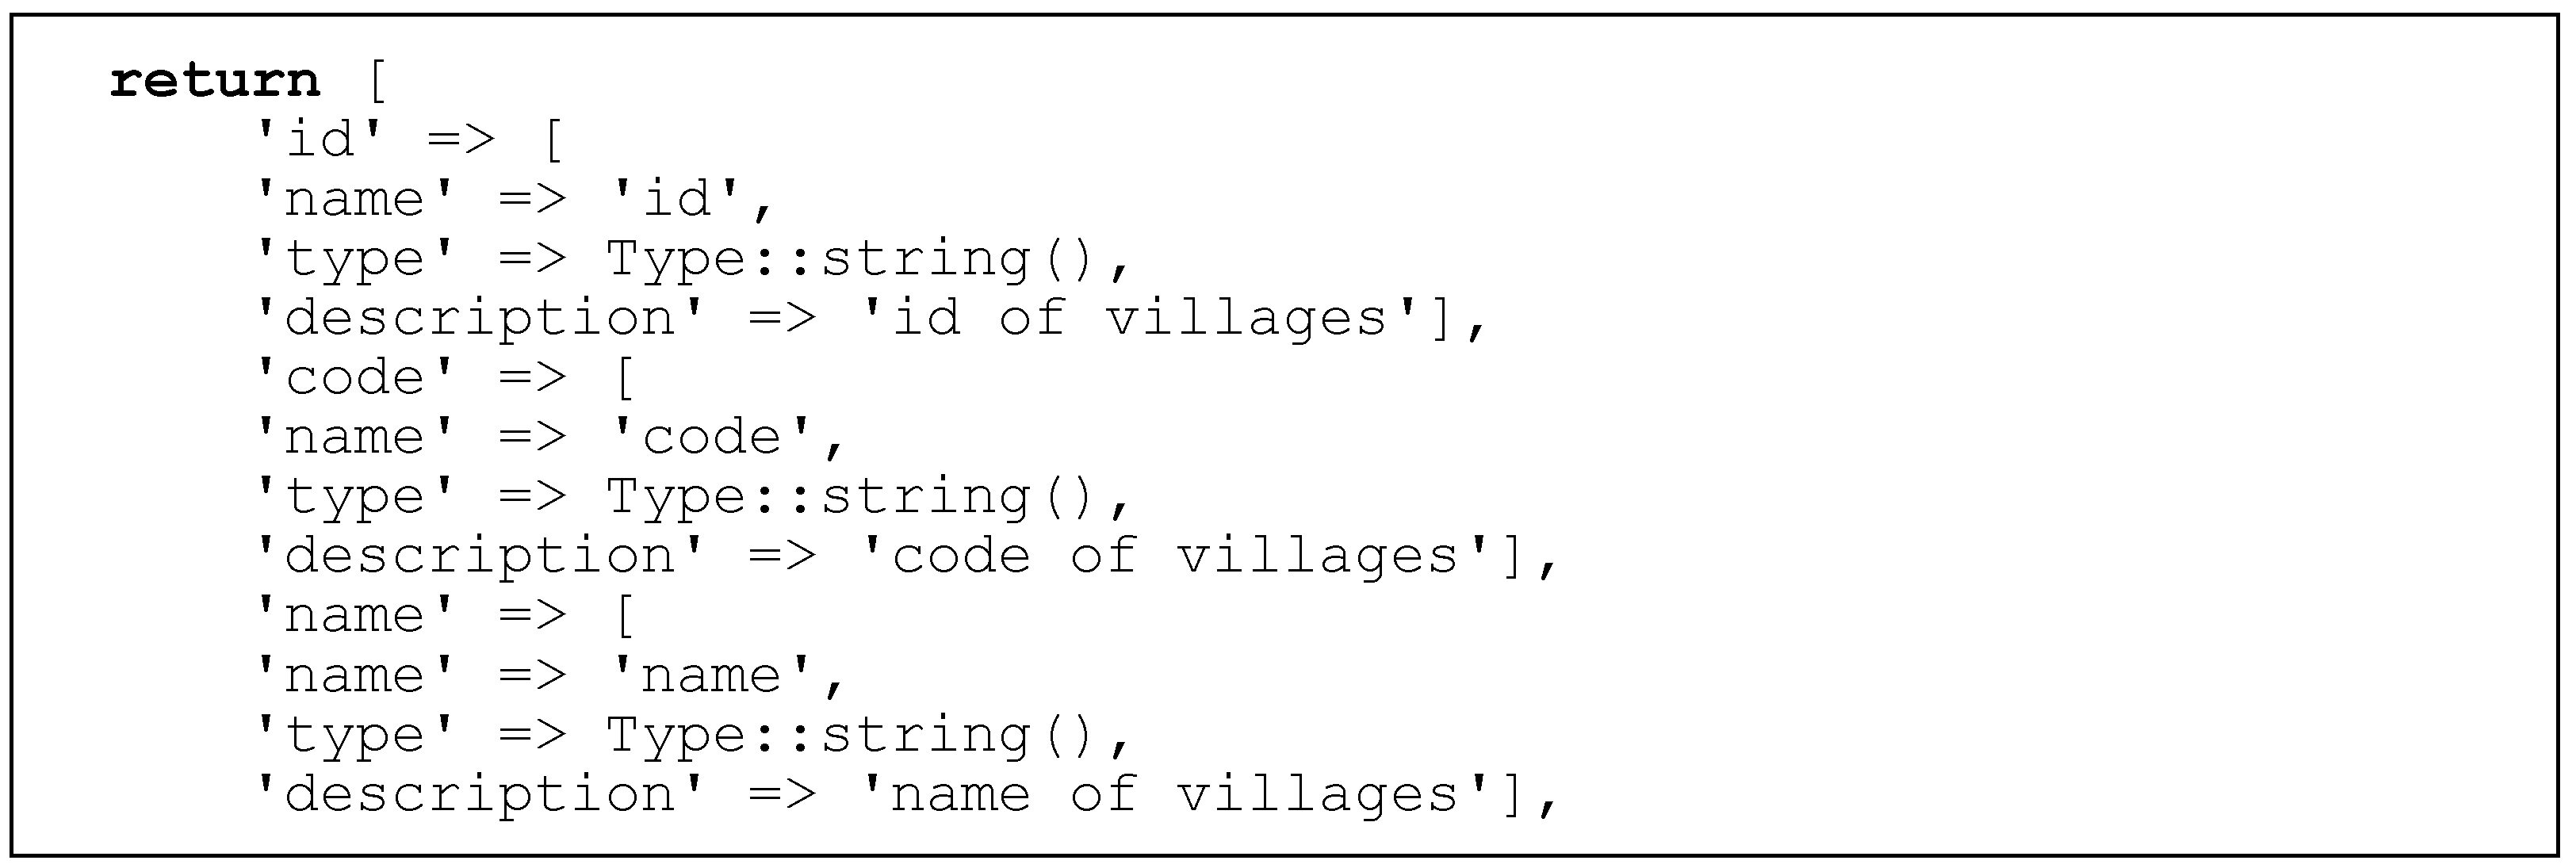
The performance evaluation is investigated by a multiple experimental method that represents the differences between the two service technologies. In this case, the same query operations are performed on the two technologies for retrieving, loading, modifying, storing, and deleting data on the server side, which are manipulated from the client side. A comparison of the key performances in differentiating the two technologies is evaluated by calculating response time, throughput, CPU loads, and memory utilization. Before performing a data query, all attributes or variables in the database must be declared in a data model file as illustrated in Figure 3. Performance analysis is carried out using the Insomnia API testing application. Testing was carried out 20 times on samples repeatedly for both REST and GraphQL, respectively.
3.2. REST Implementation
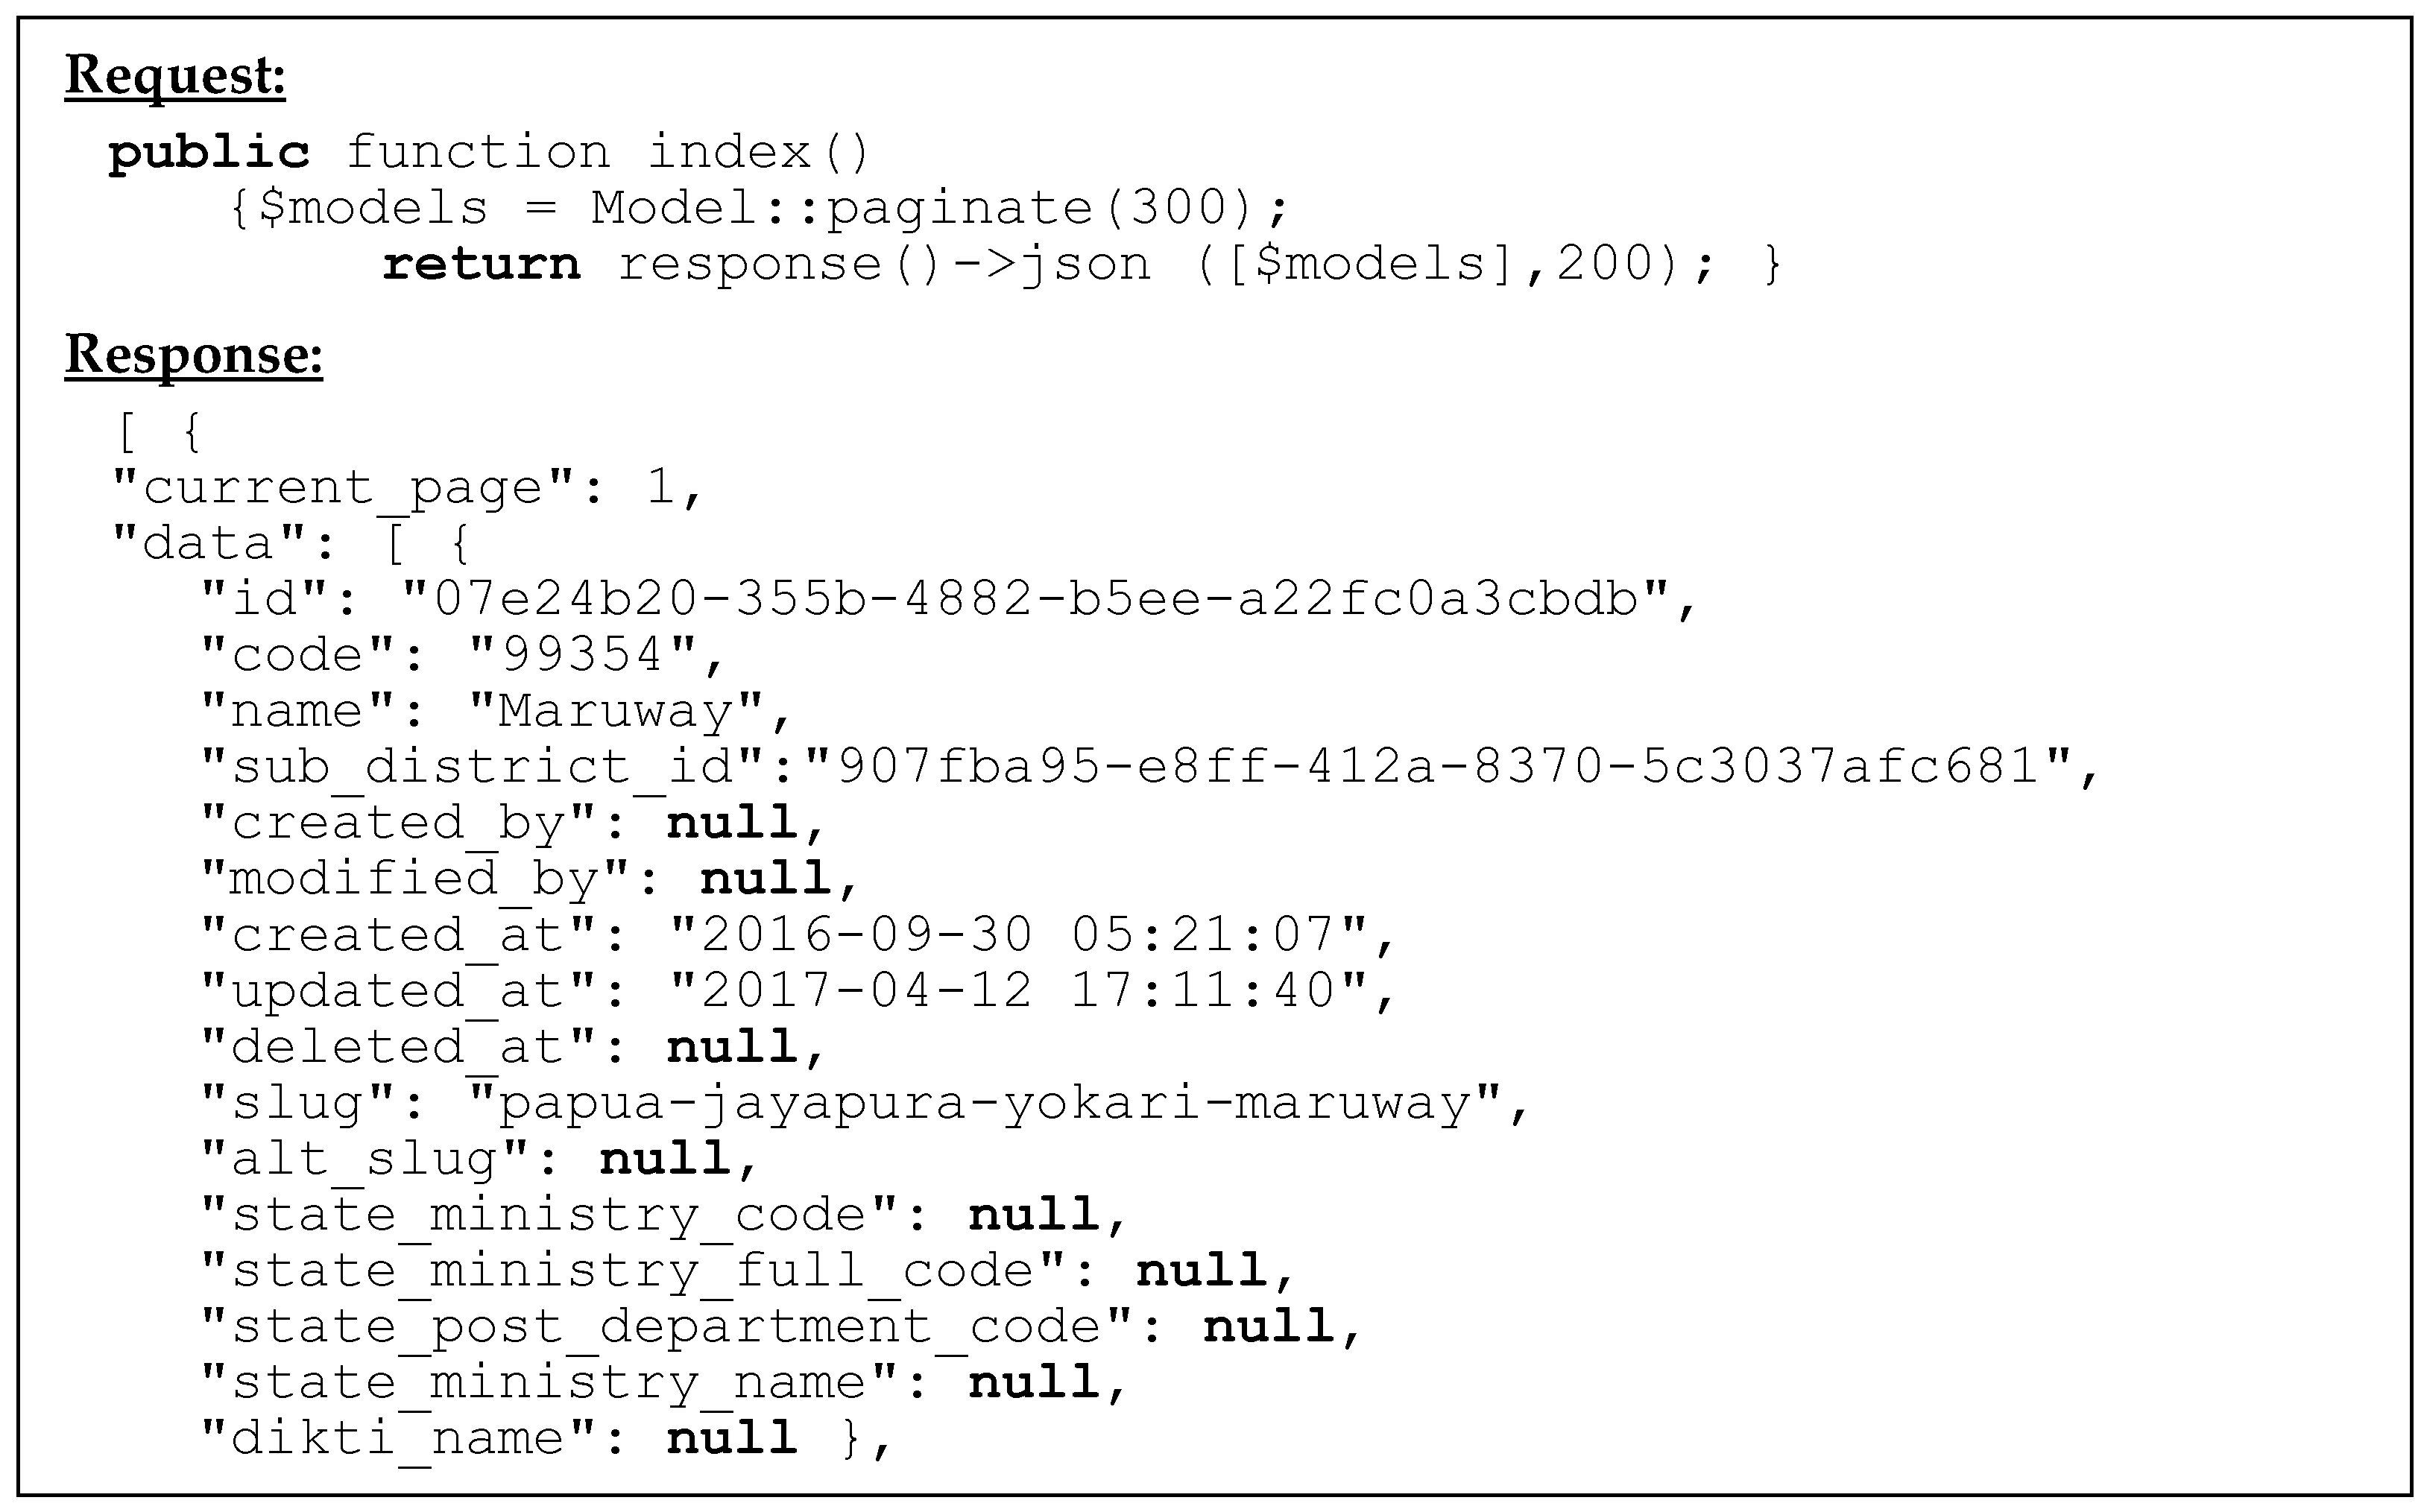
Query of the REST data call is performed on the controller, and the data format is the same when using GraphQL, i.e., in a JSON format. REST uses Data Manipulation Language (DML) in the SQL programming language. DML is a collection of query commands that are used to manipulate data in a database, which is used to append, update, or delete data in the database. An example of request–response cycle of data query in REST is described in Figure 4.
3.3. GraphQL Implementation
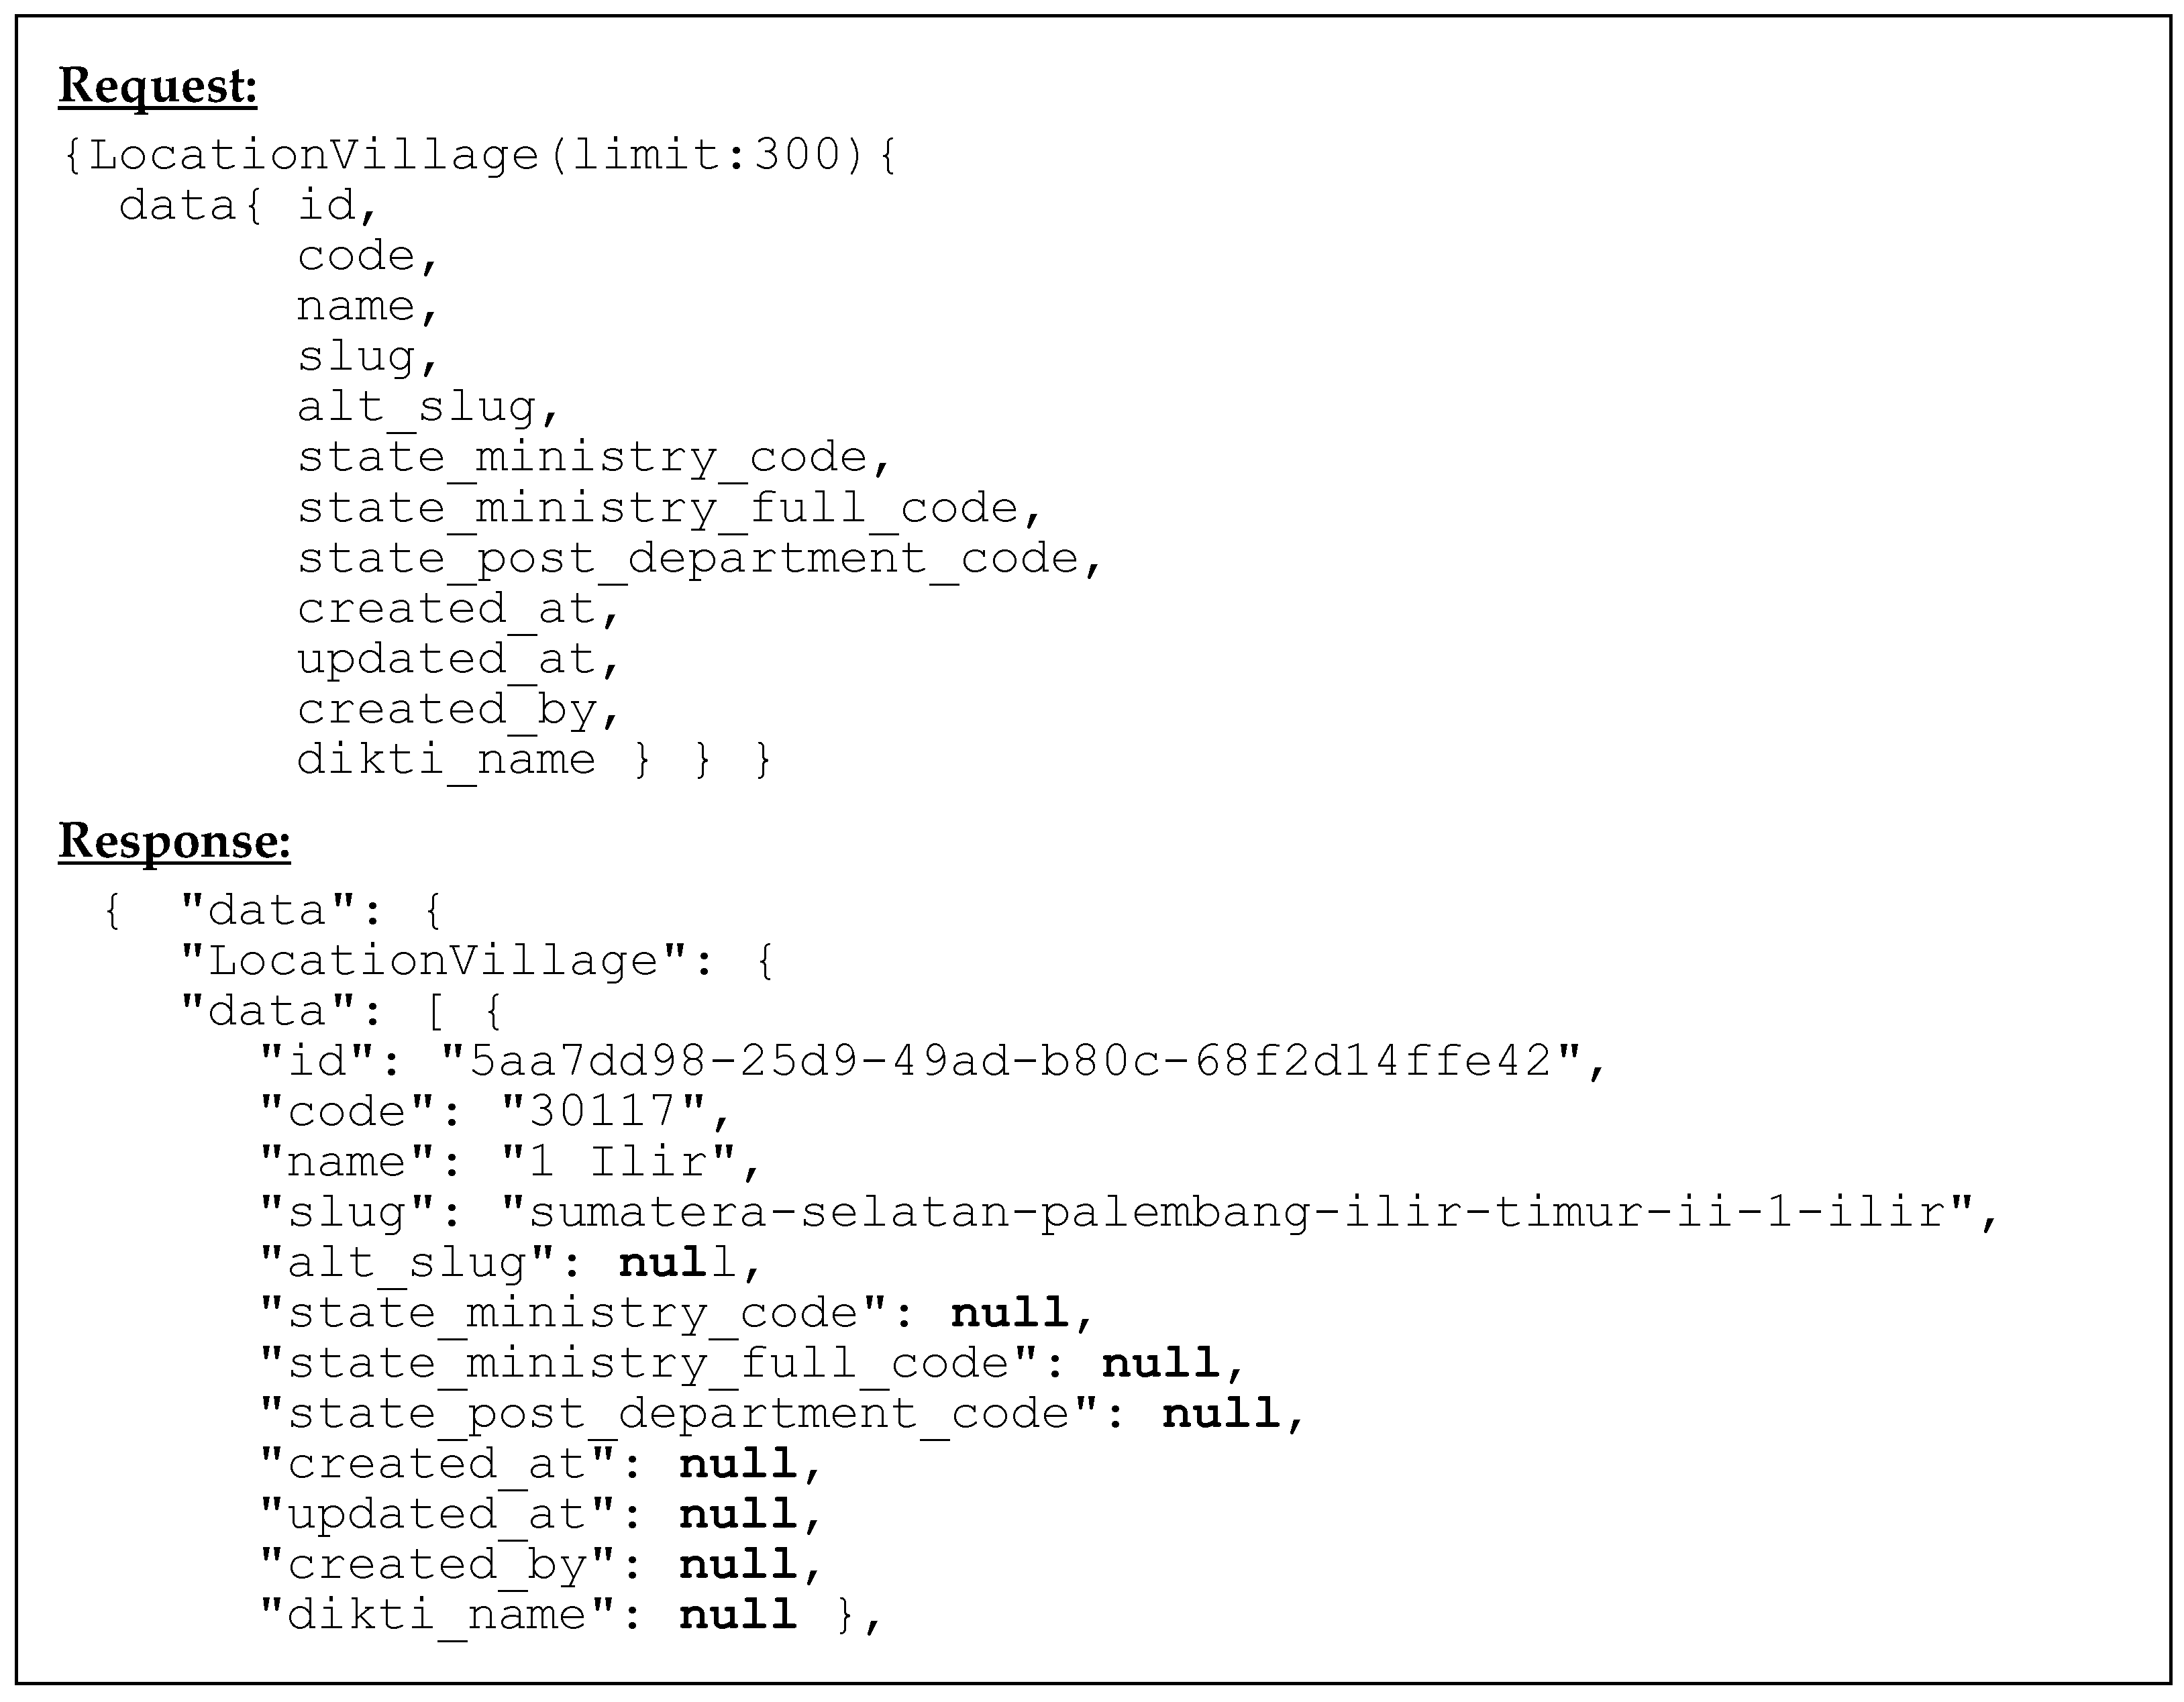
GraphQL is a new concept in building open-source query language APIs developed by Facebook. GraphQL executes server-side queries and only returns data specified by the system type to the related web service. Although GraphQL is a query language, it is indirectly related to the database. In other words, GraphQL is not limited to certain databases whether SQL or NoSQL. GraphQL is only a translator (query language) and runtime; thus, it does not depend on any server-side programming language and database. The variables and fields available for the query are specified in the schema located on the server side. Specific queries can be built based on GraphQL having predetermined services available for queries allowing for a single endpoint rather than multiple endpoints. Figure 5 shows an example of request query and JSON response cycle using GraphQL.
4. Results
4.1. Response Time
Response time is a measure of service performance that refers to the amount of time it takes for a service to respond when it receives a request. It is important to know the average and peak response times to services. Tracking both of these allows seeing how the service fluctuates with more or less load. The average response time is a good metric for gathering data in system performance tests. It provides an overview of the general user experience and provides insight into regression in case of changes. It is also important as the ideal baseline response time such that any lags that should be investigated or considered critical can be identified. Peak response time allows seeing the performance of the slowest requests. This creates a look that is different from the overall average. With peak response time, we can find more specific queries that might be problematic and determine what worst situation a user is in. Viewing the slowest queries can make it easier to track specific operations with latency, whereas the average response times are more general and give an idea of the entire system.
We evaluated 20 groups of ongoing transactions in the system (hereinafter referred to as trial tests); each of which resulted in an average request-response time difference of 100 trial tests with various HTTP methods. There is no time set for when the trial test group is started because the focus is on the issue of how much time difference can be obtained between the time the request starts to be sent (which is recorded in the request timestamp) and the response timestamp of the corresponding request received. Each group of trial tests is applied in a distributed manner to the REST and GraphQL services, respectively, in parallel execution. The request and its corresponding response timestamps are recorded on each API gateway, respectively. The response time is obtained by computing the timestamp difference between the timestamp request message I was issued, ts(reqi), and the timestamp of the corresponding response message I is received, ts(respi), in the API gateway. We use the following Equation (2) to determine the average response time in the jth trial test group (RTj).
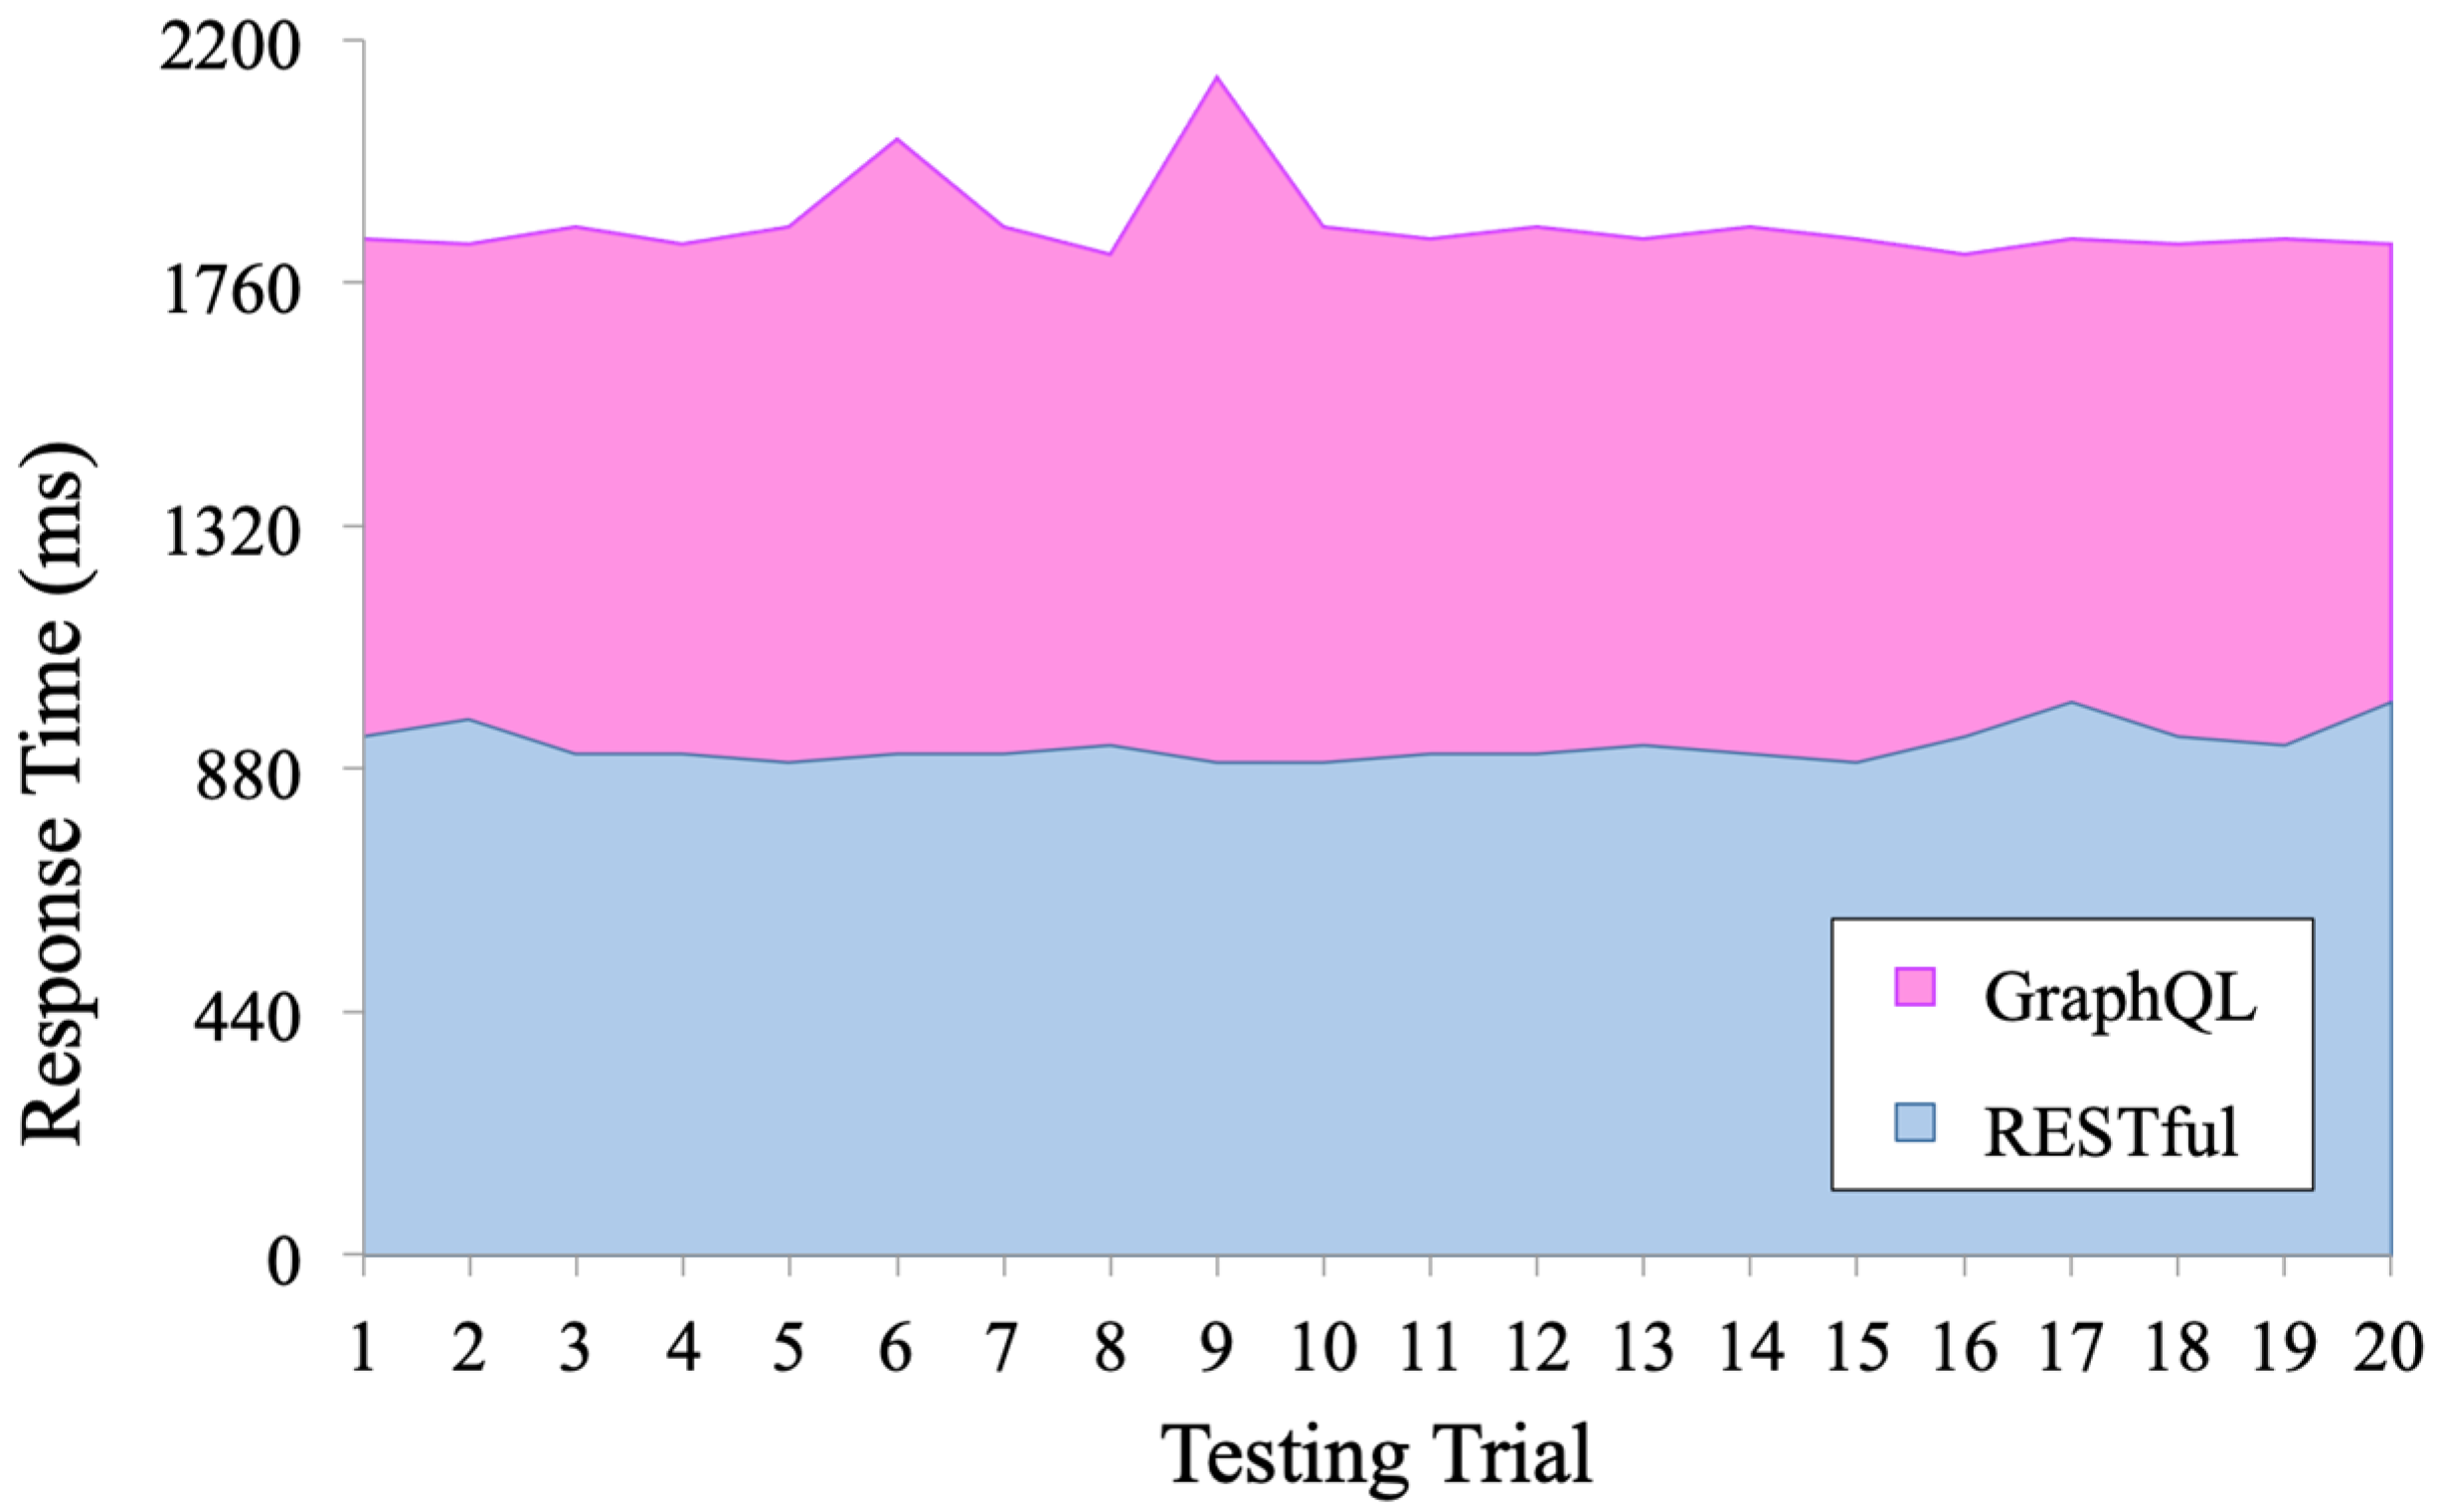
Response time performance is evaluated synchronously and continuously for both services, without specific timing for each 20 groups of trial tests consisting of 100 client-triggered requests. The response time results are shown in Table 1.
The resulted response time showed GraphQL has an average 1864.50 ms in the range of 1810–2130 ms with standard deviation 75.78 ms. The REST has a faster average 922.85 ms in the time range of 890–1000 ms, and standard deviation is 32.99 ms. Figure 6 shows the graph of the REST and GraphQL differences of the average response time triggered by 100 requests from 20 trials. It can be seen that the REST was faster in every test run with a stable response time.
4.2. Throughput
We evaluated the throughput as the cumulative number of requests in REST and GraphQL transactions with data-fetching performance in every interval time of 10 milliseconds, respectively, using Equation (3) as follows:
where is the throughput of the services in the time interval of I and is the number of messages handled in the range of time t, The throughput results are given in Table 2.
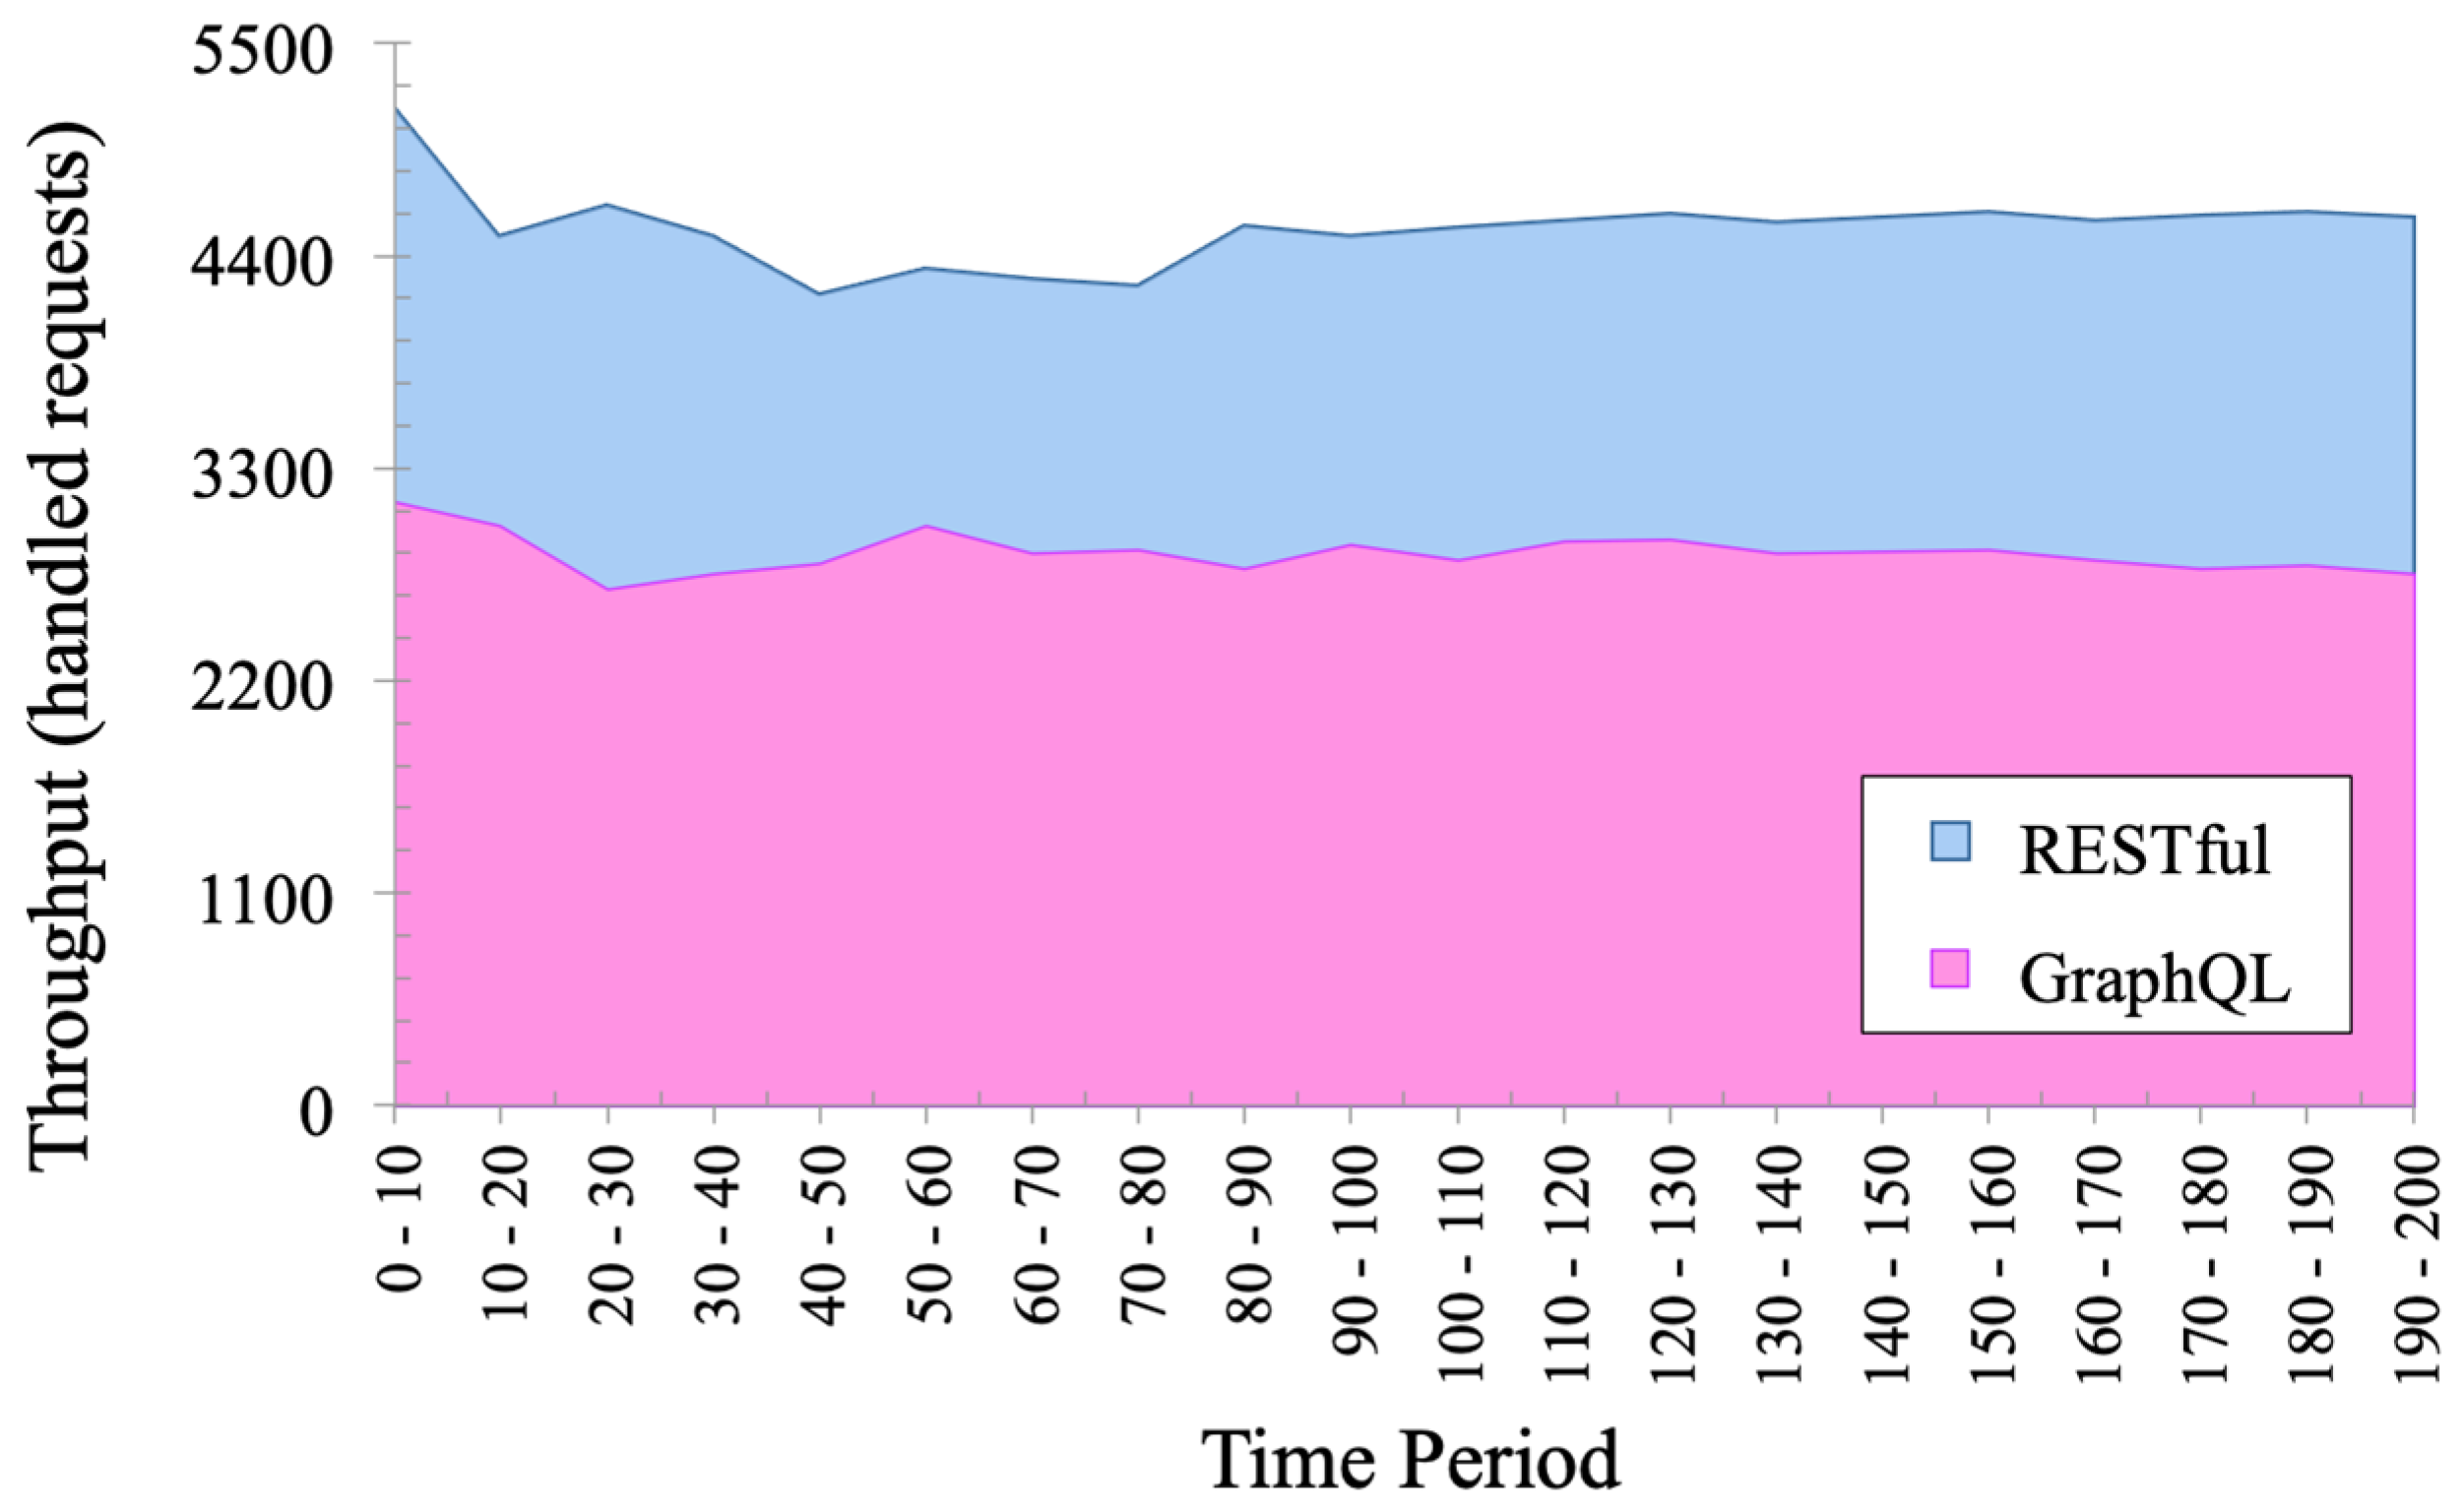
The throughput resulted for web services using GraphQL can handle an average of 2856.95 requests/ms with a range of 2666–3117 requests/ms and standard deviation 103.01 requests/ms, whereas the REST can handle an average of 4546.45 requests/ms in the range of 4200–5175 requests/ms and standard deviation 201.18 requests/ms. In the first 10 ms, both services can handle many requests, and then they tend to have a steady number of requests after 100 ms as depicted in Figure 7.
4.3. CPU Load
We evaluated CPU load without any other loads, services, and processes in the same setup machine in each API service server separately. The evaluation is conducted at the same time when evaluating the performance of the throughput. CPU loads of the services were recorded every 10 ms, and the results are shown in Table 3.
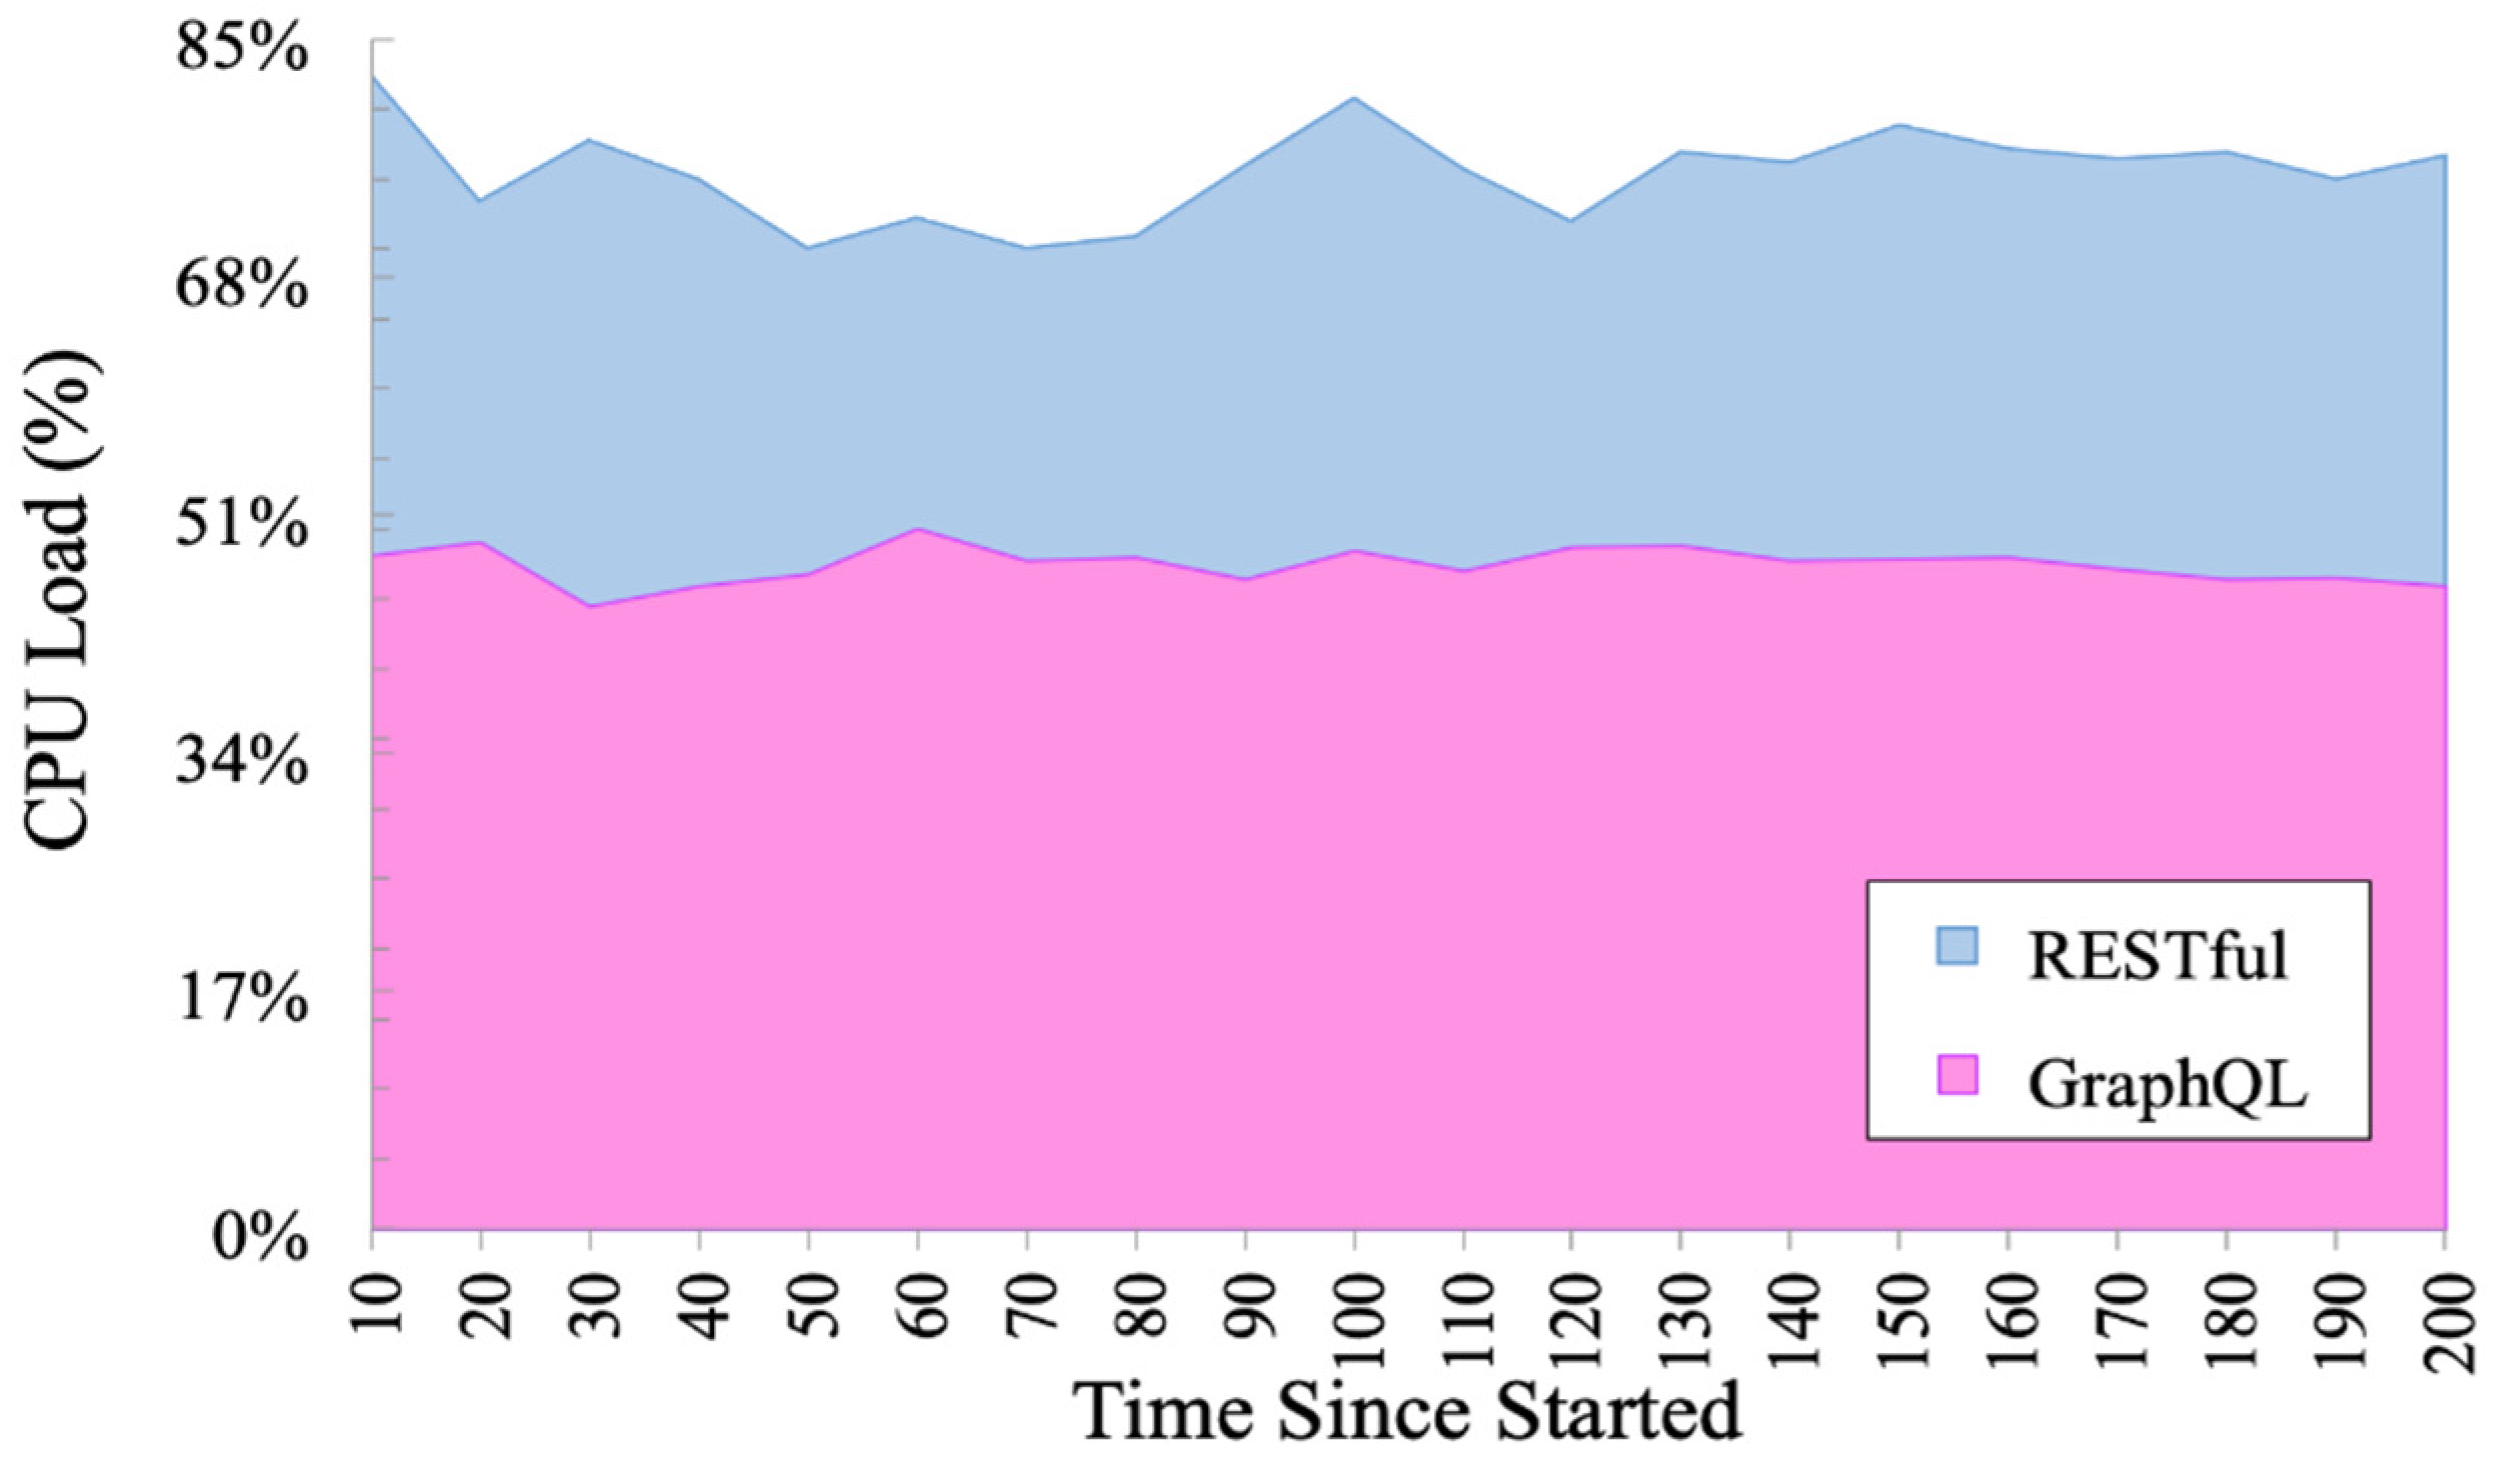
In the first 10 ms of our experiment, it resulted that the REST used 82.5% CPU as peak usage and remained slightly fluctuating in heavy usage and has an average 75.50% within the range 70–82.45%. Meanwhile, GraphQL is consistently steady with average 47.37% within the range 44.43–50% and standard deviation 1.27%. CPU usage graph is depicted in Figure 8.
4.4. Memory Utilization
The evaluation of memory usage is computed at the same time with the evaluation of throughput and CPU load. Memory consumption of the services is stored in every 10 ms, and the results are shown in Table 4.
The experiment showed that the average memory consumption of REST is 68.75 MB in the range of 57.50–79.47 MB with standard deviation 6.06 MB, whereas in GraphQL is 41.43 MB in the range of 38.6–45.20 MB with standard deviation 1.50 MB. Even though the initial request memory usage is at its peak, especially in the first 10 ms, GraphQL is very stable and low in memory consumption as depicted in Figure 9. On the other hand, memory usage at REST tends to fluctuate periodically with alternating peaks and valleys but still under heavy usage in the range of 55–80 MB.
5. Discussion
This section discusses the performance comparison of the evaluation results of REST and GraphQL using the statistical parameters of the two-tails paired t-test and boxplot visualization. We first discuss the p-value results to show the significant difference of the performance evaluation results for the two technologies. Then, the discussion continues on the efficiency and stability of the performance variation measure (standard deviation) as the result of the performance comparative analysis based on the suitability of the nature and purpose of the technology. A summary table of the boxplot parameters and their visualization is presented to give an understanding of the distribution of the data, the symmetry of the data, how tightly the data are grouped, and how the data are skewed. Boxplot visualization provides a rough idea regarding the execution pattern of each performance measure result.
The two-tails paired t-test was used to test the average similarity hypothesis of the two samples of experimental results being interrelated. The hypothesis is that the average performance evaluation results for both REST and GraphQL technologies are the same. The p-value results from Table 5 showed very significant values for rejecting the hypothesis on all performance measurement results. Thus, it can be concluded that the performance evaluation results for the two technologies are significantly different in all performance measurement.
Recapitulation of the average values in Table 5 showed that REST is superior to GraphQL in performance with respect to speed. The response time performance at REST is 50.50% more efficient with a response variation of 32.99 ms. Furthermore, REST throughput performance is also 37.16% more efficient; however, GraphQL is more stable in handling requests with a very small variation of 103.01 requests in each 10 ms. This is because experiments executing REST requests are run per method on multi-endpoints running on Hypertext Transfer Protocol version 2 (HTTP/2). Furthermore, HTTP/2 has a multiplexing feature that allows multiple requests or methods at each endpoint to be executed simultaneously across their entire connection. Thus, the response time is faster, and the number of requests/methods handled (throughput) per request is greater. However, this causes the amount of throughput to vary as the method response has a different amount of data transferred at each endpoint. Unfortunately, in the worst case, this can lead to underfetching or overfetching of data as each response returns the full set of data according to the request field regardless of the balance of data counts. Of course, this mechanism can cause high fluctuations in CPU load and memory usage. Another reason for this can also be due to the variable structure of the database table attributes, which is why memory utilization fluctuates.
GraphQL is superior to REST in terms of performance regarding resource consumption and utilization. For CPU load performance, GraphQL is 37.26% more efficient and stable in utilizing processing resources with a variation of only 1.27%. Furthermore, GraphQL memory consumption is also superior with an efficiency of 39.74% and is very stable with a variation of only 1.03 MB. The stability of GraphQL in consuming memory and utilizing CPU usage occurs because the query has selected data fields or properties for specific requests (or contains complete data requirements). This results in a much smaller and more efficient utilization of computing resources with certain fixed data. In addition, the request is only made once at a single endpoint, and the client can specify flexible response formats to avoid very large data transfers (overfetching) or sparse data response (underfetching), as can happen with the REST API service.
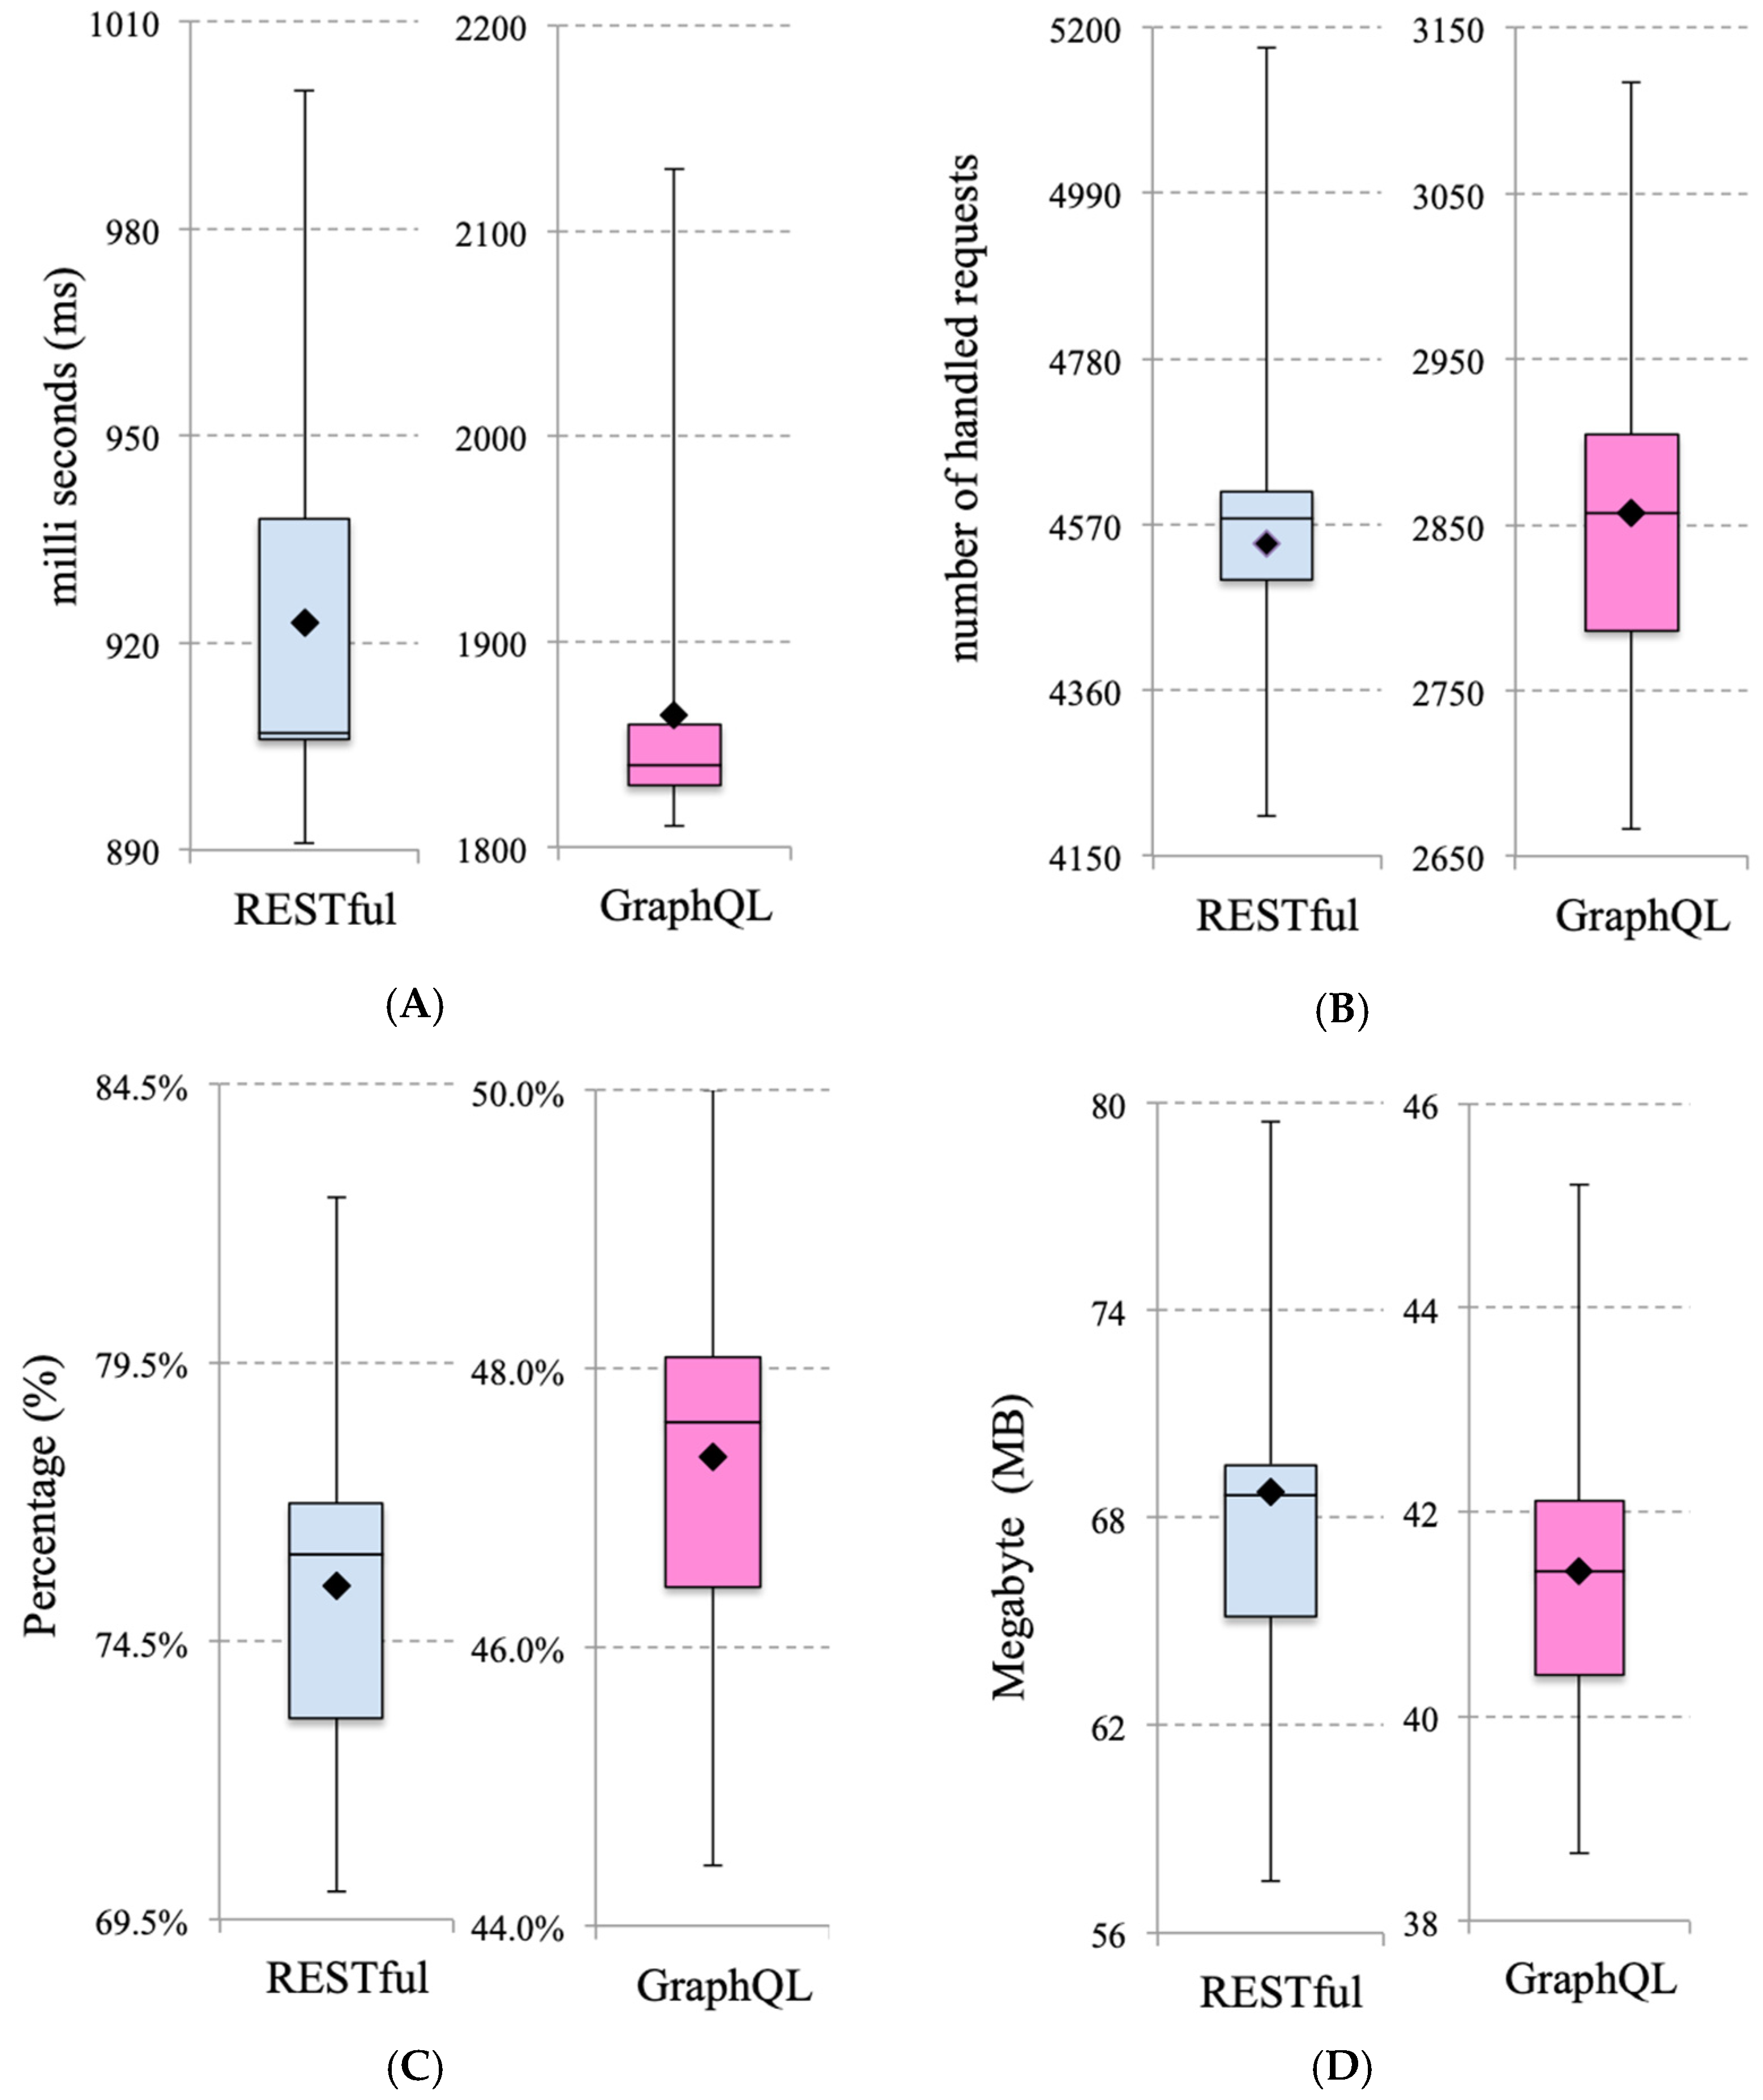
A summary of the boxplot parameters is given in Table 6 to provide insight into the distribution of the performance evaluation data through its five values, i.e., minimum, first quartile (Q1), second quartile (Q2) or median, third quartile (Q3), and maximum. We also include the mean as the reference in comparison to the normal distribution when the values of the mean and median, as well as half of the interquartile value (i.e., the result of, Q3–Q1) and the standard deviation, are the same. Boxplot visualization is given in Figure 10 to more easily understand the distribution pattern of performance results data for the two service technologies.
The boxplot visualization in Figure 10 provides information that the GraphQL service pattern is more stable and normal than REST. In the response time boxplot, the density of REST data is denser at the bottom of the interquartile box or between the first quartile and the median. This means that the response time value pattern is smaller even though there are some data outliers after the third quartile. Meanwhile, the response time data pattern for GraphQL is uneven, and most of them become data outliers after the third quartile. This means that there are several response times that need time before the response time starts to stabilize in the interquartile box. In general, the median and mean values of GraphQL for all distributions of performance data (excluding response time) generally coincide and lie in the middle of the interquartile box. Meanwhile, the pattern of REST performance evaluation data (especially CPU load and memory usage) are somewhat less balanced where the dominance of data density is at the top of the interquartile box or it is denser in the area between the median and the third quartile.
6. Conclusions
We have successfully designed and implemented a new performance evaluation method for REST and GraphQL web services based on two main ideas as novelties. The performance of both services was successfully evaluated on the actual ongoing operation of the LP2M management information system, where massive and intensive query transactions were taking place on a complex database with many relationships. Fair and independent performance evaluation results were also obtained by distributing client requests and synchronizing service responses on two virtually separate parallel execution paths for each API service, respectively. There were some differences in developing applications that implement REST and GraphQL web service technologies in monolithic information systems or web-based backend applications. In GraphQL, three important parts must be defined before using Data Manipulation Language (DML), i.e., mutations, queries, and types, while REST uses DML directly in SQL programming language. The performance evaluation in our experiment revealed some differences between the two API services. The statistical two-tails paired t-test has confirmed the difference is very significant with very small p-value. In terms of speed, REST is superior by 51% in response time and 37% in throughput. In the context of resource utilization, GraphQL is the best choice with 37% superior in CPU load and 40% superior in memory utilization since its process structure can manage queries on single endpoints. REST uses multiple endpoints to improve performance when retrieving data. We can conclude that the use of REST and GraphQL services depends on the requirements of the system and the particular application. GraphQL is a good choice when data requirements change frequently and resource usage is a concern, while REST is used when some data are frequently retrieved on demand and is therefore very suitable for monolithic information systems.
Author Contributions
Conceptualization, A.L., B.L.E.P. and T.Y.; Formal analysis, A.L., B.L.E.P. and T.Y.; Funding acquisition, T.Y.; Investigation, A.L. and B.L.E.P.; Methodology, A.L., B.L.E.P. and T.Y.; Validation, A.L., B.L.E.P. and T.Y.; Visualization, B.L.E.P.; Writing—original draft, A.L.; Writing—review & editing, B.L.E.P. and T.Y. All authors have read and agreed to the published version of the manuscript.
Funding
This research received no external funding.
Institutional Review Board Statement
Not applicable.
Informed Consent Statement
Not applicable.
Data Availability Statement
The data used to support the findings of this study are available from the corresponding author upon request.
Acknowledgments
The authors wish to thank the Institute of Research and Community Services (LP2M) of the Hasanuddin University for providing the opportunity to design and build the SIM-LP2M application with API services and then execute the application in their environment.
Conflicts of Interest
The authors declare no conflict of interest.
References
- Brito, G.; Valente, M.T. REST vs GraphQL: A Controlled Experiment. In Proceedings of the 2020 IEEE International Conference on Software Architecture (ICSA), Salvador, Brazil, 16–20 March 2020; pp. 81–91. [Google Scholar]
- Vadlamani, S.L.; Emdon, B.; Arts, J.; Baysal, O. Can GraphQL Replace REST? A Study of Their Efficiency and Viability. In Proceedings of the 2021 IEEE/ACM 8th International Workshop on Software Engineering Research and Industrial Practice (SER&IP), Madrid, Spain, 4 June 2021; pp. 10–17. [Google Scholar]
- Eizinger, T. API Design in Distributed Systems: A Comparison between GraphQL and REST. Master’s Thesis, University of Applied Sciences Technikum Wien, Vienna, Austria, 4 May 2017. Available online: https://eizinger.io/assets/Master-Thesis.pdf (accessed on 9 March 2021).
- Ghebremicael, E.S. Transformation of REST API to GraphQL for OpenTOSCA. Master’s Thesis, Universität Stuttgart, Stuttgart, Germany, 8 November 2017. [Google Scholar]
- Fielding, R.T. Architectural Styles and the Design of Network-Based Software Architectures. Ph.D. Thesis, University California at Irvine, Irvine, CA, USA, 2000. Available online: https://www.ics.uci.edu/~fielding/pubs/dissertation/fielding_dissertation.pdf (accessed on 21 June 2021).
- Lyu, S. REST APIs. In Practical Rust Web Projects, 1st ed.; Lyu, S., Ed.; Apress: Berkeley, CA, USA, 2021; pp. 55–102. [Google Scholar]
- Ozdemir, E. A General Overview of RESTful Web Services. In Applications and Approaches to Object-Oriented Software Design: Emerging Research and Opportunities, 1st ed.; Altan, Z., Ed.; IGI Global: Hershey, PA, USA, 2020; pp. 133–165. [Google Scholar]
- Facebook Inc. GraphQL Specification (Draft). Available online: http://spec.graphql.org/July2015/ (accessed on 9 March 2021).
- Jamil, H.M. Design of declarative graph query languages: On the choice between value, pattern and object based representations for graphs. In Proceedings of the IEEE 28th International Conference on Data Engineering Workshops, Arlington, VA, USA, 1–5 April 2012; pp. 178–185. [Google Scholar]
- Welch, N. An Introduction to GraphQL. In Proceedings of the SREcon19Americas, USENIX Association, Brooklyn, NY, USA, 25–27 March 2019; Available online: https://www.usenix.org/conference/srecon19americas/presentation/welch (accessed on 10 September 2021).
- Byron, L. GraphQL: A Data Query Language. FACEBOOK Engineering, Core Data, Developer Tools. 2015. Available online: https://engineering.fb.com/2015/09/14/core-data/graphql-a-data-query-language/ (accessed on 9 March 2021).
- Mikuła, M.; Dzieńkowski, M. Comparison of REST and GraphQL web technology performance. J. Comput. Sci. Inst. 2020, 16, 309–316. [Google Scholar] [CrossRef]
- Seabra, M.; Nazário, M.F.; Pinto, G. REST or GraphQL? A Performance Comparative Study. In Proceedings of the ACM XIII Brazilian Symposium on Software Components, Architectures and Reuse (SBCARS), Salvador, Brazil, 23–27 September 2019; pp. 123–132. [Google Scholar]
- Vesić, M.; Nenad Kojić, N. Comparative Analysis of Web Application Performance in Case of Using REST versus GraphQL. In Proceedings of the Fourth International Scientific Conference on Recent Advances in Information Technology, Tourism, Economics, Management and Agriculture (ITEMA), Online-Virtual, 8 October 2020; pp. 17–24. Available online: https://www.itema-conference.com/wp-content/uploads/2021/03/0_Itema-2020-Conference-Proceedings_Draft.pdf#page=23 (accessed on 21 June 2021).
- Gustavsson, K.; Stenlund, E. Efficient Data Communication between a Webclient and a Cloud Environment. Master’s Thesis, Dept. Electrical and Info. Technology, Faculty of Engineering, LTH, Lund University, Lund, Sweden, 23 June 2016. Available online: https://lup.lub.lu.se/luur/download?func=downloadFile&recordOId=8885754&fileOId=8885760 (accessed on 21 June 2021).
- Hartina, D.A.; Lawi, A.; Panggabean, B.L.E. Performance analysis of GraphQL and REST in SIM LP2M of the Hasanuddin University. In Proceedings of the IEEE 2nd East Indonesia Conf. on Computer and Information Technology (EIConCIT), Makassar, Indonesia, 6 November 2018; pp. 237–240. [Google Scholar]
- Dudjak, M.; Martinović, G. An API-first methodology for designing a microservice-based Backend as a Service platform. Inf. Technol. Control 2020, 49, 206–223. [Google Scholar] [CrossRef]
- Muehlen, M.Z.; Nickerson, J.V.; Swenson, K.D. Developing web services choreography standards—The case of REST vs. SOAP. Decis. Support Syst. 2005, 40, 9–29. [Google Scholar] [CrossRef]
- Choi, M. A performance analysis of RESTful open API information system. In Proceedings of the International Conference on Future Generation Information Technology (FGIT 2012), Gangneug, Korea, 16–19 December 2012; Lecture Notes in Computer Science. Kim, T., Lee, Y., Fang, W., Eds.; Springer: Berlin/Heidelberg, Germany, 2012; Volume 7709, pp. 59–64. [Google Scholar]
- Cederlund, M. Performance of Frameworks for Declarative Data Fetching: An Evaluation of Falcor and Relay+ GraphQL. Master’s Thesis, KTH, School of Information and Communication Technology (ICT), Stockholm, Sweden, 4 July 2016. Available online: https://www.diva-portal.org/smash/record.jsf?pid=diva2%3A1045900&dswid=9212 (accessed on 9 March 2021).
- Hartig, O.; Pérez, J. An initial analysis of Facebook’s GraphQL language. In Proceedings of the 11th Alberto Mendelzon International Workshop on Foundations of Data Management and the Web, Montevideo, Uruguay, 7–9 June 2017; pp. 1–10. Available online: http://repositorio.uchile.cl/handle/2250/169110 (accessed on 21 June 2021).
- Wittern, E.; Cha, A.; Davis, J.C.; Baudart, G.; Mandel, L. An Empirical Study of GraphQL Schemas. Service-Oriented Computing; ICSOC 2019. Lecture Notes in Computer Science; Springer: Cham, Switzerland, 2019; Volume 11895. [Google Scholar] [CrossRef] [Green Version]
- Helgason, A.F. Performance Analysis of Web Services: Comparison between RESTful & GraphQL Web Services. Master’s Thesis, School of Informatics, University of Skövde, Skövde, Sweden, 11 June 2017. Available online: https://www.diva-portal.org/smash/record.jsf?pid=diva2%3A1107850&dswid=8398 (accessed on 21 June 2021).
- Cha, A.; Wittern, E.; Baudart, G.; Davis, J.C.; Mandel, L.; Laredo, J.A. A principled approach to GraphQL query cost analysis. In Proceedings of the 28th ACM Joint Meeting on European Software Engineering Conference and Symposium on the Foundations of Software Engineering, Online, 4–9 November 2020; pp. 257–268. [Google Scholar] [CrossRef]
Figure 1.
Illustration of the evaluated system architecture of the SIM-LP2M.

Figure 2.
Illustration of the difference between REST and GraphQL architectures.

Figure 3.
An illustration of data model for testing.

Figure 4.
An example of request–response cycle fragment of REST implementation.

Figure 5.
An example of request–response cycle fragment of query implementation in GraphQL.

Figure 6.
Response time average with 100 requests in each testing trial.

Figure 7.
Experimental results of throughput (the number of handled requests).

Figure 8.
Percentage result of CPU load.

Figure 9.
Experimental results for memory utilization.

Figure 10.
Boxplot of evaluation results for the performance measurement on REST and GraphQL services; (A) response time (ms), (B) throughput (handled requests), (C) CPU Load (%), and (D) memory utilization (MB).
Figure 10.
Boxplot of evaluation results for the performance measurement on REST and GraphQL services; (A) response time (ms), (B) throughput (handled requests), (C) CPU Load (%), and (D) memory utilization (MB).


Table 1.
Response time average per hundred requests in 20 group of trial tests.
| Trial Test | GraphQL (ms) | RESTful (ms) | Trial Test | GraphQL (ms) | RESTful (ms) |
|---|---|---|---|---|---|
| 1 | 1840 | 938 | 11 | 1840 | 906 |
| 2 | 1830 | 969 | 12 | 1860 | 907 |
| 3 | 1860 | 906 | 13 | 1840 | 922 |
| 4 | 1830 | 907 | 14 | 1860 | 906 |
| 5 | 1860 | 891 | 15 | 1840 | 891 |
| 6 | 2020 | 906 | 16 | 1810 | 938 |
| 7 | 1860 | 907 | 17 | 1840 | 1000 |
| 8 | 1810 | 922 | 18 | 1830 | 938 |
| 9 | 2130 | 891 | 19 | 1840 | 921 |
| 10 | 1860 | 891 | 20 | 1830 | 1000 |
Table 2.
Throughput results (the number of handled requests per 10 ms).
| Time Interval (ms) | GraphQL (#requests) | RESTful (#requests) | Time Interval (ms) | GraphQL (#requests) | RESTful (#requests) |
|---|---|---|---|---|---|
| 00–10 | 3117 | 5175 | 100–110 | 2818 | 4545 |
| 10–20 | 3000 | 4500 | 110–120 | 2917 | 4583 |
| 20–30 | 2666 | 4666 | 120–130 | 2923 | 4615 |
| 30–40 | 2750 | 4500 | 130–140 | 2857 | 4571 |
| 40–50 | 2800 | 4200 | 140–150 | 2867 | 4600 |
| 50–60 | 3000 | 4333 | 150–160 | 2875 | 4625 |
| 60–70 | 2857 | 4285 | 160–170 | 2823 | 4584 |
| 70–80 | 2875 | 4250 | 170–180 | 2778 | 4611 |
| 80–90 | 2777 | 4555 | 180–190 | 2789 | 4631 |
| 90–100 | 2900 | 4500 | 190–200 | 2750 | 4600 |
Table 3.
CPU load percentage of GraphQL and REST.
| Time (ms) | GraphQL (%) | RESTful (%) | Time (ms) | GraphQL (%) | RESTful (%) |
|---|---|---|---|---|---|
| 10 | 48.0 | 82.5 | 110 | 47.0 | 75.8 |
| 20 | 49.0 | 73.4 | 120 | 48.6 | 72.0 |
| 30 | 44.4 | 77.8 | 130 | 48.7 | 76.9 |
| 40 | 45.8 | 75.0 | 140 | 47.6 | 76.2 |
| 50 | 46.7 | 70.0 | 150 | 47.8 | 78.8 |
| 60 | 50.0 | 72.2 | 160 | 47.9 | 77.1 |
| 70 | 47.6 | 70.0 | 170 | 47.1 | 76.4 |
| 80 | 47.9 | 70.8 | 180 | 46.3 | 76.9 |
| 90 | 46.3 | 75.9 | 190 | 46.5 | 75.0 |
| 100 | 48.3 | 80.8 | 200 | 45.8 | 76.7 |
Table 4.
Memory utilization results of GraphQL and REST.
| Time (ms) | GraphQL (MB) | RESTful (MB) | Time (ms) | GraphQL (MB) | RESTful (MB) |
|---|---|---|---|---|---|
| 10 | 45.20 | 67.50 | 110 | 40.86 | 65.18 |
| 20 | 43.50 | 77.63 | 120 | 42.30 | 78.75 |
| 30 | 38.66 | 69.99 | 130 | 42.38 | 69.23 |
| 40 | 39.88 | 67.50 | 140 | 41.43 | 68.57 |
| 50 | 40.60 | 63.00 | 150 | 41.57 | 59.00 |
| 60 | 43.50 | 65.00 | 160 | 41.69 | 69.38 |
| 70 | 41.43 | 78.33 | 170 | 40.93 | 68.76 |
| 80 | 41.69 | 63.75 | 180 | 40.28 | 69.17 |
| 90 | 40.27 | 68.33 | 190 | 40.44 | 79.47 |
| 100 | 42.05 | 57.50 | 200 | 39.88 | 69.00 |
Table 5.
Recapitulation two-tails paired t-test of the performance results.
| Response Time (ms) | Throughput (requests) | CPU Load (%) | Memory Utilz. (MB) | |||||
|---|---|---|---|---|---|---|---|---|
| GraphQL | REST | GraphQL | REST | GraphQL | REST | GraphQL | REST | |
| Average | 1864.50 | 922.85 | 2856.95 | 4546.45 | 47.37% | 75.50% | 41.43 | 68.75 |
| Stdev | 75.77 | 32.99 | 103.01 | 201.18 | 1.31% | 3.34% | 1.49 | 6.06 |
| p-value | 7.37117 × 10⁻²¹ | 2.10916 × 10⁻¹⁹ | 2.35697 × 10⁻¹⁸ | 4.69417 × 10⁻¹⁴ | ||||
Table 6.
Boxplot parameters summary of the performance evaluation results.
| Response Time (ms) | Throughput (requests) | CPU Load (%) | Memory Utilz. (MB) | |||||
|---|---|---|---|---|---|---|---|---|
| GraphQL | REST | GraphQL | REST | GraphQL | REST | GraphQL | REST | |
| Average | 1864.50 | 922.85 | 2856.95 | 4546.45 | 47.37% | 75.50% | 41.43 | 68.75 |
| Maximum | 2130 | 1000 | 3117 | 5175 | 50.00% | 82.45% | 45.20 | 79.47 |
| Quartile 3 | 1860 | 938 | 2904 | 4612 | 48.08% | 76.96% | 42.11 | 69.53 |
| Median | 1840 | 907 | 2857 | 4577 | 47.62% | 76.05% | 41.43 | 68.66 |
| Quartile 1 | 1830 | 906 | 2786 | 4500 | 46.44% | 73.10% | 40.40 | 65.13 |
| Minimum | 1810 | 891 | 2666 | 4200 | 44.43% | 70.00% | 38.66 | 57.50 |
Publisher’s Note: MDPI stays neutral with regard to jurisdictional claims in published maps and institutional affiliations. |
© 2021 by the authors. Licensee MDPI, Basel, Switzerland. This article is an open access article distributed under the terms and conditions of the Creative Commons Attribution (CC BY) license (https://creativecommons.org/licenses/by/4.0/).
Share and Cite
MDPI and ACS Style
Lawi, A.; Panggabean, B.L.E.; Yoshida, T. Evaluating GraphQL and REST API Services Performance in a Massive and Intensive Accessible Information System. Computers 2021, 10, 138. https://0-doi-org.brum.beds.ac.uk/10.3390/computers10110138
AMA Style
Lawi A, Panggabean BLE, Yoshida T. Evaluating GraphQL and REST API Services Performance in a Massive and Intensive Accessible Information System. Computers. 2021; 10(11):138. https://0-doi-org.brum.beds.ac.uk/10.3390/computers10110138
Chicago/Turabian StyleLawi, Armin, Benny L. E. Panggabean, and Takaichi Yoshida. 2021. "Evaluating GraphQL and REST API Services Performance in a Massive and Intensive Accessible Information System" Computers 10, no. 11: 138. https://0-doi-org.brum.beds.ac.uk/10.3390/computers10110138
Note that from the first issue of 2016, this journal uses article numbers instead of page numbers. See further details here.