
The Effect of a Phase Change on the Temperature Evolution during the Deposition Stage in Fused Filament Fabrication


1
Center for Research and Innovation in Business Sciences and Information Systems (CIICESI), School of Management and Technology, Porto Polytechnic Institute, 4610-156 Felgueiras, Portugal
2
Institute for Polymers and Composites (IPC), Department of Polymer Engineering, University of Minho, 4804-533 Guimarães, Portugal
*
Author to whom correspondence should be addressed.
Computers 2021, 10(2), 19; https://0-doi-org.brum.beds.ac.uk/10.3390/computers10020019
Submission received: 16 December 2020
/
Revised: 26 January 2021
/
Accepted: 26 January 2021
/
Published: 1 February 2021
(This article belongs to the Special Issue Selected Papers from ICCSA 2020)
Abstract
:Additive Manufacturing Techniques such as Fused Filament Fabrication (FFF) produce 3D parts with complex geometries directly from a computer model without the need of using molds and tools, by gradually depositing material(s), usually in layers. Due to the rapid growth of these techniques, researchers have been increasingly interested in the availability of strategies, models or data that may assist process optimization. In fact, 3D printed parts often exhibit limited mechanical performance, which is usually the result of poor bonding between adjacent filaments. In turn, the latter is influenced by the temperature field history during deposition. This study aims at evaluating the influence of the phase change from the melt to the solid state undergone by semi-crystalline polymers such as Polylactic Acid (PLA), on the heat transfer during the deposition stage. The energy equation considering solidification is solved analytically and then inserted into a MatLab® code to model cooling in FFF. The deposition and cooling of simple geometries is studied first, in order to assess the differences in cooling of amorphous and semi-crystalline polymers. Acrylonitrile Butadiene Styrene (ABS) was taken as representing an amorphous material. Then, the deposition and cooling of a realistic 3D part is investigated, and the influence of the build orientation is discussed.
1. Introduction
Additive Manufacturing (AM) is a group of technologies that produce three-dimensional physical objects by gradually adding material [1,2]. Since the 1980s these technologies became adopted for a growing number of medical/engineering applications and have gradually entered our lives with the development of low-cost 3D printers [3,4]. In Fused Filament Fabrication (FFF) (also often denoted as Fused Deposition Modeling), parts are made layer by layer, each layer being obtained by the extrusion through a nozzle and the deposition of a molten plastic filament [5,6]. The nozzle movements are controlled by a computer, in accordance with a previously defined deposition sequence. Thus, FFF can produce a prototype or a finished product from a Computer Aided Design (CAD) model without the use of molds.
Despite the potential disruptive character of FFF, in practice 3D printed parts often show unsatisfactory mechanical resistance [7]. This is generally due to insufficient bonding between adjacent filaments, which in turn is determined by the temperature history upon cooling [8]. Consequently, knowledge of the temperature evolution during the deposition/cooling stage is valuable for process set-up and optimization.
The objective of this work was to compute the temperature evolution during deposition and cooling of FFF parts, taking into consideration the amorphous or semi-crystalline nature of polymers. This unique tool will not only enable an estimation of the magnitude of the effect of the phase change occurring during cooling/solidification of partially crystalline polymers, but will also give generality to the thermal model. The paper is organized as follows. Section 3 presents the algorithm for dealing with cooling of materials with a phase change, as well as the resulting computer code. Section 4 deals with the deposition and cooling of simple geometries, in order to gauge the differences in cooling of amorphous and semi-crystalline polymers. Section 5 studies the cooling of a large part, assuming all possible build orientations.
2. Related Work
Until recently, a limited range of materials was commercially available for FFF, but the situation is changing rapidly [9,10]. Acrylonitrile Butadiene Styrene (ABS) and Polylactic Acid (PLA) remain the most popular [11,12]. ABS, an amorphous polymer, exhibits good impact resistance and toughness, heat stability, chemical resistance, and long service life [13]. PLA, a partially crystalline polymer, is biodegradable (compostable) and has low melting temperature but has limited thermal stability [14]. The performance of these two materials for 3D printing has been assessed [15,16,17,18], particularly in terms of dimensional accuracy [19,20], surface roughness [21], mechanical performance [22] and emission of volatile organic compounds (VOC) [23,24]. For the 3D printing of a compact omnidirectional wheel, Rubies and Palacín [25] observed that when using 100% infill density, PLA yielded a better mechanical performance than ABS. Conversely, Shabana et al. [26] concluded that ABS parts exhibited better properties but released organic volatile compounds. However, upon combining alternate layers of the two materials, optimal results were attained. Mudassir [27] proposed a selection methodology for the two materials.
Often, both ABS and PLA 3D printed parts exhibit deficient performance, due to poor bonding between their various individual filaments. In fact, adequate bonding requires that contacting filaments are sufficiently hot during sufficient time in order to enable the necessary macromolecular diffusion [28,29]. Local temperatures and their time evolution depend on the geometry of the part, the printing conditions adopted and the thermo-physical properties of the polymer.
In a previous work, the authors developed a simulation methodology to predict the temperature history at any location of a 3D printed part. This entailed the development of an algorithm to define/up-date automatically contacts and thermal/initial conditions as the deposition proceeds, as well as a criterion to compute the degree of bonding between adjacent filaments [28]. Despite the practical usefulness and the general good agreement between theoretical predictions and experimental data [29], the method can only be used for amorphous materials such as ABS, which do not exhibit a phase transition from the melt to the solid state. In the case of partially crystalline polymers like PLA, the enthalpy of fusion (also known as latent heat of fusion), must be considered [30]. Zgryza et al. [31] showed experimentally by means of Infrared Thermography that differences in the surface temperature of 3D printed samples of ABS and PLA were smaller for ABS.
3. A code for the Prediction of Temperature Evolution during Cooling in FFF
3.1. Current Code
It has been shown that during the deposition of a filament, the heat transfers by convection with the environment and by conduction with the support/adjacent filaments control its temperature history [32]. The corresponding energy balance can then be translated into a differential energy equation, which can be solved analytically to yield a mathematical expression to compute the temperature evolution with time [33]. In the simulation method developed by the authors, this expression is used by an algorithm developed using MatLab®, which activates/deactivates contacts and thermal conditions arising as the deposition proceeds, depending on the part geometry, deposition sequence and operating conditions. By coupling a bonding criterion to the temperature profile history, it is also possible to predict the degree of bonding between adjacent filaments [28]. The following assumptions are considered in the model:
- The axial heat conduction is neglected. Given the low thermal conductivity of polymers and the small filaments radii, axial heat conduction is much smaller than convection and conduction between adjacent filaments;
- Computations are carried out when the Biot number is lower than 0.1, i.e., when the temperature gradient in each filament cross-section can be neglected;
- The thermal properties of the polymer are assumed to be temperature independent;
- The thermal contact conductance is assumed to be low (high thermal resistance) while bonding is not achieved, and high when bonding occurs.
The predictions of the code were experimentally validated for ABS filaments [29]. Comparison of calculations with experimental data for PLA showed excellent qualitative agreement [34].
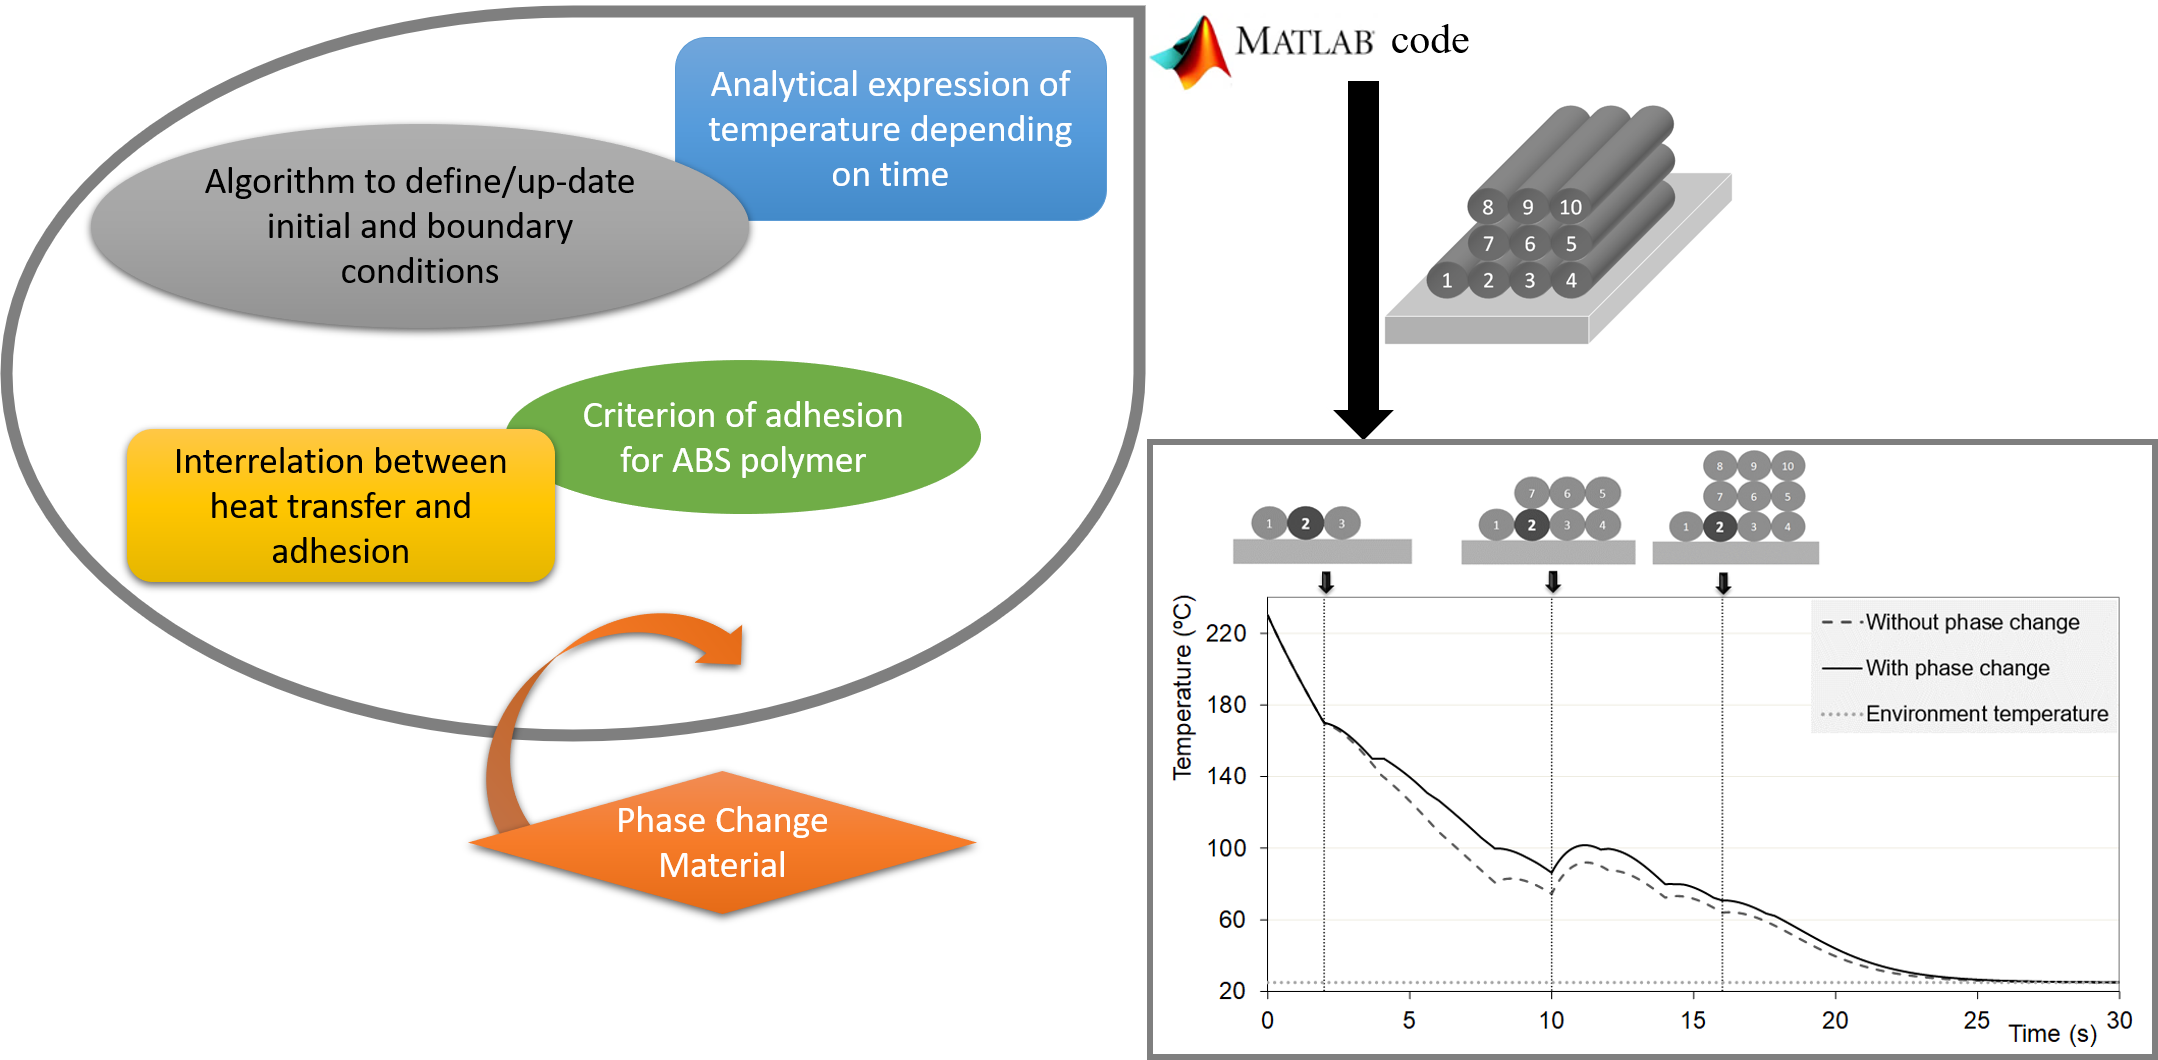
As illustrated in Figure 1, the objective is to include the phase change condition in order to allow the study of semi-crystalline polymers such as PLA.
3.2. Insertion of a Phase Change
The architecture of the macromolecular chains of a polymer determines the kinetics of cooling and solidification from the melt. In the case of amorphous polymers (such as ABS), the chains gradually rearrange upon cooling and retain a random structure upon solidification. Contrarily, the chains of partially crystalline polymers (such as PLA) rearrange upon freezing and form partly ordered regions, becoming aligned and folded. The heat of solidification of a partially crystalline polymer (the degree of crystallinity of commercial polymer usually ranges between 20–70%) is the change in enthalpy due to the heat absorbed to progress from liquid to a solid. Usually, material data refers instead to the heat of fusion (also known as enthalpy of fusion, or latent heat of fusion), which is equal but the opposite of the heat of solidification, as this property can be readily obtained from Differential Scanning Calorimetry [30].
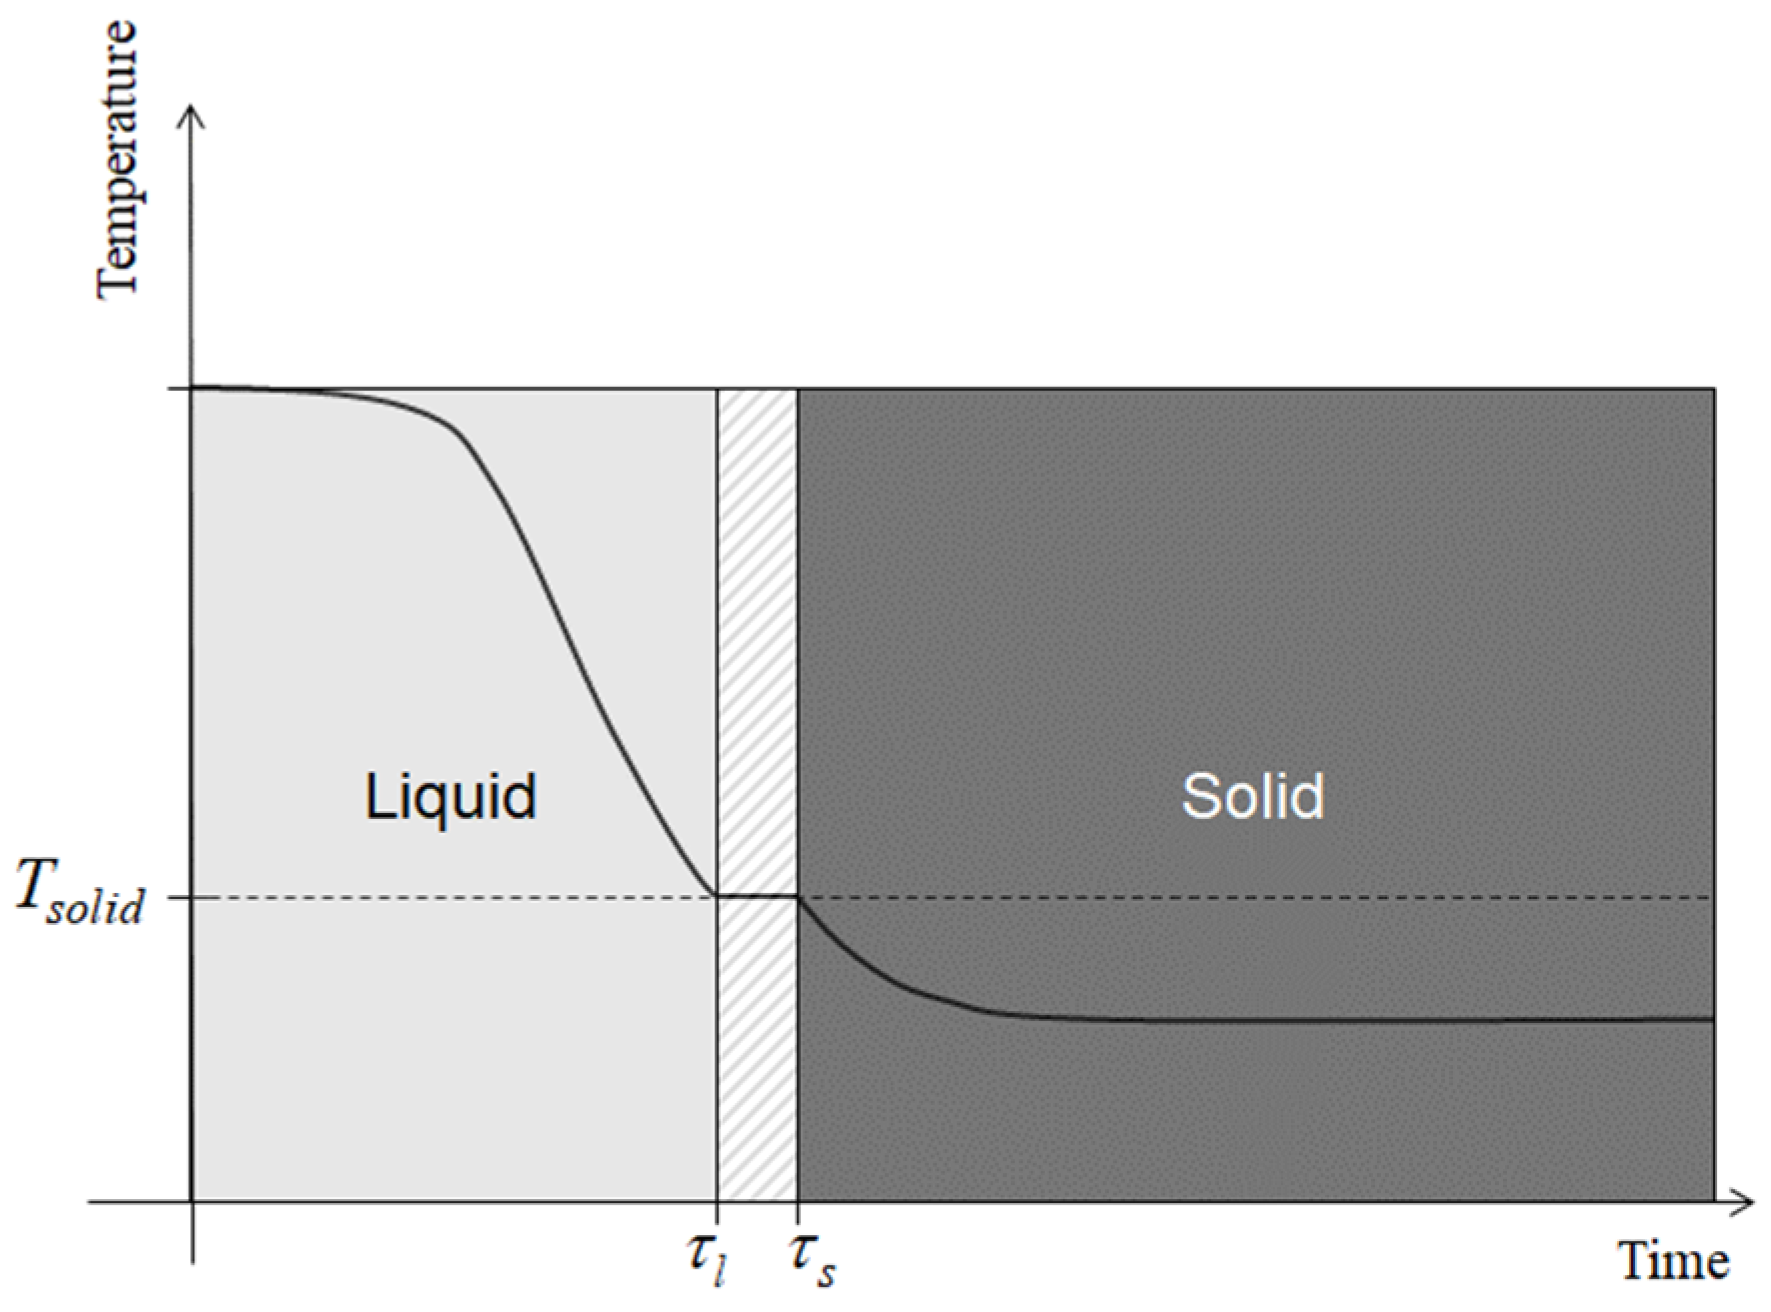
Therefore, when a molten filament of a partially-crystalline polymer cools down, a phase change from liquid to solid will occur in the time interval , where is the instant at which the filament reaches the solidification temperature and is the end of the phase change (Figure 2).
All filaments are sub-divided into elementary axial segments, each being deposited at a given time instant determined by the extrusion velocity. Then, the following phase change condition for each filament can be defined in the interval :
For the deposited filament segment ():
where is the convective heat transfer coefficient (), is the environment temperature (), is the number of physical contacts of the filament with adjacent filament segments or with the support of the 3D printer, is the thermal contact conductance for contact (), is the temperature of the adjacent filament segment or support for contact (), is the mass of the filament segment (), is the latent heat of fusion (), is the area exposed to the environment () and is the area of contact for the filament segment (), which are given by:
is the cross-section perimeter (), is the filament segment length (), is the fraction of that is in contact with another segment or with the support and is defined by, :
Inserting Equation (3) into Equation (2) and rearranging:
where is density () and is the cross-section area (). The following assumptions are made:
- Crystallization development during cooling does not affect the thermal properties, which are taken as temperature independent;
- When the temperature of the filament segment reaches , the thermal conditions used to compute are activated at ;
- If is the temperature of the adjacent filament segment for contact at instant , the value of will be assumed as the average between and ;
- If during a phase change a filament contacts a new hotter filament, its phase change is interrupted and the temperatures are re-computed. When its temperature reaches again , is computed for the new thermal conditions;
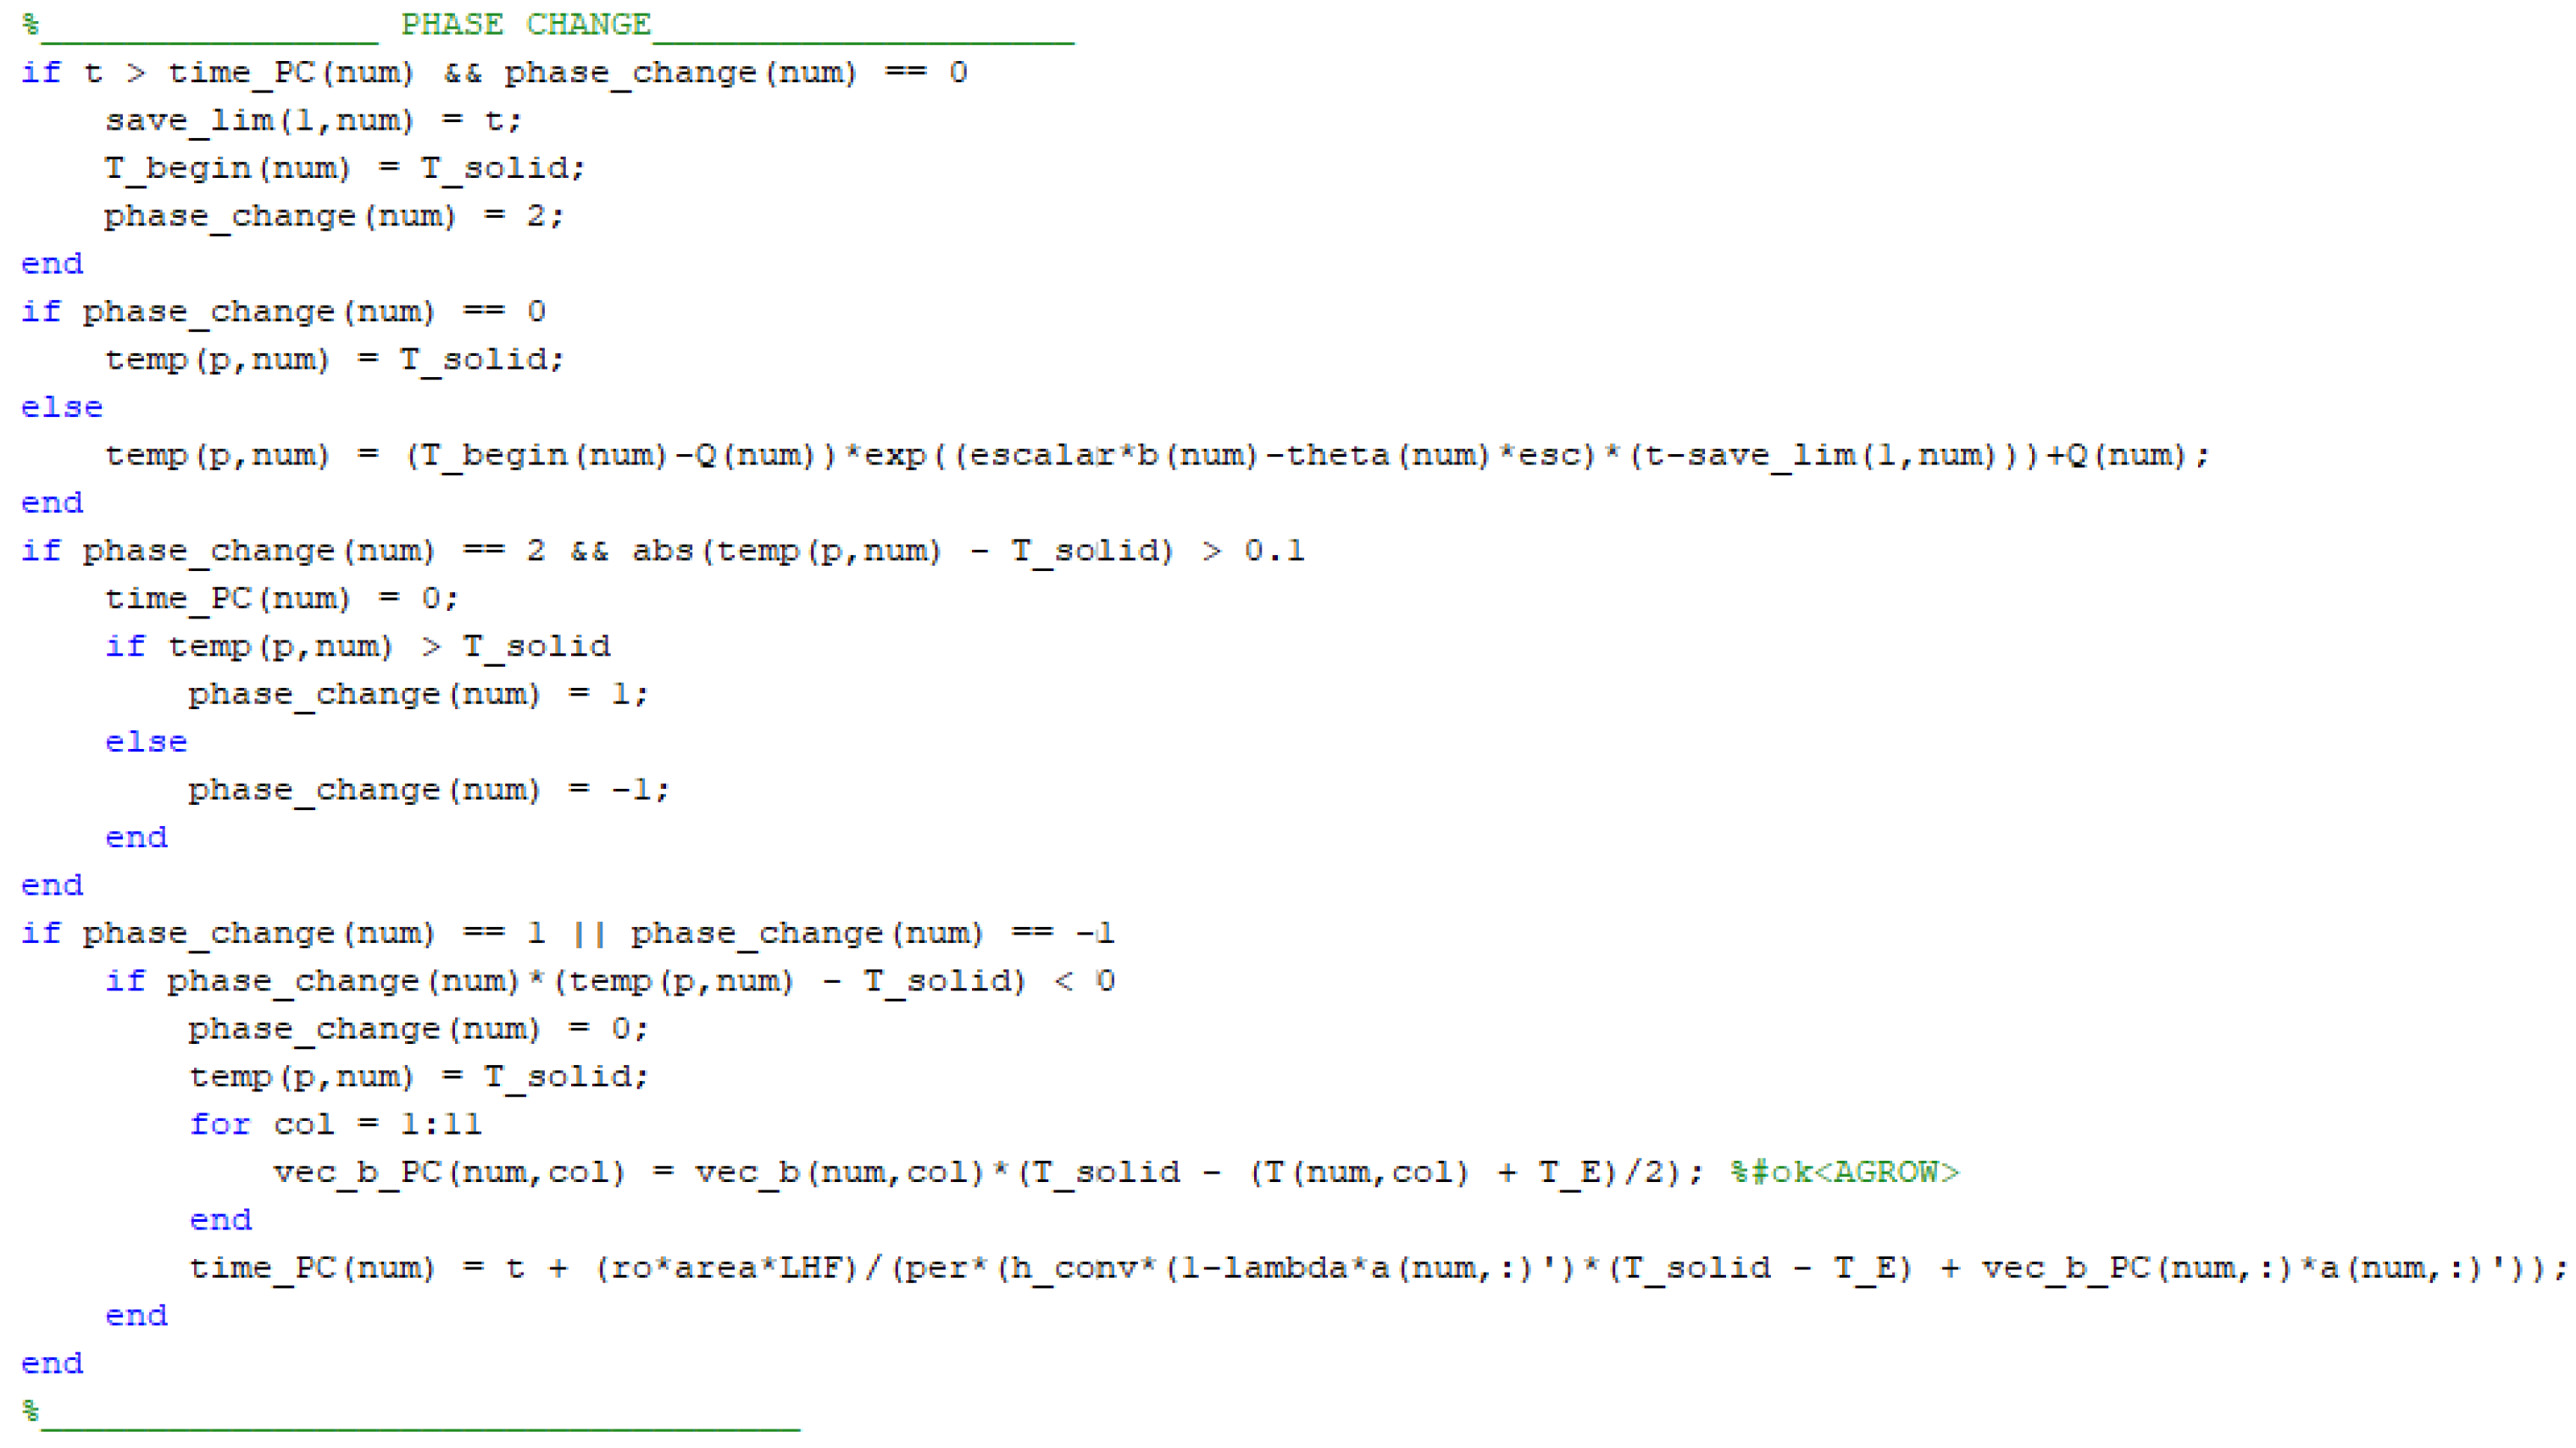
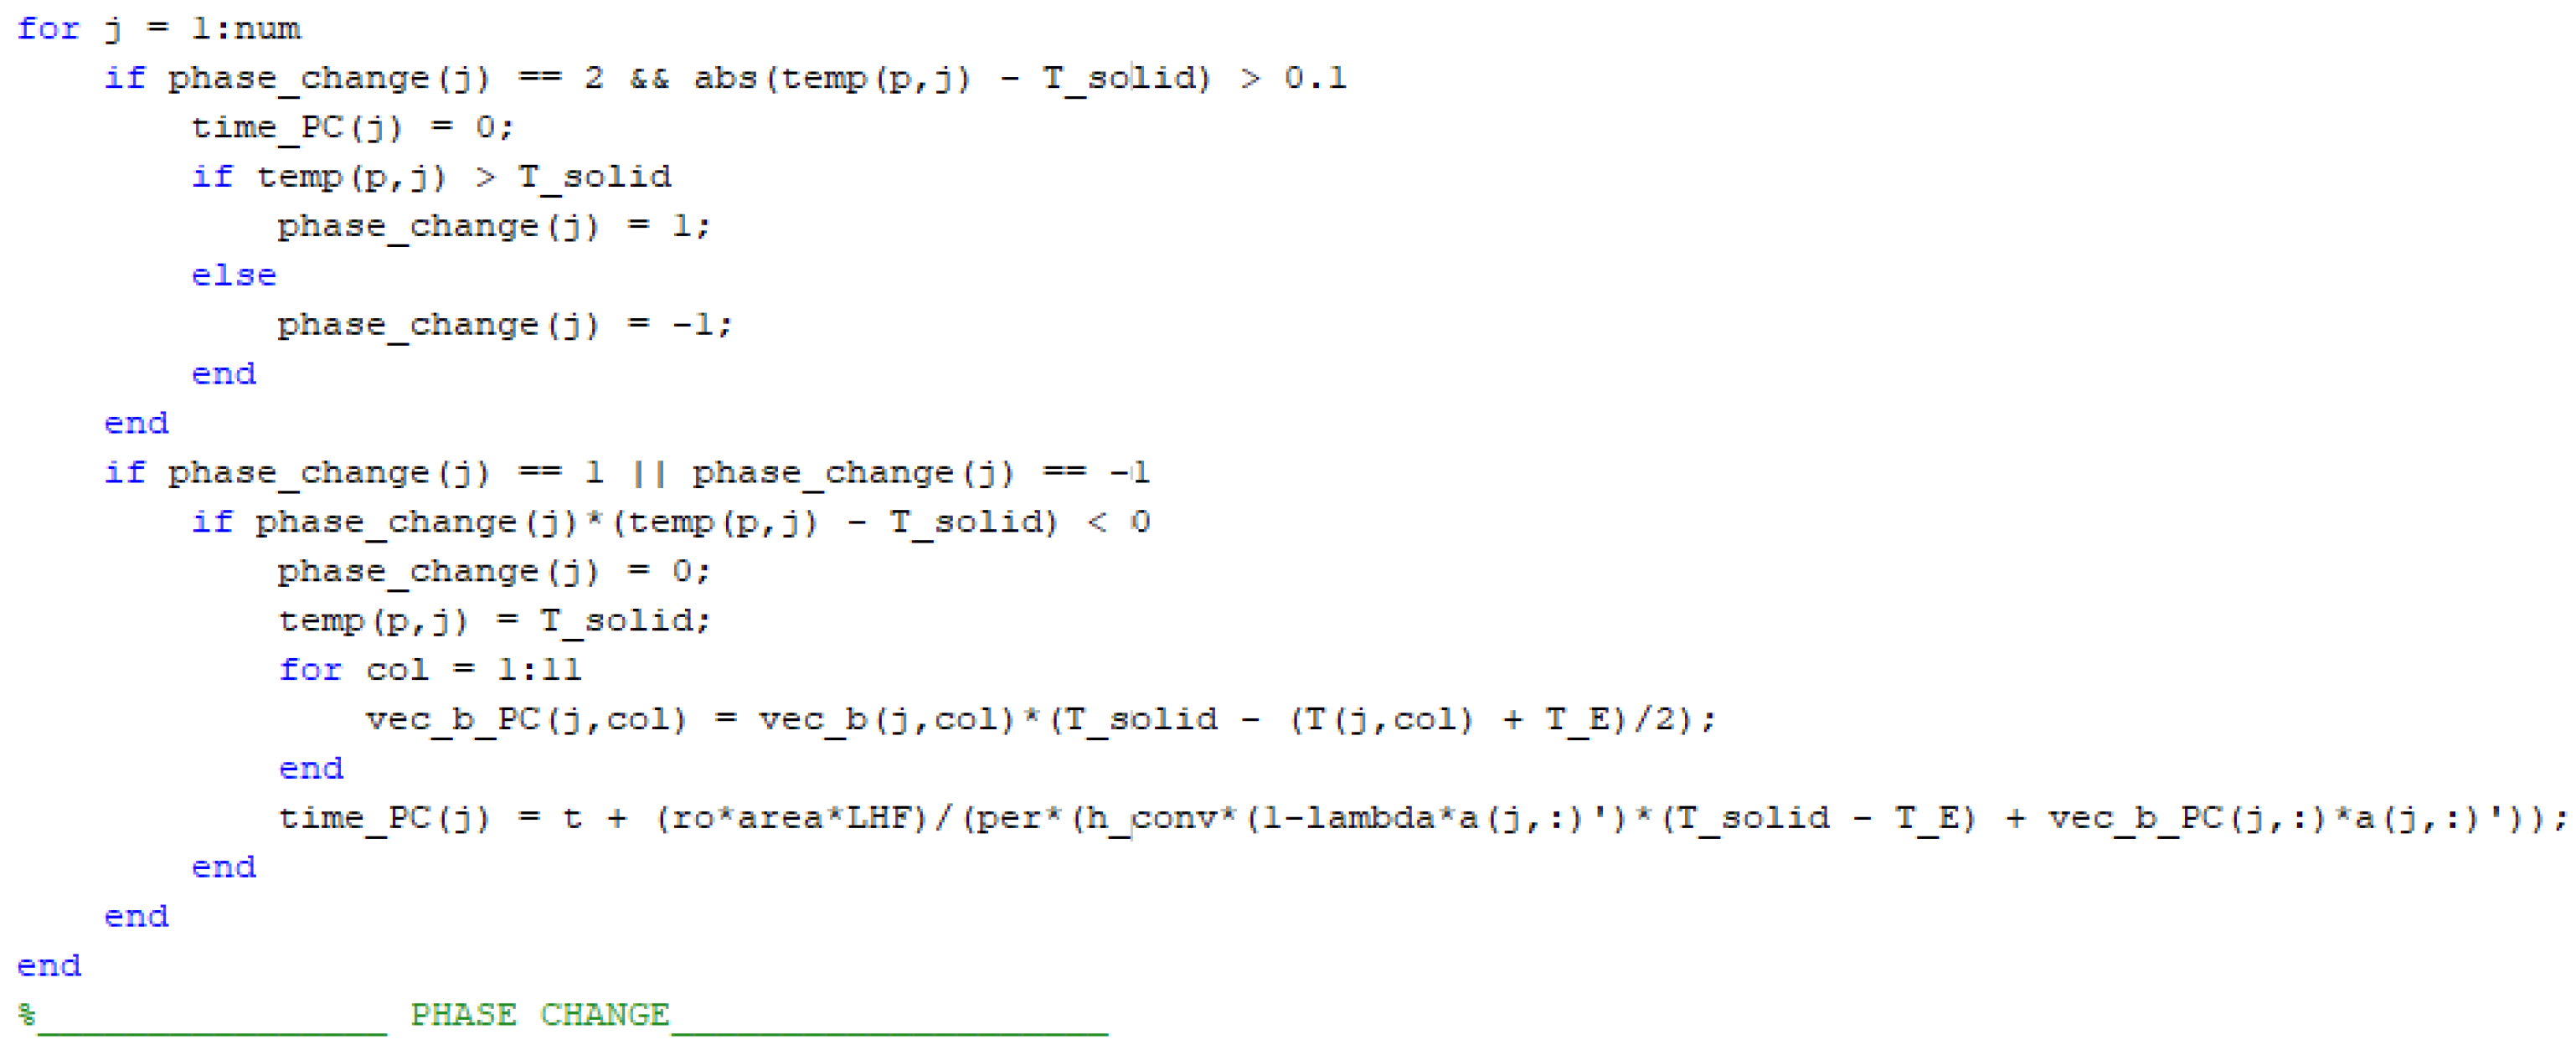
Equation (5) and the assumptions above were inserted in the algorithm. At each time increment, the filaments starting a phase change are identified. Their temperature during the phase change is kept constant, unless a new adjacent filament interrupts the process. A simplified flowchart is presented in Figure 3 and the respective section of the MatLab® code is shown in Figure 4. This section was inserted in the computer code previously developed by the authors [35].
4. Application of the Code to Simple 3D Printed Structures
This section deals with using the code to predict the cooling of simple 3D parts. The first example concerns the deposition of a single filament (Figure 5a), whereas the second considers the structure with 10 filaments illustrated in Figure 5b. Table 1 presents the main properties of ABS (P400 ABS, Stratasys®, Edina, MI, USA) and PLA (881N PLA, Filkemp®, Algueirão–Mem Martins, Portugal). Table 2 identifies the process parameters and computational variables. The heat transfer coefficient hconv was deduced using the correlation of Churchill and Chu [36], a high conductance between adjacent filaments was assumed, and an intermediate value for the extrusion temperature was considered to be suitable for both ABS and PLA. The version 9.2.0.556344 (R2017a) of MatLab® was used.
Figure 6 shows the temperature evolution of the cross-section of a single PLA filament (at x = 30 mm, i.e., at a section in the middle of the filament) from an initial temperature of 230 , with and without phase change, as predicted by the code presented above. The latter starts at t = 3.25 s and lasts 0.75 s. During this period, the temperature remains constant, whereas it decreases continuously if the phase change is not considered. This results in a temperature difference of 13.9 (at t = 4 s) between the two cooling processes.
When 10 filaments are deposited, contacts with adjacent filaments and support arise. Figure 7 shows the temperature evolution of the cross-section of filament 2 at x = 30 mm, with and without phase change, again for PLA and an initial temperature of 230 . In the computations, the travel time along the -axis is not considered (Figure 5), that is, the deposition of a new layer starts immediately after concluding the deposition of the previous one. The phase change occurs at t = 3.68 s and lasts 0.4 s, due to the thermal contacts with filaments 1 and 3. The peak initiated at t = 10 s is created by the new thermal contact with filament 7. The maximum temperature difference of 18.9 between the two curves is observed at approximately t = 8 s. This difference is higher than in the previous example (Figure 6) due to the contacts developing between filaments. As the temperature of each filament remains constant during its phase change, those filaments that are in contact with filaments that are undergoing a phase change cool more slowly, i.e., the temperature of each filament is influenced by its own phase change and by the phase change of the other filaments.
ABS and PLA having distinct thermal properties (Table 1) apart from their amorphous/partially crystalline character, their cooling rates should also differ. As seen in Figure 8, which shows the temperature evolution of the cross-section of filament 2, at x = 30 mm, the ABS filament cools faster, a maximum temperature difference of 39.1 being obtained for the two materials at approximately t = 6 s. In principle, this would mean that this particular PLA is a better option for FFF, as slower cooling favors bonding between filaments [28].
5. Applied Case Study
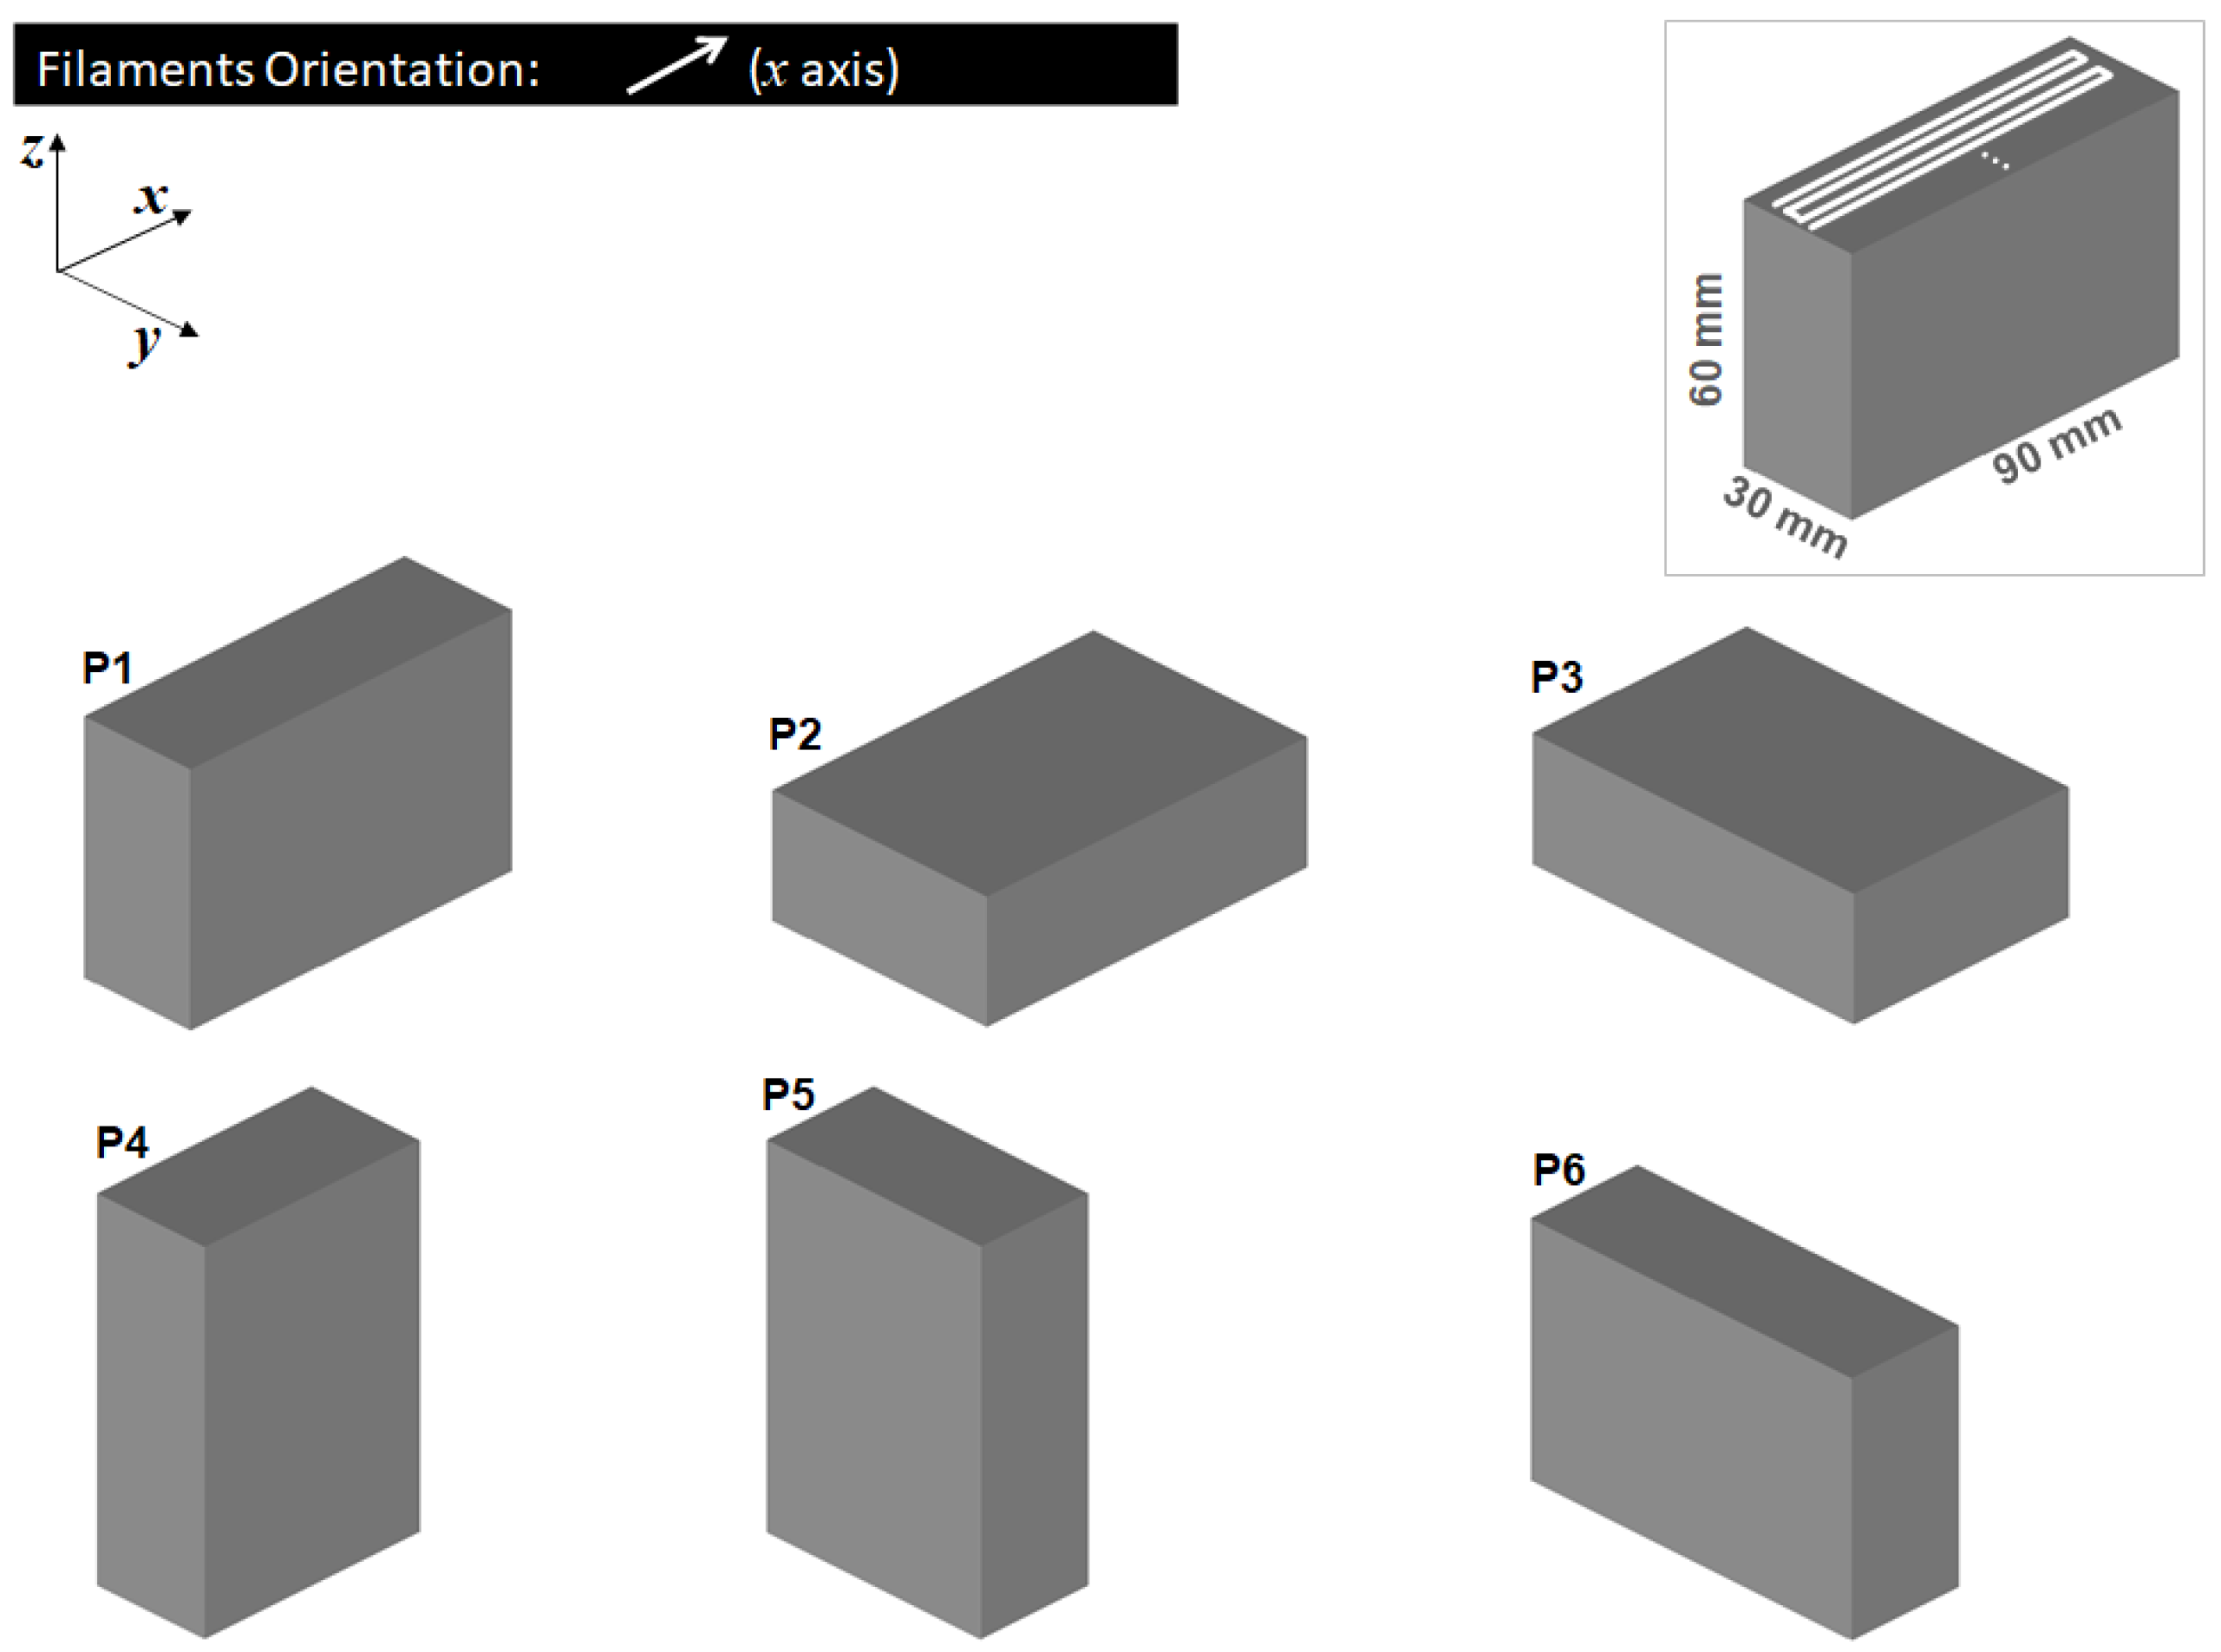
This section considers the manufacture by FFF of a rectangular tile with 90 × 60 × 30 mm using PLA or ABS. 3D printing will be carried out using a unidirectional and aligned strategy (i.e., filaments will be deposited along the x axis direction). Six build orientations (labelled P1 to P6) are feasible, as demonstrated in Figure 9. Orientations P1 and P2 entail the longest filaments (90 mm), whilst P5 and P6 require the shortest filaments (30 mm). If the filaments are circular (with a diameter of 0.25 mm) and the deposition velocity is set to 30 mm/s, it will take 24 h to perform the 3D printing of this part. Each build orientation will involve a different number of filaments and contact area with the support, as presented in Table 3. The materials properties (PLA and ABS) and the process parameters are defined in Table 1 and Table 2.
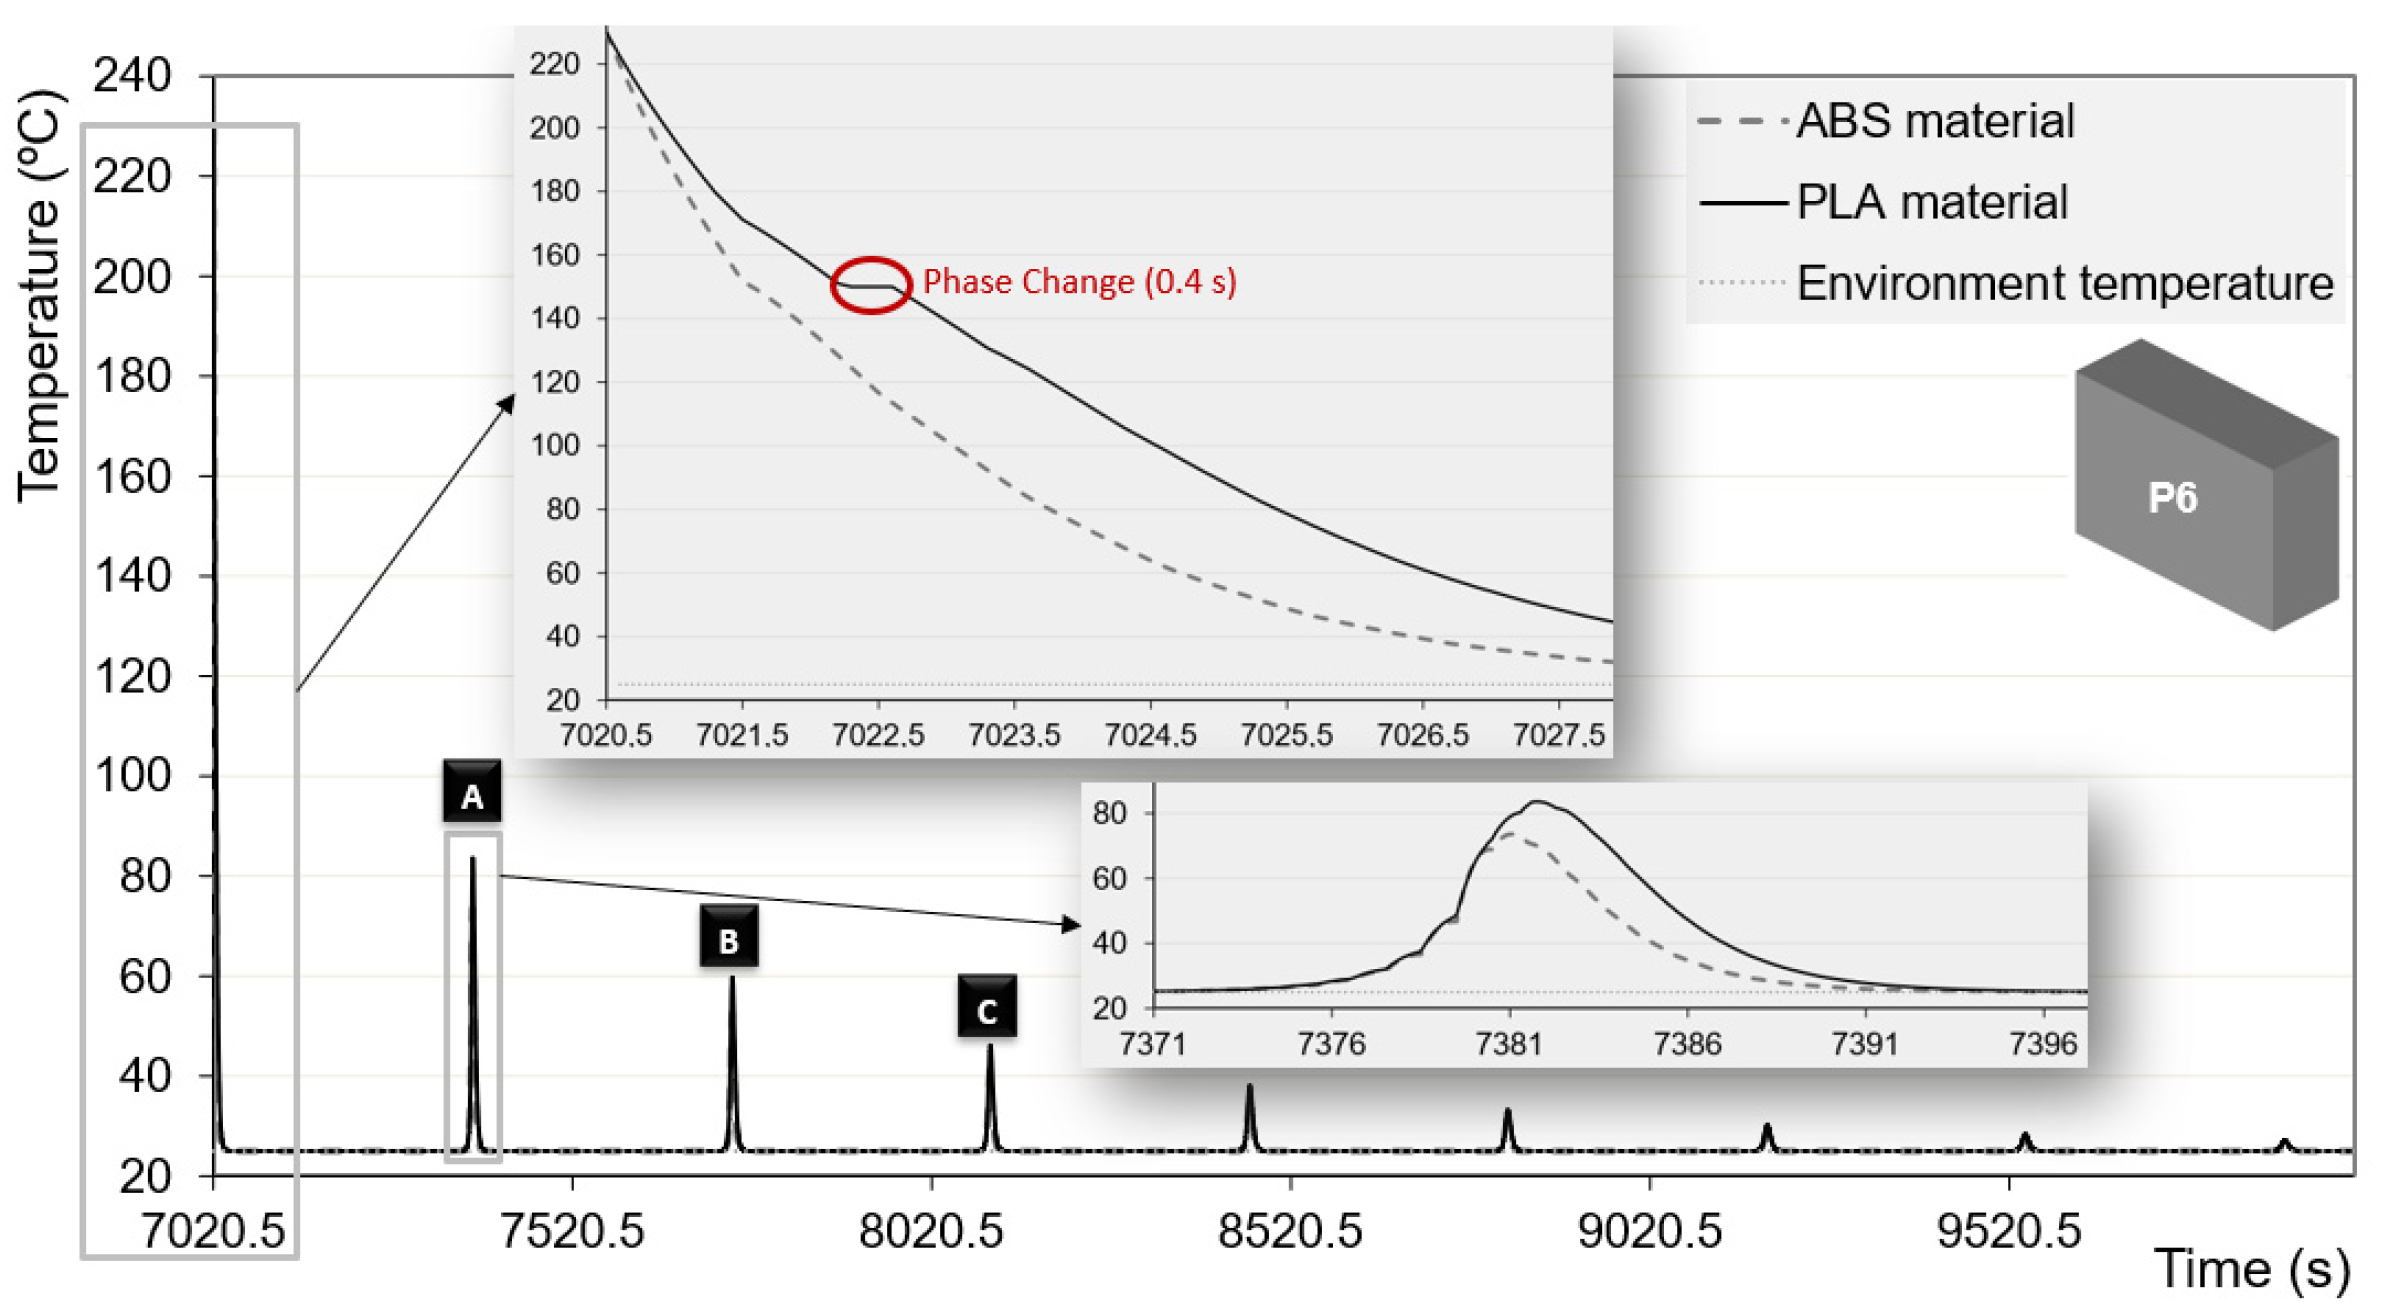
Given the high number of filaments necessary to perform the 3D printing of the part, in order to identify more easily the differences in cooling associated with each build orientation, as well as understand the rates of cooling of ABS and PLA (here representing the behavior of amorphous and partially crystalline polymers, respectively), the temperature evolution for one filament will be followed. The data presented in Figure 10 and Figure 11 concerns the central filament on the 20th layer counting from the support of the 3D printer. This corresponds to filament no. 2341 for orientations P1 and P4, no. 4681 for P2 and P5, and no. 7021 for orientations P3 and P6. As before, the data presented refers to the cross-section in the middle of the filament length, that is, at for orientations P1 and P2, for orientations P3 and P4 and for orientations P5 and P6.
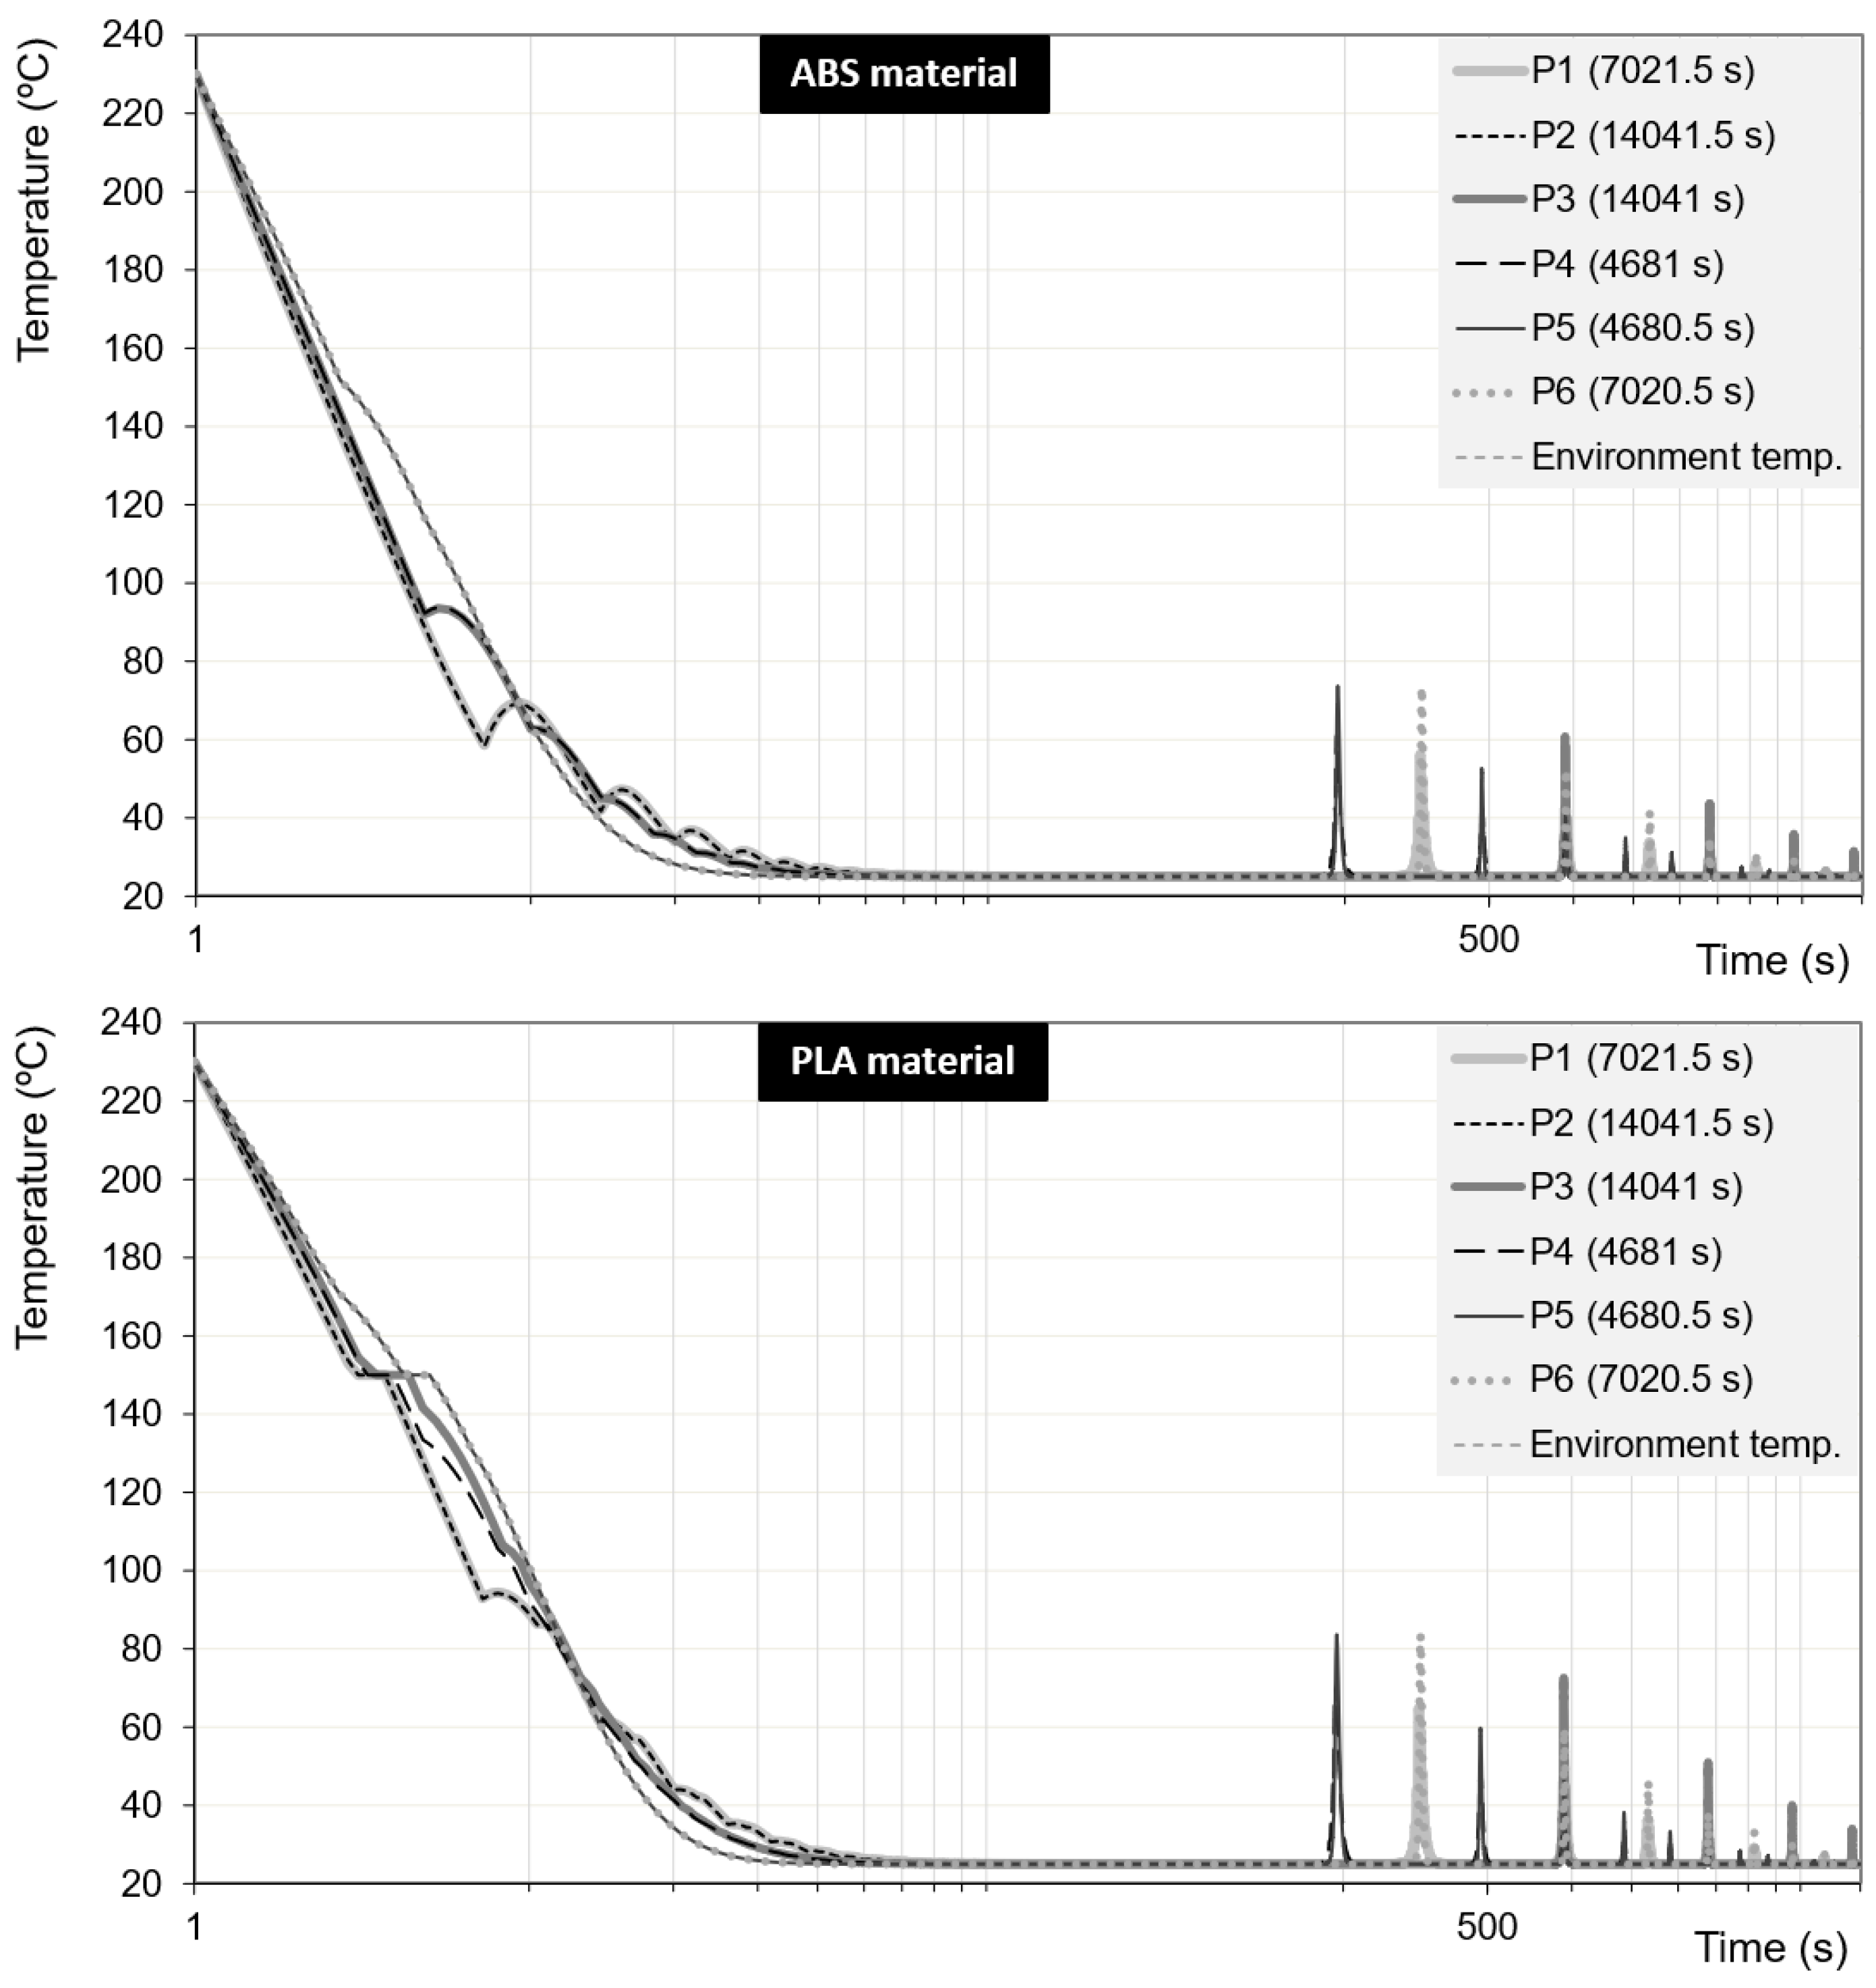
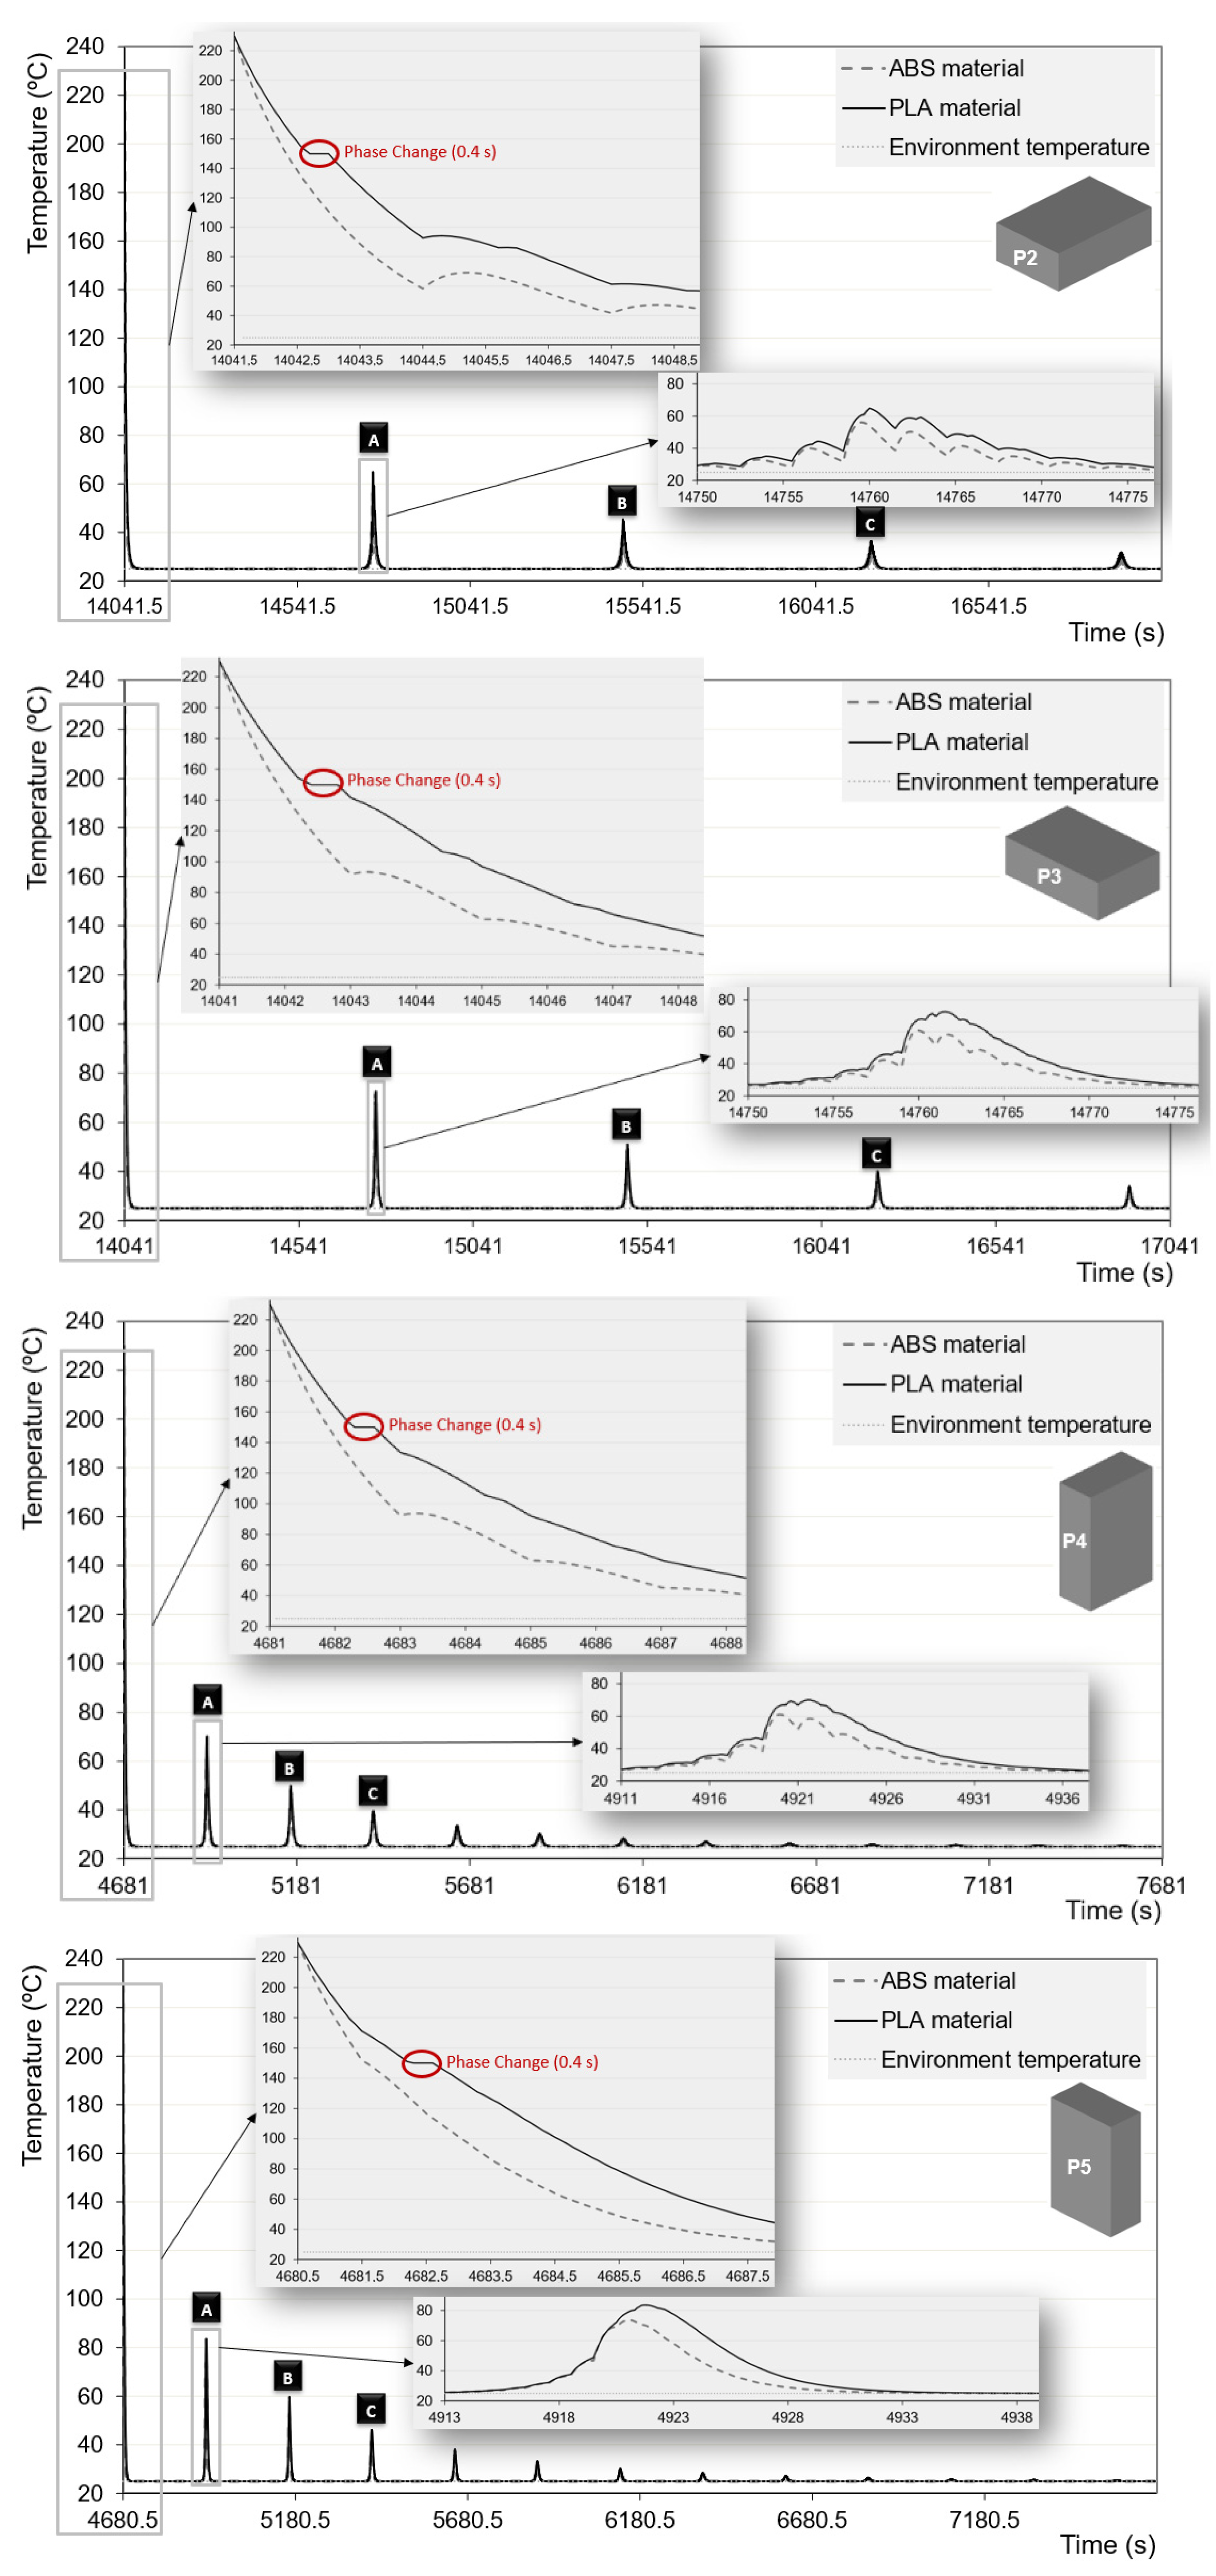
For an easier comparison of the thermal history associated with each material and build orientation, Figure 9 exhibits the temperature evolution during the first 3800 s from the instant the cross-section of the filaments highlighted was deposited. The actual time elapsed since building of the part started is identified in the figures labels. Figure 11 uses the real time scale to study in greater detail the temperature development during cooling, again for the six build orientations (this is why the time values in the x axis change with build orientation), and directly comparing the curves for ABS and PLA. The insets in the figures are magnifications of the progress of temperature during short time periods, evidencing either specific features of the curves or differences between the two materials.
Each of the two graphs of Figure 10 essentially displays 3 sets of curves, which are due to the similitudes in heat transfer between P1 and P2, P3 and P4 and P5 and P6. In the initial seconds, the cooling rate is higher for P1 and P2, followed by P3 and P4, and finally by P5 and P6. This is directly related to the length of the filaments for each build orientation (90, 60 and 30 mm, respectively), which leads to different deposition times (3, 2 and 1 s, respectively) and determines the period of time elapsed between contacts. Indeed, the figures clearly show that the cooling of the filament is influenced by the physical contact with filaments that are deposited later, as well as by heat transfer from newer filaments belonging to other more recent layers. The peaks around 500 s are a good example of the latter effect. Also, a comparison between the two graphs will show that at analogous cooling times the filament temperatures are generally higher for PLA, due to the occurrence of a phase change (and the inherent thermal properties of each material), but this is more clearly seen in Figure 11.
As discussed above, Figure 11 reveals in more detail how the temperature of the mid cross-section of the filament selected evolves with time for the various build orientations and for the two materials. In each graph, the initial sharp temperature decrease results from the deposition of the filament. The inset clearly shows that the differences in the cooling rate between ABS and PLA are due to their intrinsic thermal properties (influencing the slope of the curve) as well as by their crystalline character, with PLA exhibiting a plateau due to the phase change. In the same inset, the first temperature peak arises due to the physical contact with the next filament being deposited. The remaining peaks in each graph were caused by the heat transfer developing due to the deposition of new hotter filaments in the same layer and in the layers above.
The magnitude of the initial peak is small, but varies with build orientation. Also, the time at which it develops differs with build orientation. The longer the filament, the larger the time elapsed between the successive contributions to heat transfer from new filaments, and consequently the lower the re-heating effect. As the deposition of the part continues, the filament being studied reaches the environment temperature. From then onwards, the intensity of the temperature peaks decreases, because the distance between this filament and any new filament being deposited also increases.
Table 4 quantifies some of the features of the curves in Figure 11, thus evidencing the temperature differences upon cooling of ABS and PLA for the part being considered. It includes the maximum temperature difference between the two materials that was observed during the global deposition/cooling sequence. This amounts to approximately 40 and depends little on build orientation. Once the filament reaches the environment temperature, the temperatures of the next 3 peaks (denoted A, B and C in Figure 11) were also registered and are included in the Table. As expected, the magnitude of these peaks decreases as the deposition of the 3D part proceeds, because the new individual filaments that are deposited are gradually more distant from the cross-section being monitored. Naturally, the temperature differences between the two materials also decrease (from approximately 10 for peak A, to circa 6 for peak B, to around 4 for peak C). Also, the temperatures for PLA are consistently higher than those for ABS, obviously due to the phase change undertook by the former. Build orientation has an effect on the temperature of peaks A to C, particularly for the first. A difference of almost 20 was registered for orientation P1 (64.8 ) relative to P5 (83.6 ). Again, the higher temperatures occur for the build orientations dealing with shorter filaments, where the contacts between filaments at any given vertical cross-section of the part are more frequent. These re-heating peaks may contribute significantly to the quality of the 3D printed part, because if sufficiently high temperatures are attained, bonding between contiguous filaments is favored.
6. Conclusions
A simulation method to predict quantitatively the temperature evolution of filaments during deposition and cooling in FFF, capable of dealing with both amorphous and semi-crystalline polymers, was implemented. The simulation can be applied to any thermoplastic or composite as long as its thermal properties are known. When depositing a single filament of PLA, a temperature difference of almost 14 °C is observed when considering a phase chance relative to ignoring it. In the case of structures with several filaments, the temperature difference can raise to about 20 °C, due to the re-heating effects of neighboring filaments. The differences between the two types of materials were highlighted studying the deposition of a single filament and a simple structure with 10 filaments, made with ABS or PLA. The evolution of temperature with time can become significantly different for the two polymers (differences of up to 40 °C), especially when several filaments come into contact with each other.
An applied case study was also presented, by considering the 3D printing of a 90 × 60 × 30 mm brick-like part, which would take 24 h to manufacture under the usual deposition velocity of 30 mm/s. The influence of the build orientation selected was investigated. It was shown that the time evolution of the filaments temperature depends on their length, as this determines the frequency at which heat transfer from newly deposited filaments contributes to re-heating. Temperature differences of around 30 °C were predicted. The temperature of PLA filaments was always higher than that of ABS for all the 3D printing orientations, due to the inherent thermal properties of the two materials and the existence of a phase change in PLA.
The work presented is a first step towards predicting the properties of parts produced by FFF. Knowing the evolution of temperature with time as the deposition proceeds, it is possible to predict bonding between contiguous filaments by means of a healing criterion, as well as part shrinkage and warpage arising due to local temperature gradients. As a further step, the mechanical properties of 3D parts could be estimated; for example, with the use of sintering models.
Author Contributions
Conceptualization, S.F.C., F.M.D. and J.A.C.; methodology, S.F.C.; software, S.F.C.; validation, S.F.C., F.M.D. and J.A.C.; writing—original draft preparation, S.F.C.; writing—review and editing, S.F.C., F.M.D. and J.A.C.; supervision, F.M.D. and J.A.C.; funding acquisition, S.F.C., F.M.D. and J.A.C. All authors have read and agreed to the published version of the manuscript.
Funding
This work has been partially supported by national funds through FCT—Fundação para a Ciência e Tecnologia through project UIDB/04728/2020. Partial support for this research has been provided by the Search-ON2: Revitalization of HPC infrastructure of Uminho, (NORTE-07-0162-FEDER-000086), co-funded by the North Portugal Regional Operational Programme (ON.2-O Novo Norte), under the National Strategic Reference Framework (NSRF), through the European Regional Development Fund (ERDF).
Institutional Review Board Statement
Not applicable.
Informed Consent Statement
Not applicable.
Data Availability Statement
Authors can confirm that all relevant data are included in the article.
Conflicts of Interest
The authors declare no conflict of interest.
References
- Gebhardt, A. Understanding Additive Manufacturing: Rapid Prototyping–Rapid Tooling–Rapid Manufacturing, 1st ed.; Hanser: Munich, Germany, 2008. [Google Scholar]
- Chua, C.K.; Leong, K.F.; Lim, C.S. Rapid Prototyping: Principles and Applications, 3rd ed.; World Scientific: Singapore, 2010. [Google Scholar]
- Ingole, D.S.; Kuthe, A.M.; Thakare, S.B.; Talankar, A.S. Rapid prototyping—A technology transfer approach for development of rapid tooling. Rapid Prototyp. J. 2009, 15, 280–290. [Google Scholar] [CrossRef]
- Long, J.; Gholizadeh, H.; Lu, J.; Bunt, C.; Seyfoddin, A. Application of Fused Deposition Modelling (FDM) Method of 3D Printing in Drug Delivery. Curr. Pharm. Des. 2017, 23, 433–439. [Google Scholar] [CrossRef] [PubMed]
- Harris, M.; Potgieter, J.; Archer, R.; Arif, K.M. Effect of material and process specific factors on the strength of printed parts in fused filament fabrication: A review of recent developments. Materials 2019, 12, 1664. [Google Scholar] [CrossRef] [PubMed] [Green Version]
- Mackay, M.E. The importance of rheological behavior in the additive manufacturing technique material extrusion. J. Rheol. 2018, 62, 1549–1561. [Google Scholar] [CrossRef]
- Sood, A.K.; Ohdar, R.K.; Mahapatra, S.S. Parametric appraisal of mechanical property of fused deposition modelling processed parts. Mater. Des. 2010, 31, 287–295. [Google Scholar] [CrossRef]
- Sun, Q.; Rizvi, G.M.; Bellehumeur, C.T.; Gu, P. Effect of processing conditions on the bonding quality of FDM polymer filaments. Rapid Prototyp. J. 2008, 14, 72–80. [Google Scholar] [CrossRef]
- Carneiro, O.S.; Silva, A.F.; Gomes, R. Fused deposition modeling with polypropylene. Mater. Des. 2015, 83, 768–776. [Google Scholar] [CrossRef]
- Zanjanijam, A.R.; Major, I.; Lyons, J.G.; Lafont, U.; Devine, D.M. Fused Filament Fabrication of PEEK: A Review of Process-Structure-Property Relationships. Polymers 2020, 12, 1665. [Google Scholar] [CrossRef]
- Vanaei, H.; Shirinbayan, M.; Deligant, M.; Raissi, K.; Fitoussi, J.; Khelladi, S.; Tcharkhtchi, A. Influence of process parameters on thermal and mechanical properties of polylactic acid fabricated by fused filament fabrication. Polym. Eng. Sci. 2020, 1–10. [Google Scholar] [CrossRef]
- Vicente, C.M.S.; Martins, T.S.; Leite, M.; Ribeiro, A.; Reis, L. Influence of fused deposition modeling parameters on the mechanical properties of ABS parts. Polym. Adv. Technol. 2020, 31, 501–507. [Google Scholar] [CrossRef]
- Hwang, S.; Reyes, E.I.; Moon, K.; Rumpf, R.C.; Kim, N.S. Thermo-mechanical Characterization of Metal/Polymer Composite Filaments and Printing Parameter Study for Fused Deposition Modeling in the 3D Printing Process. J. Electron. Mater. 2013, 44, 771–777. [Google Scholar] [CrossRef]
- Izdebska, J. Printing on Polymers: Theory and Practice. Printing on Polymers: Fundamentals and Applications; Izdebska, J., Thomas, S., Eds.; William Andrew: Waltham, MA, USA, 2016; pp. 1–20. [Google Scholar]
- Kuznetsov, V.E.; Solonin, A.N.; Urzhumtsev, O.D.; Schilling, R.; Tavitov, A.G. Strength of PLA Components Fabricated with Fused Deposition Technology Using a Desktop 3D Printer as a Function of Geometrical Parameters of the Process. Polymers 2018, 10, 313. [Google Scholar] [CrossRef] [PubMed] [Green Version]
- Tymrak, B.M.; Kreiger, M.; Pearce, J.M. Mechanical properties of components fabricated with open-source 3D printers under realistic environmental conditions. Mater. Des. 2014, 58, 242–246. [Google Scholar] [CrossRef]
- Waseem, M.; Salah, B.; Habib, T.; Saleem, W.; Abas, M.; Khan, R.; Ghani, U.; Siddiqi, M. Multi-Response Optimization of Tensile Creep Behavior of PLA 3D Printed Parts Using Categorical Response Surface Methodology. Polymers 2020, 12, 2962. [Google Scholar] [CrossRef] [PubMed]
- Gosset, A.; Barreiro-Villaverde, D.; Permuy, J.C.; Lema, M.; Ares-Pernas, A.; López, M.J. Experimental and Numerical Investigation of the Extrusion and Deposition Process of a Poly(lactic Acid) Strand with Fused Deposition Modeling. Polymers 2020, 12, 2885. [Google Scholar] [CrossRef]
- Melenka, G.W.; Schofield, J.S.; Dawson, M.R.; Carey, J.P. Evaluation of dimensional accuracy and material properties of the makerbot 3D desktop printer. Rapid Prototyp. J. 2015, 21, 618–627. [Google Scholar] [CrossRef]
- Milde, J.; Hrusecky, R.; Zaujec, R.; Morovic, L.; Gorog, A. Research of ABS and PLA Materials in the Process of Fused Deposition Modeling Method. Ann. DAAAM Proc. 2017, 28, 812–820. [Google Scholar]
- Hafsa, M.; Ibrahim, M.; Wahab, M.; Zahid, M. Evaluation of FDM pattern with ABS and PLA material. Appl. Mech. Mater. 2013, 465/466, 55–59. [Google Scholar] [CrossRef]
- Rodríguez-Panes, A.; Claver, J.; Camacho, A.M. The influence of Manufacturing Parameters on the Mechanical Behaviour of PLA and ABS Pieces Manufactured by FDM: A comparative Analysis. Materials 2018, 11, 1333. [Google Scholar] [CrossRef] [Green Version]
- Wojtyla, S.; Klama, P.; Baran, T. Is 3D printing safe? Analysis of the thermal treatment of thermoplastics: ABS, PLA, PET, and nylon. J. Occup. Environ. Hyg. 2017, 14, 80–85. [Google Scholar] [CrossRef]
- Kim, Y.; Yoon, C.; Ham, S.; Park, J.; Kim, S.; Kwon, O.; Tsai, P.J. Emissions of nanoparticles and gaseous material from 3D printer operation. Environ. Sci. Technol. 2015, 49, 12044–12053. [Google Scholar] [CrossRef] [PubMed]
- Rubies, E.; Palacín, J. Design and FDM/FFF Implementation of a Compact Omnidirectional Wheel for a Mobile Robot and Assessment of ABS and PLA Printing Materials. Robotics 2020, 9, 43. [Google Scholar] [CrossRef]
- Shabana, R.V.; Santosh, N.; Sarojini, J.; Vikram, K.A.; Lakshmi, V.V. Evaluating the Mechanical Properties of Commonly Used 3d Printed ABS and PLA Polymers with Multi-Layered Polymers. Int. J. Eng. Adv. Technol. 2019, 8, 2341–2356. [Google Scholar]
- Mudassir, A. Measuring Accuracy of Two 3D Printing Materials, Department of Engineering Technologies; Bowling Green State University: Bowling Green, OH, USA, 2016. [Google Scholar]
- Yang, F.; Pitchumani, R. Healing of Thermoplastic Polymers at an interface under Nonisothermal Conditions. Macromolecules 2020, 35, 3213–3224. [Google Scholar]
- Costa, S.F.; Duarte, F.M.; Covas, J.A. Estimation of filament temperature and adhesion development in Fused Deposition Techniques. J. Mater. Process. Technol. 2017, 245, 167–179. [Google Scholar] [CrossRef]
- Kong, Y.; Hay, J.N. The enthalpy of fusion and degree of crystallinity of polymers as measured by DSC. Eur. Polym. J. 2003, 39, 1721–1727. [Google Scholar] [CrossRef]
- Zgryza, L.; Raczynska, A.; Pasnikowska-Lukaszuk, M. Thermovisual measurements of 3D printing of ABS and PLA filaments. Adv. Sci. Technol. Res. J. 2020, 12, 266–271. [Google Scholar] [CrossRef]
- Costa, S.F.; Duarte, F.M.; Covas, J.A. Thermal conditions affecting heat transfer in FDM/FFE: A contribution towards the numerical modelling of the process. Virtual Phys. Prototyp. 2014, 10, 1–12. [Google Scholar] [CrossRef]
- Costa, S.F.; Duarte, F.M.; Covas, J.A. An Analytical Solution for Heat Transfer during deposition in extrusion-based 3D Printing techniques. In Proceedings of the 15th International Conference Computational and Mathematical Methods in Science and Engineering, Rota Cadiz, Spain, 6–10 July 2015; pp. 1161–1172. [Google Scholar]
- Vanaei, H.R.; Shirinbayan, M.; Costa, S.F.; Duarte, F.M.; Covas, J.A.; Deligant, M.; Khelladi, S.; Tcharkhtchi, A. Experimental study of PLA thermal behavior during fused filament fabrication. J. Appl. Polym. Sci. 2020, 138, 49747. [Google Scholar] [CrossRef]
- Costa, S.; Duarte, F.; Covas, J. Using MATLAB to Compute Heat Transfer in Free Form Extrusion. In MATLAB—A Ubiquitous Tool for the Practical Engineer; InTech: Rijeka, Croatia, 2011; pp. 453–474. [Google Scholar]
- Holman, J.P. Heat Transfer; McGraw-Hill Brasil: New York, NY, USA, 2010. [Google Scholar]
Figure 1.
Algorithm to predict temperatures and adhesion of amorphous parts made by FFF.
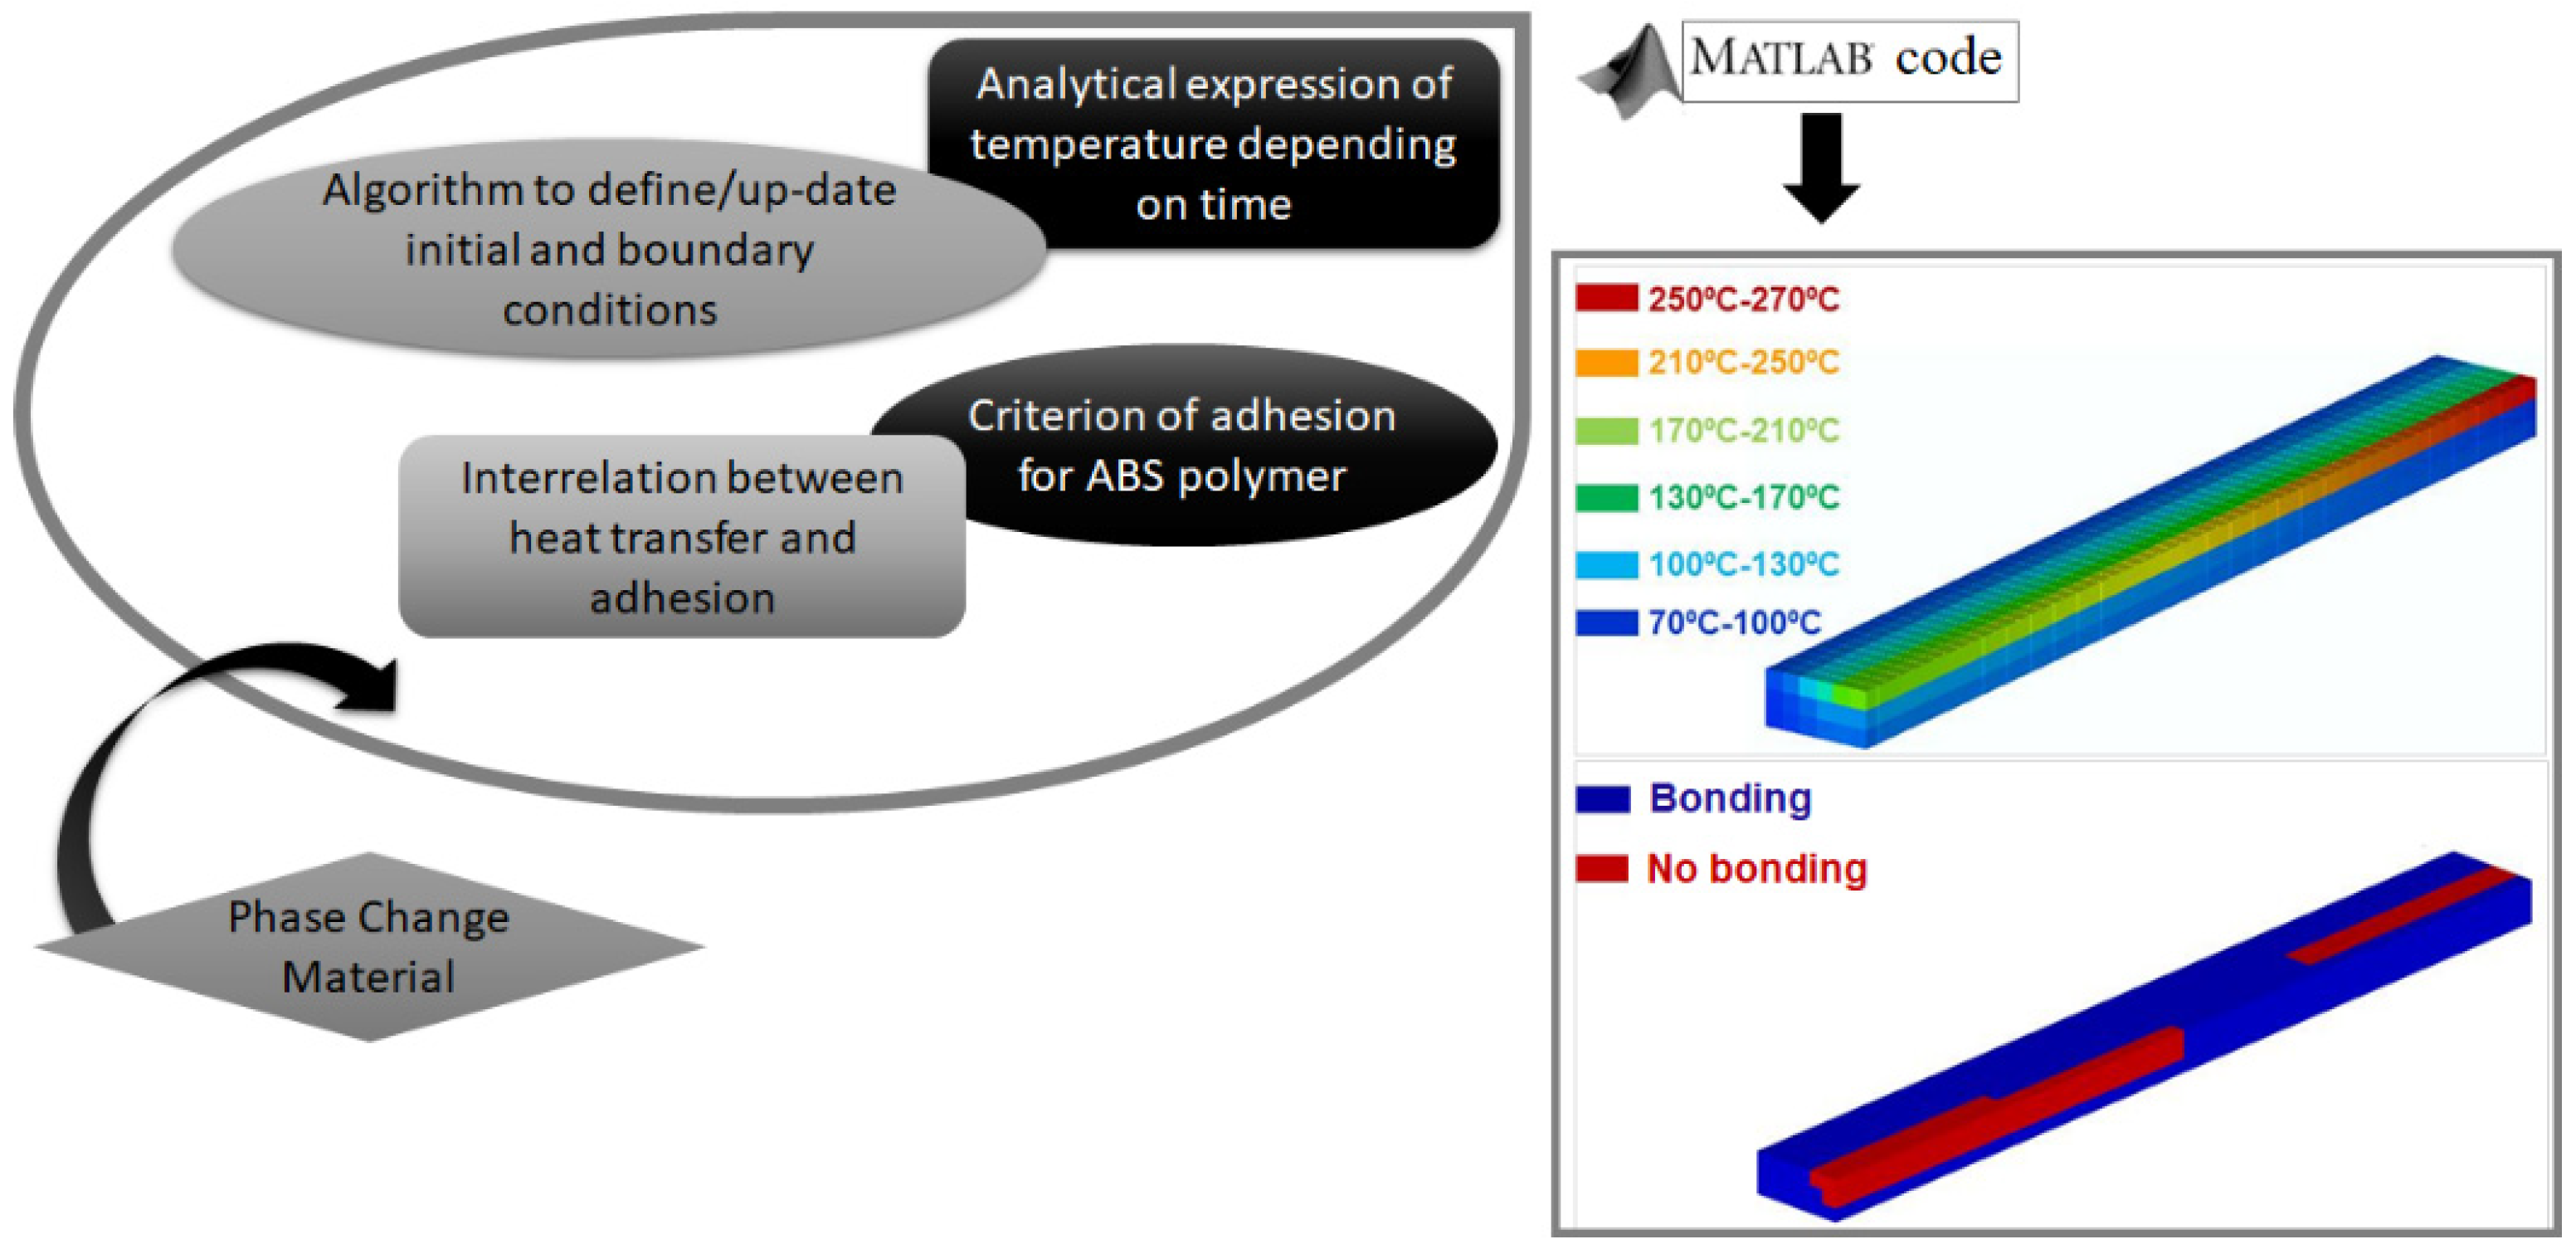
Figure 2.
Schematics of the typical temperature evolution (cooling) when a phase change occurs.

Figure 3.
Simplified flowchart of the section of the code dealing with the phase change.

Figure 4.
Section of the code dealing with the phase change.


Figure 5.
(a) Deposition of a single filament; (b) Deposition of a part made of 10 filaments.
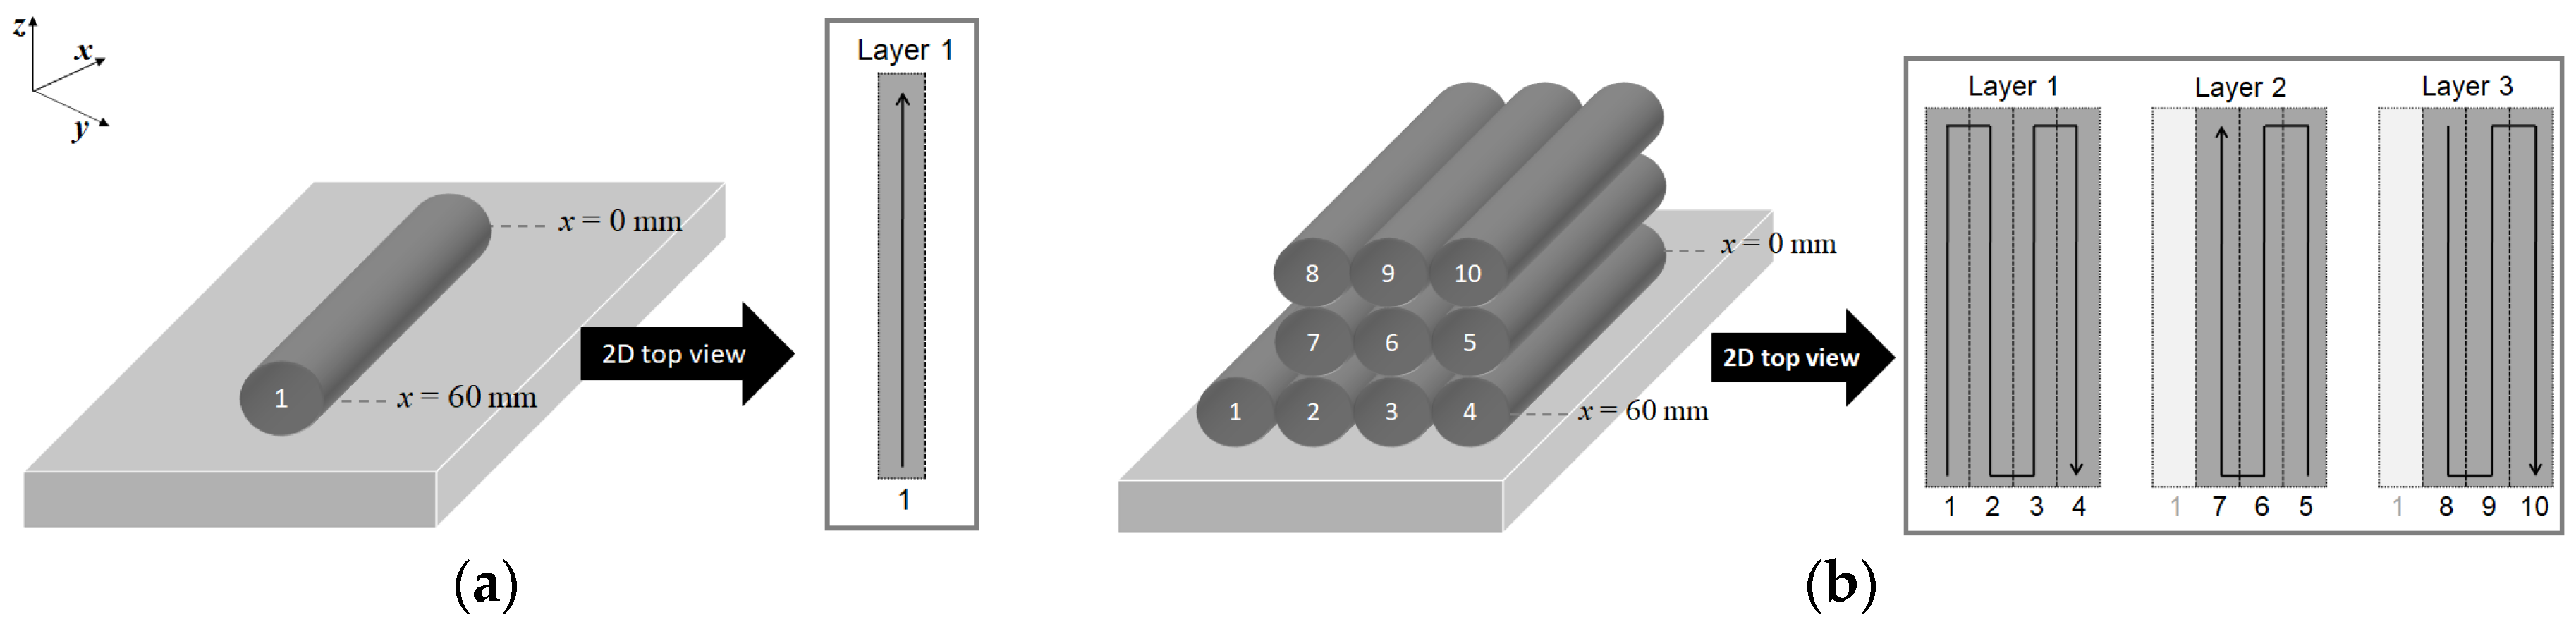
Figure 6.
Evolution of temperature with time for a single PLA filament with and without phase change (at x = 30 mm from the edge).
Figure 6.
Evolution of temperature with time for a single PLA filament with and without phase change (at x = 30 mm from the edge).
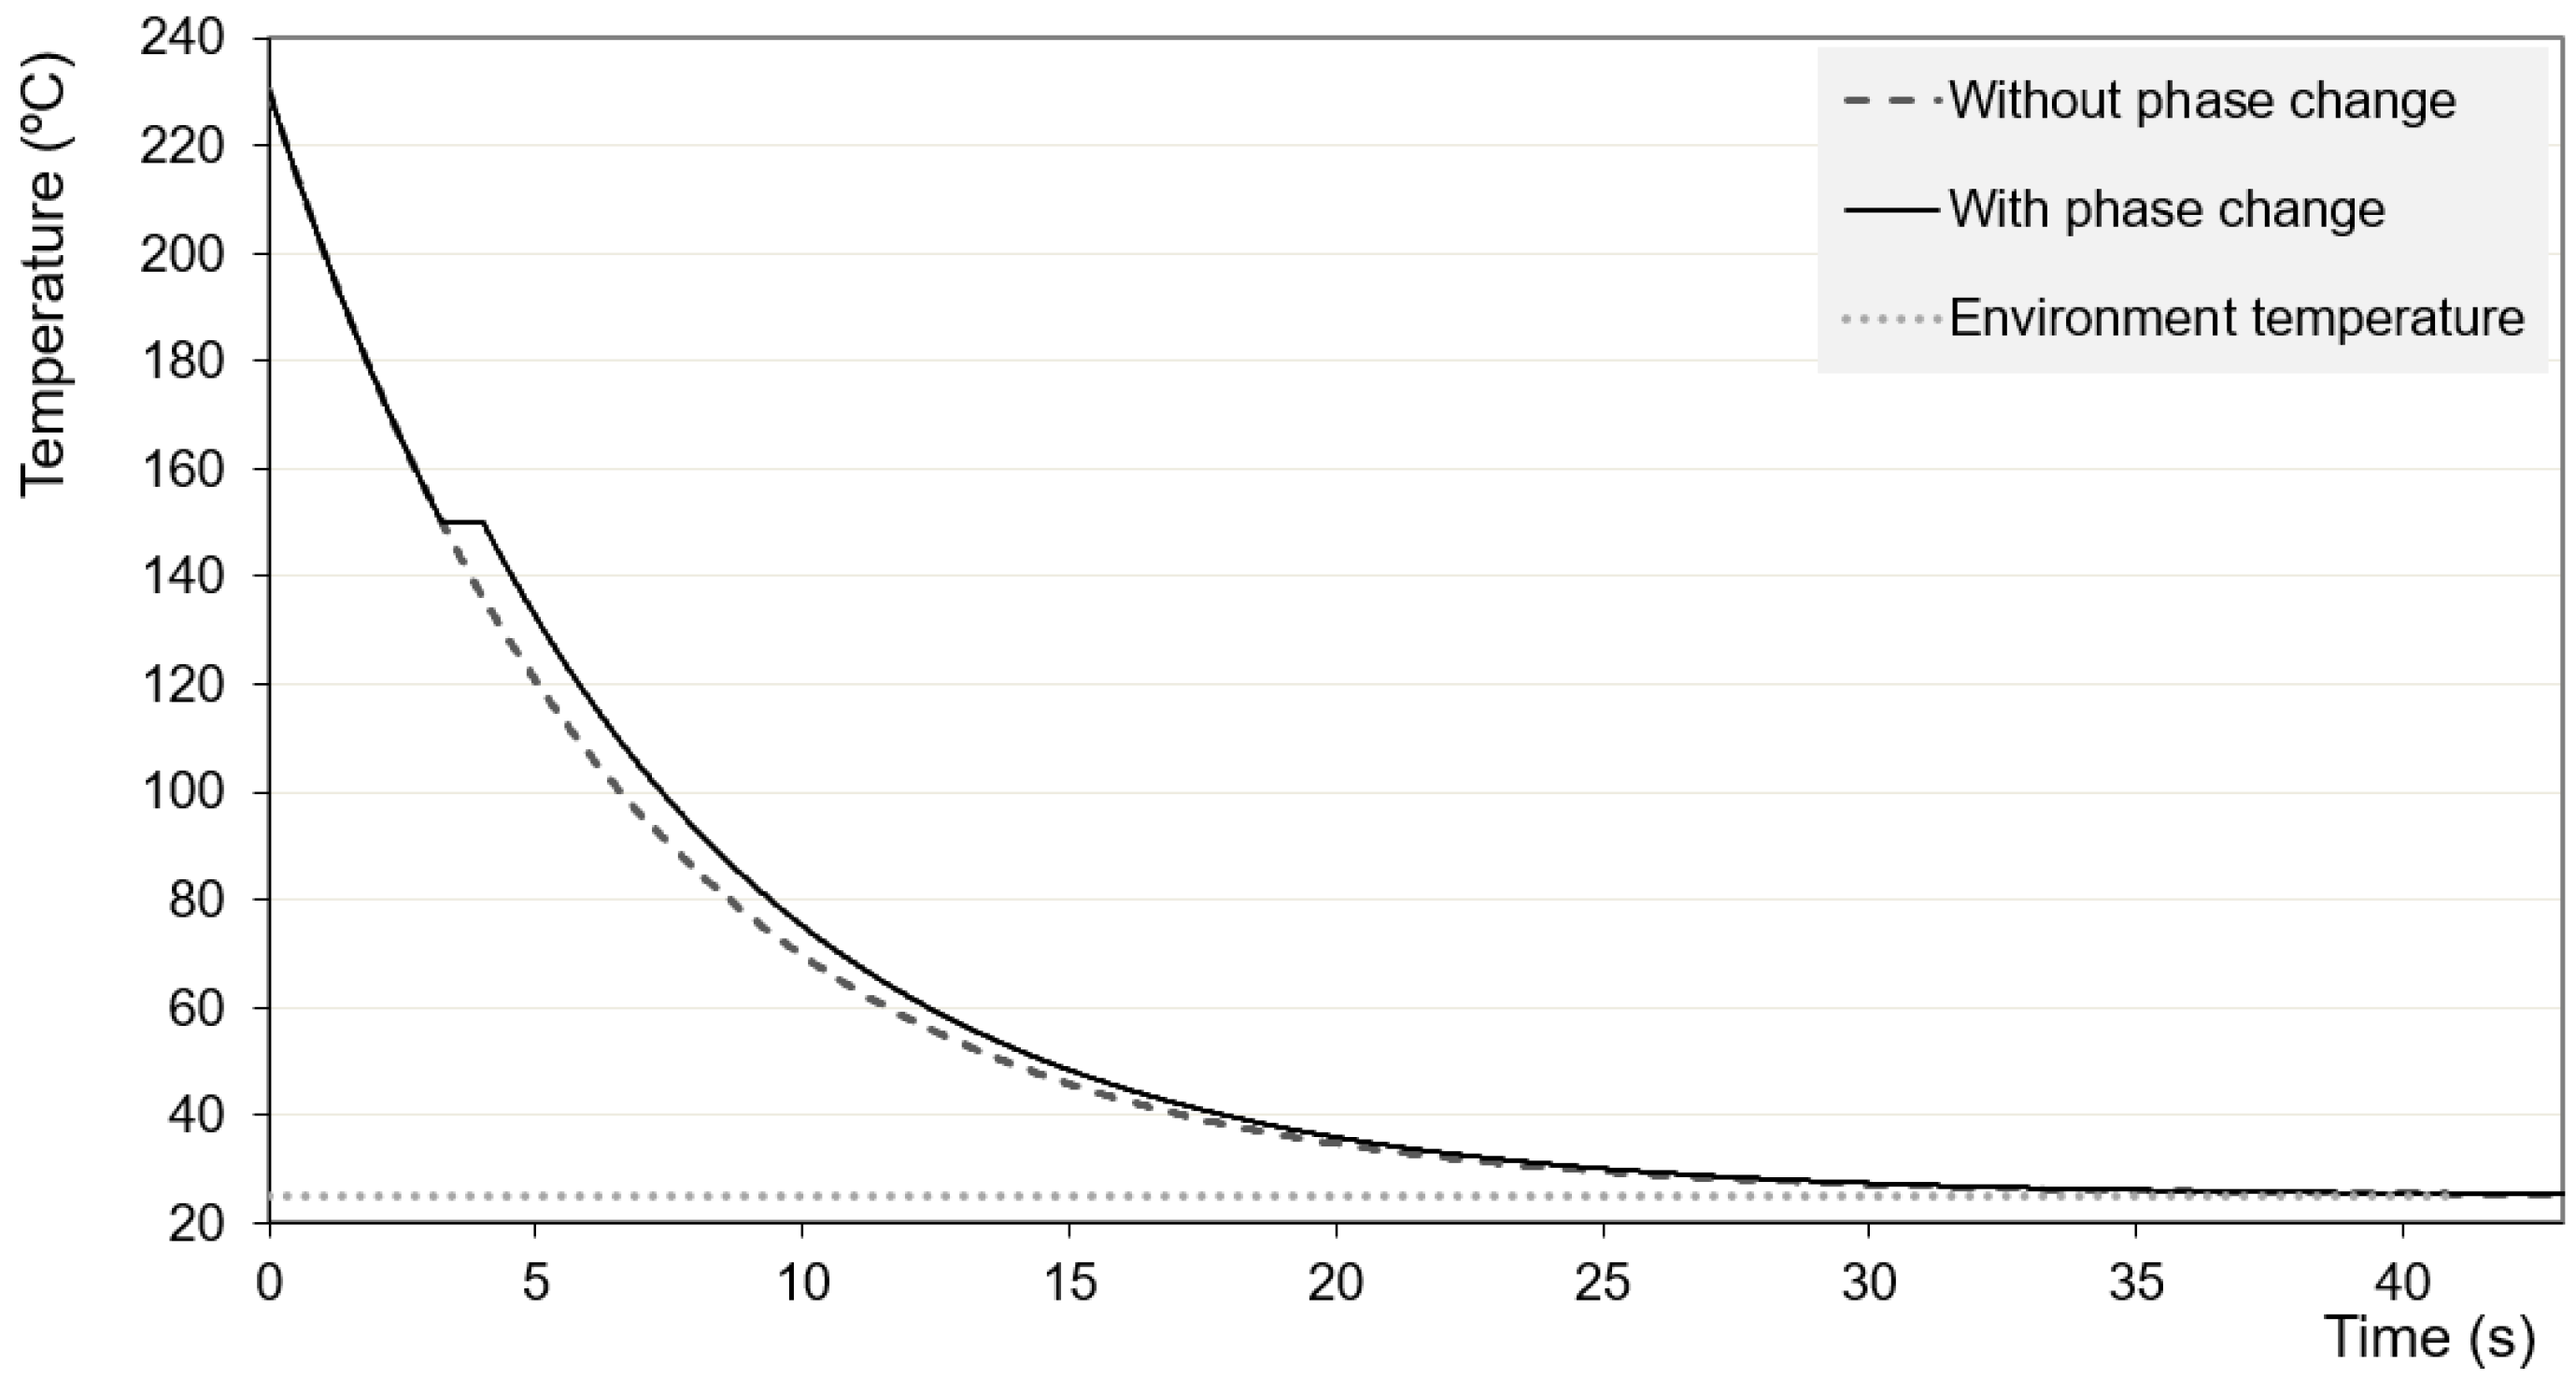
Figure 7.
Evolution of temperature with time for filament no. 2 (PLA) with and without phase change (at x = 30 mm from the edge).
Figure 7.
Evolution of temperature with time for filament no. 2 (PLA) with and without phase change (at x = 30 mm from the edge).

Figure 8.
Evolution of temperature with time for filament no. 2 for ABS and PLA (at x = 30 mm from the edge).
Figure 8.
Evolution of temperature with time for filament no. 2 for ABS and PLA (at x = 30 mm from the edge).
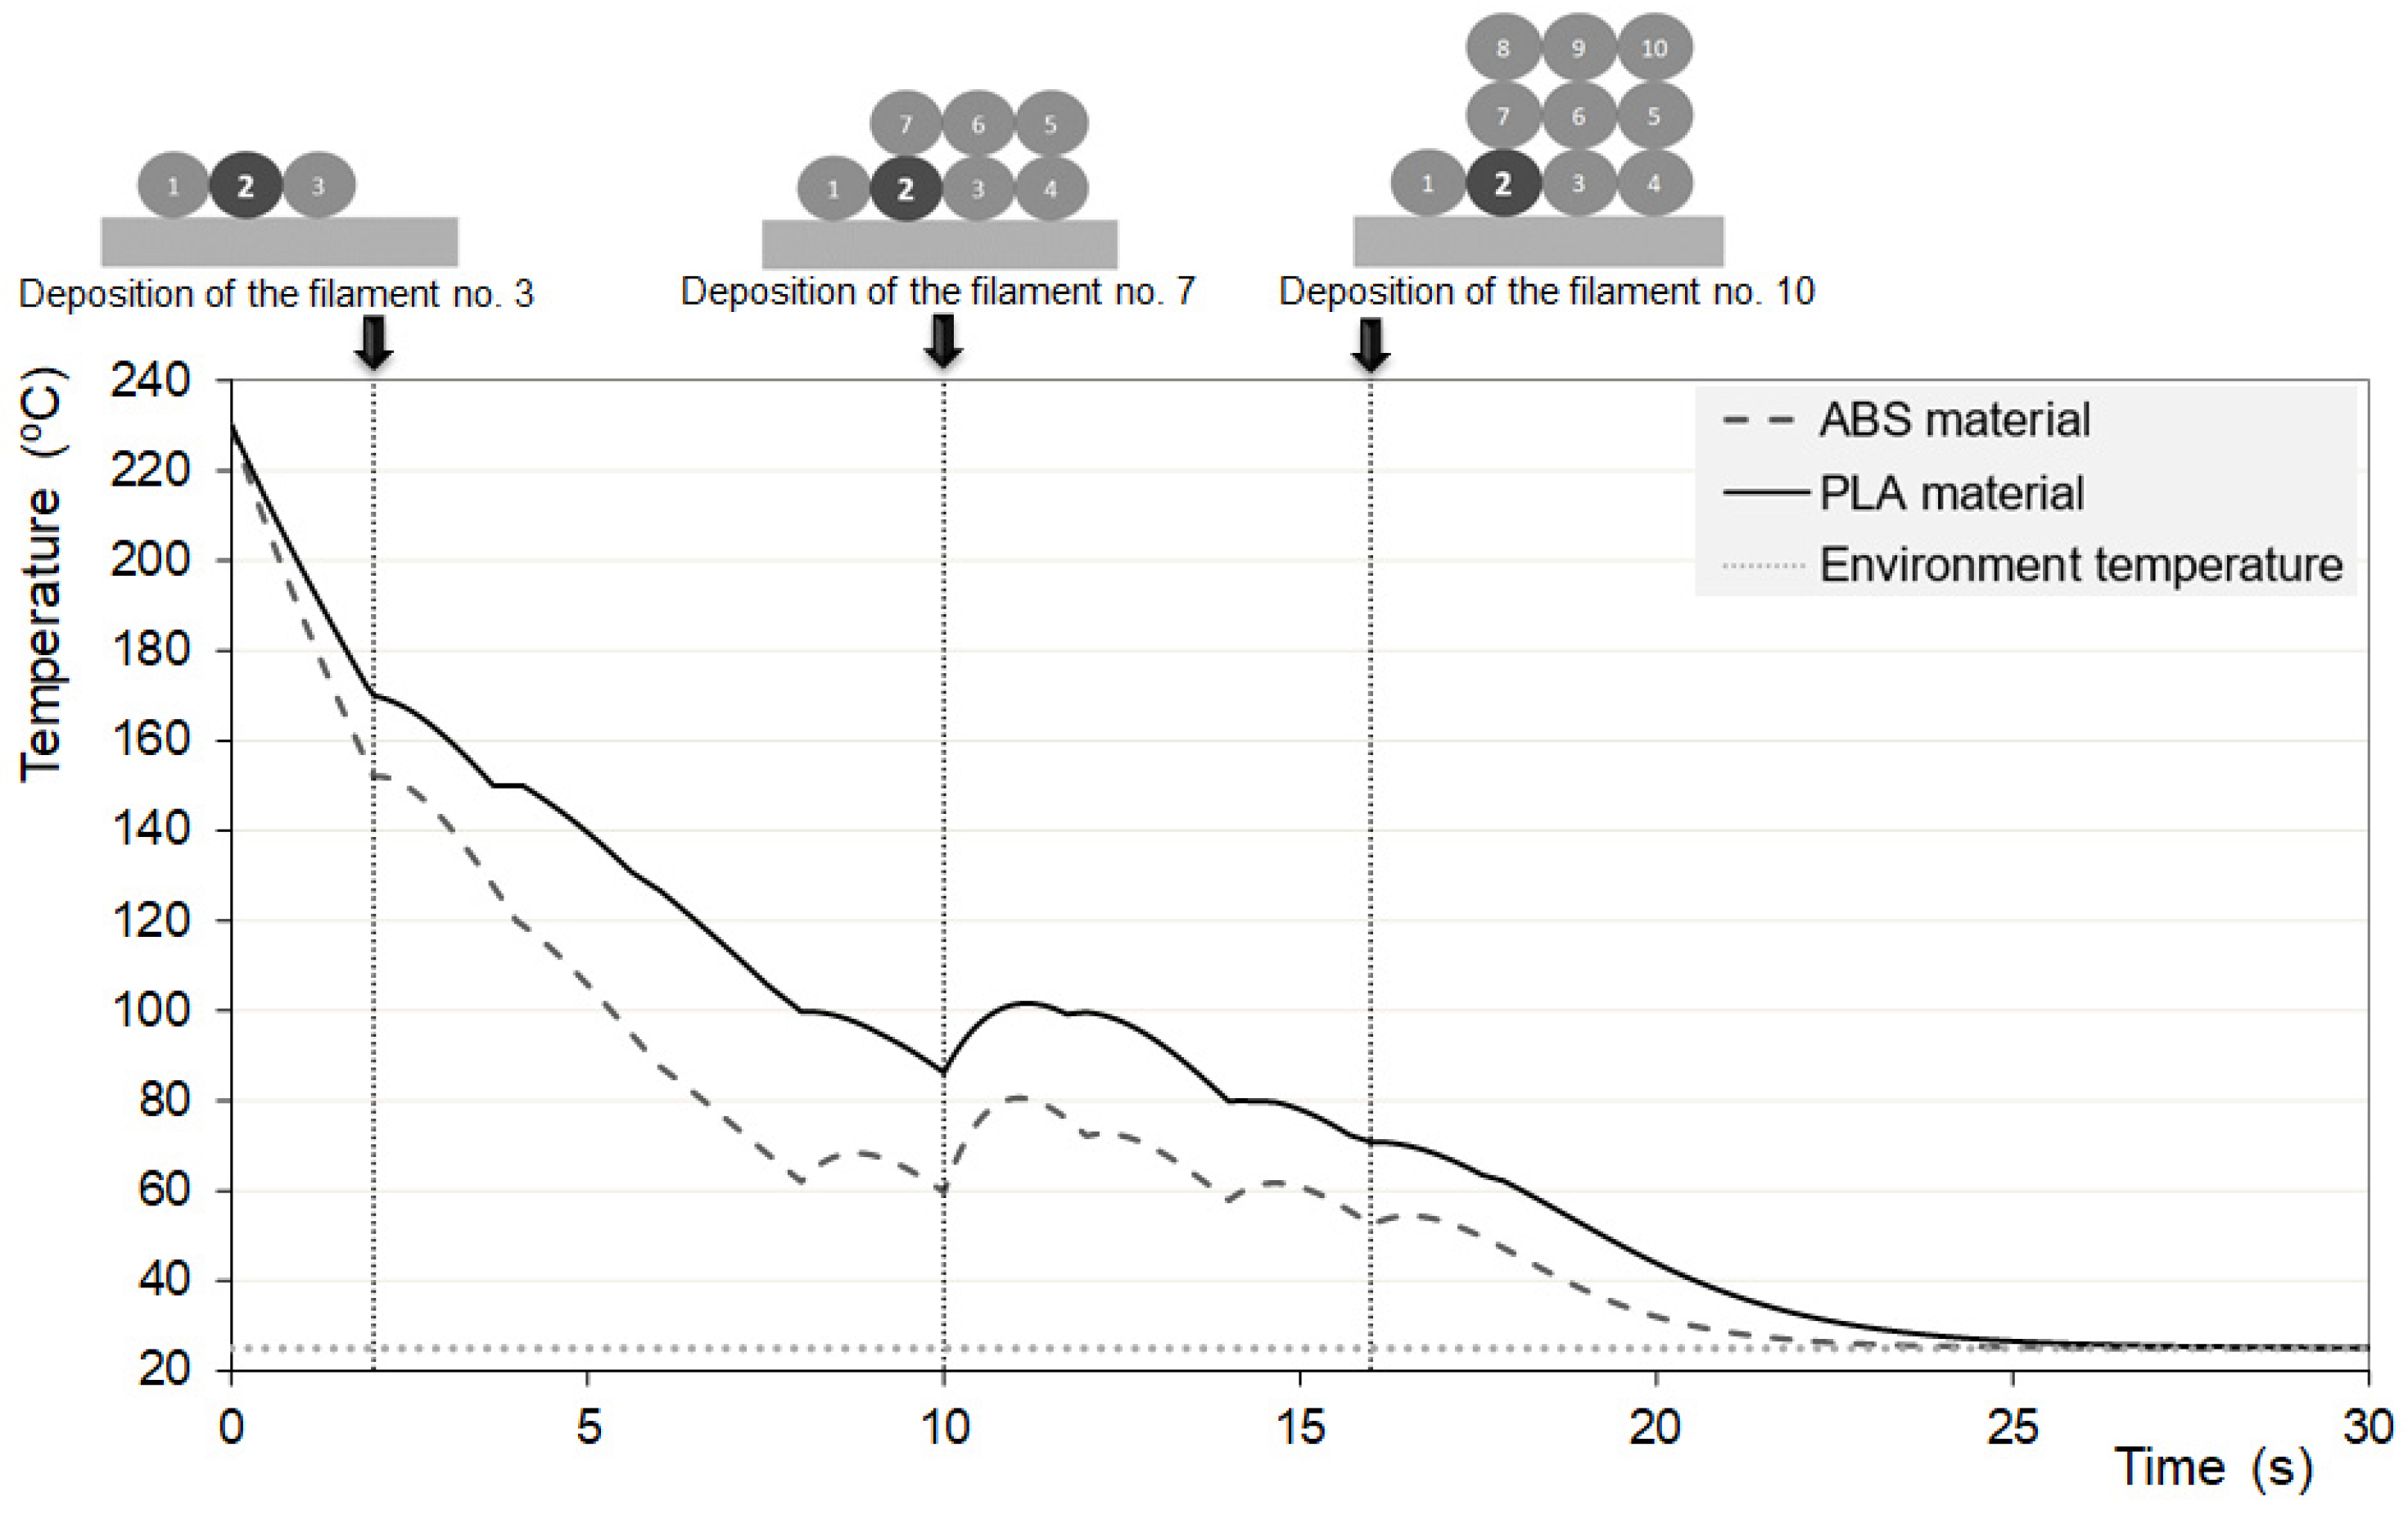
Figure 9.
Selected geometry, deposition sequence and build orientations.

Figure 10.
Temperature evolution during 3800 s of the cross-section at the middle of the central filament of the 20th layer (counting from the support) for the six build orientations, for ABS and PLA. The curves follow the evolution with time of temperature from the beginning of the deposition of the filament. The actual instants where the deposition began for each build orientation are identified in the respective labels.

Figure 11.
Temperature evolution of the cross-section at the middle of the central filament of the 20th layer (counting from the support) for the six build orientations (P1 to P6), for ABS and PLA. The curves follow the evolution with time of temperature from the beginning of the deposition of the part. The insets are magnifications of the progress of temperature during short time periods. A, B and C identify the peaks used to prepare Table 4.


Table 1.
Material properties.
| Property | ABS | PLA |
|---|---|---|
| Density (kg/m3) | 1050 | 1300 |
| Thermal conductivity (W/m·) | 0.2 | 0.1 |
| Specific heat (J/kg·) | 2020 | 2100 |
| Latent heat of fusion (J/kg) | --- | 30 000 |
| Solidification temperature () | --- | 150 |
Table 2.
Process and computational parameters.
| Property | Value |
|---|---|
| Process parameters | |
| Extrusion temperature TL () | 230 |
| Environment temperature TE () | 25 |
| Deposition velocity (m/s) | 0.03 |
| Convective heat transfer coefficient hconv (W/m2 )—natural convection | 30 |
| Thermal contact conductance between adjacent filaments hi (W/m2) | 200 |
| Thermal contact conductance between filaments and support hi (W/m2) | 10 |
| Fraction of contact area relative to filament area | 0.2 |
| Filament length (mm) | 60 |
| Filament cross-section geometry | circle |
| Filament cross-section diameter (mm) | 0.25 |
| Deposition sequence | Unidirectional and aligned |
| Computational parameters | |
| Time increment (s) | 0.01 |
| Temperature convergence error () | 0.001 |
Table 3.
Number of filaments and contact area with the support for each build orientation.
| Build Orientation | Number of Filaments | Contact Area with the Support (mm2) |
|---|---|---|
| P1 () | 28,800 | 2700 |
| P2 () | 28,800 | 5400 |
| P3 () | 43,200 | 5400 |
| P4 () | 43,200 | 1800 |
| P5 () | 86,400 | 1800 |
| P6 () | 86,400 | 2700 |
Table 4.
The effect of the type of material (ABS vs. PLA) on the temperature of the cross-section at the middle of the central filament of the 20th layer (counting from the support) for six build orientations, P1 to P6 (maximum temperature difference and temperatures of peaks A, B and C in Figure 11).
| Build Orientation | Maximum Temperature Difference between ABS and PLA (°C) | Maximum Temperature of Peaks A (°C) | Maximum Temperature of Peaks B (°C) | Maximum Temperature of Peaks C (°C) |
|---|---|---|---|---|
| P1 | 40.4 | ABS: 56.2 PLA: 64.8 | ABS: 40.7 PLA: 45.2 | ABS: 33.8 PLA: 36.4 |
| P2 | 39.4 | ABS: 56.1 PLA: 64.9 | ABS: 40.6 PLA: 45.2 | ABS: 33.7 PLA: 36.4 |
| P3 | 41.6 | ABS: 60.3 PLA: 72.6 | ABS: 43.6 PLA: 51.0 | ABS: 35.9 PLA: 39.1 |
| P4 | 41.2 | ABS: 61.0 PLA: 70.2 | ABS: 43.8 PLA: 49.8 | ABS: 35.9 PLA: 39.4 |
| P5 | 40.4 | ABS: 73.6 PLA: 83.6 | ABS: 52.6 PLA: 59.7 | ABS: 41.4 PLA: 46.1 |
| P6 | 40.4 | ABS: 73.6 PLA: 83.5 | ABS: 52.6 PLA: 59.7 | ABS: 41.4 PLA: 46.1 |
Publisher’s Note: MDPI stays neutral with regard to jurisdictional claims in published maps and institutional affiliations. |
© 2021 by the authors. Licensee MDPI, Basel, Switzerland. This article is an open access article distributed under the terms and conditions of the Creative Commons Attribution (CC BY) license (http://creativecommons.org/licenses/by/4.0/).
Share and Cite
MDPI and ACS Style
Costa, S.F.; Duarte, F.M.; Covas, J.A. The Effect of a Phase Change on the Temperature Evolution during the Deposition Stage in Fused Filament Fabrication. Computers 2021, 10, 19. https://0-doi-org.brum.beds.ac.uk/10.3390/computers10020019
AMA Style
Costa SF, Duarte FM, Covas JA. The Effect of a Phase Change on the Temperature Evolution during the Deposition Stage in Fused Filament Fabrication. Computers. 2021; 10(2):19. https://0-doi-org.brum.beds.ac.uk/10.3390/computers10020019
Chicago/Turabian StyleCosta, Sidonie F., Fernando M. Duarte, and José A. Covas. 2021. "The Effect of a Phase Change on the Temperature Evolution during the Deposition Stage in Fused Filament Fabrication" Computers 10, no. 2: 19. https://0-doi-org.brum.beds.ac.uk/10.3390/computers10020019
Note that from the first issue of 2016, this journal uses article numbers instead of page numbers. See further details here.