
Symptom Tracking and Experimentation Platform for Covid-19 or Similar Infections


1
Department of Electrical and Computer Engineering, University of Peloponnese, 26334 Patra, Greece
2
Department of Digital Systems, University of Thessaly, 41500 Larisa, Greece
*
Author to whom correspondence should be addressed.
Computers 2021, 10(2), 22; https://0-doi-org.brum.beds.ac.uk/10.3390/computers10020022
Submission received: 8 January 2021
/
Revised: 29 January 2021
/
Accepted: 3 February 2021
/
Published: 7 February 2021
(This article belongs to the Special Issue Real-Time Systems in Emerging IoT-Embedded Applications)
Abstract
:Remote symptom tracking is critical for the prevention of Covid-19 spread. The qualified medical staff working in the call centers of primary health care units have to take critical decisions often based on vague information about the patient condition. The congestion and the medical protocols that are constantly changing often lead to incorrect decisions. The proposed platform allows the remote assessment of symptoms and can be useful for patients, health institutes and researchers. It consists of mobile desktop applications and medical sensors connected to cloud infrastructure. The unique features offered by the proposed solution are: (a) dynamic adaptation of Medical Protocols (MP) is supported (for the definition of alert rules, sensor sampling strategy and questionnaire structure) covering different medical cases (pre- or post-hospitalization, vulnerable population, etc.), (b) anonymous medical data can be statistically processed in the context of the research about an infection such as Covid-19, (c) reliable diagnosis is supported since several factors are taken into consideration, (d) the platform can be used to drastically reduce the congestion in various healthcare units. For the demonstration of (b), new classification methods based on similarity metrics have been tested for cough sound classification with an accuracy in the order of 90%.
1. Introduction
During the Covid-19 pandemic, primary health care services and call centers have been criticized for their decisions about the need of a patient to be hospitalized or not. The medical staff working in these call centers have to remotely estimate the condition of the callers based on vague descriptions of their symptoms. Missing information about the patients, the congestion and the consistently changing medical protocols, combined with the subjective opinion of the medical practitioners, often leads to incorrect decisions. Sensitive population with weak immune system (cancer, kidney failure, heart diseases, etc.) is also necessary to be remotely monitored and the same holds for Covid-19 patients in their rehabilitation phase.
The diagnosis of Covid-19 or other similar infections that will appear in the near future (e.g., the Covid-19 variations that recently appeared in United Kingdom or South Africa) is a major challenge since reliable molecular tests have to be performed to a large fraction of the population. Covid-19 is caused by the Severe Acute Respiratory Syndrome Coronavirus 2 virus (SARS-CoV-2) [1] and is characterized by high infection and case-fatality rates [2]. There is a large number of asymptomatic carriers and a high infection rate even when there are no symptoms [3]. In [4], a number of molecular tests and immunoassays for Covid-19 management life cycle are presented. The life cycle of this virus consists of the preventive, preparedness, response and recovery phase. The main molecular test categories are the Nucleic Acid Amplification Test (e.g., Reverse Transcription—Quantitative Polymerase Chain Reaction (RT-qPCR)) [5], Immunoassays (such as immune colloidal gold strips) [6] and sequencing.
The molecular tests and immunoassays are currently applied to a small portion of the population, based on symptom assessment. The classification of the lesions appearing in pneumonia chest Coaxial Tomography (CT) has been recently proposed in [7,8]. Image processing applied to X-ray scans has also been examined in [9]. Lung ultrasound images are analyzed in [10] for the estimation of the infection progress. Several imaging techniques for the detection of Covid-19 are reviewed in [11]. Sound processing of either respiratory [12,13] or cough sounds can also be used for the early Covid-19 diagnosis. Speech modeling and signal-processing is applied in [14] for tracking the asymptomatic and symptomatic stages of Covid-19. The coordination of neuromotor in various speech subsystems that are involved in respiration, phonation and articulation are affected by Covid-19 infection.
In [15], ten major telemedicine applications are reviewed. These applications can minimize the required visits to the doctors providing a suitable treatment option. Robots can undertake human-like activities that could otherwise favor the spread of Covid-19 [16]. For example, they can deliver medicine, food and other essential items to patients who are under quarantine. Since mild respiratory symptoms appear in the early stage of Covid-19 infection it is important to continuously monitor the respiratory rate with a non-contact method. A device-free real-time respiratory rate monitoring system using wireless signals is presented in [13] and standard joint unscented Kalman filter is modified for real-time monitoring. A portable health screening device for infections of the respiratory system is presented in [12].
Several Machine Learning (ML) techniques have been employed [10] for the diagnosis of Covid-19 infection with high accuracy based on its symptoms [17]. The 4th medical evolution (Medical 4.0) concerns applications supported by Information Technology, microsystems, personalized therapy and Artificial Intelligence (AI). Ten Medical 4.0 applications are reviewed in [18]. Generative Adversarial Networks, Extreme Learning Machine and Long/Short Term Memory (LSTM) deep learning methods have been studied in [19] while user-friendly platforms are offered for physicians and researchers. In [20], a research-focused decision support system is presented, for the management of patients in the intensive care. Internet of Things (IoT) devices are also employed while the physiologic data are exploited by ML models that have been developed in [20].
The major weapons for the infection spread prevention, are social distancing and tracing [21]. Several approaches have been proposed that exploit smart phone facilities and social networks. The control of information publishing strategies based on information mined from social media is presented in [22]. A detailed model of the topology of the contact network is sufficient in [23] to capture the salient dynamical characteristics of Covid-19 spread and take appropriate decisions. The user location and contacts can be traced through a smart phone Global Positioning System (GPS), cellular networks, Wi-Fi and Bluetooth. In [24], the impact of contact tracing precision on the spread of Covid-19 is studied. An epidemic model has been created in [24] for the evaluation of the relation between the efficiency and the number of people quarantined. In [25], the contact tracing applications in Australia and Singapore are described.
Additional medical parameters should be taken into consideration when the overall condition of a patient has to be assessed [18]. These additional medical data may have to be acquired from eHealth sensors. In [26] wearable devices suitable for monitoring the sensitive population and individuals in quarantine are presented. Unobtrusive sensing systems for disease detection and for monitoring patients with relatively mild symptoms as well as telemetry for the remote monitoring and diagnosis of Covid-19 are studied. Wireless Medical Sensor Network (WMSN) can benefit those who treat Covid-19 patients risking their lives. In [27] the deployment of WMSN is studied for the accomplishment of quality healthcare while reducing the potential threat from Covid-19. A wearable device based on Internet of Medical Things (IoMT) is presented in [28] for the protection from Covid-19 spread through contact tracing and social distancing.
The developed platform (called henceforth Coronario) aims at the reduction of the traffic in the call centers of primary healthcare units through remote symptom tracking. The functionality offered can be used to support the real-time screening of vulnerable population (patients with weak immune system, heart diseases, cancer, transplanted, etc.). Moreover, it can be used to monitor the condition of the patients who have recovered from Covid-19 infection in real-time. The research concerning the nature of Covid-19 requires an abundance of information about the pre- and post- hospitalization phase. An eHealth infrastructure that is, a number medical sensors on the side of the patient is employed to support a more reliable diagnosis based on the overall patient condition and his environment [29]. The anonymous medical data that are used in the Coronario platform can also be exploited in the context of research on Covid-19.
The Coronario platform consists of a user mobile application (UserApp) and a number of medical IoT sensors that are connected to cloud services preferably through a sensor controller for higher security and efficiency. The information processed by the UserApp includes the description of the symptoms through questionnaires, the location of the user and the results of audio processing for the classification of cough and respiratory patterns. Cloud connection allows data privacy with user authentication, access permissions, encryption and other services. The sensor data (e.g., blood pressure, body temperature, etc.) are uploaded there and can be accessed by the supervisor doctor or authorized researchers. The diagnosis results are certified by authorized medical staff that access the data through the Supervisor application. The diagnosis decisions can be potentially assisted by Artificial Intelligence (AI) tools such as pre-trained TensorFlow neural network models. Finally, the researchers can access anonymous medical data, given after the consent of the patients, through the Scientific application.
Compared to similar symptom tracking applications, Coronario offers a flexible MP file format that allows the definition or modification of alert rules, sensor sampling scenarios and questionnaire structures in real time. In this way, several medical cases of Covid-19 or other infections can be supported. Moreover, the facilities of the Coronario platform can be exploited by various practitioners: physicians, primary healthcare units, hemodialysis centers, oncological clinics and so forth. An extensible platform where different sound classification methods can be tested, is also offered for the support of the research on Covid-19. The integration of various components in the Coronario platform offers extra services, beyond symptom assessment and statistical processing. Specifically, user tracking, localization and social distancing, is also supported.
The rest of the paper is organized as follows: The detailed description of the Coronario architecture is presented in Section 2. The dynamic medical protocol configuration is examined in Section 3. In Section 4, cough sound classification is examined for the demonstration of research experiments using the Coronario platform. A discussion on extensions and the security features, follows in Section 5. Section 6 draws conclusions.
2. Architecture of the Coronario Platform
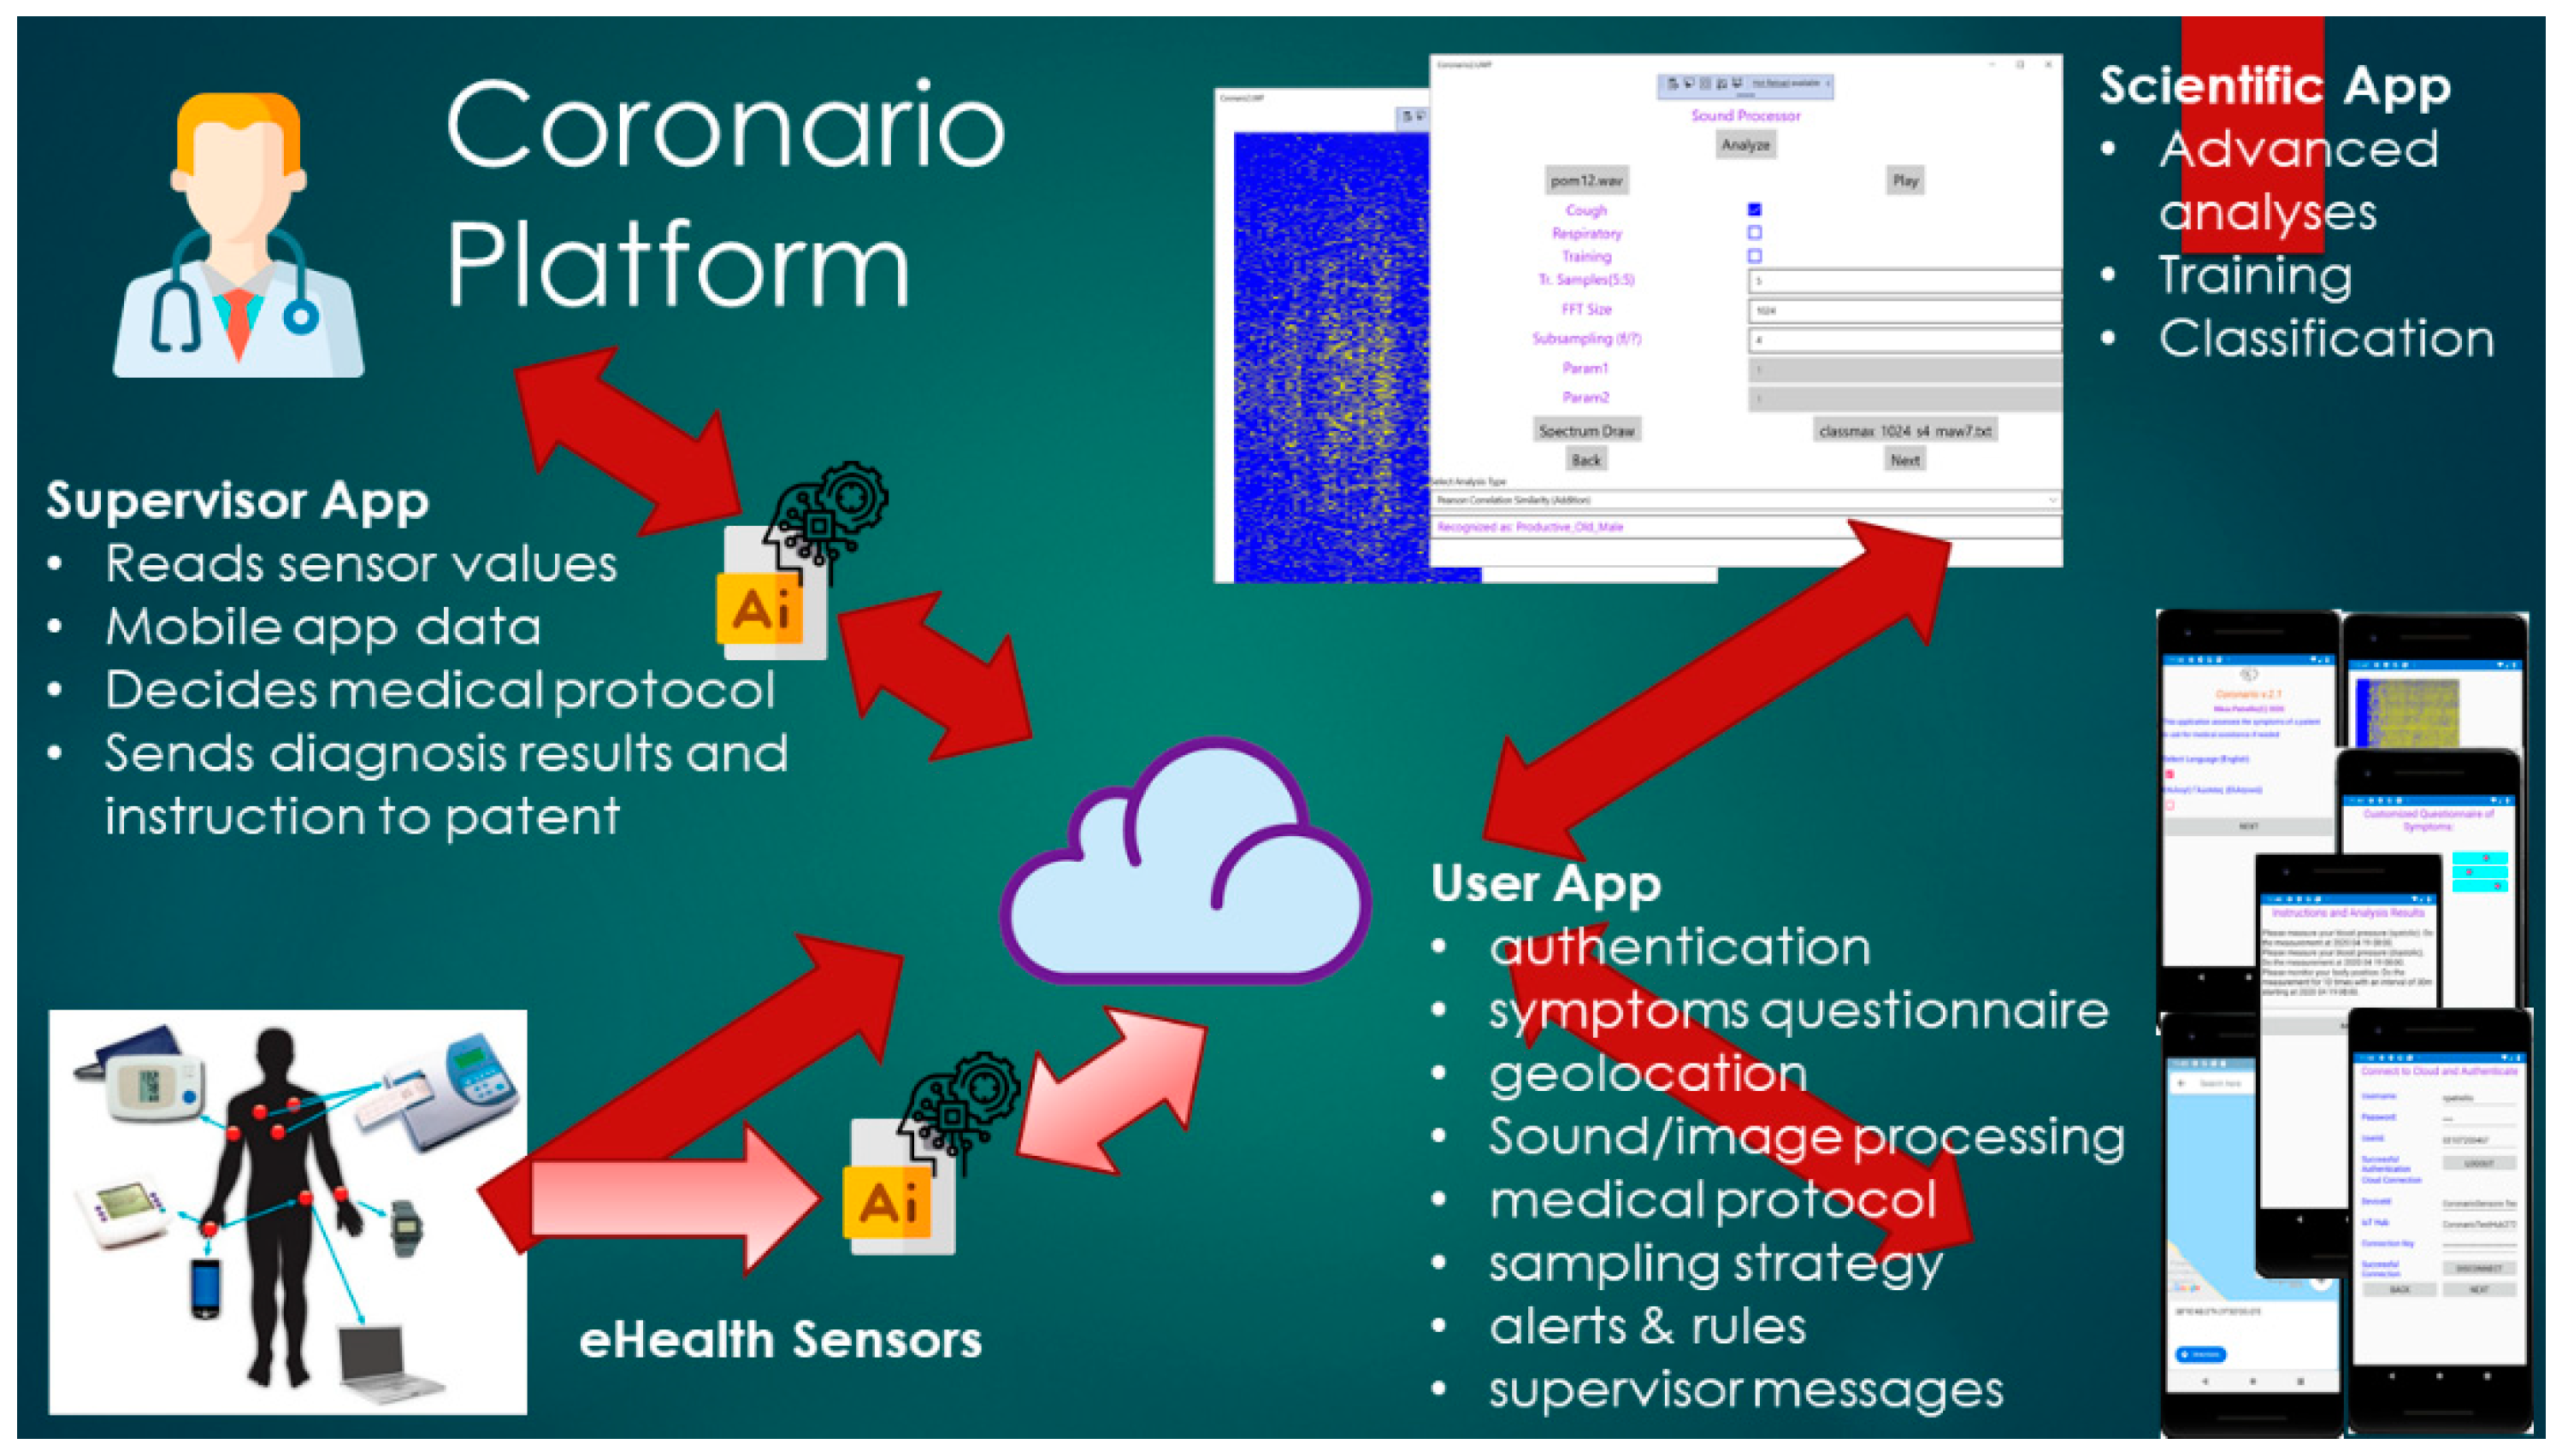
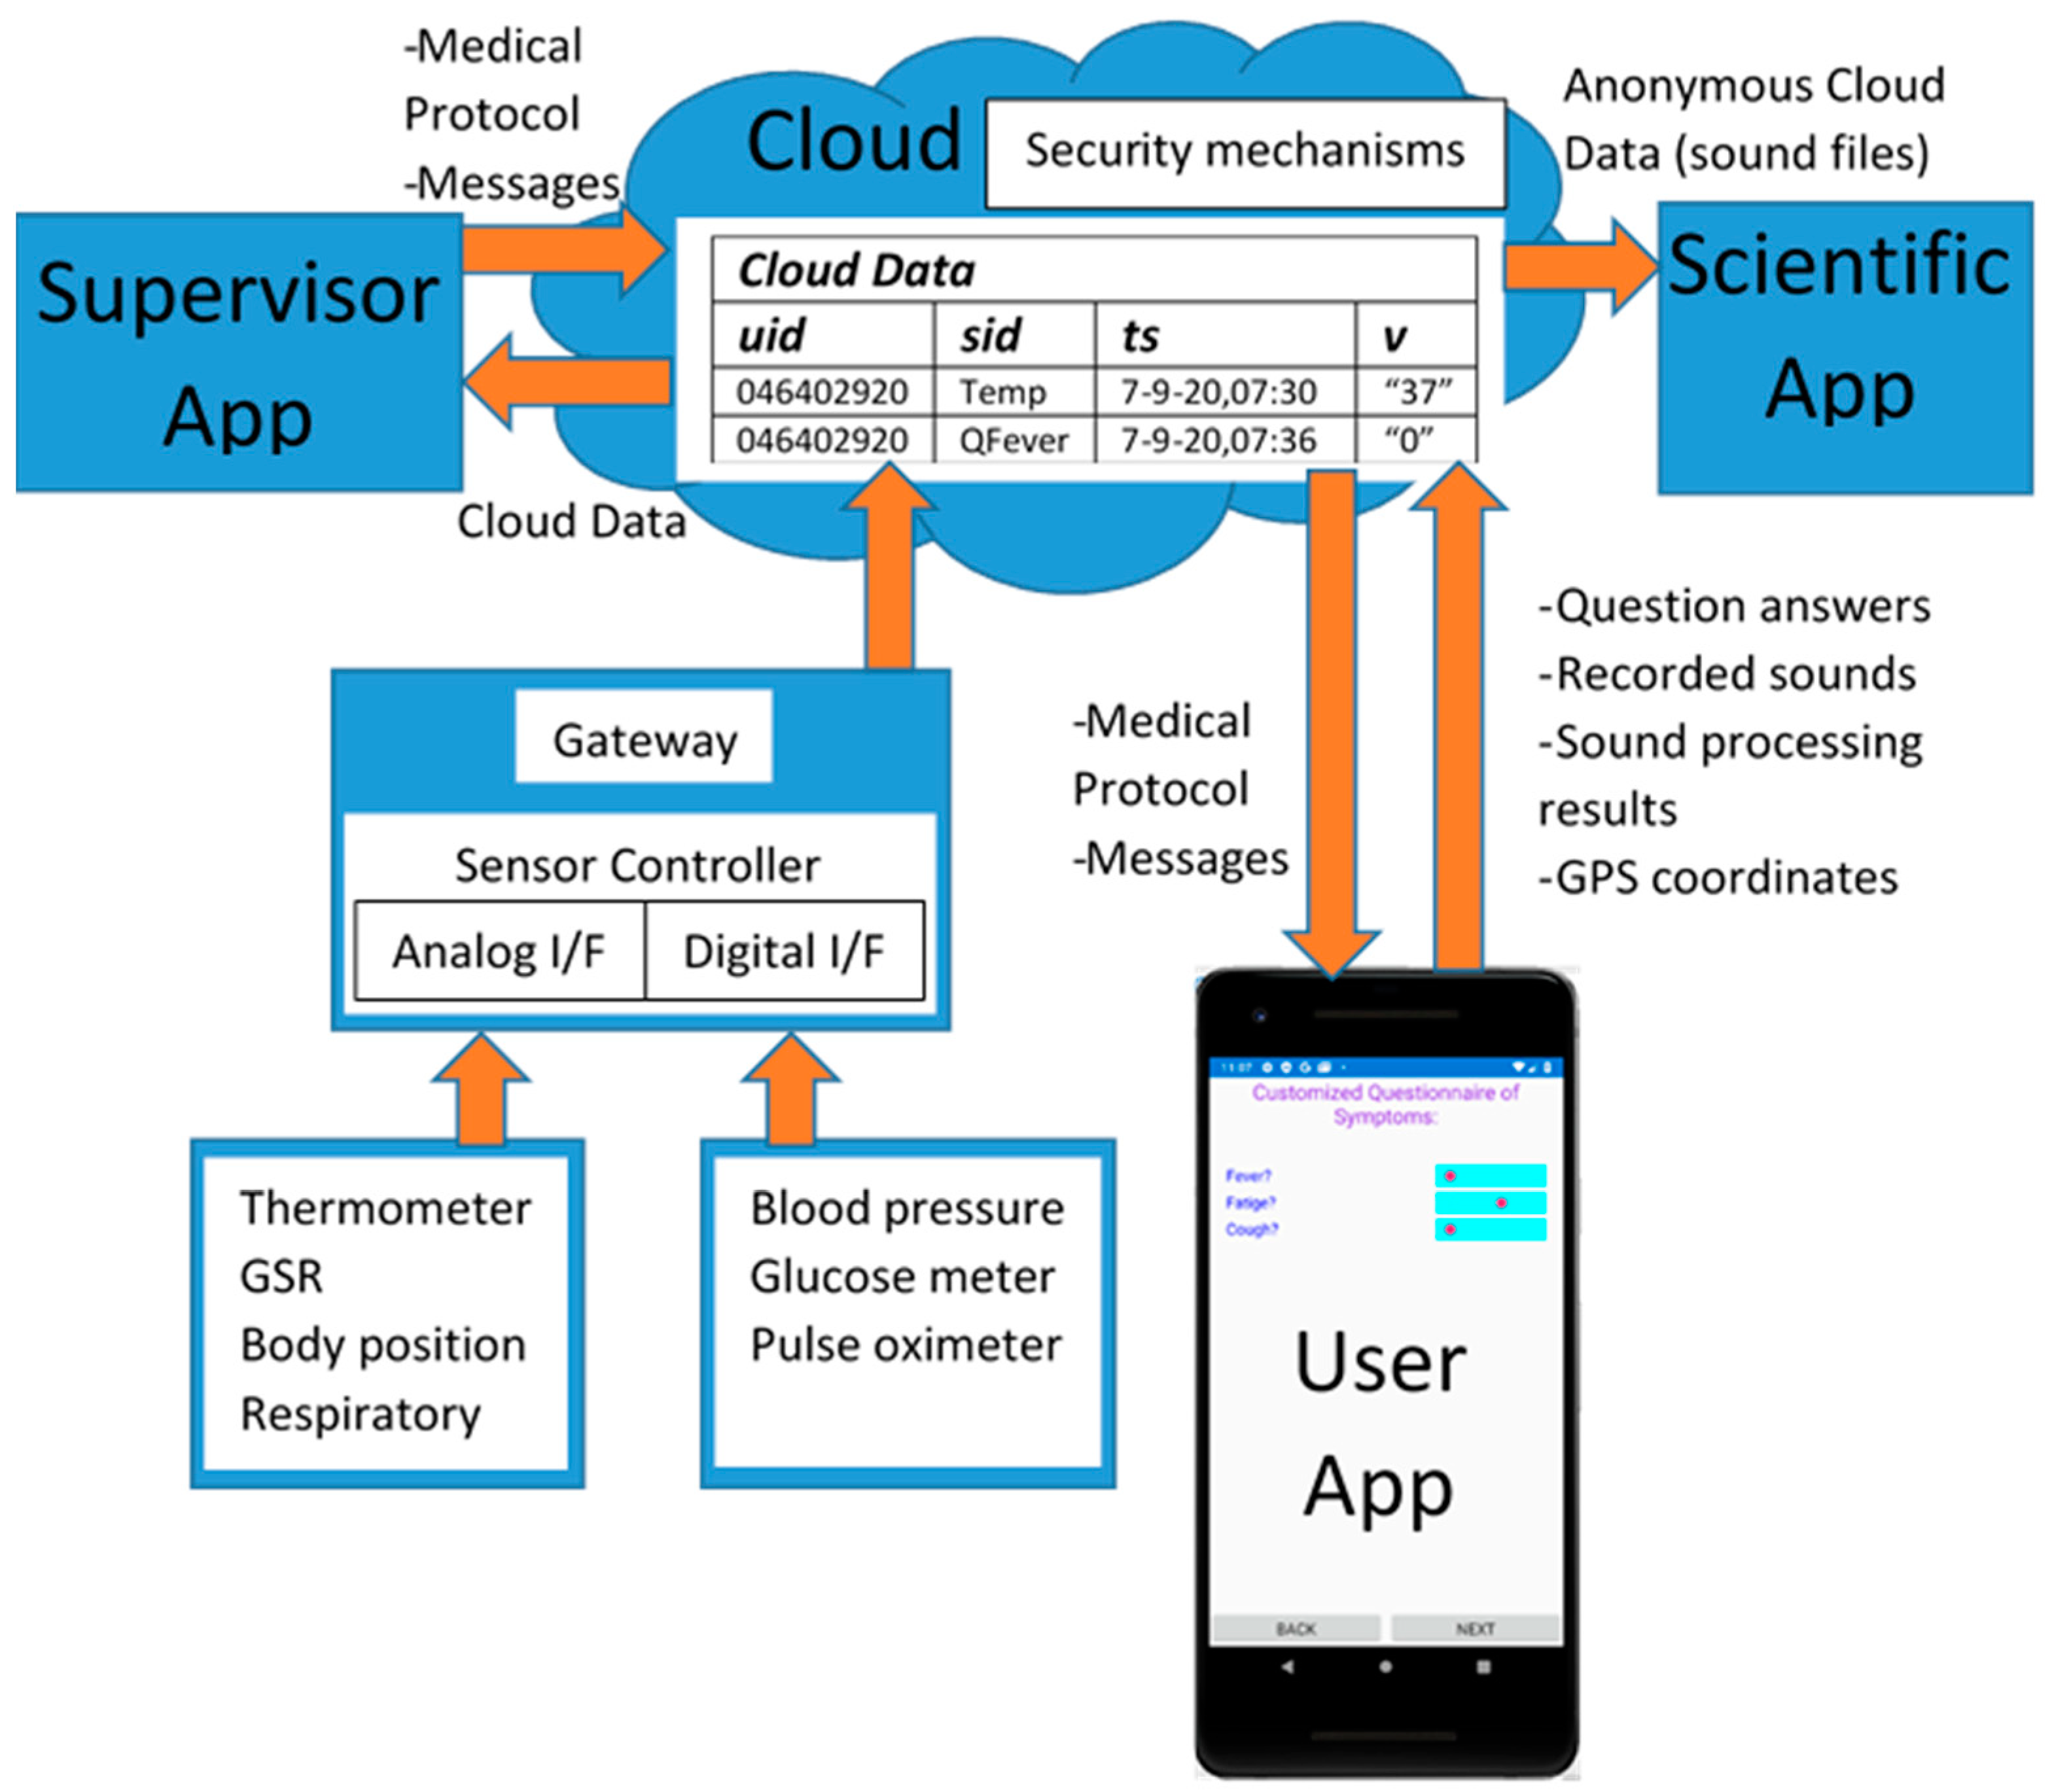
The general Coronario platform architecture appears in Figure 1. It consists of a mobile (UserApp) and two desktop applications (SupervisorApp and ScientificApp), a local eHealth sensor network and cloud storage. More details about the data structures exchanged between these modules are shown in Figure 2. The use and the features of each one of these modules are described in the following paragraphs.
2.1. UserApp
The UserApp is a mobile application used by the patient. It has been developed using Microsoft Visual Studio 2019/Xamarin thus, that it can be deployed as an Android or iOS application. An overview of the UserApp pages appears in Figure 3. The user selects the language of the interface from the initial page (Figure 3a), signs in (Figure 3b) and updates the MP file (Figure 3c). General information about the age, gender and habits of the user are asked (Figure 3d) and then, the default or customized by the MP symptoms’ questionnaire appears (Figure 3e,f). The answers can be either given as true/false using checkboxes or in an analog way through sliders (slider on the left: low symptom intensity, slider on the right: high intensity).
The current position of the user is detected through the Global Positioning System (GPS) of the cell phone in Figure 3g and displayed on the map (Figure 3h). In the current version, the country is detected through GPS coordinates and additional information such as the number of Covid-19 cases found so far in this country can also be retrieved by a web page that publishes such information. Narrower regions can also be used to trace the locations that the user has visited in case he found infected by Covid-19.
The user can select a sound file with recorded cough or respiratory sound as shown in Figure 3i,j. The sound file is then, played and sound processing is performed, potentially sending the analysis results and the extracted features to the cloud. In the last page shown in Figure 3k, several messages are displayed. For example, diagnosis results and alerts can appear. Guidelines are displayed showing to the user how and when to perform tests with the medical sensors.
2.2. SupervisorApp
The SupervisorApp is used by authorized medical practitioners. A supervisor doctor can access the patient data through this application and exchange messages. He can login to his account on the cloud, selects the interface language and accesses the sensor data in readable format. The supervisor can also select or create an appropriate MP file where the conditions that generate alerts and instructions to the user are defined. The sensor sampling scheme that has to be followed and guidelines about how the user will perform the medical tests with the available medical equipment, is also defined in the MP. Moreover, the specific questions that should be included in the customized questionnaire are determined in the MP file. The flexibility in determining these issues is owed to the employed MP file format described in Section 3.
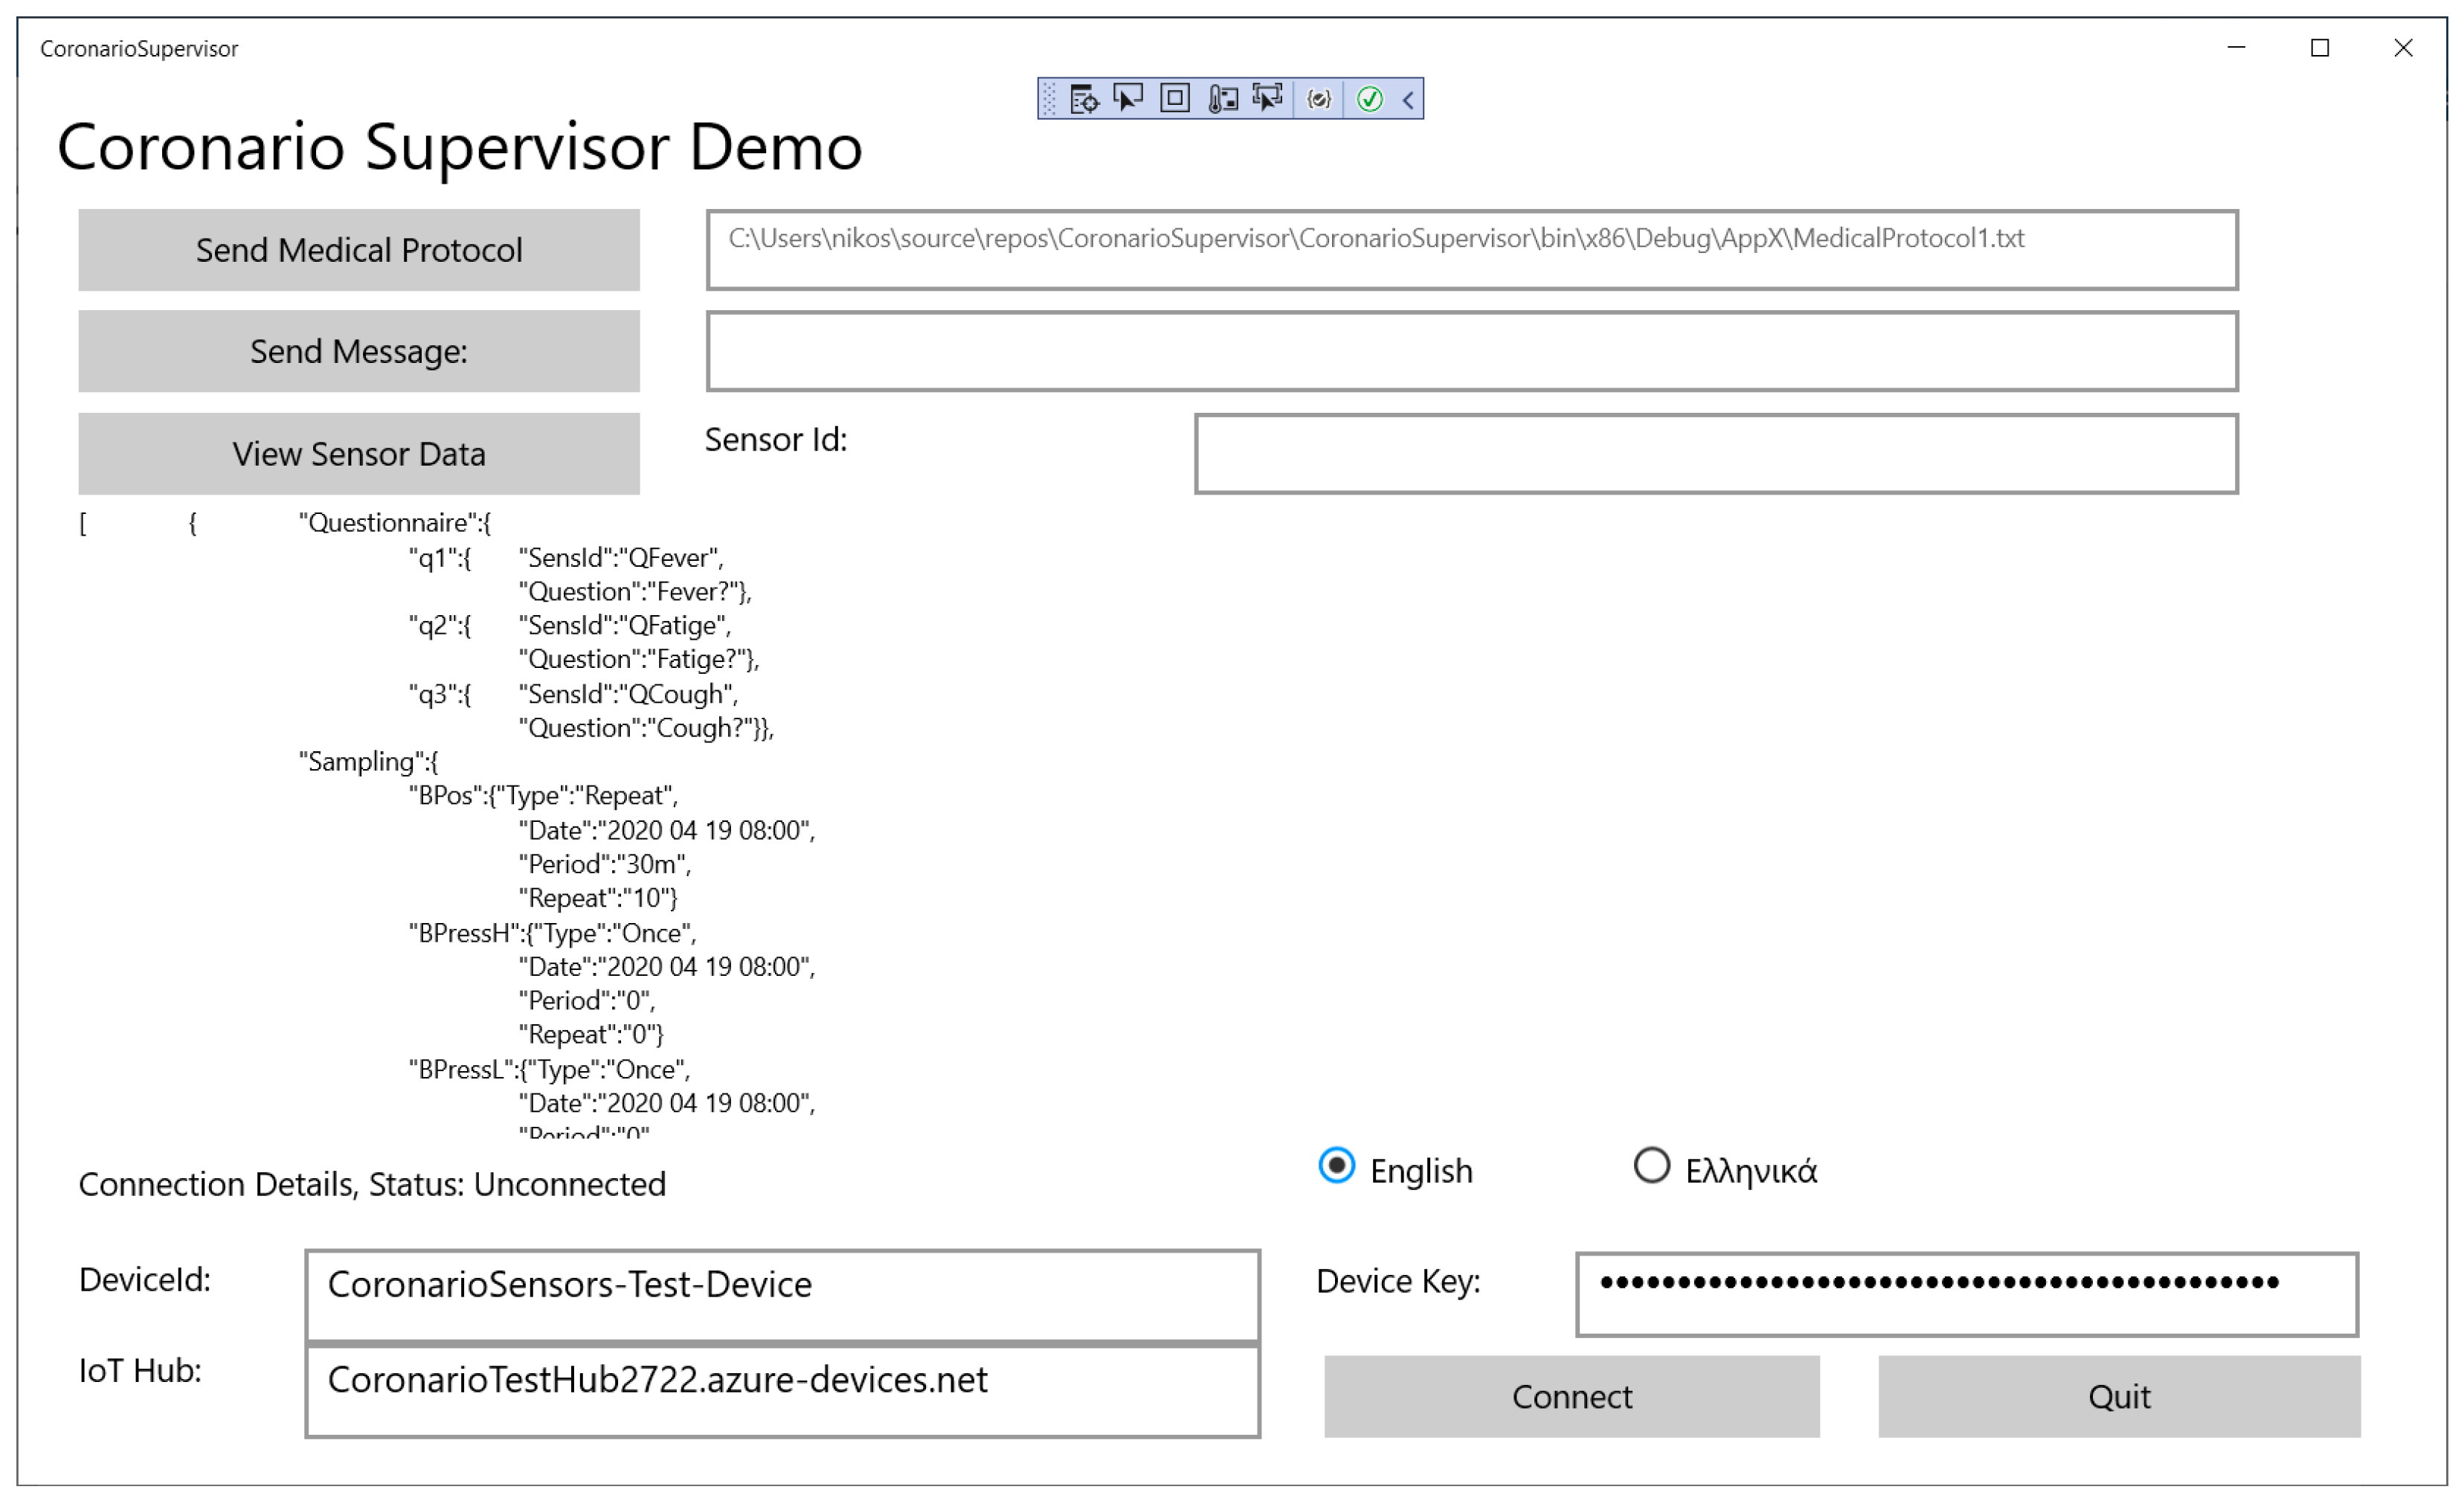
The SupervisorApp has been developed in Visual Studio 2019 as a Universal Windows Platform (UWP). Its main page is shown in Figure 4. The values of specific sensors are also viewed in this page.
2.3. IoT eHealth Sensor Infrastructure
The IoT eHealth sensor infrastructure is employed to monitor several parameters concerning the condition of the patient’s body and his environment. A non-expert should be able to handle the available sensors and a different combination of these sensors can be employed for each medical case. Ordinary sensors that can be operated by unexperienced patients are the following:
- body position to monitor how long the patient was standing or walking, lying on the bed or if he had a fall,
- blood pressure sensor,
- glucose meter,
- digital or analog thermometers for measuring the temperature of the body or the environment,
- Pulse-oximeter (SPO2),
- respiratory sensor to plot the patient breathing pattern,
- Galvanic Skin Response (GSR) sensor to monitor the sweat and consequently the stress,
- environmental temperature/humidity sensors.
Some of the sensors have analog interface as shown in Figure 2 (temperature, GSR, body position, respiratory) and should be connected to Analog/Digital Conversion readout circuits. Others offer a digital interface or even network connectivity (e.g., blood pressure, glucose meter, SPO2) and are capable of uploading their measurements directly to a cloud in real-time. A local controller (Gateway) may be used to connect both analog and digital sensors through appropriate readout circuits and upload data to the cloud through its wired or wireless network interface. The Gateway can also filter sensor values and upload only the necessary information required for the diagnosis. Filtering can include smoothing through moving average windows, estimation of missing sensor values through Kalman filters, data mining that searches for strong patterns through Principal Component Analysis (PCA). Only the important sensor values are uploaded to the cloud for higher data privacy and they can be isolated for example, through appropriate thresholds. The experiments conducted here, were based on the sensor infrastructure described in [29]. After user consent, some sensor data may be anonymously used by the ScientificApp in the context of research about Covid-19 or other similar infections. Although, more advanced tests such as ElectroCardioGrams (ECG) or ElectroMyoGrams (EMG) are also available, their operation is more complicated and the results they produce cannot be interpreted by a non-expert. Moreover, many of these sensors are not medically certified.
UserApp is also employed to guide the user about how and when to operate an external sensor. The sensor sampling strategy can be defined in the MP file and the UserApp converts it to comprehensive guidelines for the patient.
2.4. Cloud Services
There were several options for the implementation of the communication between the Coronario modules. Dedicated links for any pair of modules would not be appropriate since multiple links would have higher cost, would be more difficult to synchronize and would require an overall larger buffering scheme to support asynchronous communication. Multiple copies of the same data travelling through different links could also cause incoherence. Private datacenters could be used to store the generated data. They can offer advanced storage security and speed but have higher initial (capital) and administrative cost. Moreover, they usually support only the customized services developed by their owners. On the contrary, public clouds support advanced services for data sharing, analysis and visualization, they allow ubiquitous uniform access while their cost is defined on a pay-as-you-go basis. However, the customers of the cloud services do not always trust them as far as the security of their data is concerned.
The information is exchanged between the various modules of the Coronario platform through general cloud services such as the ones offered by Google Cloud, Microsoft Azure, Amazon Web Services (AWS). These platforms support advanced security features guaranteed by Service Level Agreements (SLAs), data analysis and notification methods as well as storage of data in raw (blobs) or structured format (e.g., tables, databases). Advanced healthcare services such as Application Program Interfaces (APIs) and integration are offered by Google Cloud Healthcare API. Microsoft Cloud for Healthcare brings various new services for monitoring patients combining Microsoft 365, Dynamics, Power Platform, Azure cloud and IoT tools. The common data model used in this case, allows for easy data sharing and analysis. For example, medical data can be visualized using Microsoft Power BI. Microsoft Azure cloud and IoT services have been used by the Coronario platform although only the storage facilities have been exploited in order to make the developed application more portable. Several other even simpler cloud platforms (Ubidots, ThingSpeak, etc.), could have been employed in the place of Microsoft Azure. The data stored in the cloud can be visualized (e.g., plotted) outside the cloud and more specifically in the Supervisor App.
The following information is stored in the cloud:
- Sensor values stored in (uid, sid, ts, v) format (see Figure 2). The uid and sid are the user and sensor identification number (not name), ts is the timestamp and v the sensor value represented as a string. This format is also followed for storing the information returned by the User App.
- MP files.
- Messages exchanged between the supervisor doctor and the patient.
MP files as well as messages can also be stored in the cloud as (uid, sid, ts, v) for uniform representation. A whole message or even an MP text file can be stored in the string field v. This field is intentionally defined as a string in order to incorporate a combination of one or more numerical values, text and additional meta-data needed besides uid, sid and ts.
2.5. ScientificApp
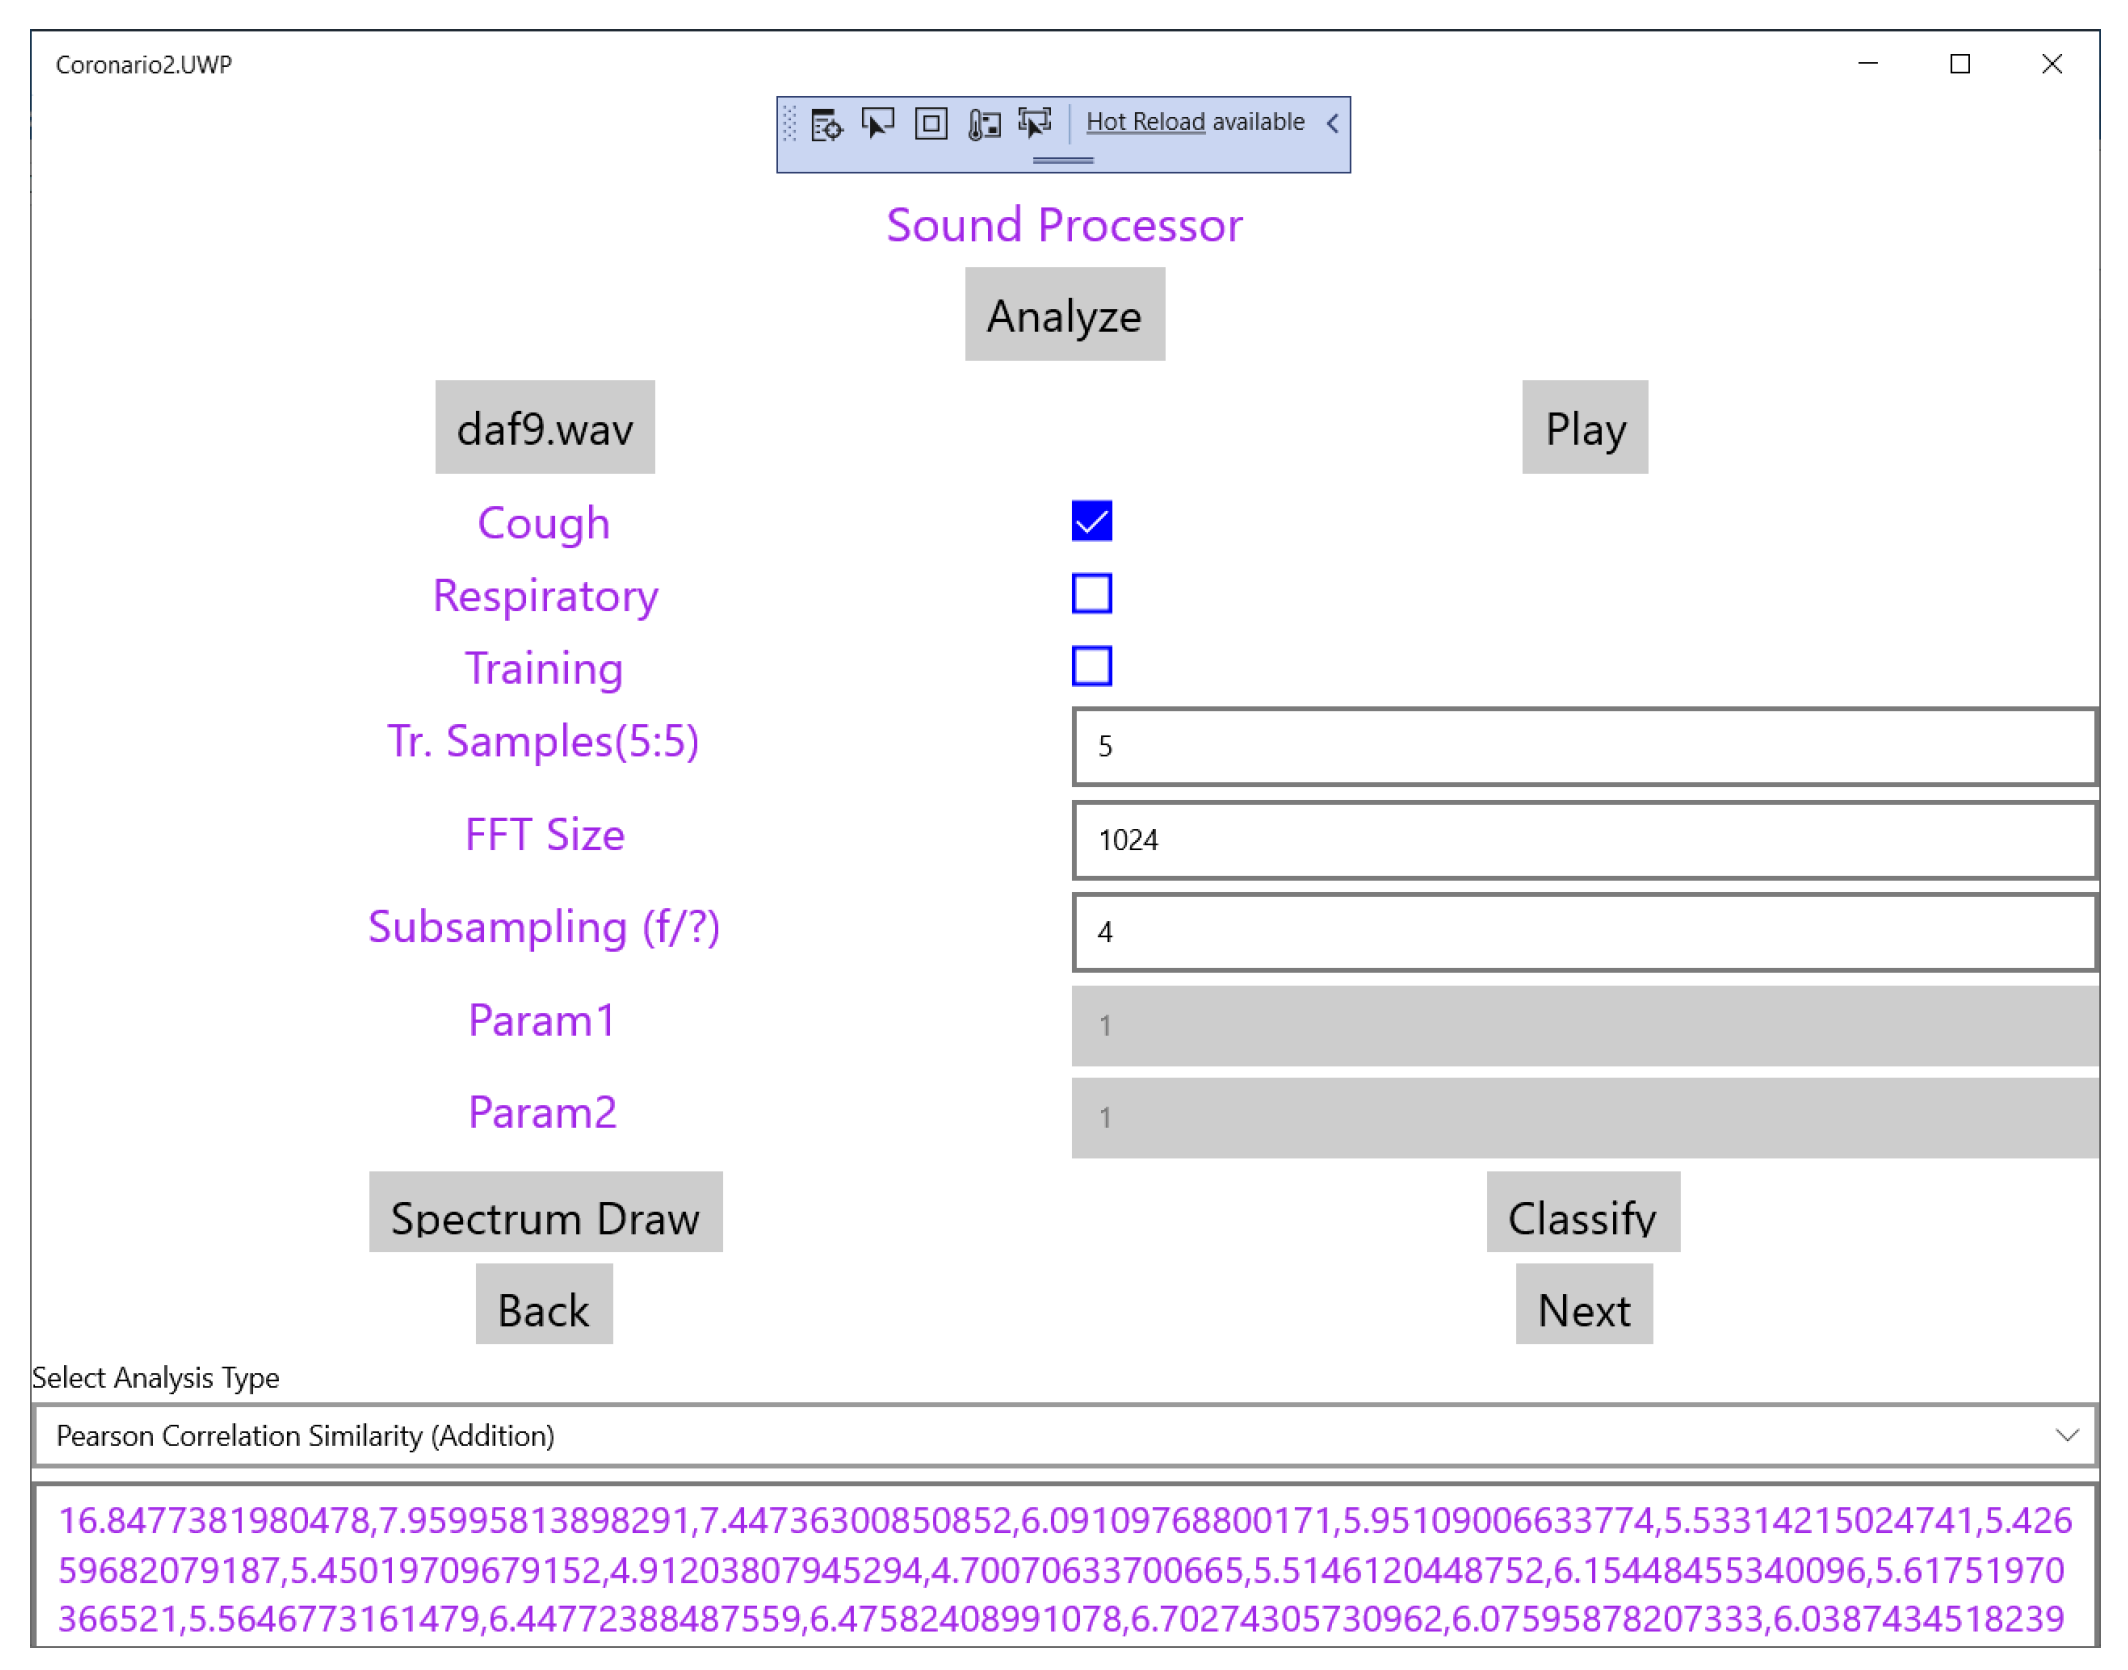
Scientific is a variation of UserApp compiled as a desktop application for a more ergonomic user interface. The details of this module are given in this paragraph in order to demonstrate how alternative classification methods and similarity metrics can be tested. Most of the pages are identical with UserApp except from the page that concerns the sound processor shown in Figure 5. In this page the researcher can select and play a sound file (e.g., daf9.wav as shown in Figure 5). The type of the recorded sound (cough or respiratory) as well as the “Training” mode is defined using checkboxes.
Based on the employed classification methods, the SupervisorApp can determine the reference features in the frequency domain of a cough sound class, using a number (e.g., 5–10) of training files. Then, the features extracted from any new sound file that is analyzed, are examined for similarity with the reference ones in order to classify it. Fast Fourier Transform (FFT) is applied to the input sound file in segments for example, of 1024 samples (defined in the page shown in Figure 5). Subsampling can also be applied in order to cover a longer time interval with a single FFT.
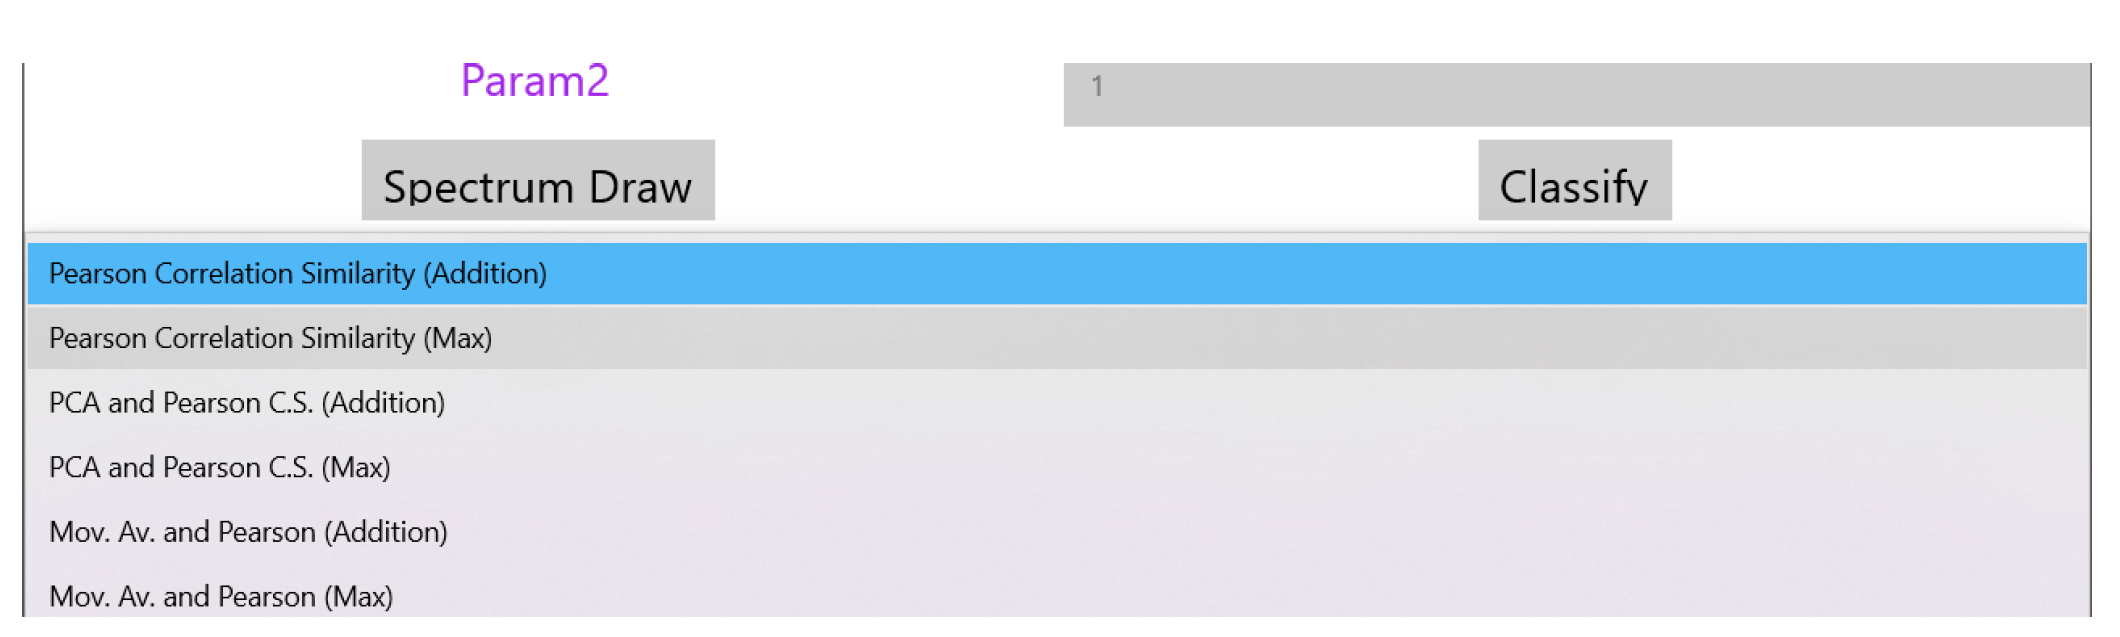
The drop down menu “Select Analysis Type” shown in the page of Figure 5 can be used to select the similarity method that will be used as shown in Figure 6. The supported similarity methods will be explained in detail in Section 4. Some similarity analysis methods may need extra parameters to be set. Reserved fields “Param1” and “Param2” can be used for this purpose. The magnitude of the FFT output values are the features used for similarity checking and are displayed at the bottom of Figure 4 after the analysis of the sound is completed. If training takes place these values appear after all the training sound files have been analyzed. These values can be exported for example, in a spreadsheet for statistical processing. Different FFT segments of the same sound file are either (a) averaged or (b) the maximum power that appears among different segments for the same frequency is used as the final bin value.
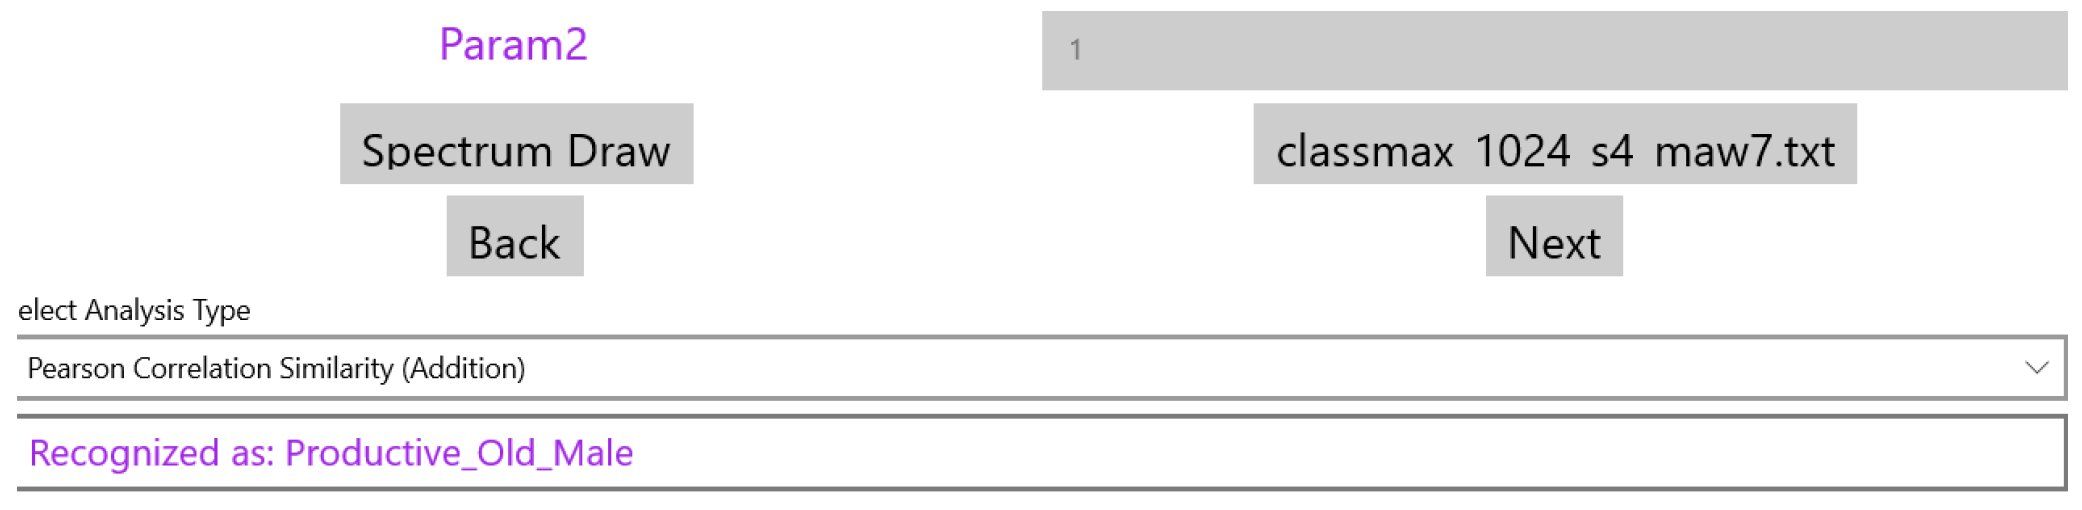
When a new sound file is analyzed, the FFT output is displayed at the bottom of the page shown in Figure 5 and the classification results can be generated after the user selects the file with the reference features of the supported classes. This set of classes can of course be extended if the system is trained with sounds from a new cough or respiratory category. In Figure 7, the name of the “Classify” button is changed to the specific reference features’ filename (classmax_1024_s4_maw7.txt). The field holding the selected analysis type in Figure 5 (Pearson Correlation Similarity), displays now the results of the classification (see Figure 7).
3. Dynamic MP File Configuration
The format of the MP file is studied in detail in this section, in order to demonstrate that any alert rule, sensor sampling scenario or questionnaire structure can be supported. JavaScript Object Notation (JSON) format is employed for the MP file. The configuration sections of an MP file are the following: (a) Questionnaire, (b) Sensor Sampling and (c) Alert Rules. A new MP file can be defined by the supervisor who uploads it to the cloud through the SupervisorApp (see Section 2.2). This file can be downloaded from the cloud by the UserApp. Several fields in the UserApp pages are adapted according to the information stored in the MP file. Updating an MP file is performed in real time without requiring a recompilation of the Coronario modules. Each MP section is described in the following paragraphs.
3.1. Questionnaire Configuration
The aim of the Questionnaire section is to select the appropriate questions about the patient symptoms that should appear in the corresponding form of the UserApp (see Section 2.1). These questions are selected from a pool that contains all the possible ones that are related to Covid-19 or other infections. Names such as q1, q2, q3 (see Figure 8) are indicating that the definition of a question follows. Each question is defined by the fields: SensId and Question. The value of SensId should be retrieved from the question pool so that it can be recognized by the UserApp. The text in the Question field can be customized (it is not predefined) and appears as a question in the UserApp. The default way of answering a question that is defined in the MP file is a percentage value determined by a slider control that appears in the UserApp questionnaire. In this way, the user can respond to a question by an analog indication between No (0%—slider to the left) and Yes (100%—slider to the right). For example, if a symptom appears with mild intensity, the patient may place the slider close to the middle (50%). If the answers to specific symptom questions should be a clear yes or no, checkboxes can be defined through the Questionnaire section of the MP file. For uniform handling of both the sliders and the checkboxes, when the checkbox is ticked a value of 100% is assumed while 0% is returned when the checkbox is not ticked. Figure 8 shows how the questions defined in the MP file appear in the UserApp.
The values set in the questionnaire are uploaded to the cloud in the same format as the sensor values of the eHealth Infrastructure (see Section 2.4): (uid, sid, ts, v). Moreover, additional information uploaded by the UserApp such as the geolocation is also stored in this format. The type of the parameter v is string, so that multiple for example, floating point values or even whole messages/text files can be incorporated in a single field. All of these values whether retrieved from the IoT eHealth sensor infrastructure or for example, from the UserApp questionnaire can be viewed by the supervisor who can search for specific sensor values based on the sensor identity or other criteria (e.g., specific dates or users).
3.2. Sensor Sampling Configuration
The second section in the MP file concerns the sampling strategy that should be followed concerning the IoT medical sensors. The format of each entry in this section demands the declaration of the sensor name (e.g., BPos for body position, MPressH for systolic blood pressure and MPressL for the diastolic one), followed by 4 fields: Type, Date, Period, Repeat. The Type field can have one of the following values: Once, Repeat, Interval. If Once is selected, then the medical test should be performed once at the specific Date. The Period and Repeat fields are ignored in this case (can be 0). If Type = “Repeat”, then the patient must perform a routine medical test starting at the date indicated by the corresponding field. A time interval (determined in the Period field) should intervene between successive tests. The Repeat field indicates a maximum number of tests that should be performed although these tests can be terminated earlier by a newer MP file. If Type = “Interval” then the interpretation of the other 3 fields is different. More specifically, a medical test should be performed in a Period starting from Date, Repeat times.
Although this MP file section has been defined for the sensors of the eHealth infrastructure, they can also be used for sensor-like information retrieved through the UserApp (questionnaire answers, geolocation coordinates or even sound/image analysis). The sampling scenarios determined in this MP file section should be converted in comprehensive guidelines for the patient in order to schedule his medical tests in the right time. Figure 9 shows how the UserApp converts the JSON format of the Sampling Section in natural language.
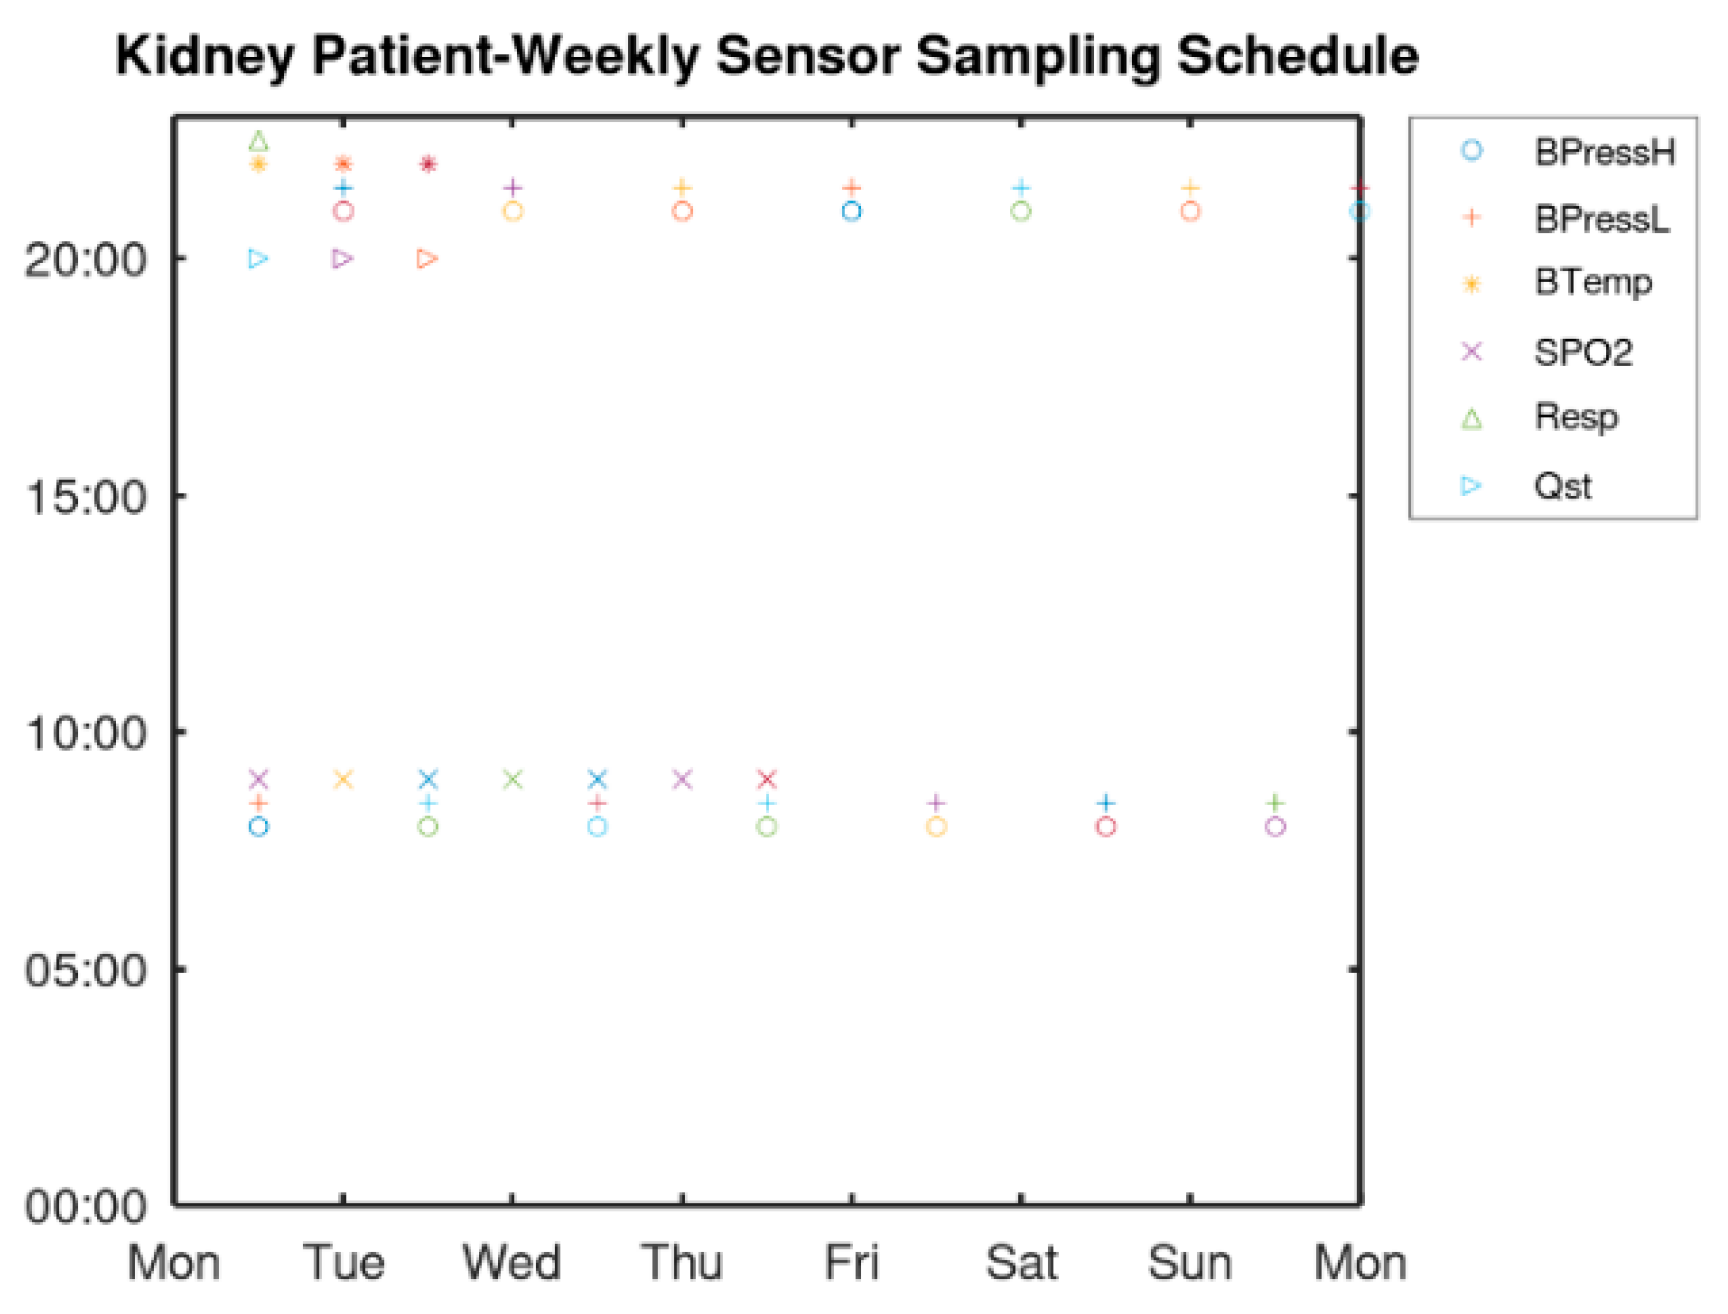
The sampling scenario for the screening of a patient with kidney failure is examined to demonstrate the flexibility of the MP file format in determining any usage of the medical sensors. More specifically, it demonstrates how different regular and irregular sampling rates can be supported. Sleep apnea which is a breathing disorder is highly prevalent in these patients. This disorder results in reduced blood oxygen saturation (called hypoxemia) and oxygen saturation is below 90%. It is also the cause of high blood pressure and can cause cardiac diseases that are frequent in chronic kidney disease and dialysis patients [30]. The sensor sampling scheduling of Figure 10 is implemented by the MP file “Sampling” section as shown in Algorithm 1.
| Algorithm 1 Sampling Section of the MP File for a Dialysis Patient |
| [{“Questionnaire”:{ |
| … |
| “Sampling”:{ |
| “BPressH”:{“Type”:”Repeat”, |
| “Date”:”8:00 6 July 2020”, |
| “Period”:”12 h”, |
| “Repeat”:”1000”} |
| “BPressL”:{“Type”:”Repeat”, |
| “Date”:”8:00 6 July 2020”, |
| “Period”:”12 h”, |
| “Repeat”:”1000”} |
| “BTemp”:{“Type”:”Repeat”, |
| “Date”:”20:00 6 July 2020”, |
| “Period”:”7 d”, |
| “Repeat”:”1000”}} |
| “BTemp”:{“Type”:”Repeat”, |
| “Date”:”20:00 8 July 2020”, |
| “Period”:”7 d”, |
| “Repeat”:”1000”}} |
| “BTemp”:{“Type”:”Repeat”, |
| “Date”:”20:00 10 July 2020”, |
| “Period”:”7 d”, |
| “Repeat”:”1000”}} |
| “Quest”:{“Type”:”Repeat”, |
| “Date”:”20:30 6 July 2020”, |
| “Period”:”7 d”, |
| “Repeat”:”1000”}} |
| “Quest”:{“Type”:”Repeat”, |
| “Date”:”20:30 8 July 2020”, |
| “Period”:”7 d”, |
| “Repeat”:”1000”}} |
| “Quest”:{“Type”:”Repeat”, |
| “Date”:”20:30 10 July 2020”, |
| “Period”:”7 d”, |
| “Repeat”:”1000”}} |
| “SPO2”:{“Type”:”Repeat”, |
| “Date”:”9:00 6 July 2020”, |
| “Period”:”24 h”, |
| “Repeat”:”1000”}}, |
| “Resp”:{“Type”:”Repeat”, |
| “Date”:”23:00 6 July 2020”, |
| “Period”:”7 d”, |
| “Repeat”:”1000”}}, |
| … |
| }] |
As can be seen from Algorithm 1, blood pressure has to be measured every 12 h thus, a single declaration can cover all days. Similarly, a single declaration can determine the SPO2 measurements to be performed every day at 9:00. The body temperature and the questionnaire have to be answered the day before the hemodialysis thus, 3 declarations (with period of one week) are used. Respiratory is monitored once every week. These measurements should be performed continuously thus, a large number (e.g., 1000) is used in the field “Repeat” to cover a long time period until a new MP is defined.
3.3. Alert Configuration
Local rule checks performed by the UserApp can be defined in the “Alert” section of the MP. Whenever the condition in a rule is found true, an action is taken. In the current version this action is a message displayed to the user. Any logical condition C is expressed as:
where s0, s1 are sensor values and s0,min, s0,max, s1,min, s1,max are the allowed limits in the sensor values. The operators “·”, ”+” and “” are the logical AND, OR and inversion of L, respectively. If ±∞ can be used in these limits then, the inversion of a condition can be expressed with Equation (2). For example
Since all the conditions in a rule must be true to perform the defined action (i.e., they are related with an AND operator) the OR operator (+) in Equation (2) can be implemented by defining twice the rule (with the same action): one for: ((s0 > −∞)∙(s0 ≤ s0,min)) and one for: ((s0 ≥ s0,max)∙(s0 <+∞)). An example that shows that any complicated condition can be supported by the format of the Alerts section of the MP file is the following: let us assume that the action A has to be taken if the following condition C is true:
Equation (3) can be rearranged by splitting the condition C in 3 separate conditions C1, C2, C3, as follows:
This rule can be expressed in the Alerts section as shown in Algorithm 2.
| Algorithm 2 Example Alerts Section in the MP File for Implementing the Rule Defined in Equations (3)–(6) |
| [{“Questionnaire”:{… |
| “Sampling”:{… |
| “Alerts”:{ |
| “m1”:{“A”, |
| “Conditions”:{ |
| “c1a”: {“SensId”:”s0”, |
| “Date”:”8:00 19 April 2020”, |
| “Minimum”:”s0_min”, |
| “Maximum”:”s0_max”} |
| “c1b”: {“SensId”:”s3”, |
| “Date”:”8:00 19 April 2020”, |
| “Minimum”:”TRUE”, |
| “Maximum”:”TRUE”} |
| } |
| “m2”:{“A”, |
| “Conditions”:{ |
| “c2a”: {“SensId”:”s1”, |
| “Date”:”8:00 19 April 2020”, |
| “Minimum”:”-Inf”, |
| “Maximum”:”s1_min”} |
| “c2b”: {“SensId”:”s3”, |
| “Date”:”8:00 19 April 2020”, |
| “Minimum”:”TRUE”, |
| “Maximum”:”TRUE”} |
| } |
| “m3”:{“A”, |
| “Conditions”:{ |
| “c3a”: {“SensId”:”s1”, |
| “Date”:”8:00 19 April 2020”, |
| “Minimum”:”s1_max”, |
| “Maximum”:”+Inf”} |
| “c3b”: {“SensId”:”s3”, |
| “Date”:”8:00 19 April 2020”, |
| “Minimum”:”TRUE”, |
| “Maximum”:”TRUE”} |
| } |
| … |
| }] |
| [{“Questionnaire”:{… |
| “Sampling”:{… |
| “Alerts”:{ |
| “m1”:{“A”, |
| “Conditions”:{ |
| “c1a”: {“SensId”:”s0”, |
As can be seen from Algorithm 2, “Inf” has been used to denote infinite and the minimum, maximum of the sensor values have been declared as: s0_min, s0_max, s1_min, s1_max. Conditions C1, C2, C3 have been implemented by the pairs: (c1a, c1b), (c2a, c2b) and (c3a, c3b), respectively. Although three different rules have been defined (m1, m2, m3), they all trigger the same action “A.” Of course the negation of, for example, s ≥ smin is s < smin and not s ≤ smin as used above in Algorithm 2 but this could be easily handled without modifying the MP file format, if a small correction e is used: s ≤ smin − e.
4. Experimentation: Cough Sound Classification
4.1. Materials and Methods
In this section, the sound analysis facilities offered by the ScientificApp are employed as a case study to demonstrate how the developed platform can assist the research on Covid-19 symptoms. More specifically, a number of new classification techniques based on similarity metrics are developed and tested. One of the most representative symptoms of Covid-19 is the dry cough. Recognizing the particular cough sound produced by a person infected by Covid-19 is not an easy task since it depends on the gender, the age as well as the progress of the infection. Computer aided sound analysis that allows the classification of the cough sound may help in this direction.
As already described in Section 2.5, the researcher can use a number of wav files that store recorded cough sounds. The labeled wav files with known origin are used for training. N-point FFT is applied to the wav file samples with subsampling 1/Sm (i.e., 1 of Sm consecutive samples is used). Subsampling allows a single FFT frame to span over a longer time interval. Each segment of the sound clip may have different significance in the classification of the sound but for the sake of simplicity we will assume that all the Nf, FFT output sets may be averaged to estimate the significance of each frequency bin in the classification process (called henceforth, “Add” combination). Alternatively, we will also examine the case where the maximum power that appears for the same frequency among the different Nf segments of a single wav file, is used as the final bin value (“Max” combination). If FFTn() denotes the n-th FFT operation that accepts as input a set of N input values: and output magnitudes: then, the results of the sound analysis using the “Add” combination would be:
In the combination called “Max” each Ri would have been estimated as:
Additional averaging of the R sets is performed to combine the training results and extract the reference spectrum , where each has resulted from averaging the Ri’s of all the training sounds. Special techniques can be applied to smooth the FFT output spectrum: Moving Average Window (MAW) and Principal Component Analysis (PCA).
In MAW each output Xi is substituted by , where W is the window used for the averaging.
PCA is a useful statistical technique which is common for finding strong patterns in data of high dimension. These patterns do not only allow the interpretation of the data in a more meaningful way but they can also be used to compress these data. Assuming we have a matrix Xr×n = [Xc1 Xc2 … Xcn] with measurements, where Xci is a sub-vector of r elements sj, which is necessary for the calculation of principal components.
The covariance matrix with each Xci has to be calculated in order to measure the variability of data:
The Singular Value Decomposition (SVD) of (R)rxr is:
where S is a diagonal matrix with the singular values of Rc on its diagonal, V is a matrix the columns of which are the right singular vectors of Rc and U = [U1 U2 … Un] is a feature vector (matrix of vectors) the columns of which are the left singular vectors of Rc.
The first m eigenvectors (ordered by magnitude) from the vector U are preserved in order to create (Ureduced)nxm = [U1 U2 … Um], m < n. Those elements correspond to principal components and m is the level of smoothing or compression.
The transpose of the vector is multiplied by the original data set:
The original data are retrieved by:
The original data are recovered with no error if all the eigenvectors are used in the transformation, otherwise the data are recovered in a lossy way.
In the experiments conducted, all the combinations between different values for N = 256 or N = 1024, Sm = 1/1 or Sm = 1/4, MAW (with W = 7 or 15) or PCA (with m = 2 or 5) or No smoothing filter, “Add” or “Max” combinations have been tested with the same sound files. The most interesting combinations are the ones presented in Table 1. Initially, the original data (no MAW or PCA smoothing) were used with Add combination and (a) N = 1024 and Sm = 4 or (b) N = 256, Sm = 1. Since better experimental results are achieved in case (a), N = 1024 and Sm = 4 were employed in the rest of the cases. PCA was used with m = 2 or m = 5 and MAW was used with W = 7 or 15. In all these 4 cases, Add combination was used. Max combination was tested with no filtering, PCA with m = 5 and MAW with W = 7.
The classification is performed based on a similarity metric called Pearson Correlation Coefficient (PCC) [31]. The PCC is estimated between R that is estimated for a new sound file and each Rfc (the Rf estimated from the training samples of class c):
The Pc coefficient values are between −1 (rising edges of R correspond to falling edges of Rf and vice versa) to 1 (perfect match). Pc equal to 0 implies that there is no linear correlation between the variables.
Let TP TN, FP and FN be the number of samples recognized as True Positive, True Negative, False Positive and False Negative, respectively, for a specific class. The Sensitivity (or Recall or True Positive Rate), the Specificity (or True Negative Rate), the Precision and the Accuracy are defined as:
4.2. Experimental Results
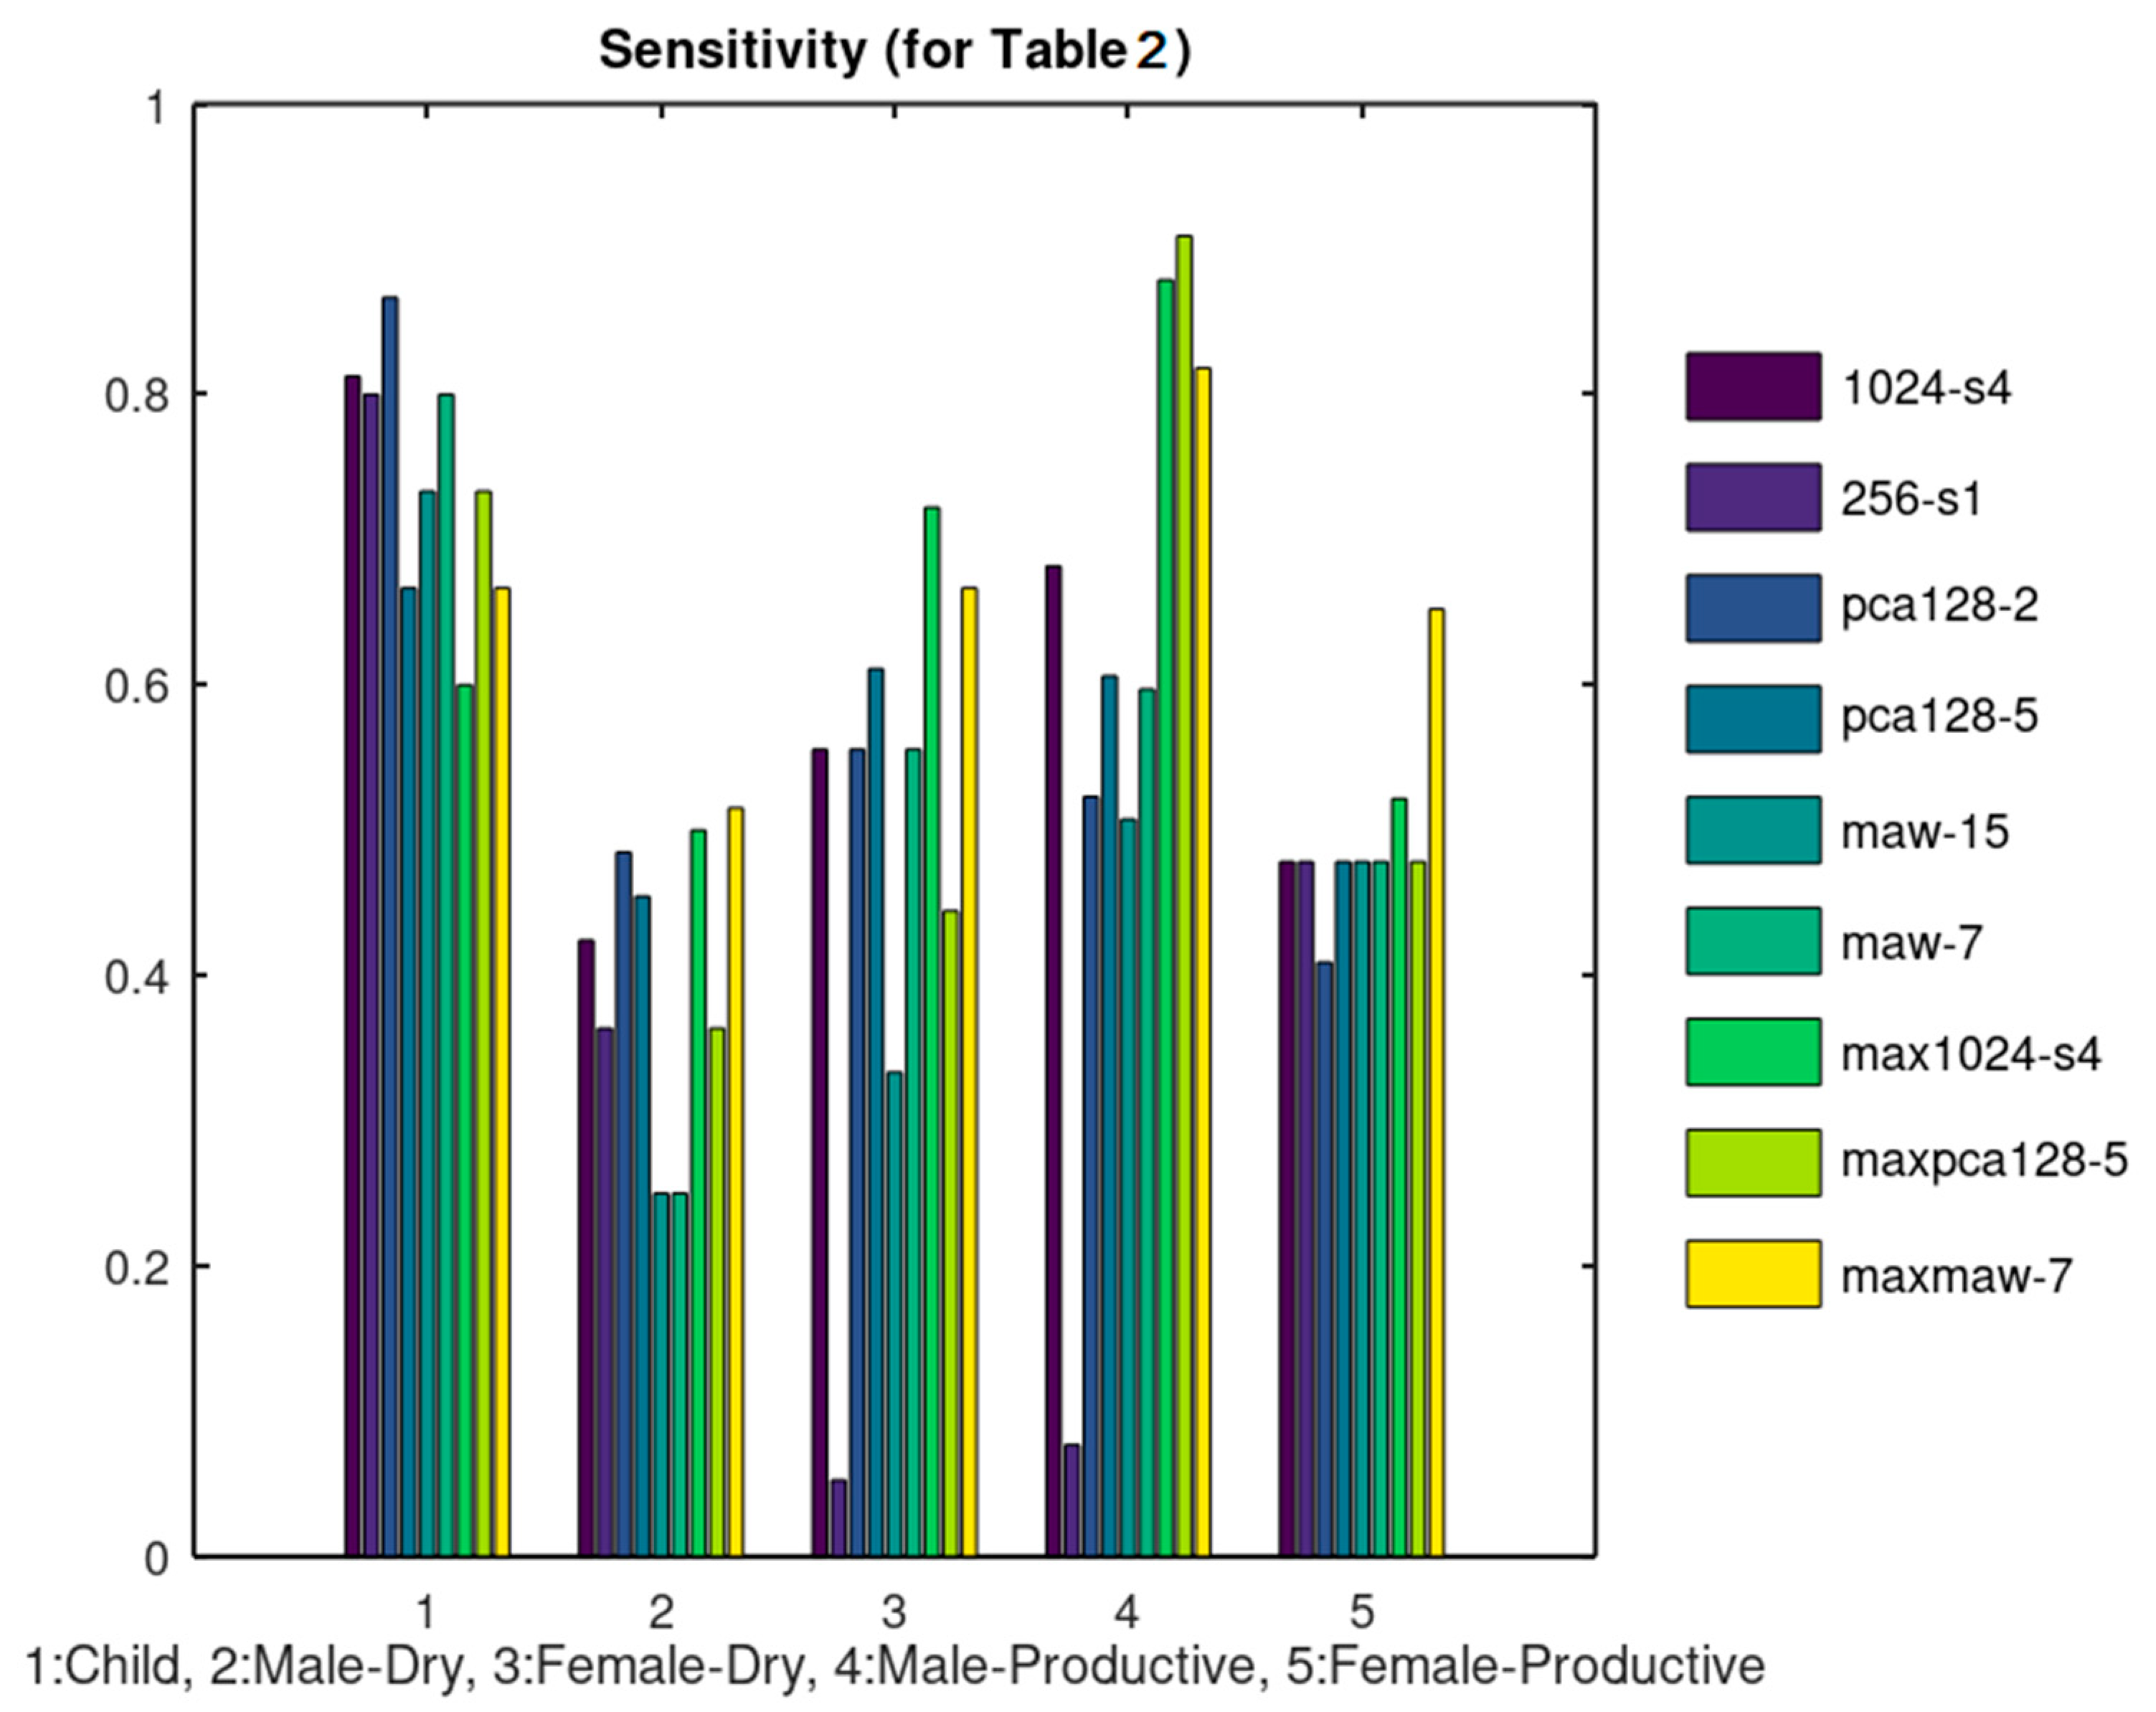
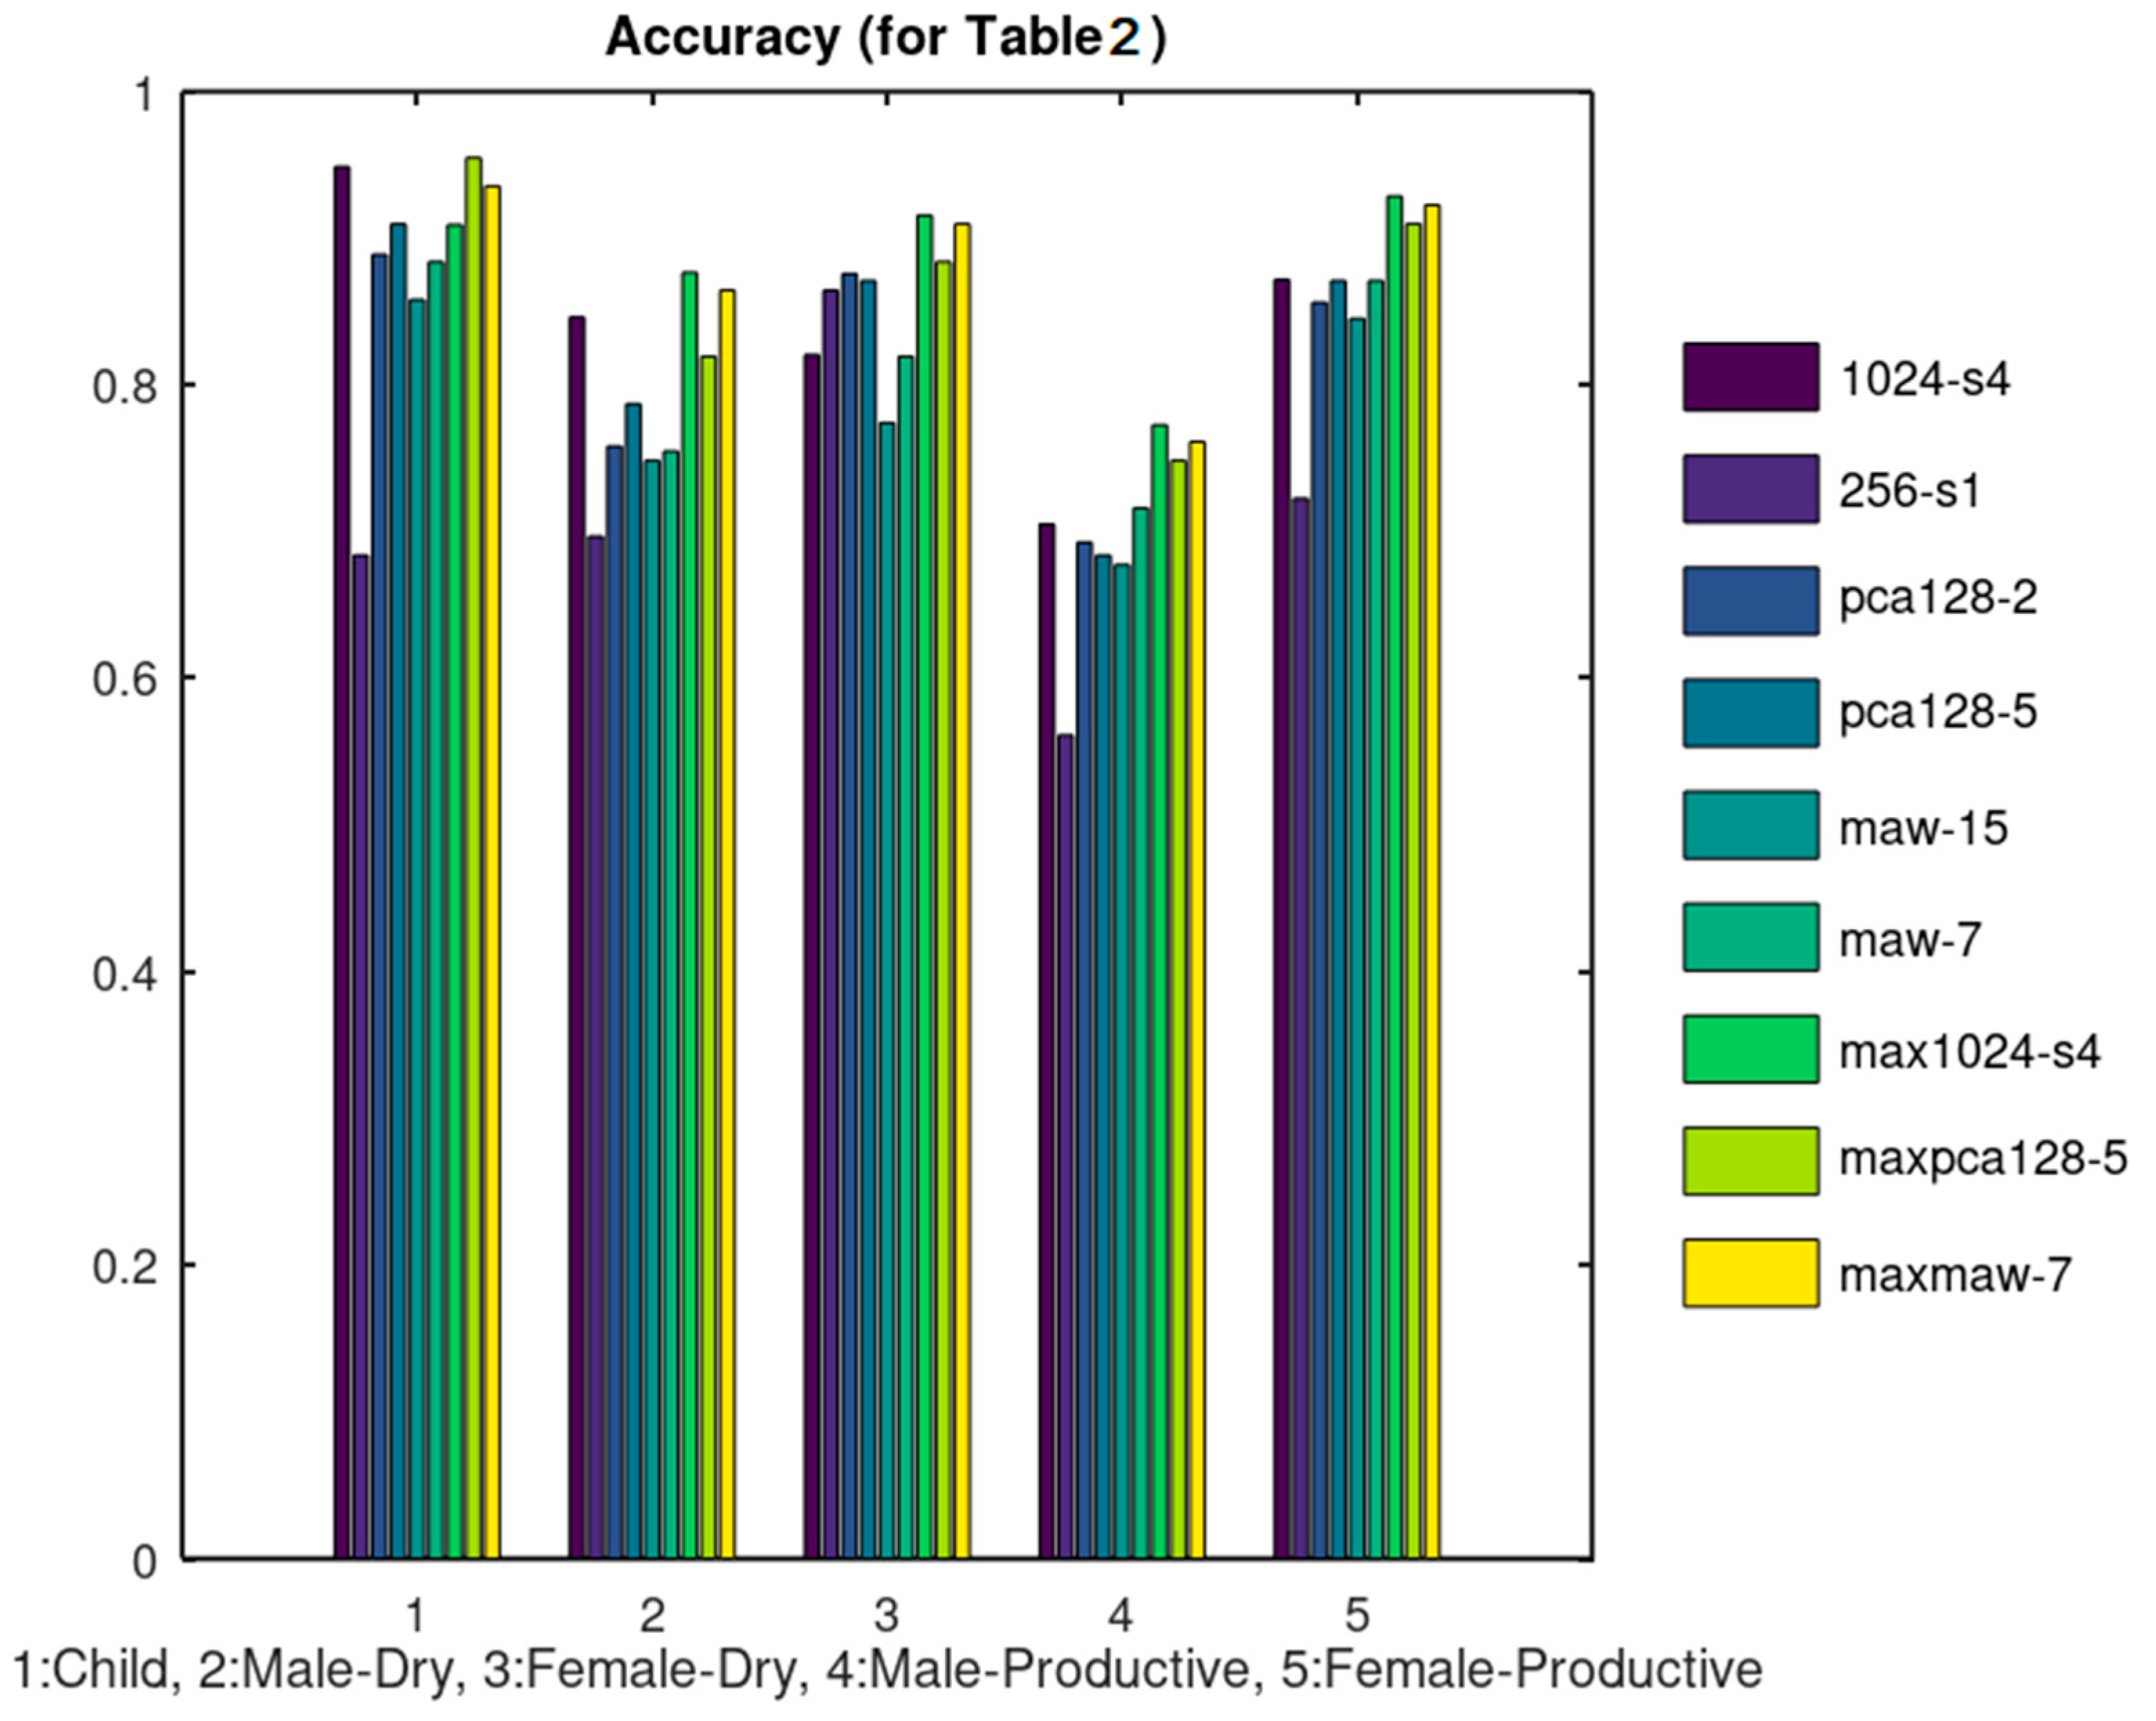
A number of cough sound files (300) were retrieved from SoundSnap (soundsnap.com) and labeled according to the information given in this website, initially in 5 categories as shown in Table 2. The population of each category is not constant and depends on the availability in SoundSnap. The duration of the analyzed sounds, ranges between 1 and 5 s. Ten (10) representative sound files of each category were used for training that is, for the extraction of its reference Rf set. Taking into consideration the overall number of samples per sound class, the training set size ranges between 8% and 33% of each class population. In several machine learning applications, the training size is in the order of ¾ of the data size. Increasing the training set size is expected to improve the achieved classification accuracy. All the files were used as a test set in each one of the methods listed in Table 1 and the classification results were used to estimate the TP, TF, FP, FN parameters. Although in large datasets it would be more appropriate to use separate training and test sets, the small number of training samples used here and the dataset size allows us to apply the test to all the available samples. The Sensitivity, Specificity, Precision and Accuracy achieved by each method are listed in Table 3, Table 4, Table 5 and Table 6, respectively. We consider the sensitivity and accuracy as the most representative metrics and display these experimental results in Figure 11 and Figure 12, respectively.
The rationale behind the selection of the specific combinations listed in Table 1 is the following: The unfiltered data were tested initially using 1024_s4 and 256_s1. As can be seen from Figure 11 and Figure 12, 1024_s4 achieves better results in most of the cases. For this reason, N = 1024 and Sm = 4 was used in the rest of the combinations tested. When PCA was applied, better results were achieved when 5 principal components were used instead of 2. Similarly, when MAW was employed using a window of W = 7 samples achieved better results than using W = 15. From these results it can be concluded that the classification results are not favored by a heavy smoothing. All of the aforementioned methods concerned the extraction of Rf using “Add” Combination. The “Max” Combination was applied only to the methods that achieved the best results with the “Add” Combination that is: 1024_s4, pca128_5 and maw7.
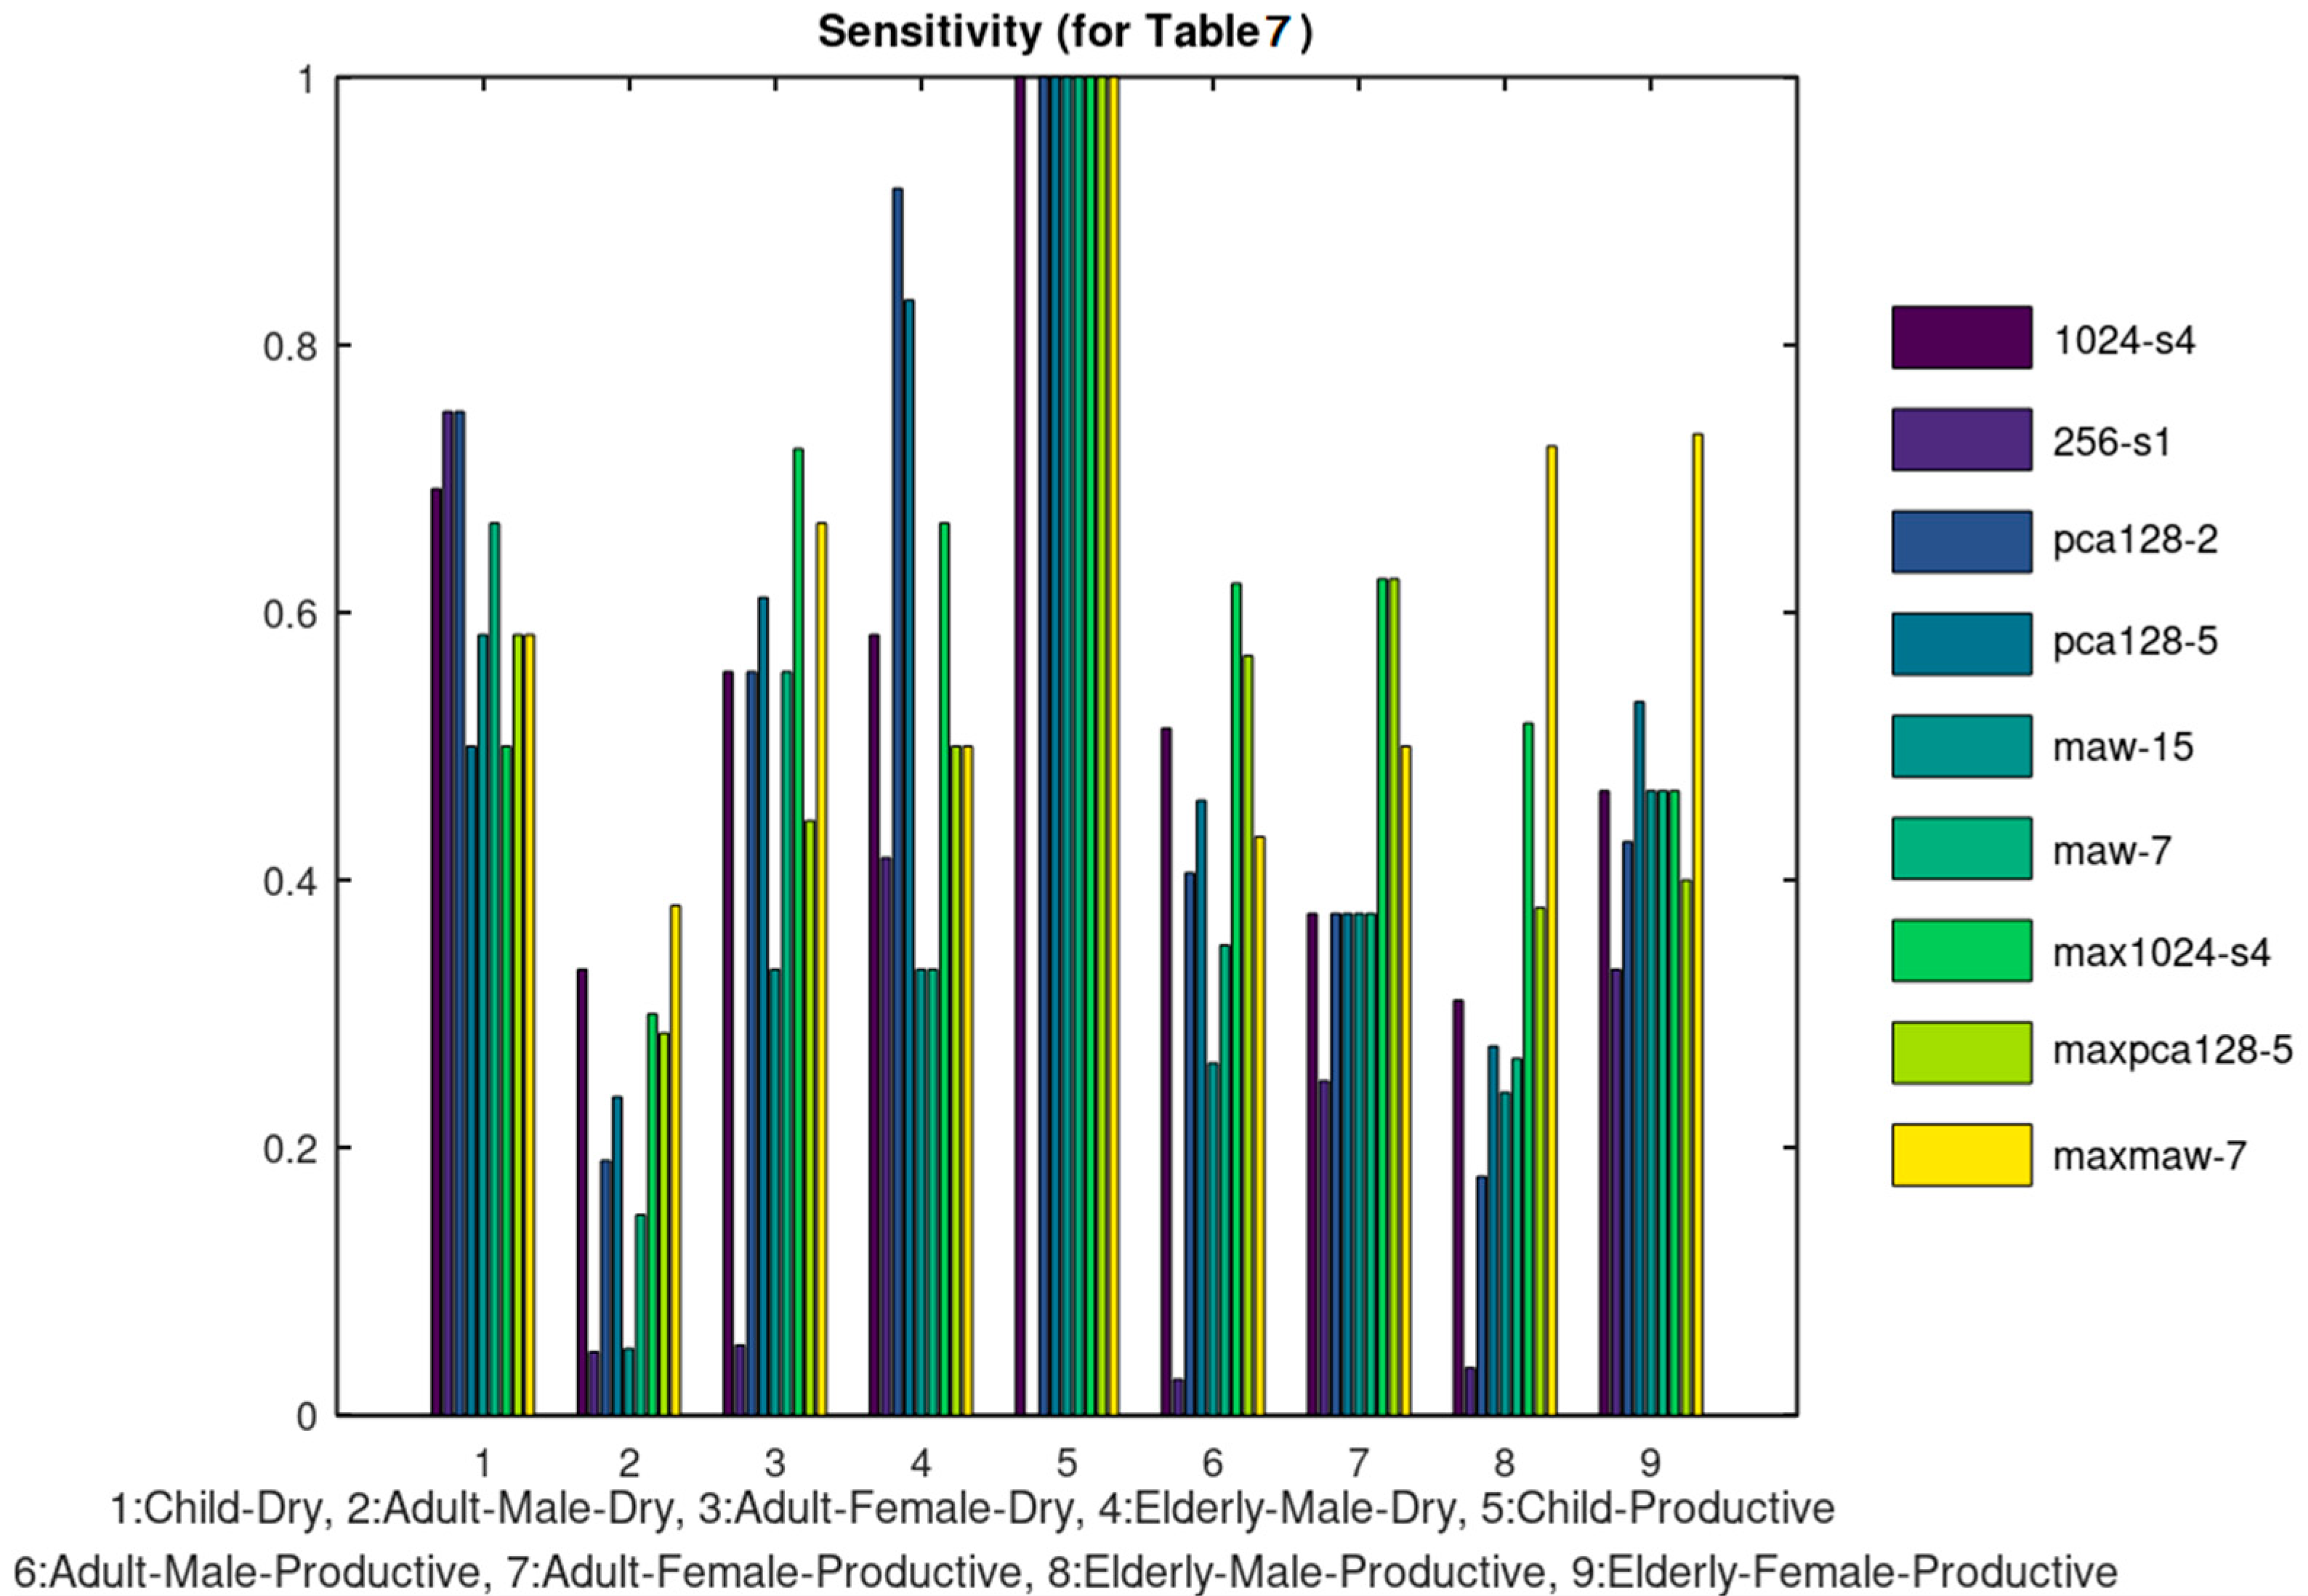
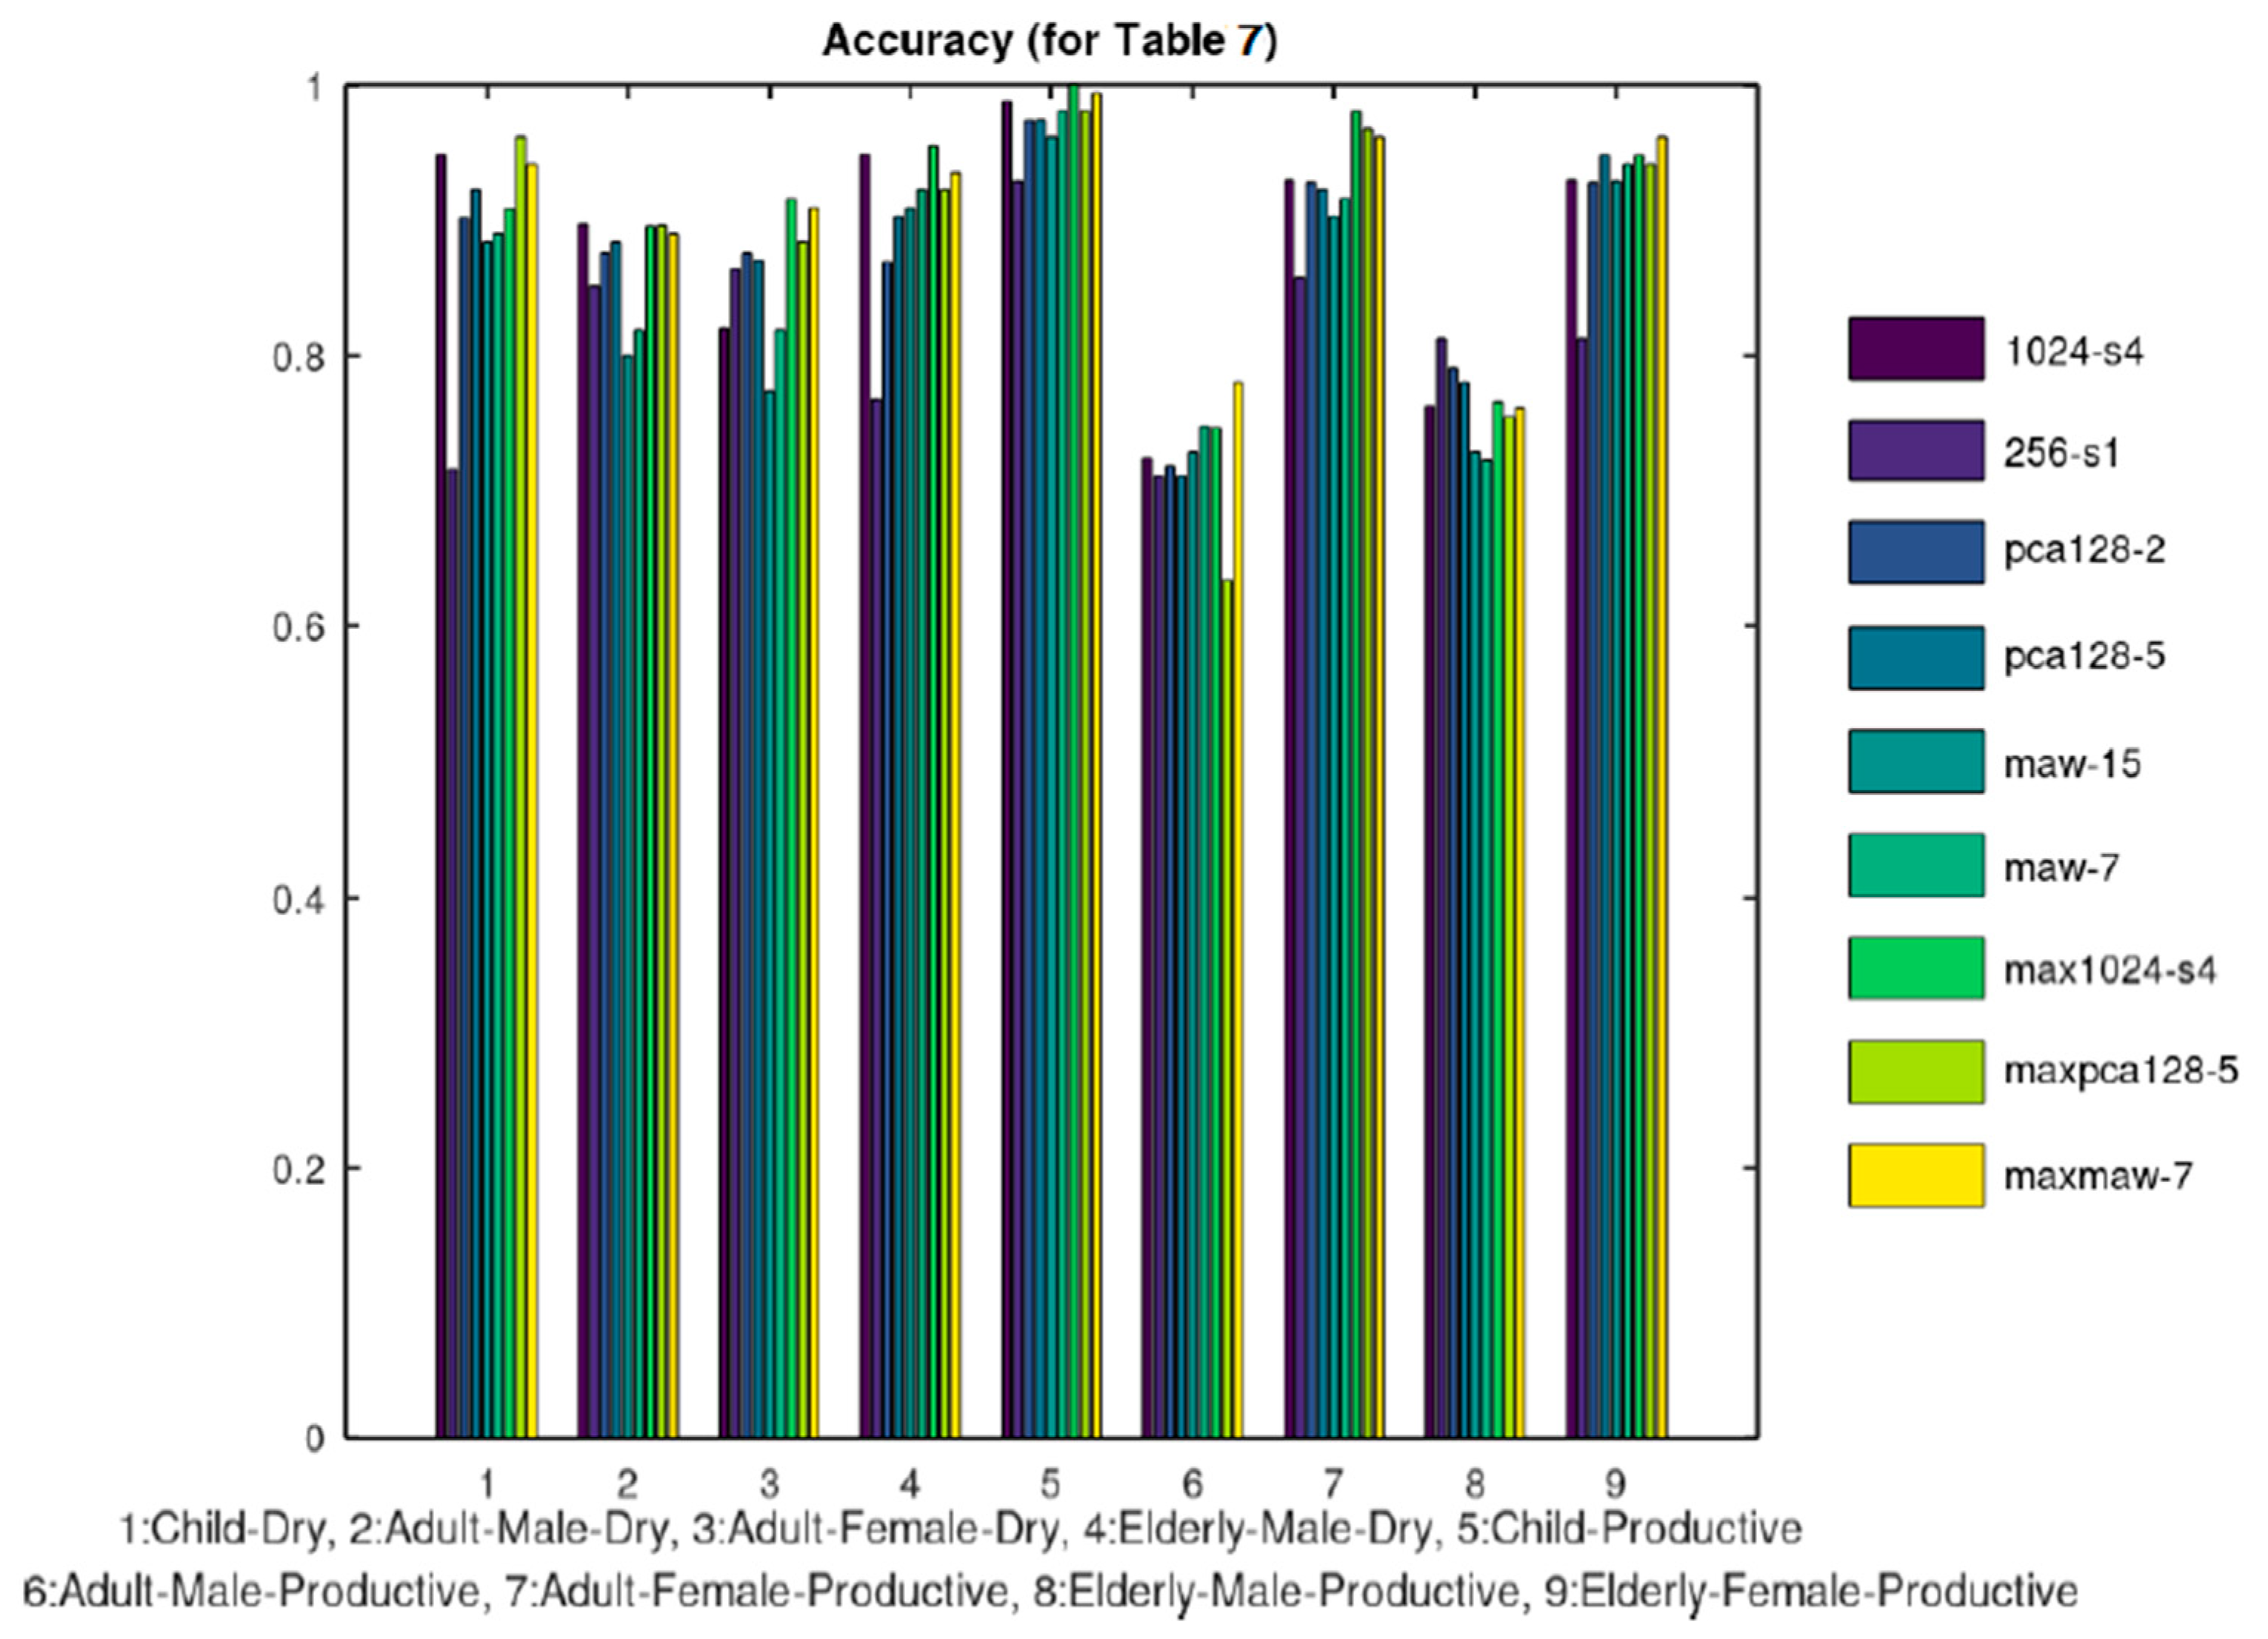
The 5 categories listed in Table 2 were further split in the 9 categories of Table 7. Ten training samples were used again except for the case of Child-Productive, since in this case there were only 6 samples available and all of them were used both for training and test. Figure 13 and Figure 14 display the sensitivity and accuracy results for this case.
4.3. Comparison
Cough features have been exploited in the diagnosis of several diseases of the respiratory system. Until recently, the patients reported the severity of their cough to the supervisor doctor. This approach of course is not reliable and often subjective [32]. The sound signal of the cough can reveal critical information about the patient condition [33]. Continuous audio signal collection provides important information and 24 h cough count is a metric used to approve an appropriate treatment. Automated cough recording and counting solutions have been recently presented in the literature [34,35,36]. In [34] the sound is split in segments of 1 s processed by Fourier transform with a window size of 25 ms, a window hop of 10 ms and then a periodic Hann window is used to generate the corresponding spectrum. The output of this analysis is input to a convolutional neural network that classifies the sounds as cough or something else: noise, throat clearing, sneeze and so forth. Despite the fact that the sound is affected by several parameters (noise, gender, age, disease, etc.) its recognition as cough is a binary decision and definitely this an easier task than classifying it in the multiple categories of Table 2 or Table 7.
In a more sophisticated approach [37], a novel feature set called intra-cough shimmer jump and intra-cough Teager energy operator jump is used to discriminate dry or wet coughs. The frequency, intensity of coughing and acoustic properties of cough sound, were analyzed in [38] but no classification results are presented.
Table 8 summarizes the results achieved by these referenced approaches. In the first row, the classification in the 5 categories of Table 2 is used and in the second row, the classification in the 9 categories of Table 7. If the various classification methods examined on the Coronario platform are compared according to their accuracy, MAW7 achieved a slightly better average accuracy as shown from Table 2 and Table 7. Consequently, the achievements of MAW7 are listed in Table 8.
The overall accuracy of the tested classification methods is acceptable although the average sensitivity is not particularly high. Especially, when the classification has to be performed in the categories of Table 7, there are some cough classes that achieve a sensitivity lower than 50% which is clearly not acceptable. It should be stressed that the sensitivity/accuracy results presented were achieved using only 10 training samples per cough class. The use of a larger training dataset is expected to lead to better accuracy. Moreover, the accuracy of the other approaches, concerned binary decisions (cough or noise [34,35,36], dry or productive cough [37]) and for this reason it is no surprise that this discrimination is accomplished with higher success rate in some referenced approaches.
5. Discussion
The already implemented sound processor can be used to classify cough or respiratory sounds related to the infection. The aim of the experiments conducted in the previous section is to demonstrate how the developed platform can host several filtering, signal processing and classification methods in order to exploit the medical information exchanged. Nonetheless, the classification accuracy results obtained in some cases are quite good compared to the referenced approaches listed in Table 8, taking into consideration that the referenced approaches concern binary decisions. It is obvious that the classification of a sound file in one of the multiple classes that are supported is a much harder problem. Furthermore, the classification accuracy is expected to be much higher if a larger portion of the dataset is used for training. Image processing will also be supported in the next version of the system, to monitor for example, skin disorders as already studied in our previous work [39]. Additionally, the image processing methods that will be employed may be used to scan the results of for example, Coaxial Tomography, X-ray, ultrasound images and extract useful features for the diagnosis of an infection.
In the current version, the supervisor doctor is responsible for the diagnosis based on the data retrieved from the UserApp and the IoT medical sensors. Nevertheless, AI deep learning tools such as TensorFlow or Caffe can be trained to assist the automation and reliability of the diagnosis. Such a neural network model can be trained using the information exchanged between the Coronario modules (sensor values, user information, geolocation data, etc.). The outputs of this model could be discrete decision about the treatment or suggestions about the next steps that the patient has to follow. Such a trained neural network model can be easily attached on the side of the supervisor doctor where all the information is available or on the side of the eHealth sensor infrastructure. The latter case can be used if some alerts have to be generated locally based on the sensor values. This process can support the alert rules already defined in the MP file as discussed in Section 3.3.
Several privacy and security issues have been addressed in order to make the system compliant with General Data Protection Regulation (GDPR). First of all, encryption is employed during the exchange and the storage of data. The information exchanged can be decoded at the edge of the Coronario platform from the users (e.g., patients, supervisor doctors or researchers) based on the certificates they own. The encrypted data are unreadable by anyone that does not own the appropriate keys/certificates (e.g., while they reside in the cloud). Only authenticated users have access to the stored information with different permissions. The authorized doctors can download information that concerns only their patients. The researchers can retrieve data from a pool of sensor values that are anonymized and accompanied with permissions for research use. The patients can download the MP files and the messages sent to them from their supervisor doctor. The cloud administrators will not be able to decrypt and read the stored information although the Service Level Agreement (SLA) between the cloud provider and the healthcare institutes will anyway prohibit such an access.
Only the necessary information is stored. Local processing is encouraged to minimize the risk of data exposure during wireless or even wired communication. This is the reason why a local Sensor Controller (Gateway) such as the one used in [29] is proposed for the sensor infrastructure of the Coronario platform. The supported alerts defined in the medical protocol can check various parameters locally and perform certain actions avoiding the move of sensitive data to the cloud. Several cloud facilities have been employed to guarantee the protection of the stored data: different access privileges, alerts at the cloud level to warn about attacks to the data by unauthorized personnel, the data are deleted from the cloud as soon as possible and so forth. For example, the sensor values can be deleted immediately after they are read by the authorized supervisor. The geolocation data show the places visited by the user and can be deleted after a safe interval of for example, 14 days. Finally, the data used for research such as audio or image files are anonymous and are used only after the consent of the patient.
6. Conclusions
A symptom tracking platform for Covid-19 or other similar infections has been developed. It is suitable for pre- or post-hospitalization and vulnerable population monitoring. Alert rules, sensor sampling scenarios and questionnaire structure are dynamically determined. An editor is available for sound classification, assisting the research on the infection symptoms (e.g., cough or respiratory sounds). The condition of a patient is reliably assessed since information from several sources is taken into account. A number of sound signal filtering and analysis methods have been already employed and tested for the classification of cough sounds with 90% accuracy.
Future work will focus on testing the developed platform in real environments, measuring its effectiveness in the protection of the public health and its financial impact. We will also extend ScientificApp module to allow experimentation with sound and image classification using larger datasets and different ML methods.
Author Contributions
Conceptualization, N.P.; methodology, N.P.; software, N.P.; validation, N.P. and G.K.A.; writing—original draft preparation, N.P.; writing—review and editing, N.P. and G.K.A. All authors have read and agreed to the published version of the manuscript.
Funding
This research received no external funding.
Institutional Review Board Statement
Not applicable.
Informed Consent Statement
Patient consent was waived due to the fact that data used from soundsnap.com are publicly available.
Data Availability Statement
Data sharing not applicable.
Conflicts of Interest
The authors declare no conflict of interest.
References
- Wu, F.; Zhao, S.; Yu, B.; Chen, Y.-M.; Wang, W.; Song, Z.-G.; Hu, Y.; Tao, Z.-W.; Tian, J.-H.; Pei, Y.-Y.; et al. A new coronavirus associated with human respiratory disease in China. Nature 2020, 579, 265–269. [Google Scholar] [CrossRef] [Green Version]
- Wang, C.; Horby, P.W.; Hayden, F.G.; Gao, G.F. A novel coronavirus outbreak of global health concern. Lancet 2020, 395, 470–473. [Google Scholar] [CrossRef] [Green Version]
- Bai, Y.; Yao, L.; Wei, T.; Tian, F.; Jin, D.Y.; Chen, L.; Wang, M. Presumed Asymptomatic Carrier Transmission of COVID-19. JAMA 2020, 323. [Google Scholar] [CrossRef] [PubMed] [Green Version]
- Zhang, J.; Gharizadeh, B.; Yue, J.; Yu, M.; Liu, Y.; Zhou, M.; Lu, D. Navigating the Pandemic Response Life Cycle: Molecular Diagnostics and Immunoassays in the Context of COVID-19 Management. IEEE Rev. Biomed. Eng. 2020, 14. [Google Scholar] [CrossRef]
- Corman, V.M.; Landt, O.; Kaiser, M.; Molenkamp, R.; Meijer, A.; Chu, D.K.; Bleicker, T.; Brünink, S.; Schneider, J.; Schmidt, M.L.; et al. Detection of 2019 novel coronavirus (2019-nCoV) by real-time RT-PCR. Eurosurveillance 2020, 25, 2000045. [Google Scholar] [CrossRef] [Green Version]
- To, K.K.-W.; Tsang, O.T.-Y.; Leung, W.-S.; Tam, A.R.; Wu, T.-C.; Lung, D.C.; Yip, C.C.-Y.; Cai, J.-P.; Chan, J.M.-C.; Chik, T.S.-H.; et al. Temporal profiles of viral load in posterior oropharyngeal saliva samples and serum antibody responses during infection by SARS-CoV-2: An observational cohort study. Lancet Infect. Dis. 2020, 20. [Google Scholar] [CrossRef] [Green Version]
- Wang, G.; Liu, X.; Li, C.; Xu, Z.; Ruan, J.; Zhu, H.; Meng, T.; Li, K.; Huang, N.; Zhang, S. A Noise-robust Framework for Automatic Segmentation of COVID-19 Pneumonia Lesions from CT Images. IEEE Trans. Med. Imaging 2020, 39, 2653–2663. [Google Scholar] [CrossRef]
- Wang, X.; Deng, X.; Fu, Q.; Zhou, Q.; Feng, J.; Ma, H.; Liu, W.; Zheng, C. A Weakly-supervised Framework for COVID-19 Classification and Lesion Localization from Chest CT. IEEE Trans. Med. Imaging 2020, 39. [Google Scholar] [CrossRef]
- Abdel-Basset, M.; Mohamed, R.; Elhoseny, M.; Chakrabortty, R.K.; Ryan, M. A Hybrid COVID-19 Detection Model Using an Improved Marine Predators Algorithm and a Ranking-Based Diversity Reduction Strategy. IEEE Access 2020, 8, 79521–79540. [Google Scholar] [CrossRef]
- Roy, S.; Menapace, W.; Oei, S.; Luijten, B.; Fini, E.; Saltori, C.; Huijben, I.; Chennakeshava, N.; Mento, F.; Sentelli, A.; et al. Deep learning for classification and localization of COVID-19 markers in point-of-care lung ultrasound. IEEE Trans. Med. Imaging 2020, 39. [Google Scholar] [CrossRef]
- Dong, D.; Tang, Z.; Wang, S.; Hui, H.; Gong, L.; Lu, Y.; Xue, Z.; Liao, H.; Chen, F.; Yang, F.; et al. The role of imaging in the detection and management of COVID-19: A review. IEEE Rev. Biomed. Eng. 2020, 14. [Google Scholar] [CrossRef]
- Jiang, Z.; Hu, M.; Zhai, G. Portable Health Screening Device of Respiratory Infections. In Proceedings of the 2020 IEEE International Conference on Multimedia & Expo, London, UK, 6–10 July 2020; pp. 1–2. [Google Scholar] [CrossRef]
- Uysal, C.; Onat, A.; Filik, T. Non-Contact Respiratory Rate Estimation in Real-Time with Modified Joint Unscented Kalman Filter. IEEE Access 2020, 8, 99445–99457. [Google Scholar] [CrossRef]
- Quatieri, T.F.; Talkar, T.; Palmer, J.S. A Framework for Biomarkers of COVID-19 Based on Coordination of Speech-Production Subsystems. IEEE Open J. Eng. Med. Biol. 2020, 1. [Google Scholar] [CrossRef]
- Bahl, S.; Singh, R.P.; Javaid, M.; Khan, I.H.; Vaishya, R.; Suman, R. Telemedicine technologies for confronting COVID-19 pandemic: A review. J. Ind. Integr. Manag. 2020, 5, 547–561. [Google Scholar] [CrossRef]
- Javaid, M.; Haleem, A.; Vaish, A.; Vaishya, R.; Iyengar, K.P. Robotics applications in COVID-19: A review. J. Ind. Integr. Manag. 2020, 5, 441–451. [Google Scholar] [CrossRef]
- Kushwaha, S.; Bahl, S.; Bagha, A.K.; Parmar, K.S.; Javaid, M.; Haleem, A.; Singh, R.P. Significant applications of machine learning for COVID-19 pandemic. J. Ind. Integr. Manag. 2020, 5, 453–479. [Google Scholar] [CrossRef]
- Haleem, A.; Javaid, M. Medical 4.0 and its role in healthcare during COVID-19 pandemic: A review. J. Ind. Integr. Manag. 2020, 5, 531–545. [Google Scholar] [CrossRef]
- Jamshidi, M.B.; Lalbakhsh, A.; Talla, J.; Peroutka, Z.; Hadjilooei, F.; Lalbakhsh, P.; Jamshidi, M.; La Spada, L.; Mirmozafari, M.; Dehghani, M.; et al. Artificial Intelligence and COVID-19: Deep Learning Approaches for Diagnosis and Treatment. IEEE Access 2020, 8. [Google Scholar] [CrossRef]
- Rehm, G.B.; Woo, S.H.; Chen, X.L.; Kuhn, B.T.; Cortes-Puch, I.; Anderson, N.R.; Adams, J.Y.; Chuah, C.-N. Leveraging IoTs and Machine Learning for Patient Diagnosis and Ventilation Management in the Intensive Care Unit. IEEE Pervasive Comput. 2020, 19. [Google Scholar] [CrossRef]
- Michael, K.; Abbas, R. Getting Behind COVID-19 Contact Trace Apps: The Google-Apple Partnership. IEEE Consum. Electron. Mag. 2020, 9. [Google Scholar] [CrossRef]
- Li, L.; Zhang, Q.; Wang, X.; Zhang, J.; Wang, T.; Gao, T.-L.; Duan, W.; Tsoi, K.K.-F.; Wang, F.-Y. Characterizing the Propagation of Situational Information in Social Media During COVID-19 Epidemic: A Case Study on Weibo. IEEE Trans. Comput. Soc. Syst. 2020, 7, 556–562. [Google Scholar] [CrossRef]
- Small, M.; Cavanagh, D. Modelling strong control measures for epidemic propagation with networks—A COVID-19 case study. IEEE Access 2020, 8. [Google Scholar] [CrossRef]
- Hernández-Orallo, E.; Manzoni, P.; Calafate, C.T.; Cano, J. Evaluating How Smartphone Contact Tracing Technology Can Reduce the Spread of Infectious Diseases: The Case of COVID-19. IEEE Access 2020, 8, 99083–99097. [Google Scholar] [CrossRef]
- Abbas, R.; Michael, K. COVID-19 Contact Trace App Deployments: Learnings from Australia and Singapore. IEEE Consum. Electron. Mag. 2020, 9. [Google Scholar] [CrossRef]
- Ding, X.-R.; Clifton, D.; Ji, N.; Lovell, N.H.; Bonato, P.; Chen, W.; Yu, X.; Xue, Z.; Xiang, T.; Long, X.; et al. Wearable Sensing and Telehealth Technology with Potential Applications in the Coronavirus Pandemic. IEEE Rev. Biomed. Eng. 2020, 14. [Google Scholar] [CrossRef]
- Ali, S.; Singh, R.P.; Javaid, M.; Haleem, A.; Pasricha, H.; Suman, R.; Karloopia, J. A review of the role of smart wireless medical sensor network in COVID-19. J. Ind. Integr. Manag. 2020, 5, 413–425. [Google Scholar] [CrossRef]
- Tripathy, A.K.; Mohapatra, A.G.; Mohanty, S.P.; Kougianos, E.; Joshi, A.M.; Das, G. EasyBand: A Wearable for Safety-Aware Mobility during Pandemic Outbreak. IEEE Consum. Electron. Mag. 2020, 9. [Google Scholar] [CrossRef]
- Petrellis, N.; Birbas, M.; Gioulekas, F. On the Design of Low-Cost IoT Sensor Node for e-Health Environments. Electronics 2018, 8, 178. [Google Scholar] [CrossRef] [Green Version]
- Unruh, M.L.; Sanders, M.H.; Redline, S.; Piraino, B.M.; Umans, J.G.; Chami, H.; Budhiraja, R.; Punjabi, N.M.; Buysse, D.; Newman, A.B. Subjective and objective sleep quality in patients on conventional thrice- weekly hemodialysis: Comparison with matched controls from the sleep heart health study. Am. J. Kidney Disord. 2008, 52, 305–313. [Google Scholar] [CrossRef] [Green Version]
- Immink, K.A.S.; Weber, J.H. Minimum Pearson Distance Detection for Multilevel Channels with Gain and/or Offset Mismatch. IEEE Trans. Inf. Theory 2014, 60, 5966–5974. [Google Scholar] [CrossRef]
- Steele, A.M.; Meuret, A.E.; Millard, M.W.; Ritz, T. Discrepancies between lung function and asthma control: Asthma perception and association with demographics and anxiety. Allergy Asthma Proc. 2012, 33, 500–507. [Google Scholar] [CrossRef]
- Spinou, A.; Birring, S.S. An update on measurement and monitoring of cough: What are the important study endpoints? J. Thorac. Dis. 2014, 6, S728–S734. [Google Scholar] [CrossRef] [PubMed]
- Kvapilova, L.; Boza, V.; Dubec, P.; Majernik, M.; Bogar, J.; Jamison, J.; Goldsack, J.C.; Kimmel, D.J.; Karlin, D.R. Continuous Sound Collection Using Smartphones and Machine Learning to Measure Cough. Digit. Biomark. 2019, 3, 166–175. [Google Scholar] [CrossRef] [PubMed]
- Birring, S.S.; Fleming, T.; Matos, S.; Raj, A.A.; Evans, D.H.; Pavord, I.D. The Leicester Cough Monitor: Preliminary validation of an automated cough detection system in chronic cough. Eur. Respir. J. 2008, 31, 1013–1018. [Google Scholar] [CrossRef] [PubMed] [Green Version]
- Barry, S.J.; Dane, A.D.; Morice, A.H.; Walmsley, A.D. The automatic recognition and counting of cough. Cough 2006, 2. [Google Scholar] [CrossRef] [Green Version]
- Amrulloh, Y.A.; Wati, D.A.R.; Pratiwi, F.; Triasih, R. A Novel Method for Wet/Dry Cough Classification in Pediatric Population. In Proceedings of the 2016 IEEE Region 10 Symposium (TENSYMP), Bali, Indonesia, 9–11 May 2016; pp. 125–129. [Google Scholar] [CrossRef]
- Shi, Y.; Liu, H.; Wang, Y.; Cai, M.; Xu, W. Theory and Application of Audio-Based Assessment of Cough. Special Issue in Advanced Internet of Things and Big Data Technology for Smart Human-Care Services. Hindawi J. Sens. 2018, 2018. [Google Scholar] [CrossRef] [Green Version]
- Petrellis, N. Using Color Signatures for the Classification of Skin Disorders. In Proceedings of the IEEE MOCAST 2018, Thessaloniki, Greece, 7–9 May 2018. [Google Scholar]
Figure 1.
The Coronario platform architecture.

Figure 2.
Data exchanged between the Coronario modules.

Figure 3.
User App pages. Selection of language (a), connection to the cloud and authentication (b), updating of Medical Protocols (MP) and alerts (c), personal info and habit questionnaire (d), symptom questionnaire with checkboxes (e), symptom questionnaire with analog description (f), geolocation of the user (g) and display on the map (h), sound processing page (i), selection of sound file (j) and a page with notifications to the user (k).
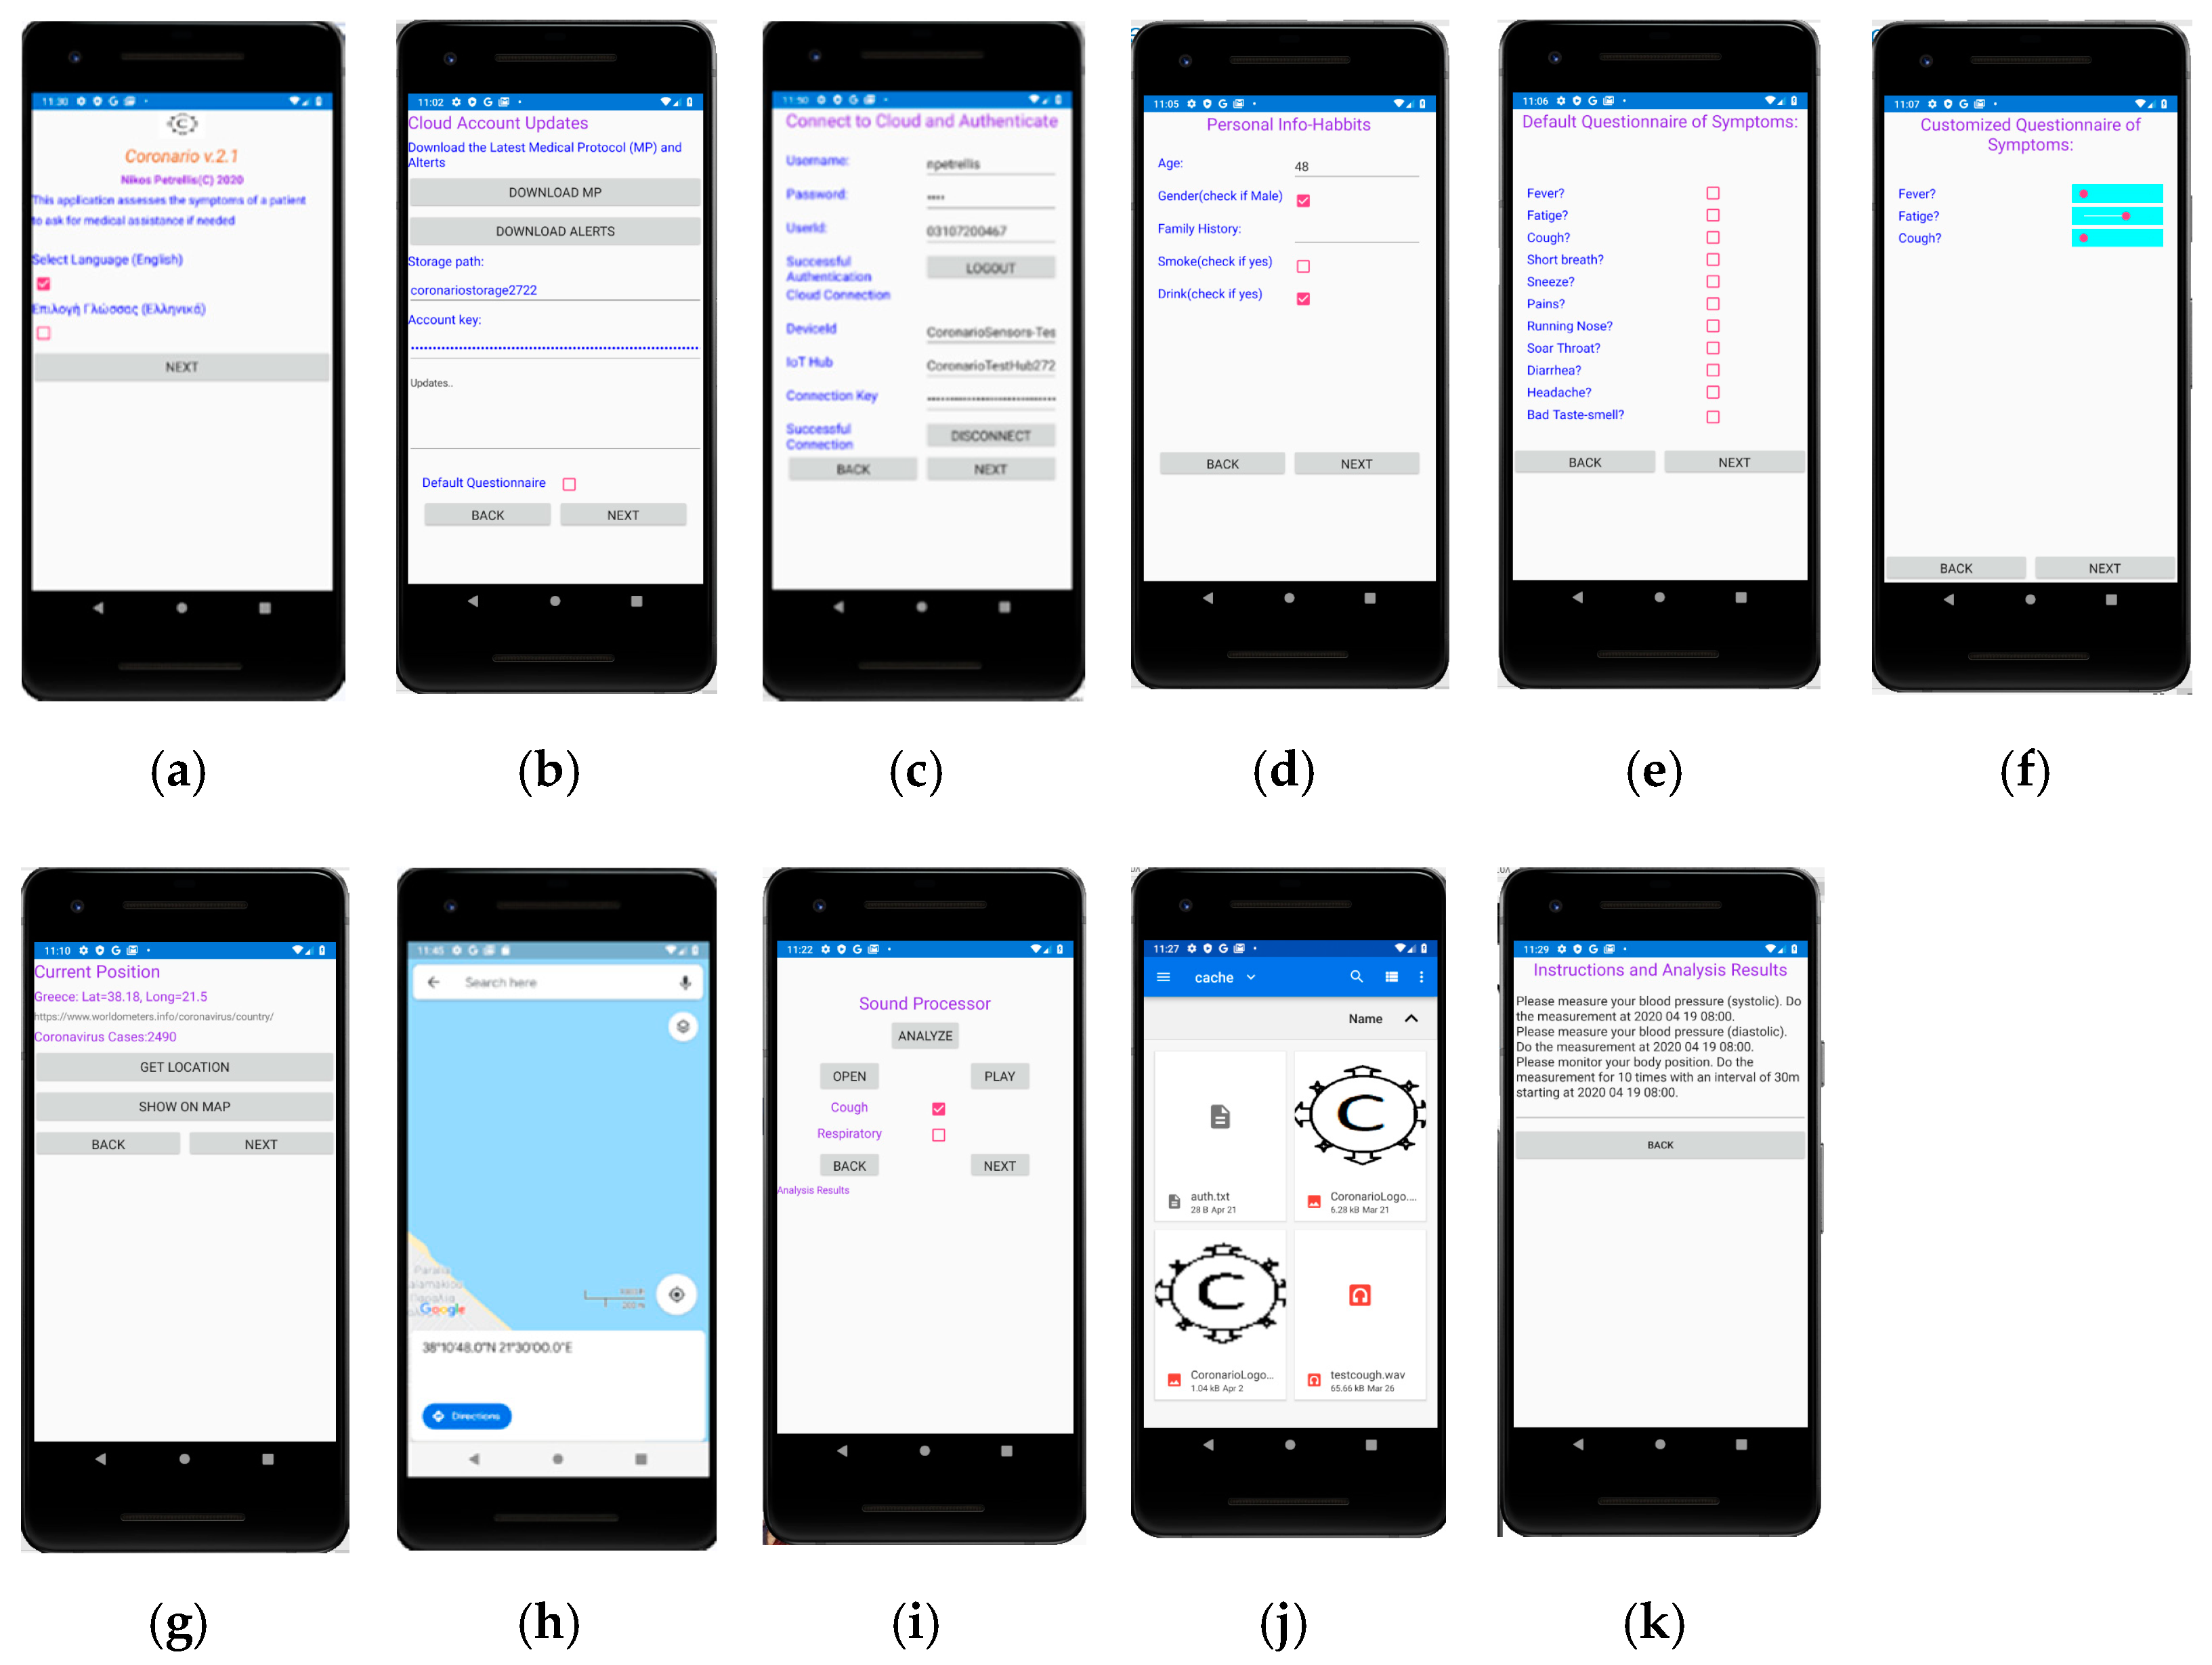
Figure 4.
The main page of the SupervisorApp.

Figure 5.
The sound processor page of the Scientific App.

Figure 6.
List of the supported similarity analysis methods.

Figure 7.
The results of the sound classification.

Figure 8.
Customization of the questionnaire in User App from MP file.
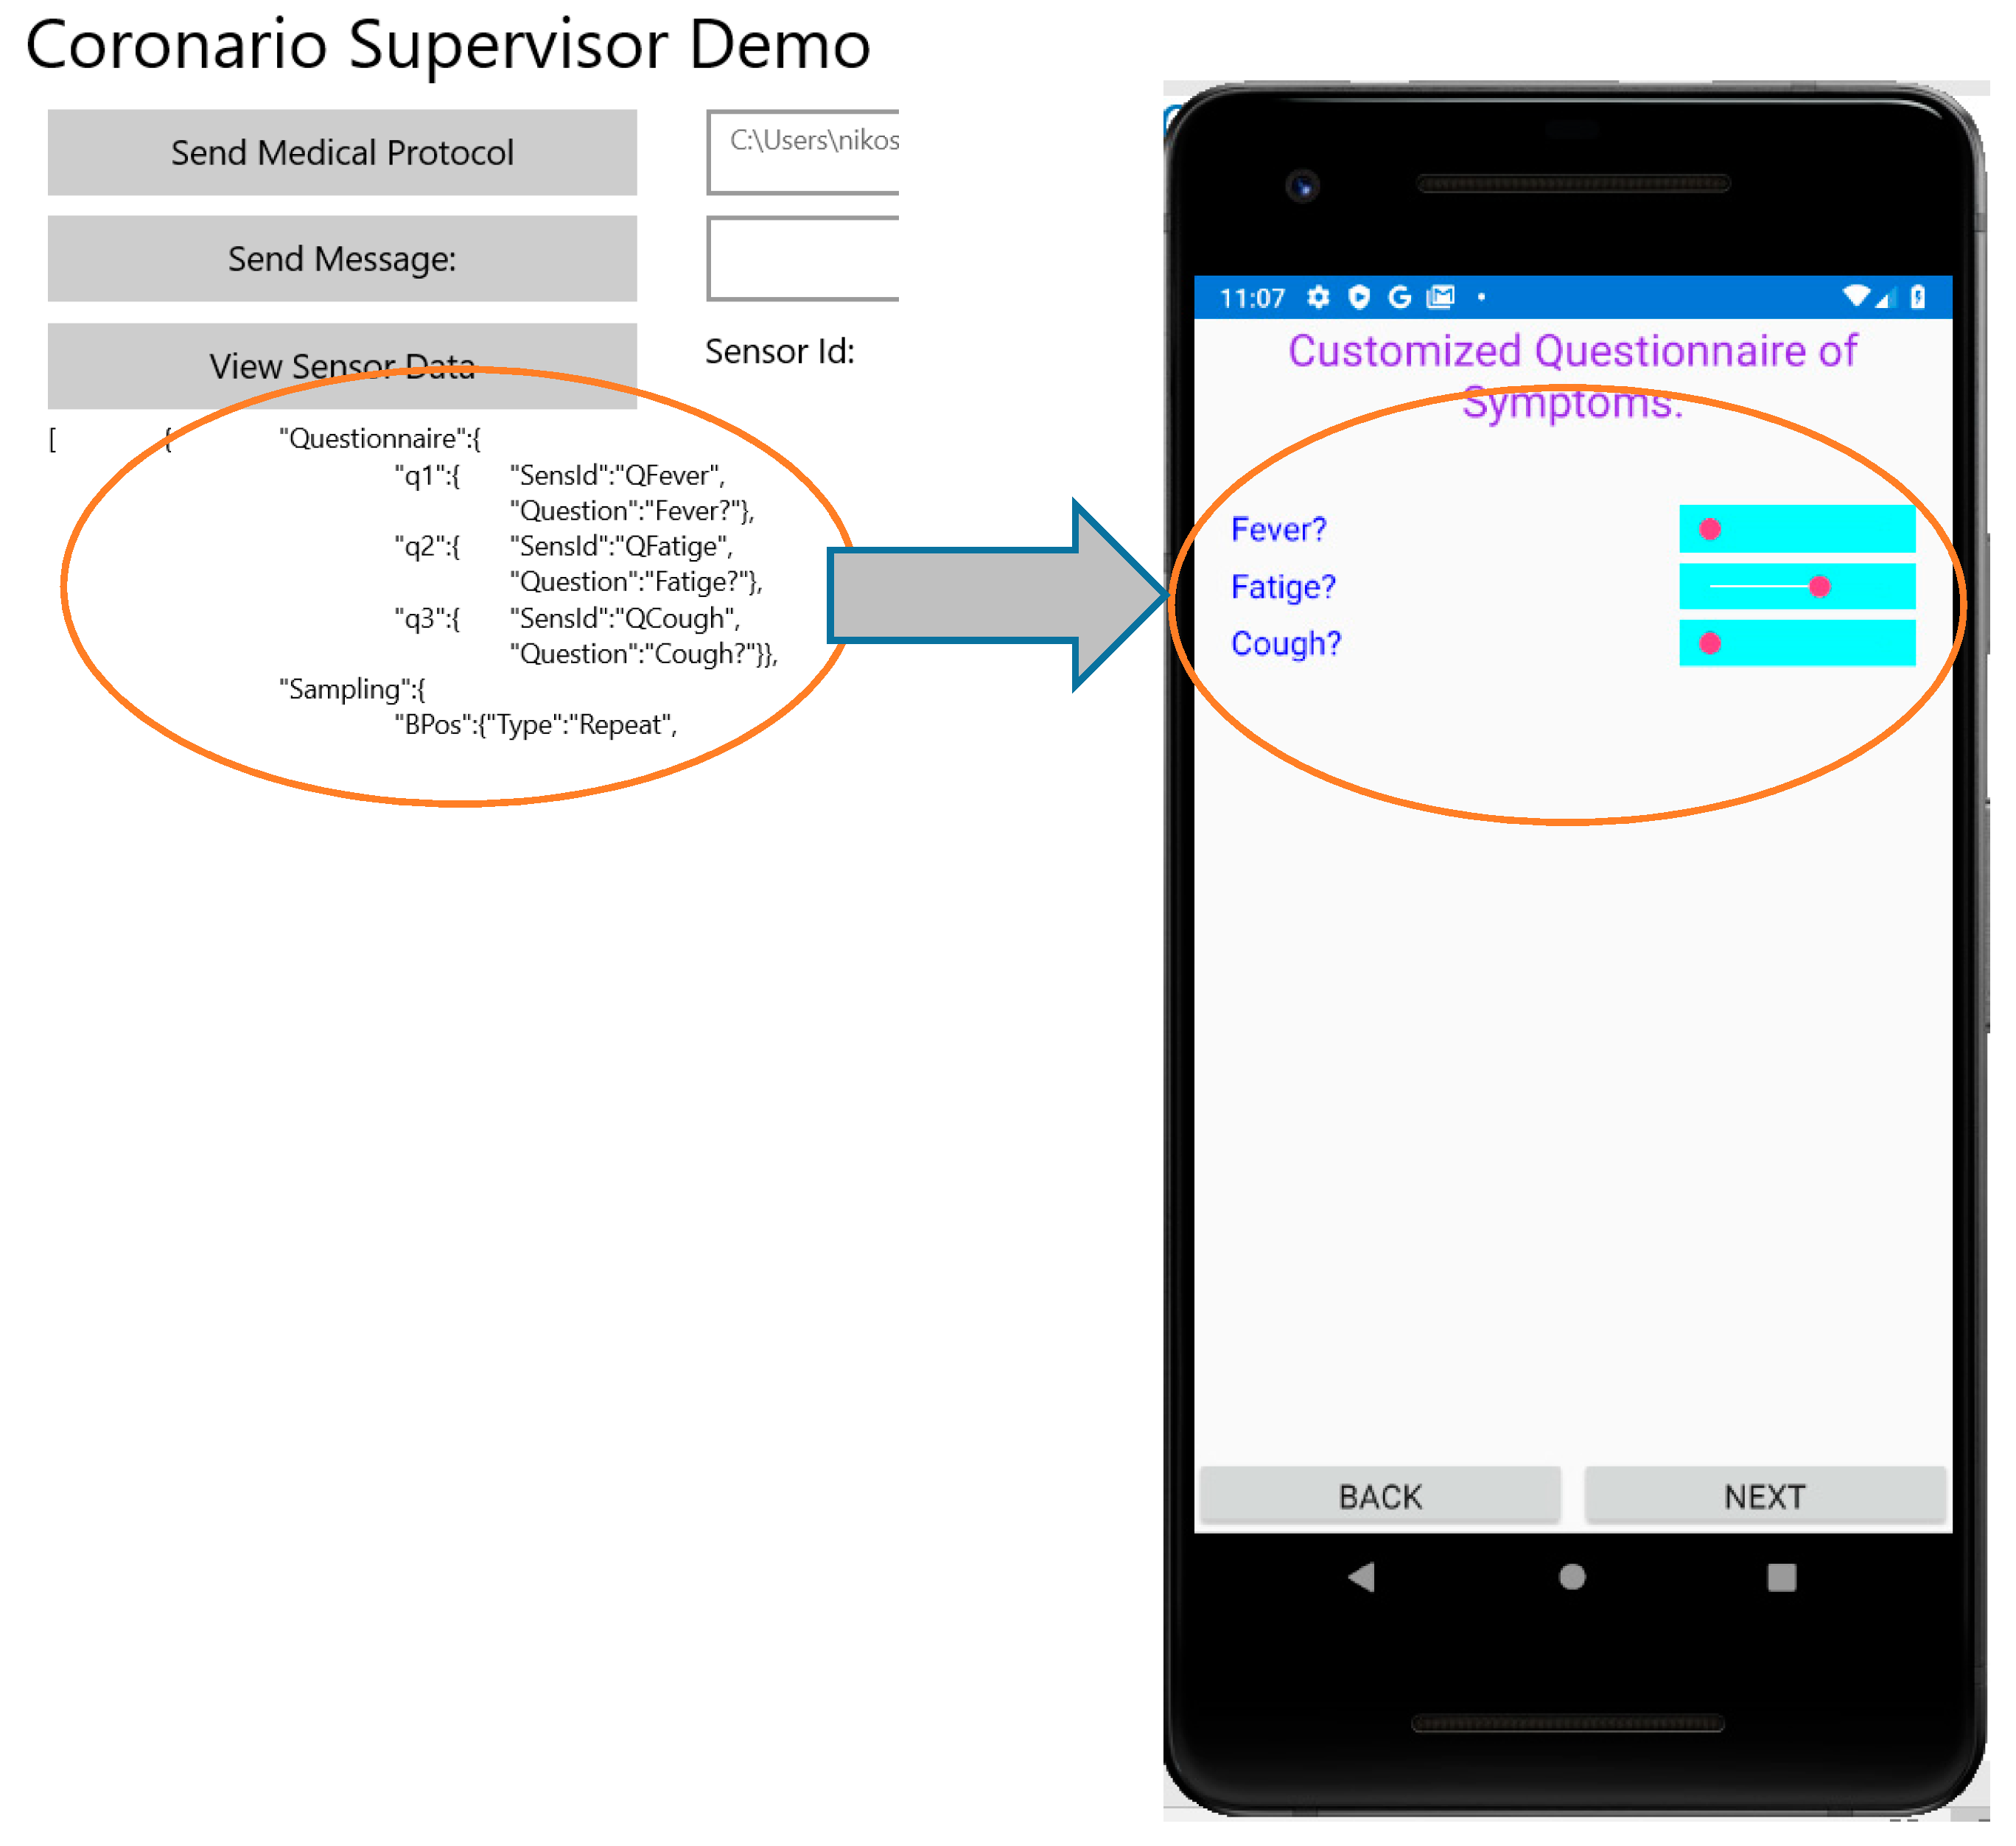
Figure 9.
Converting the Sampling section of the MP file to instructions for the user.

Figure 10.
Sampling scenario for a dialysis patient.

Figure 11.
Sensitivity results corresponding to Table 3.
Figure 11.
Sensitivity results corresponding to Table 3.

Figure 12.
Accuracy results corresponding to Table 6.
Figure 12.
Accuracy results corresponding to Table 6.

Figure 13.
Sensitivity results.

Figure 14.
Accuracy results.


Table 1.
Combinations Tested and Compared.
| Combination Name | Description |
|---|---|
| 1024_s4 | Add, N = 1024, Sm = 4, No filtering |
| 256_s1 | Add, N = 256, Sm = 1, No filtering |
| pca128_2 | Add, N = 1024, Sm = 4, PCA with m = 2 |
| pca128_5 | Add, N = 1024, Sm = 4, PCA with m = 5 |
| maw_15 | Add, N = 1024, Sm = 4, MAW with W = 15 |
| maw_7 | Add, N = 1024, Sm = 4, MAW with W = 7 |
| max1024_s4 | Max, N = 1024, Sm = 4, No filtering |
| max_pca128_5 | Max, N = 1024, Sm = 4, PCA with m = 5 |
| max_maw7 | Max, N = 1024, Sm = 4, MAW with W = 7 |
Table 2.
Initial Categories of the Cough Sound Files.
| Category | Description | Number of Available Files—Training Set |
|---|---|---|
| Child | Cough of a child, male or female, dry or productive | 30–33% |
| Male-Dry | Dry cough of adult male | 66–15% |
| Female-Dry | Dry cough of adult female | 36–28% |
| Male-Productive | Productive cough of adult male | 122–8% |
| Female Productive | Productive cough of adult female | 46–22% |
Table 3.
Sensitivity Results for the Categories of Table 2.
Table 3.
Sensitivity Results for the Categories of Table 2.
| Sensitivity | 1024_ s4 | 256_s1 | pca128_2 | pca128_5 | maw_15 | maw_7 | max1024_s4 | max_pca128_5 | max_maw7 |
|---|---|---|---|---|---|---|---|---|---|
| Child | 0.8125 | 0.8000 | 0.8667 | 0.6667 | 0.7333 | 0.8000 | 0.6000 | 0.7333 | 0.6667 |
| Dry Male | 0.4242 | 0.3636 | 0.4848 | 0.4545 | 0.2500 | 0.2500 | 0.5000 | 0.3636 | 0.5152 |
| Dry Female | 0.5556 | 0.0526 | 0.5556 | 0.6111 | 0.3333 | 0.5556 | 0.7222 | 0.4444 | 0.6667 |
| Productive Male | 0.6818 | 0.0769 | 0.5231 | 0.6061 | 0.5075 | 0.5970 | 0.8788 | 0.9091 | 0.8182 |
| Productive Female | 0.4783 | 0.4783 | 0.4091 | 0.4783 | 0.4783 | 0.4783 | 0.5217 | 0.4783 | 0.6522 |
| Average: | 0.5905 | 0.3543 | 0.5678 | 0.5633 | 0.4605 | 0.5362 | 0.6445 | 0.5858 | 0.6638 |
Table 4.
Specificity Results for the Categories of Table 2.
Table 4.
Specificity Results for the Categories of Table 2.
| Specificity | 1024_s4 | 256_s1 | pca128_2 | pca128_5 | maw_15 | maw_7 | max1024_s4 | max_pca128_5 | max_maw7 |
|---|---|---|---|---|---|---|---|---|---|
| Child | 0.9643 | 0.6714 | 0.8913 | 0.9357 | 0.8714 | 0.8929 | 0.9424 | 0.9786 | 0.9643 |
| Dry Male | 0.9593 | 0.7869 | 0.8333 | 0.8770 | 0.8780 | 0.8862 | 0.9754 | 0.9426 | 0.9590 |
| Dry Female | 0.8551 | 0.9779 | 0.9185 | 0.9051 | 0.8321 | 0.8540 | 0.9412 | 0.9416 | 0.9416 |
| Productive Male | 0.7222 | 0.9111 | 0.8182 | 0.7416 | 0.8068 | 0.8068 | 0.6932 | 0.6292 | 0.7191 |
| Productive Female | 0.9398 | 0.7652 | 0.9313 | 0.9394 | 0.9091 | 0.9394 | 1.0000 | 0.9848 | 0.9697 |
| Average: | 0.8882 | 0.8225 | 0.8785 | 0.8798 | 0.8595 | 0.8759 | 0.9104 | 0.8954 | 0.9107 |
Table 5.
Precision Results for the Categories of Table 2.
Table 5.
Precision Results for the Categories of Table 2.
| Precision | 1024_s4 | 256_s1 | pca128_2 | pca128_5 | maw_15 | maw_7 | max1024_s4 | max_pca128_5 | max_maw7 |
|---|---|---|---|---|---|---|---|---|---|
| Child | 0.7222 | 0.2069 | 0.4643 | 0.5263 | 0.3793 | 0.4444 | 0.5294 | 0.7857 | 0.6667 |
| Dry Male | 0.7368 | 0.3158 | 0.4444 | 0.5000 | 0.3478 | 0.3636 | 0.8421 | 0.6316 | 0.7727 |
| Dry Female | 0.3333 | 0.2500 | 0.4762 | 0.4583 | 0.2069 | 0.3333 | 0.6190 | 0.5000 | 0.6000 |
| Productive Male | 0.6429 | 0.3846 | 0.6800 | 0.6349 | 0.6667 | 0.7018 | 0.6824 | 0.6452 | 0.6835 |
| Productive Female | 0.5789 | 0.2619 | 0.5000 | 0.5789 | 0.4783 | 0.5789 | 1.0000 | 0.8462 | 0.7895 |
| Average: | 0.6028 | 0.2838 | 0.5130 | 0.5397 | 0.4158 | 0.4844 | 0.7346 | 0.6817 | 0.7025 |
Table 6.
Accuracy Results for the Categories of Table 2.
Table 6.
Accuracy Results for the Categories of Table 2.
| Accuracy | 1024_s4 | 256_s1 | pca128_2 | pca128_5 | maw_15 | maw_7 | max1024_s4 | max_pca128_5 | max_maw7 |
|---|---|---|---|---|---|---|---|---|---|
| Child | 0.9487 | 0.6839 | 0.8889 | 0.9097 | 0.8581 | 0.8839 | 0.9091 | 0.9548 | 0.9355 |
| Dry Male | 0.8462 | 0.6968 | 0.7582 | 0.7871 | 0.7484 | 0.7548 | 0.8766 | 0.8194 | 0.8645 |
| Dry Female | 0.8205 | 0.8645 | 0.8758 | 0.8710 | 0.7742 | 0.8194 | 0.9156 | 0.8839 | 0.9097 |
| Productive Male | 0.7051 | 0.5613 | 0.6928 | 0.6839 | 0.6774 | 0.7161 | 0.7727 | 0.7484 | 0.7613 |
| Productive Female | 0.8718 | 0.7226 | 0.8562 | 0.8710 | 0.8452 | 0.8710 | 0.9286 | 0.9097 | 0.9226 |
| Average: | 0.8385 | 0.7058 | 0.8144 | 0.8245 | 0.7806 | 0.8090 | 0.8805 | 0.8632 | 0.8787 |
Table 7.
Extended Set of Cough Sound Categories.
| Category | Description | Number of Available Files (Training Set) |
|---|---|---|
| Child-Dry | Dry cough of a child, male or female | 24 (42%) |
| Adult-Male-Dry | Dry cough of adult male | 42 (24%) |
| Adult-Female-Dry | Dry cough of adult female | 36 (28%) |
| Elderly-Male-Dry | Dry cough of elderly male | 24 (42%) |
| Child-Productive | Productive cough of a child, male or female | 6 (100%) |
| Adult-Male-Productive | Productive cough of adult male | 64 (16%) |
| Adult-Female-Productive | Productive cough of adult female | 16 (62%) |
| Elderly-Male-Productive | Productive cough of elderly male | 58 (17%) |
| Elderly-Female-Productive | Productive cough of elderly female | 30 (33%) |
Table 8.
Comparison of the Referenced Cough Classification Methods.
| Reference | Target | Sensitivity | Specificity | Precision | Accuracy |
|---|---|---|---|---|---|
| Table 3 | Classification in 5 categories (maw7) | 66% | 91% | 70% | 88% |
| Table 7 | Classification in 9 categories (maw7) | 61% | 94% | 64% | 90% |
| [34] | Cough counting Discrimination of cough from noise | 90% | 99.5% | ||
| [35] | -``- | 91% | 99% | ||
| [36] | -``- | 80% | 96% | ||
| [37] | Discrimination of dry and wet coughs | 75% | 77% | 76% |
Publisher’s Note: MDPI stays neutral with regard to jurisdictional claims in published maps and institutional affiliations. |
© 2021 by the authors. Licensee MDPI, Basel, Switzerland. This article is an open access article distributed under the terms and conditions of the Creative Commons Attribution (CC BY) license (http://creativecommons.org/licenses/by/4.0/).
Share and Cite
MDPI and ACS Style
Petrellis, N.; Adam, G.K. Symptom Tracking and Experimentation Platform for Covid-19 or Similar Infections. Computers 2021, 10, 22. https://0-doi-org.brum.beds.ac.uk/10.3390/computers10020022
AMA Style
Petrellis N, Adam GK. Symptom Tracking and Experimentation Platform for Covid-19 or Similar Infections. Computers. 2021; 10(2):22. https://0-doi-org.brum.beds.ac.uk/10.3390/computers10020022
Chicago/Turabian StylePetrellis, Nikos, and George K. Adam. 2021. "Symptom Tracking and Experimentation Platform for Covid-19 or Similar Infections" Computers 10, no. 2: 22. https://0-doi-org.brum.beds.ac.uk/10.3390/computers10020022
Note that from the first issue of 2016, this journal uses article numbers instead of page numbers. See further details here.