1. Introduction and Related Work
Structural health monitoring (SHM) based on Lamb waves, a type of ultrasonic guided waves, is a promising technique for in-service inspection of aircraft structures. The implementation of SHM systems into aircraft applications reduces maintenance efforts as well as overall structural weight. Lamb waves are excited and received using a network of actuators and sensors, which are permanently attached on the structure. Lamb waves are very sensitive and exhibit different wave interaction mechanisms, with structural damages, such as attenuation, reflection, scattering or mode conversion. By analysing the sensor signals, different kinds of structural damages can be detected and located [
1,
2].
Automatic and reliable damage diagnostics using SHM systems is still a challenge, especially in the case of carbon fibre laminate due to their anisotropic material characteristics. Depending on the underlying measuring technique used to retrieve suitable sensor signals that show a sufficient correlation with damage or fatigue features, the recognition of the damage features requires complex analysis with experts knowledge and intervention [
3]. Moreover, damage diagnostics can be an inherently distributed problem [
4] using spatially distributed sensors [
5] still processed by a central instance leading to scaling and efficiency issues. Scaling is limited with such centralised architectures. However, distributed data processing in sensor networks, especially addressing material-applied or material-integrated sensor networks, imposes strict resources constraints of the signal processors both regarding memory and computational power of each unit.
Damage and structural health diagnostics is an inverse problem. A model
M represents a measurement that maps a spatial and time-dependent environmental context
pe(
x,
t) with a feature set
f (e.g., damage class and location) of a device under test (DUT) on sensor signal data
s. The damage diagnostics system requires the inverse model
M−1 that maps the sensor data on the requested features to be monitored (related to another measuring parameter set
pm):
Beside numerical methods (e.g., inverse numeric [
6]), machine learning (ML) can be utilised to derive the inverse model
M−1 from training example data mapping
s on
f. Due to the highly non-linear model function artificial neural networks (ANN) are often used to implement a hypothesis of the required damage predictor function [
7].
The task of structural health monitoring systems is to detect and locate different kind of damages from sensor data which are produced by permanent applied sensors on the structure. Related work can be classified in model-based [
8] and model-free methods. Damage diagnostics with homogeneous and isotropic materials, e.g., aluminium or steel, can be handled with established methods. However, dealing with materials posing complex physical relationship between damages and sensor signals, e.g., by anisotropic and non-linear interaction behaviour, such as in composite laminates, deriving suitable models that map sensor data on state information is a still challenge or still not possible.
The main objective of this work is the investigation of model-free distributed machine learning (DML) under resource and failure constraints (including sensor noise, drift, and fatigue) by using spatial model decomposition and global model fusion strategies. Distributed learning and feature inference gains attraction in recent years to overcome scaling and reliability issues, originally applied in wireless structural health monitoring networks [
5]. Additionally, state-based ML should process time-resolved sensor data, already successfully applied in the field of SHM with guided waves [
9]. The damage diagnostic system is operating in space and time dimension.
Commonly, low-resource and low-resolution approaches used in damage monitoring that can be deployed on embedded computers typical for sensor networks pose only limited and operational constrained damage diagnosis capabilities (with respect to classification and localisation of damages), whereas high-resolution approaches require high computational time and storage requirements, often utilising deep learning and computer vision (CV) [
10]. Deep learning of artificial neural networks (ANN) are often used for SHM [
11]. Base-line approaches either try to derive damage feature by analysing differences between a non-damaged base-line experiment and a device under test or by using more advanced approaches together with ML. Auto-encoders (AE) are candidates to detect anomalies in sensor signals related to damage features that can be derived with deep Learning, basically by modelling multiple levels of visual abstraction (from low-level features to higher-order representations, i.e., features of features) from the sensor data [
11]. In a first step an AE approach encodes a signal. A second step reconstructs (decodes) the signal again. If the AE is trained with ground truth data only it will not be able to reconstruct a signal containing differences due to anomalies (the feature to be detected), e.g., a damage that modifies a sensor signal. Comparing the reconstructed signals with the original signal enables damage detection without a supervised training with labelled data.
The proposed ML architecture should be suitable for processing on low-resource embedded computers such as material-integrated sensor nodes of a sensor network [
12]. Ideally, a node of the sensor network processes only local sensor data and performs local damage diagnostics. The damage predictor functions have to be highly discriminative with respect to noise and varying operational and measuring conditions [
13]. There are two levels of prediction, i.e., feature extraction from the sensor signals: 1. The classification of damage and non-damage cases; and 2. The prediction of the spatial properties. In principle, there is a third level that classifies the damage class and its cause. This level is not addressed in this work.
Typically, the predictor functions are derived by supervised learning and sensor data derived from experiments with a defined and fixed parameter set of specimen geometry, actuator configuration and measurement setup, i.e., excitation frequencies, frequency filters, sensor scan grid as well as damage type and position [
13]. Operational variance (e.g., temperature and humidity) have to be considered, too (contained in the parameter sets
pe and
pm). One major challenge is training of the predictor functions with limited variance of training data, concerning the variance of experiments of a single set-up to cover typical measuring and specimen variations (i.e., repetitions of experiments under same conditions with the same parameter set for the device under test, damage, and the measuring set-up) and the variance of experiments and the respective features (i.e., different damage cases, classes, positions, sensors, environmental conditions). This limited training data results commonly in a lack of required generalisation of the prediction model that cannot be transferred to a broader range of parameter sets and unknown specimen configurations.
Two different approaches are compared in this work, which are finally fused to a hybrid system: A multi-instance low-resolution and a single-instance high-resolution architecture differing in resource requirements and the training class (supervised versa unsupervised learning, respectively). Common to both approaches is the deployment of state-based recurrent ANN (RNN) processing time-resolved sensor signal data from a spatially bounded context (i.e., local sensor data processing). The low-resolution approach should be capable to be used in structural applied (material-integrated) sensor networks (i.e., SHM at run-time), whereas the high-resolution approach can be primarily used for laboratory diagnosis or at service-time. On one hand the high-resolution approach delivers an assessment base for the low-resolution approach, on the other side the low-resolution approach can be used as a fast approximating region-of-interest feature marker for the high-resolution system.
Given recent advances in sensor technologies and micro-system integration this article proposes that a robust, yet simpler, real-time capable and low-resource, distributed machine learning approach is now available for accurately estimating damages in hybrid materials compared to conventional sensor analysis and deep learning approaches.
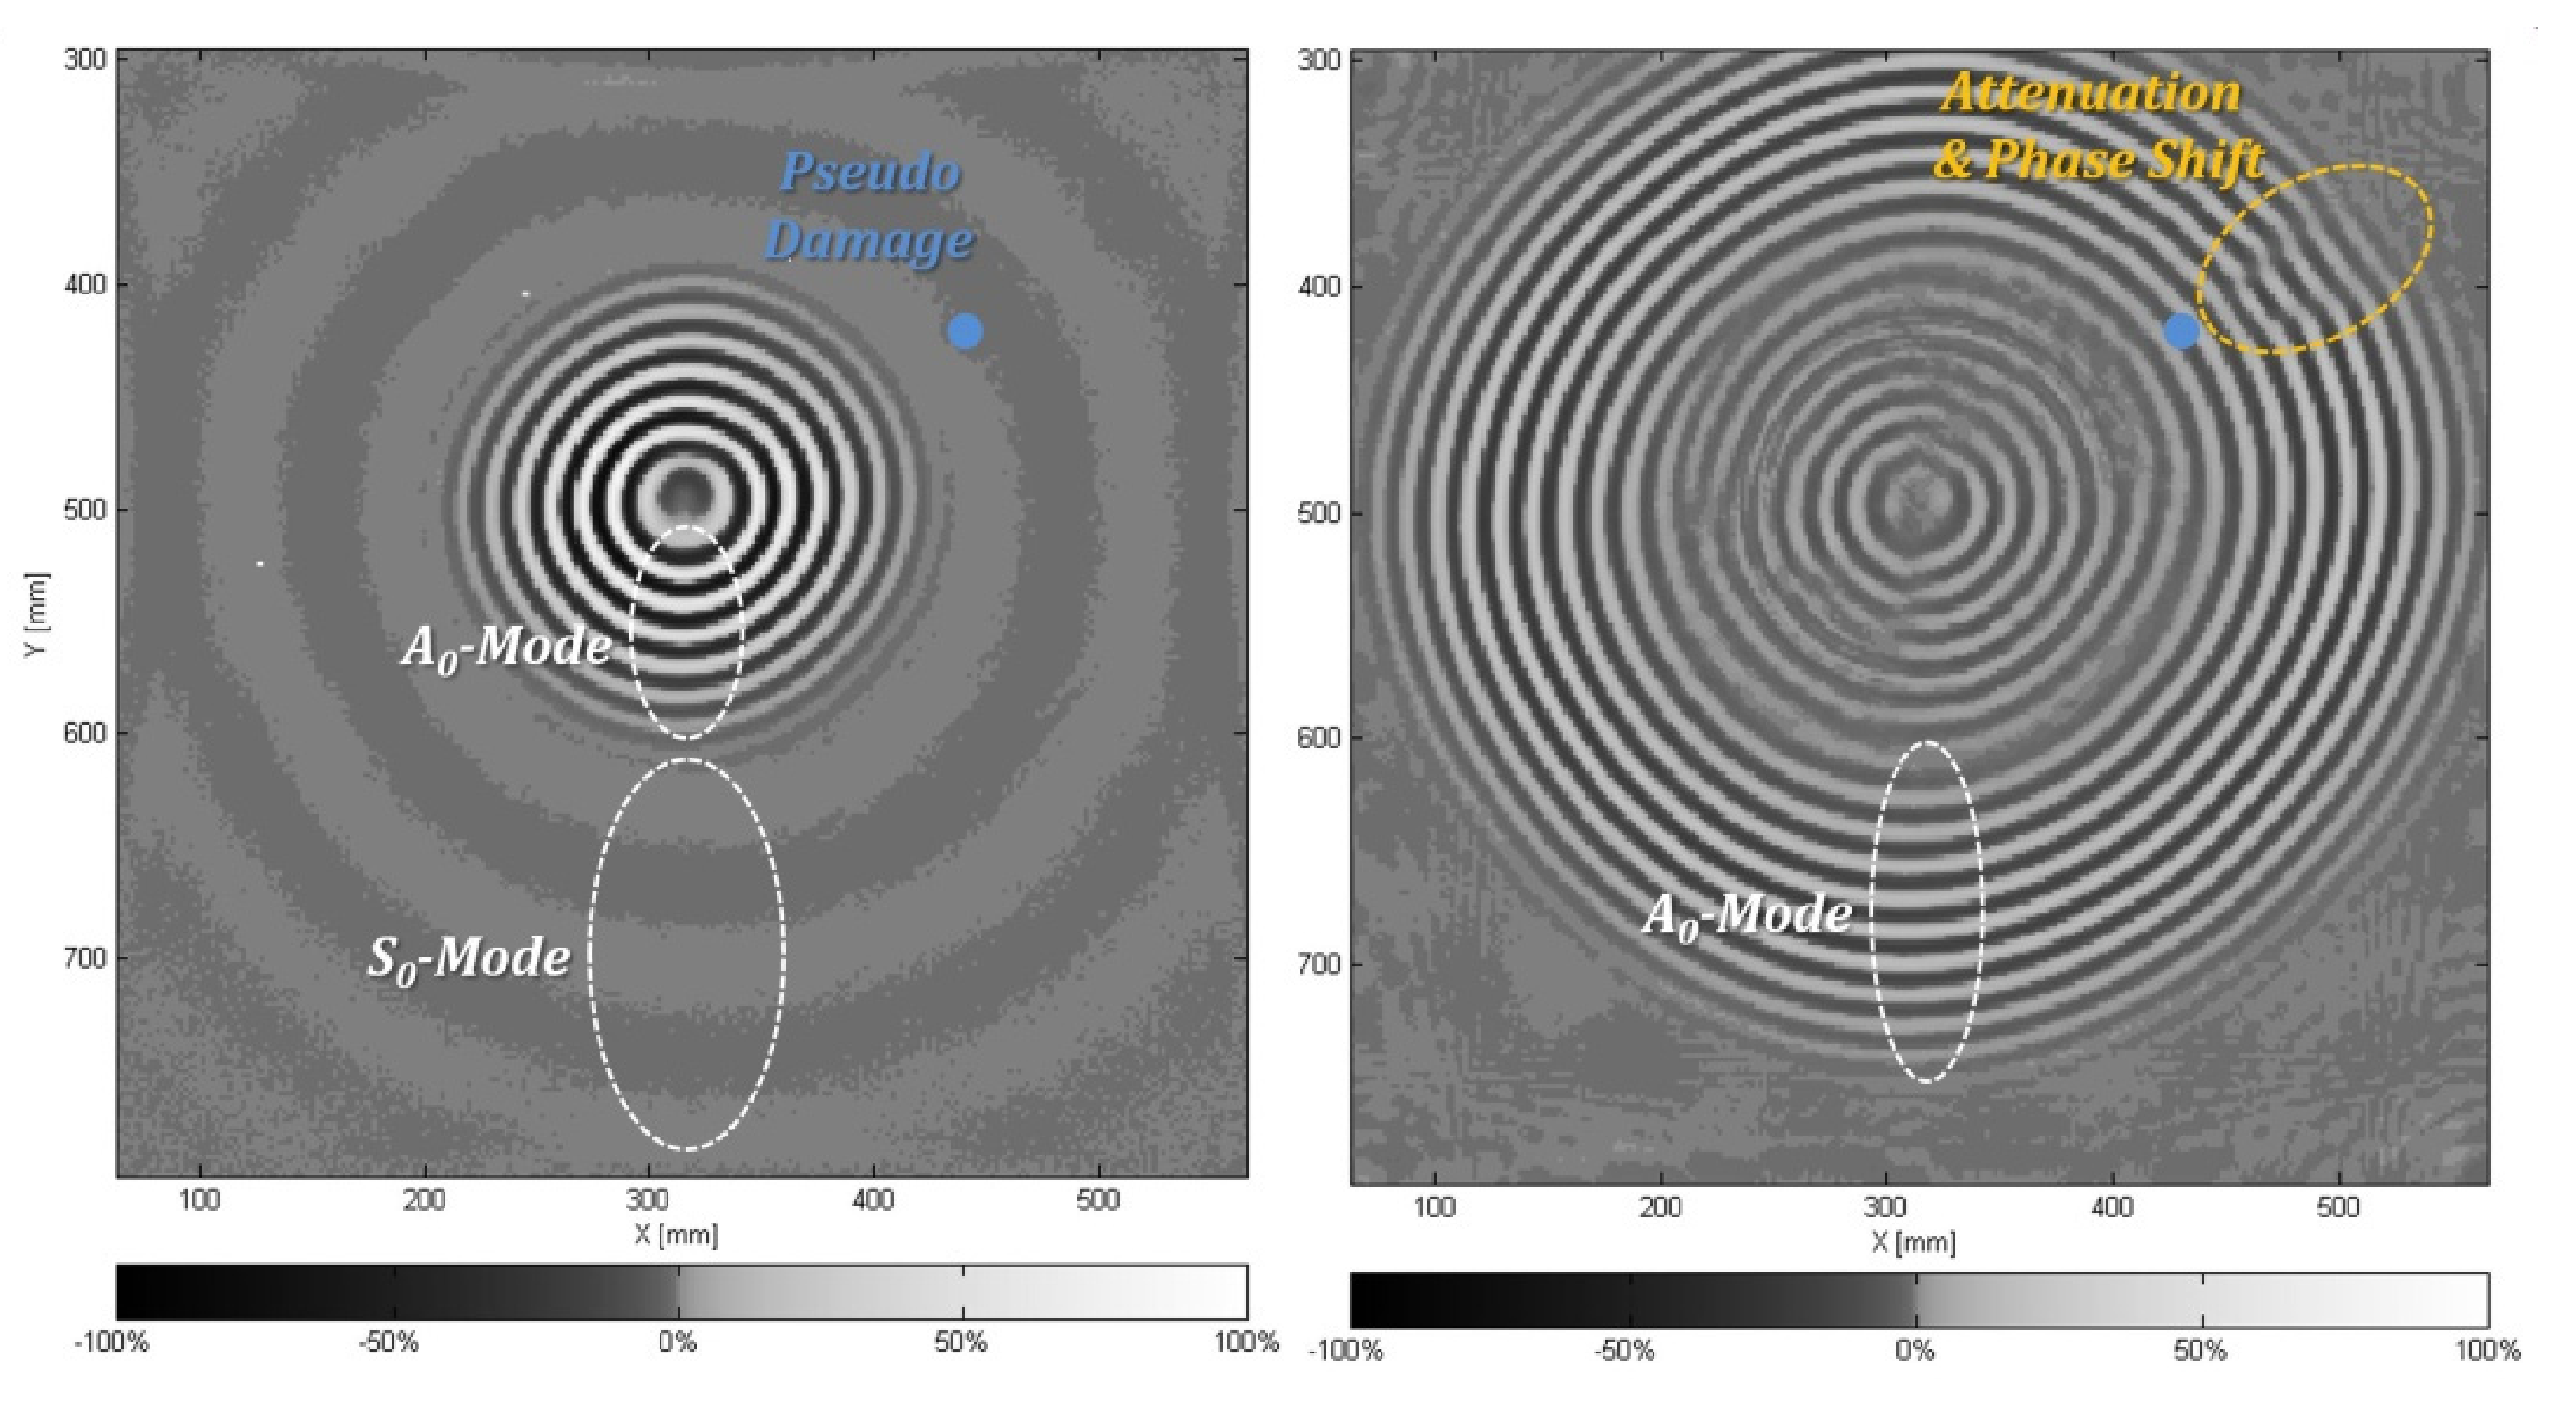
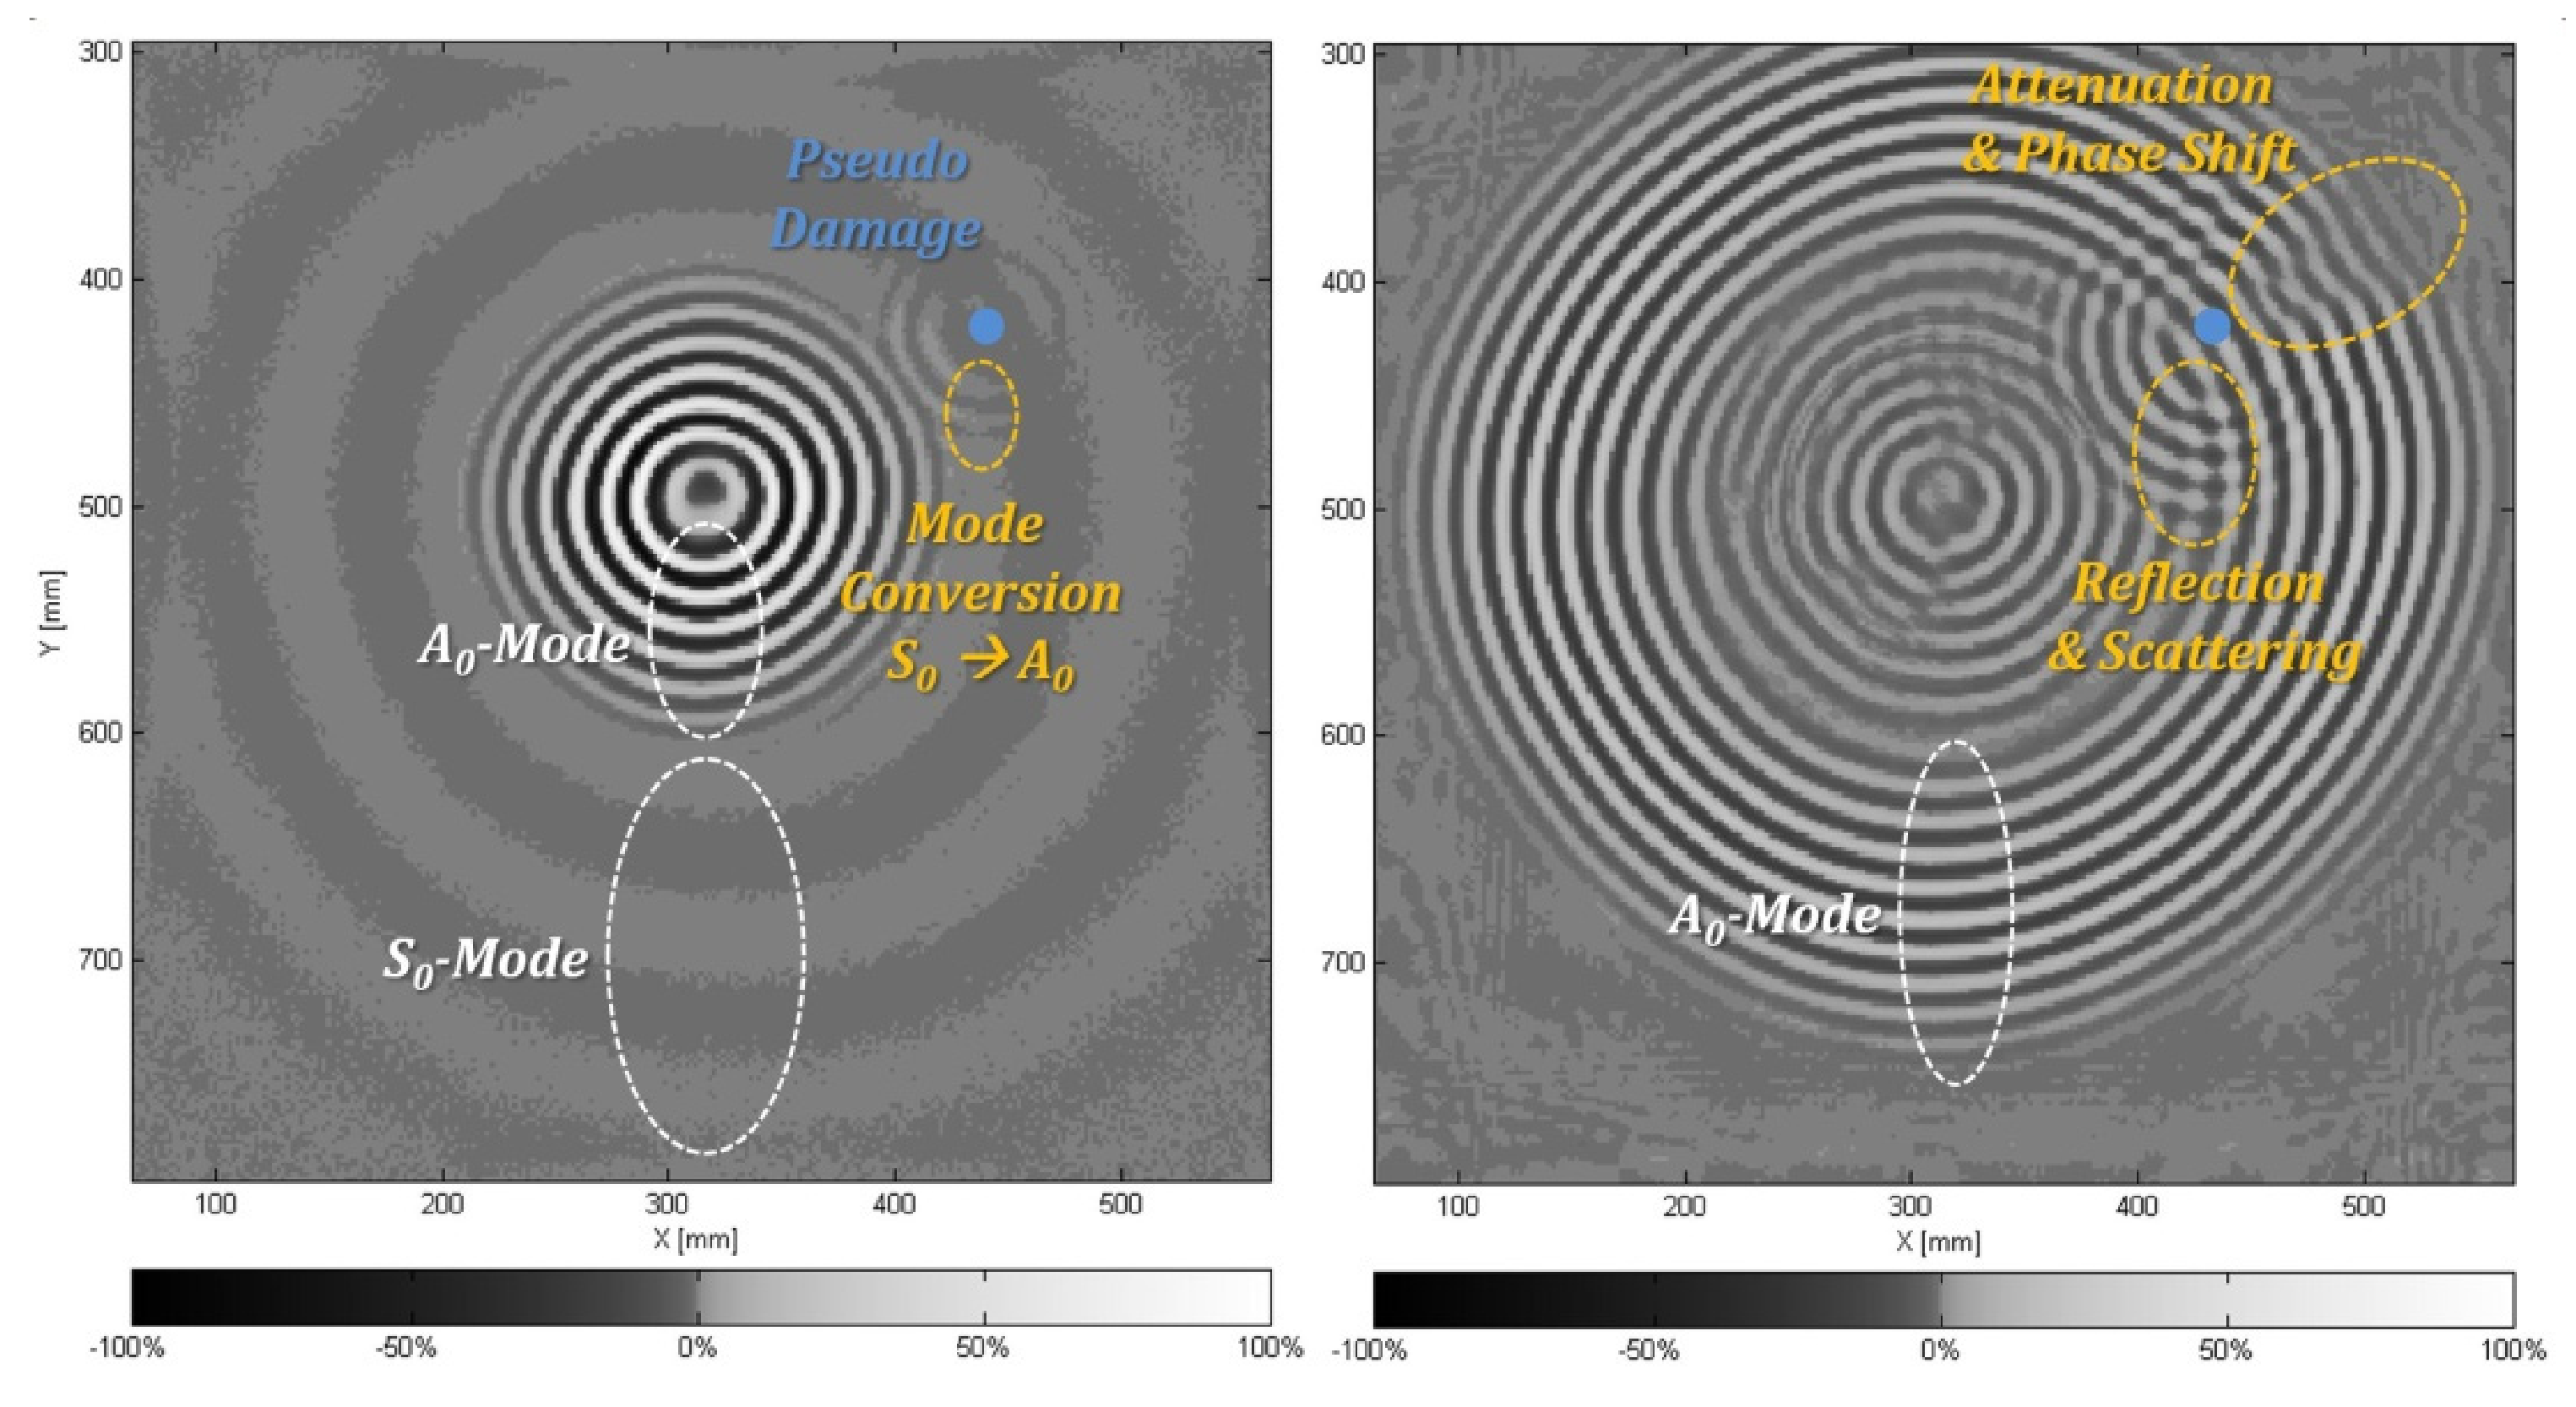
SHM based on Lamb waves and ultrasonic measuring techniques enables the detection of different kinds of structural damages and their localisation [
1,
2]. However, the presence of at least two Lamb wave modes (symmetric modes,
S0,
S1,
S2, …, and anti-symmetric modes,
A0,
A1,
A2,…) at any given frequency, their dispersive characteristic and their interference at structural discontinuities produce complex wave propagation fields. Due to the complex wave fields, conventional algorithms are reaching their limits for robust damage detection and localisation with the application.
In order to develop new damage detection algorithms based on machine learning the experimental air-coupled ultrasonic technique is used. With this technique the Lamb wave propagation field can be measured at any position of the structure. The measured wave propagation at a given position is used as sensor data for damage detection. The machine learning approaches require high amount of experimental data sets with different damage types and locations. Therefore, different removable pseudo defects are developed which can be applied to different locations of the structure and generates comparable wave interactions such as real structural damages.
In the next sections the basic requirements for signal data processing and ML are presented, including a description of the origin of the sensor data and the physics of wave propagation relevant to understand damage detection. Furthermore, the present paper contains two main sections, one for each ML architecture and training approach. Finally, both approaches are compared and fused to a hybrid architecture (although, more as an outlook).
2. Machine Learning and Sensor Networks
2.1. Feature Selection and Extraction
Feature selection and extraction is the process to derive meaningful information related to a target variable y from sensor data related to the observation variable x. Therefore, any feature selection can be represented by a generalised function Ω(s): s → f. There are input data features and target variable features to be distinguished.
The process of input feature selection is typically related to sensor data pre-processing that transforms and reduces the raw sensor data s to relevant information sf = x contained in the signal s with respect to target variable y (defining the input vector x), e.g., using time-frequency transformation to get selected frequencies from the signal, the variance of the signal or other signal features.
In this work there are spatial and temporal relevant features that have to be selected to perform the final feature extraction that delivers damage feature vector
F = ⟨𝔻, ℙ⟩ (categorical damage classification 𝔻 and estimation of the spatial position of the damage ℙ), related to the target variable
y. The signal feature selection is performed in this work primarily by a wavelet analysis of the time-resolved sensor signals, discussed in
Section 5.2.
The target output feature extraction (damage classification and estimation of the spatial position of the damage) is then performed by the model function M−1 introduced at the beginning and derived by machine learning (using the pre-processed input data features).
2.2. Taxonomy of Architectures
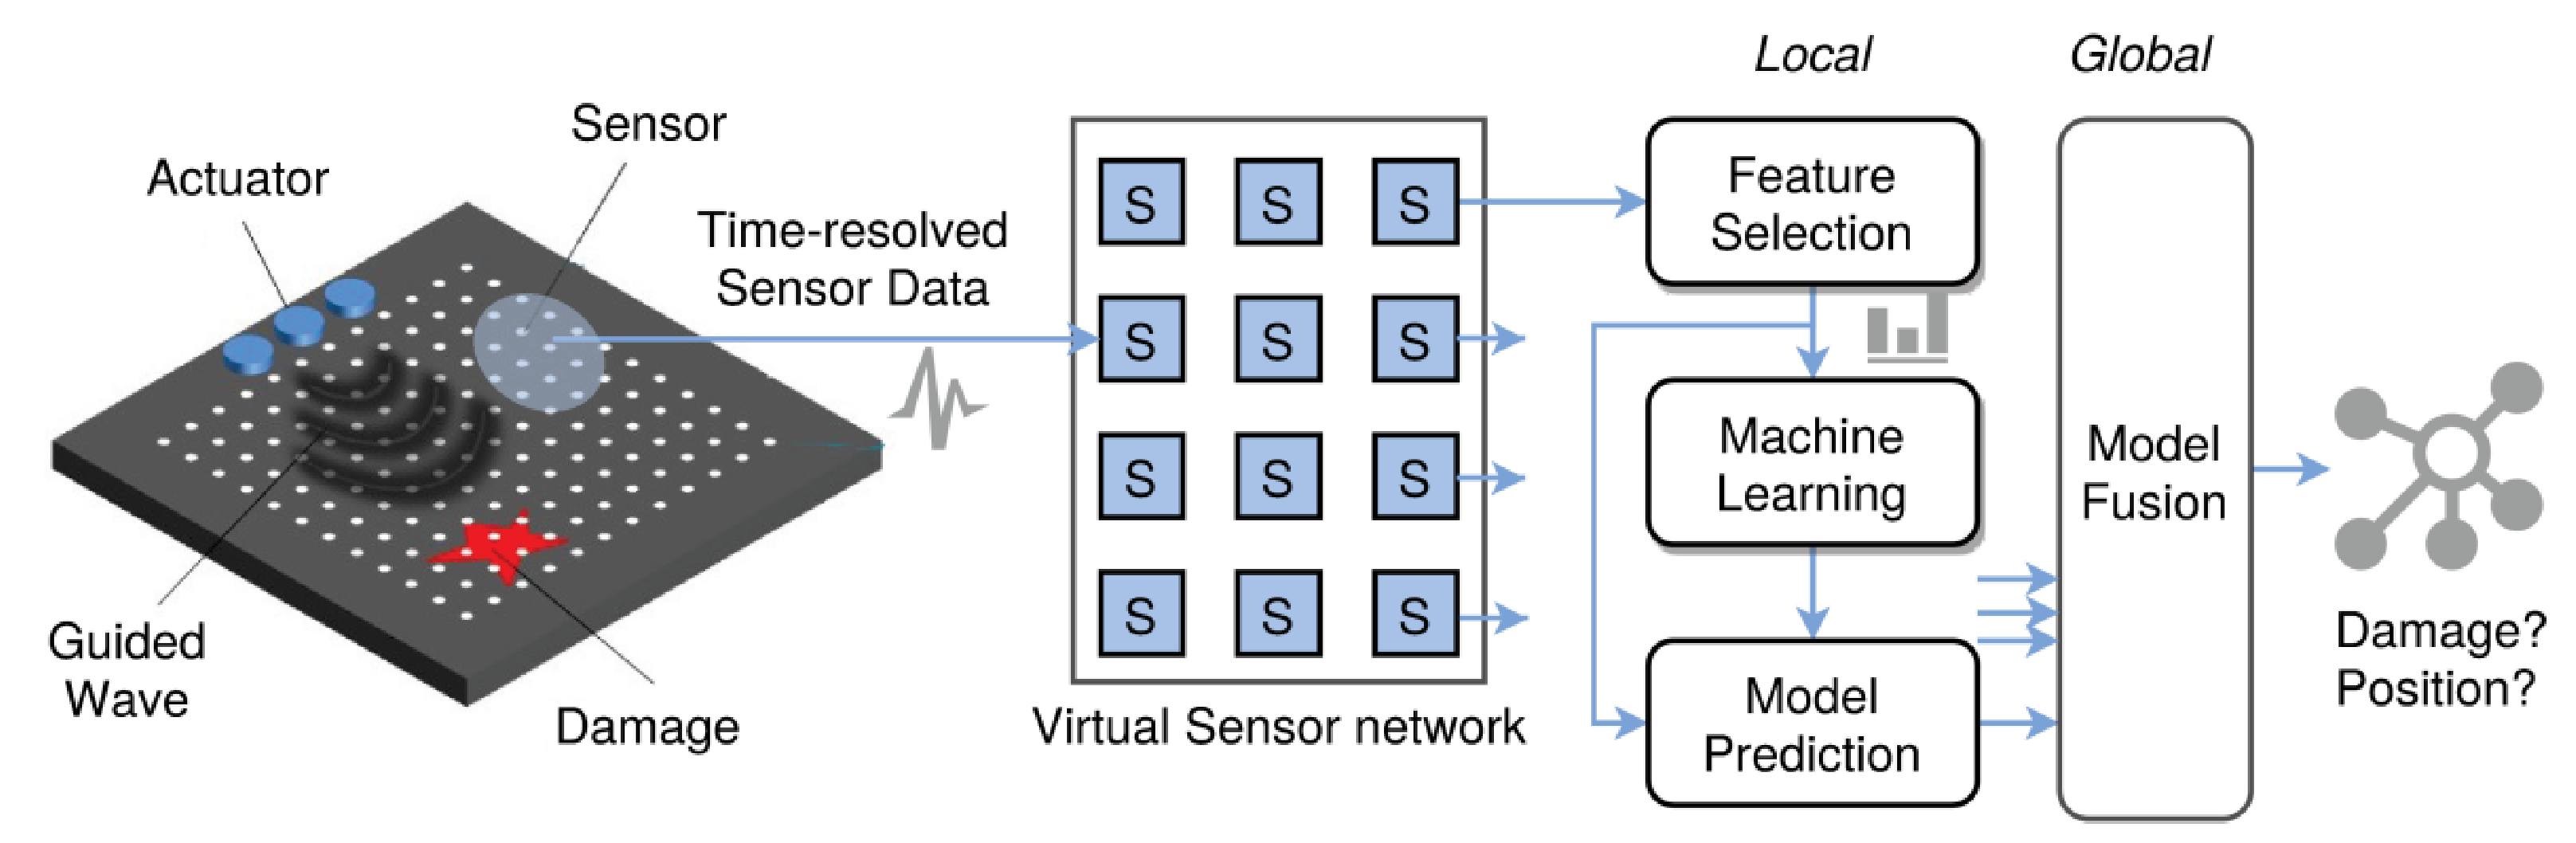
It is assumed that there is a sensor network SN represented by a graph G = ⟨𝕊,ℂ⟩ that consists of numbered (i,j) and identifiable sensor nodes S(p)i,j ∈ 𝕊 each at a different spatial position p = (x,y) providing at least one time-resolved sensor signal s(t). The sensor nodes can communicate with each other via a network structure (vertices of the SN graph) with connections comij,kl ∈ ℂ.
There are basically two main strategies of sensor data aggregation and sensor network architectures for machine learning that can be deployed to derive a feature vector F of the device under test (DUT) from the sensor data matrix D, i.e., the target variable y related to the global state ST of the DUT:
Global Learning
Inference by and training of a single predictive model instance
M using a spatially collected data record series
D(
t) sampled at a certain time
t (or averaged over a time interval) that is processed by a central processing instance (one processing node). The single instance directly delivers the global feature vector
F related to the global state
ST.
Local Learning with Global Fusion
This is the inference by and training of
n ×
m multiple predictive model instances μ
i,j (distributed model ensemble) related to sensor nodes
Si,j with local sensor data processing. Time-resolved local sensor data series
di,j(
t) at a specific spatial position
p(
S) of node
Si,j is processed by each instance of the ensemble locally and independently. Each instance estimates a local state
st and delivers a local feature vector
f(
p)
i,j. All local states are finally fused to a global state
ST delivering a global feature vector
F by a fusion function Φ(
μ1,1,
μ1,2,…,
μn,m) with index
n and
m as the number of nodes in each dimension.
Both architectures are compared in
Figure 1. Global fusion of a predictor function estimating the global state from an ensemble of local prediction or classification models related to a local state can be performed by probalistic methods, negotiation, majority election, and in the simplest case by spatial averaging. The fusion strategies used in this work are discussed in the
Section 4 and
Section 5.
These two learning architectures can be further classified in training and application sub-architectures, leading to a classification scheme based on multi-instance (M) and single-instance (S) training (T) and prediction/inference (P) classes (similar to Flynn’s computer architecture taxonomy based on stream classification):
STSP
A single learning instance with global input data processing and global output state prediction is used for training and prediction.
MTMP
Multiple learning instances with local input data processing and local output state prediction are used for training and prediction. This is the first ML architecture class considered in this work. The global state prediction is performed by fusion of the output of the individual learning instances.
STMP
A single learning instance with global input data processing but local output state prediction is used for training and replicated multiple instances with local input data are used for application. This is the second architecture considered in this work.
MTSP
Multiple learning instances with local input data processing and local output state prediction finally fused to one global model instance.
Fusion can be classified in input data, model, and output data fusion. Input data fusion is used typically on a global learning (STSP) level, model fusion is the transformation and reduction of multiple trained models to one generalised global model (MTSP), and output data fusion is the fusion of the multiple local state predictions to one global state prediction (MTMP/STMP). Model fusion can be used to increase the prediction accuracy and/or to combine local prediction models to one global prediction model.
There is no sensor interaction in terms of communication; the distributed sensor signals are correlated by the wave propagation. A single sensor node processes only its local sensor and passes the pre-processed data to its local learning instance only predicting the local state (e.g., a damage nearby), discussed in the next sections.
2.3. Generalization
With respect to supervised learning, training data T = 〈D,Y〉 is used for learning (sensor data with target variable association). Testing a trained model is performed by statistical error analysis of:
Therefore, experimental and simulation data must be split in training and test sets.
The test has to evaluate:
A major problem with machine learning is the tendency to a weak generalization of the model, i.e., only a specialised model was derived:
The learned model can accurately represent the training data, but not the test data (special model)
The learned model depends on geometric or temporal variables, such as the measuring location or signal phase/time offset
The prediction region, i.e., local vs. global models.
The cross-validation test can be used during the training phase to adapt training parameters, to select a sub-set of model instances trained separately and with Monte Carlo simulation in case of single-instance learning, and in the case of multi-instance learning to select bad instances for progressive post-training.
2.4. Sensor Processing
The sensor data processing and data flow consists of the following processing stages, shown in
Figure 2, finally delivering the damage prediction results:
Recording of the experimental sensor data (laboratory) and uploading the raw data to a file server;
Decoding of the raw data and storing the raw measurement data in a SQL database (numeric format with hierarchical record tables);
Reduction of measurement data in time and spatial dimensions (Down sampling);
Sensor feature selection, i.e., mapping of raw sensor data on relevant feature variables (e.g., by using FFT, discrete wavelet transformation, etc.);
The generation of the input data for predictor model training and inference, i.e., scaling, filtering, transformation, and reduction;
Supervised learning: Training and test data are needed either from experiments or simulation with sensor data associated to the appropriate target variable values (process of labelling);
Unsupervised learning: Only test data consists of sensor data associated with the appropriate target variable values (labelling) for model evaluation and optimization of the learning process;
Damage feature extraction by inference using the learned predictor model functions.
Central part is an advanced SQL data base server. The SQL data base stores all experimental and computed data including ML models. The SQL data base can be accessed by a SQLJSON remote procedure call interface. The SQLJSON-RPC provides request-reply communication (e.g., SQL queries) via a JSON code and data format. SQLJSON-RPC supports micro-code execution for complex operations send by the requesting client and executed by the server. The SQLJSON-RPC APi is an overlay software layer on top of a generic SQLITE data base API. Finally, the SQLJSON service provides a virtual file system layer that maps files and directories containing data and meta data files on tables, which can be requested such as any other SQL table. To support typical data set in numerical matrix format, hierarchical data set tables were added (organising data sets similar to HDF5 structure with data types, data spaces, meta data, and automatic matrix type conversion). There is a dedicated SQLDS API with support for packed arrays on top of SQLJSON to support access of data sets (and mapping on generic SQL tables).
2.5. Computational Complexity and Resources
Dealing with large volumes of data is a challenge with respect to the spatial and temporal dimension. Even in case of single guided wave measurements there is a significant volume due to the time-resolved recording of the sensor signals. The spatial dimension of sensor data determines primarily storage requirements, whereas the temporal dimension determines the computational time. Computing time and storage requirements differ significantly in the different stages and phases of data processing and predictor model function training and inference:
Phase I. Acquisition and processing of sensor data: Computational time is dominated by communication time, storage is mainly related to the original sensor data size and the communication network;
Phase II. Preprocessing of the data (feature selection): Computational time is medium and closely related to the feature selection and transformation algorithms; storage depends still on original data size;
Phase III. Generating of predictive models and training (with partial testing of model quality): Computational time and storage depends significantly on the used model implementation and its structure (function, directed graph/tree, neuronal networks), and computational time depends additionally on the training algorithms and the processing of the training data instances (single vs. batch vs. monolithic instance processing);
Phase IV. Test of the trained models: Computational time depends on the model size/structure, its functional complexity, and on the number of data instances, but there is no significant increase of storage;
Phase V. Inference/application to unknown data (incorporates Phases I/II, too): the same as Phase IV.
Parellelisation of distributed multi-instance learning (MM or MS class) at process—or node level (basically on control path) is possible:
All local learning instances are independent posing high computational effort that can be parallelised;
Synchronisation and merging of local data is required only by global model fusion that is a simple task with low computational effort;
Parallelisation can be applied on one central computer as well as in the distributed sensor network;
Speed-up S ≤ 15 with a central computer (2 CPU Sym. NUMA, 8 cores/CPU, L3 Cache ≥ 15 MB);
Speed-up S < N with N distributed sensor nodes (sensor data locally).
Parallelisation of single-instance learning is partially possible if there is a globally trained and generalised model that can be applied locally bounded regions of data or single sensors in the best case (SM class), i.e., a predictor functions that marks and amplifies local features from the sensor signal (posing high computational effort). Global fusion by object and pattern recognition (e.g., point density computations) or by negotiation and consent algorithms can be classified in low and mid computational classes and can be commonly neglected.
The resource and computational time requirements of both diagnosis architectures are evaluated in the respective sections.
4. Multi-Instance Learning with Multi-Instance Prediction (MTMP Class)
In this section the first low-resolution and low-resource approach using multi-instance learning of a damage predictor function is introduced. In a first attempt, the raw sensor data is processed by a virtual sensor network on a generic computer. The results can be mapped directly on a real sensor network.
4.1. Concept
The damage diagnostics processing the raw sensor data uses the following key methods:
Supervised multi-instance learning by a virtual sensor network (8 × 8 nodes) processing local time-resolved sensor data derived from the experimental measuring data;
The output of the local supervised learning is a predictor function that have to detect a damage in the near region around a sensor (continuous output in the range [0,1] with binary threshold classification);
The predictor function is implemented by a state-based recurrent ANN with LSTM cells by using a JavaScript Ml framework integrating an improved Neataptic ANN [
18], the network configuration is [1,4,6], i.e., 4 input neurons, 6 LSTM cells, and one output neuron;
The global fusion of all local damage predictor function outputs approximates the spatial damage position (if any) within the boundary of the sensor network supporting position interpolation.
The principle experimental and data analysis set-up is shown in
Figure 7. All computations were performed in JavaScript either by a WEB browser (SpiderMonkey VM) or by using node.js (V8 VM).
4.2. Feature Selection and Network Architecture
Down sampling of the raw sensor signal (approx. 4000 Samples on the time axis) with a 1:10 ratio (sampling every n-th sample)
Spatial data reduction at the location of a virtual sensor s(x,y) by using a 2 × 2 pixel field that is reduced to one virtual sensor (spatial mean averaging)
Temporal down sampling of the reduced sensor signal 1:4 (temporal mean averaging)
Discrete wavelet transform (DWT with Debuchet-1 function) LP/HP filters (4 levels with Up-Sampling) [
16,
17,
19].
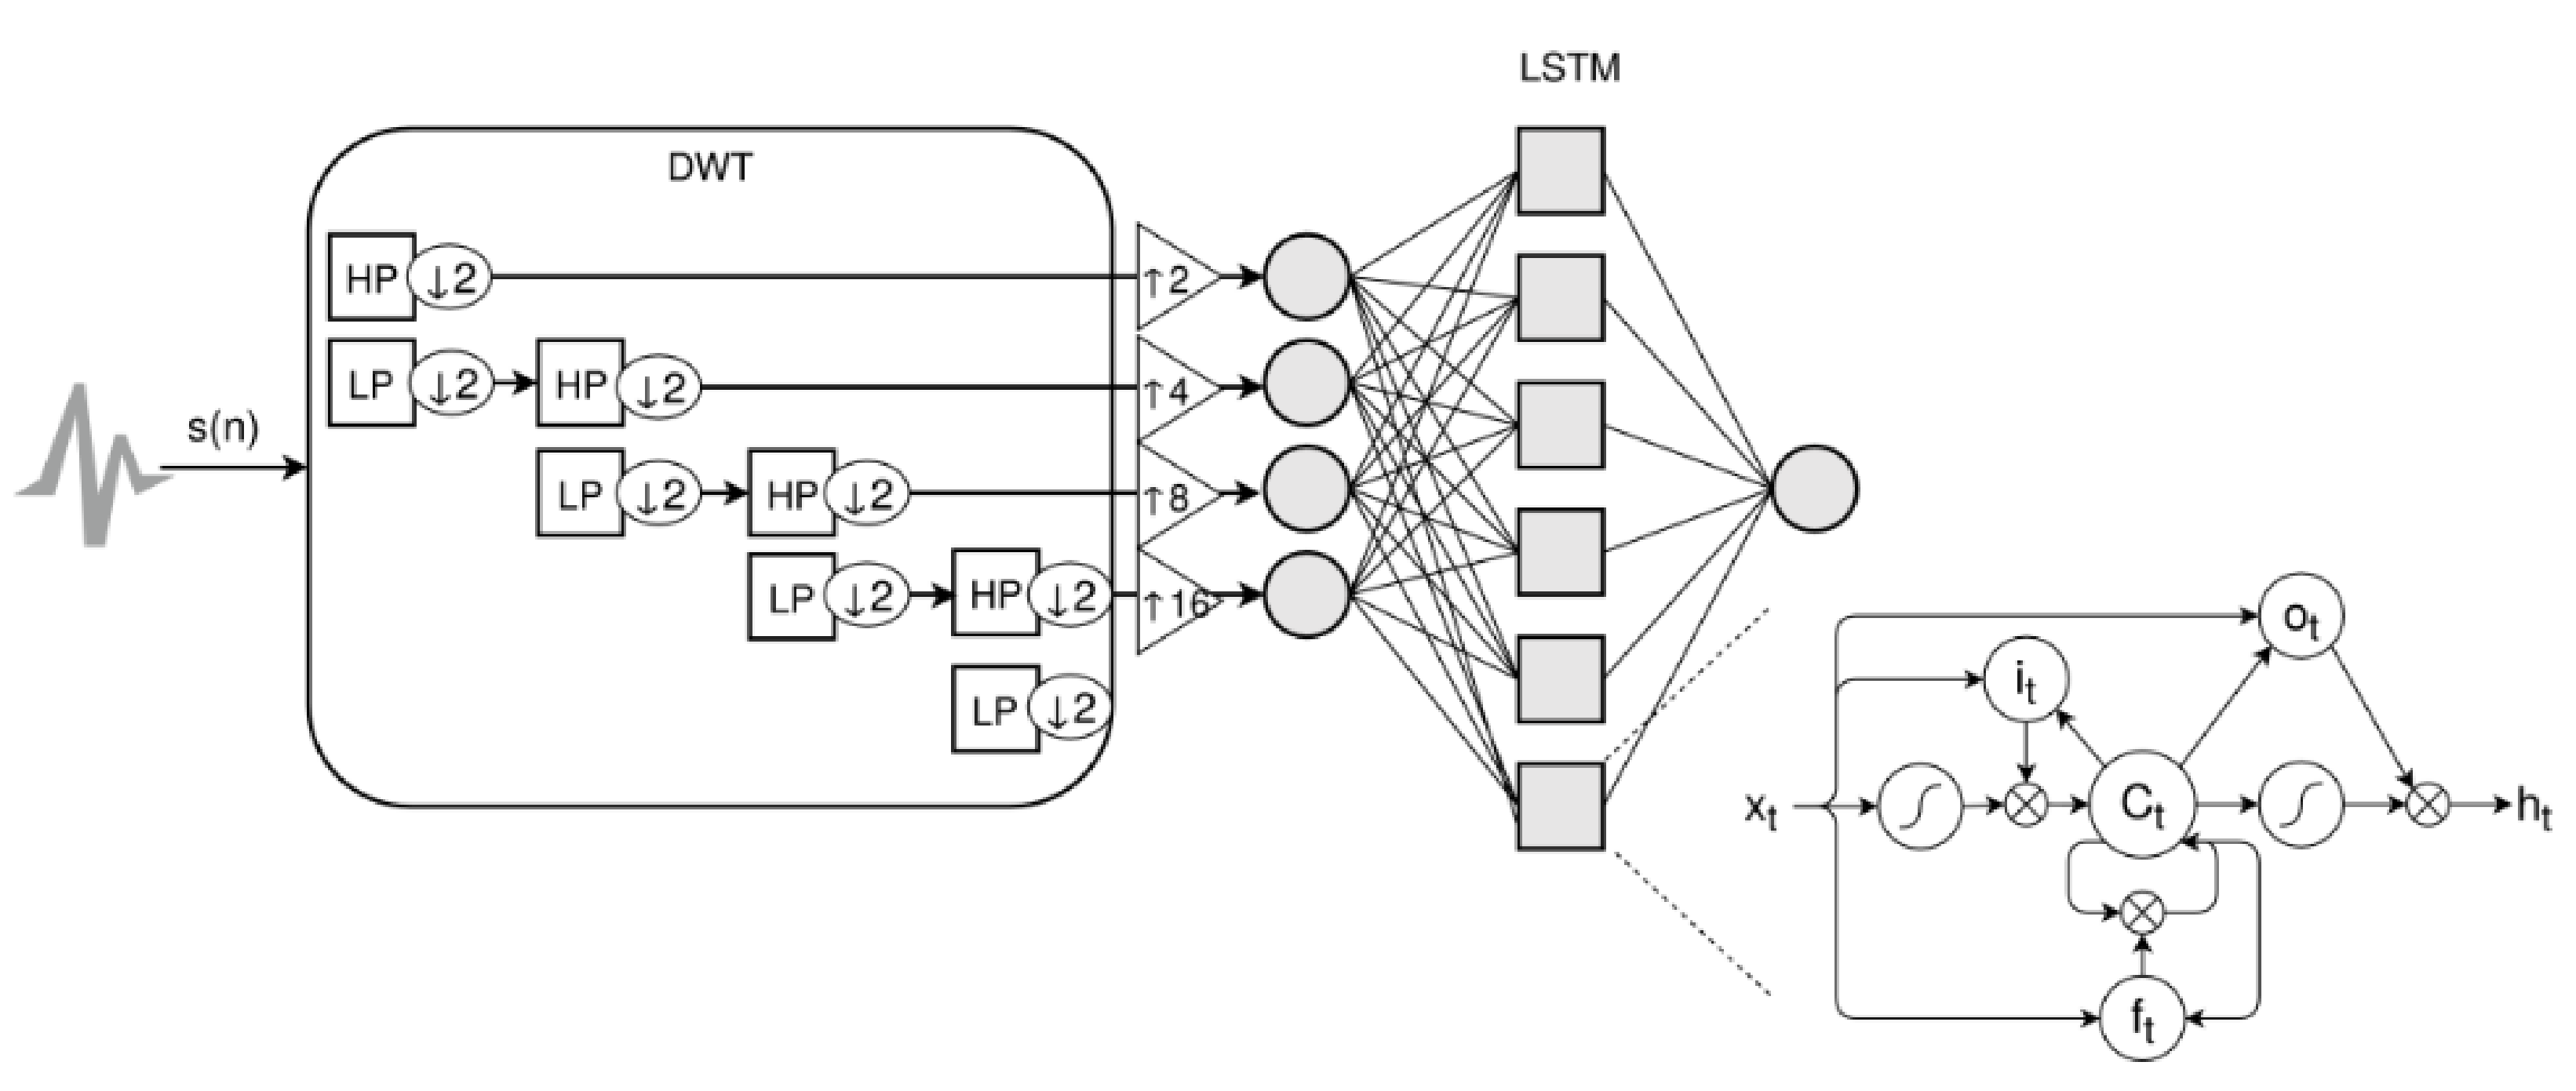
The feature selection process and the basic ANN architecture is shown in
Figure 8. Typically, the levels 3–5 contain relevant signal features. Each level of the DWT consists of a low- and high-pass filter providing the approximation and details of the signal, respectively, providing a good time-frequency analysis [
17]. The approximation is the input signal of the following next level, the detail signal is the input for the ANN. Each level of the DWT reduces the sampling frequency by two (down sampling), i.e., at the output of the DWT filter a sampling expander (up sampling) is required for each level to equalise the sequence length of each input signal.
The recurrent state-based ANN structure consists of n input neurons with sigmoid transfer function (one for each DWT decomposition level used), a hidden layer of Long-short term memory cells (LSTM), and one output neuron with an output range of [0,1] (also sigmoid transfer function). A value nearby 1 represents the detection of a damage in the surrounding region around a sensor.
There are many different LSTM cell architecture around. We are using the LSTM cell implementation from the Neataptic ML framework [
18], shown on the right side of
Figure 8. Central part is a state cell (
Ct) surrounded by different gates (input
it and output
ot gates) controlling the forward and feedback paths of the cell and the memory history (by the forget gate
ft). Depending on the particular configuration, the LSTM cells of one layer can be interconnected (memory-to-memory connections).
The DWT for the i-th level can be generally defined by the detail and approximation functions
D and
A related to the high- and low-pass filters, respectively:
with
N data points of the original time series
x(
i),
i = 0, 1,…,
N−1,
j = 0, 1,…,
J−1,
k = 0, 1,…, 2
J−1,
J = log(N). The function ψ and φ are related to the mother wavelet function and its mirror function, respectively.
Details regarding the DWT can be found in [
17].
4.3. Target Variable Computation for Labelling
The individual sensor nodes should detect damage/defects within a local area. There is a simplified assumption that damage detection is possible in a circular area around a sensor, i.e., isotropic sensitivity (not true; rather elliptically shaped in direction of the axis actuator-damage-sensor). A Euclidean distance damage-sensor is used as an indicator of damage/non-damage classification, i.e., a specification for the expected prediction value of the ML model.
with
p as the sensor position. The target variable estimation is only required for the first supervised learning approach. The second unsupervised approach due not rely on labelling for training, shown in
Figure 9.
4.4. Global State Fusion and Damage Localisation
Each node delivers a probalistic damage estimation within a radius R around each node. The local predictor function delivers an output value in the range [0,1]. Values near one indicate strong damage detection. The output of all local predictor functions are fused to a global state (binary damage classification and damage localisation relative to the DUT coordinates) by different algorithms described below. Typically clusters of nodes are activated around the damage location. Beside true-positive predictions, there can be false-positive predictions, too. The global fusion has to discriminate the false-positive predictions and averages the local states.
Global fusion algorithms used for damage localisation:
Unweighted Centre of Mass.
This algorithm applies a threshold filter to all local prediction results with a binary decision mapping (damage activation). All activated discrete node positions are added to a point cloud. Finally, an unweighted centre of mass (COM) computation is applied to this point cloud interpolating the damage position
pd.
where
SN is the full set of sensor nodes of the network,
so the output of the prediction function of the node at position
sx,
sy in the range [0,1],
t is the threshold for binary classification.
Weighted Centre of Mass.
This algorithm applies a threshold filter to all local prediction results with a binary decision mapping (damage activation). All activated discrete node positions are added to a point cloud together with a weight derived from the predictor function output. Finally, a weighted centre of mass computation is applied to this point cloud interpolating the damage position.
Fully weighted Center of Mass.
This algorithm creates a point cloud with all discrete node positions together with the weight derived from the predictor function output. Finally, a weighted centre of mass computation is applied to this point cloud interpolating the damage position.
Density-based Clustering and Center of Mass.
Prior a weighted centre of mass computation, a density-based clustering using the DBSCAN algorithm [
20] is applied to the point cloud consisting of node positions with a predictor function output above a given threshold. The largest clustered group is select for COM. This approach is proposed to be useful to discriminate clusters of true-positive predictions from clusters of false-positive predictions, as evaluated and discussed in the following results section. The DBSCAN algorithm uses a global density parameter. An advanced approach can be used with a local density parameter uses for clustering [
21].
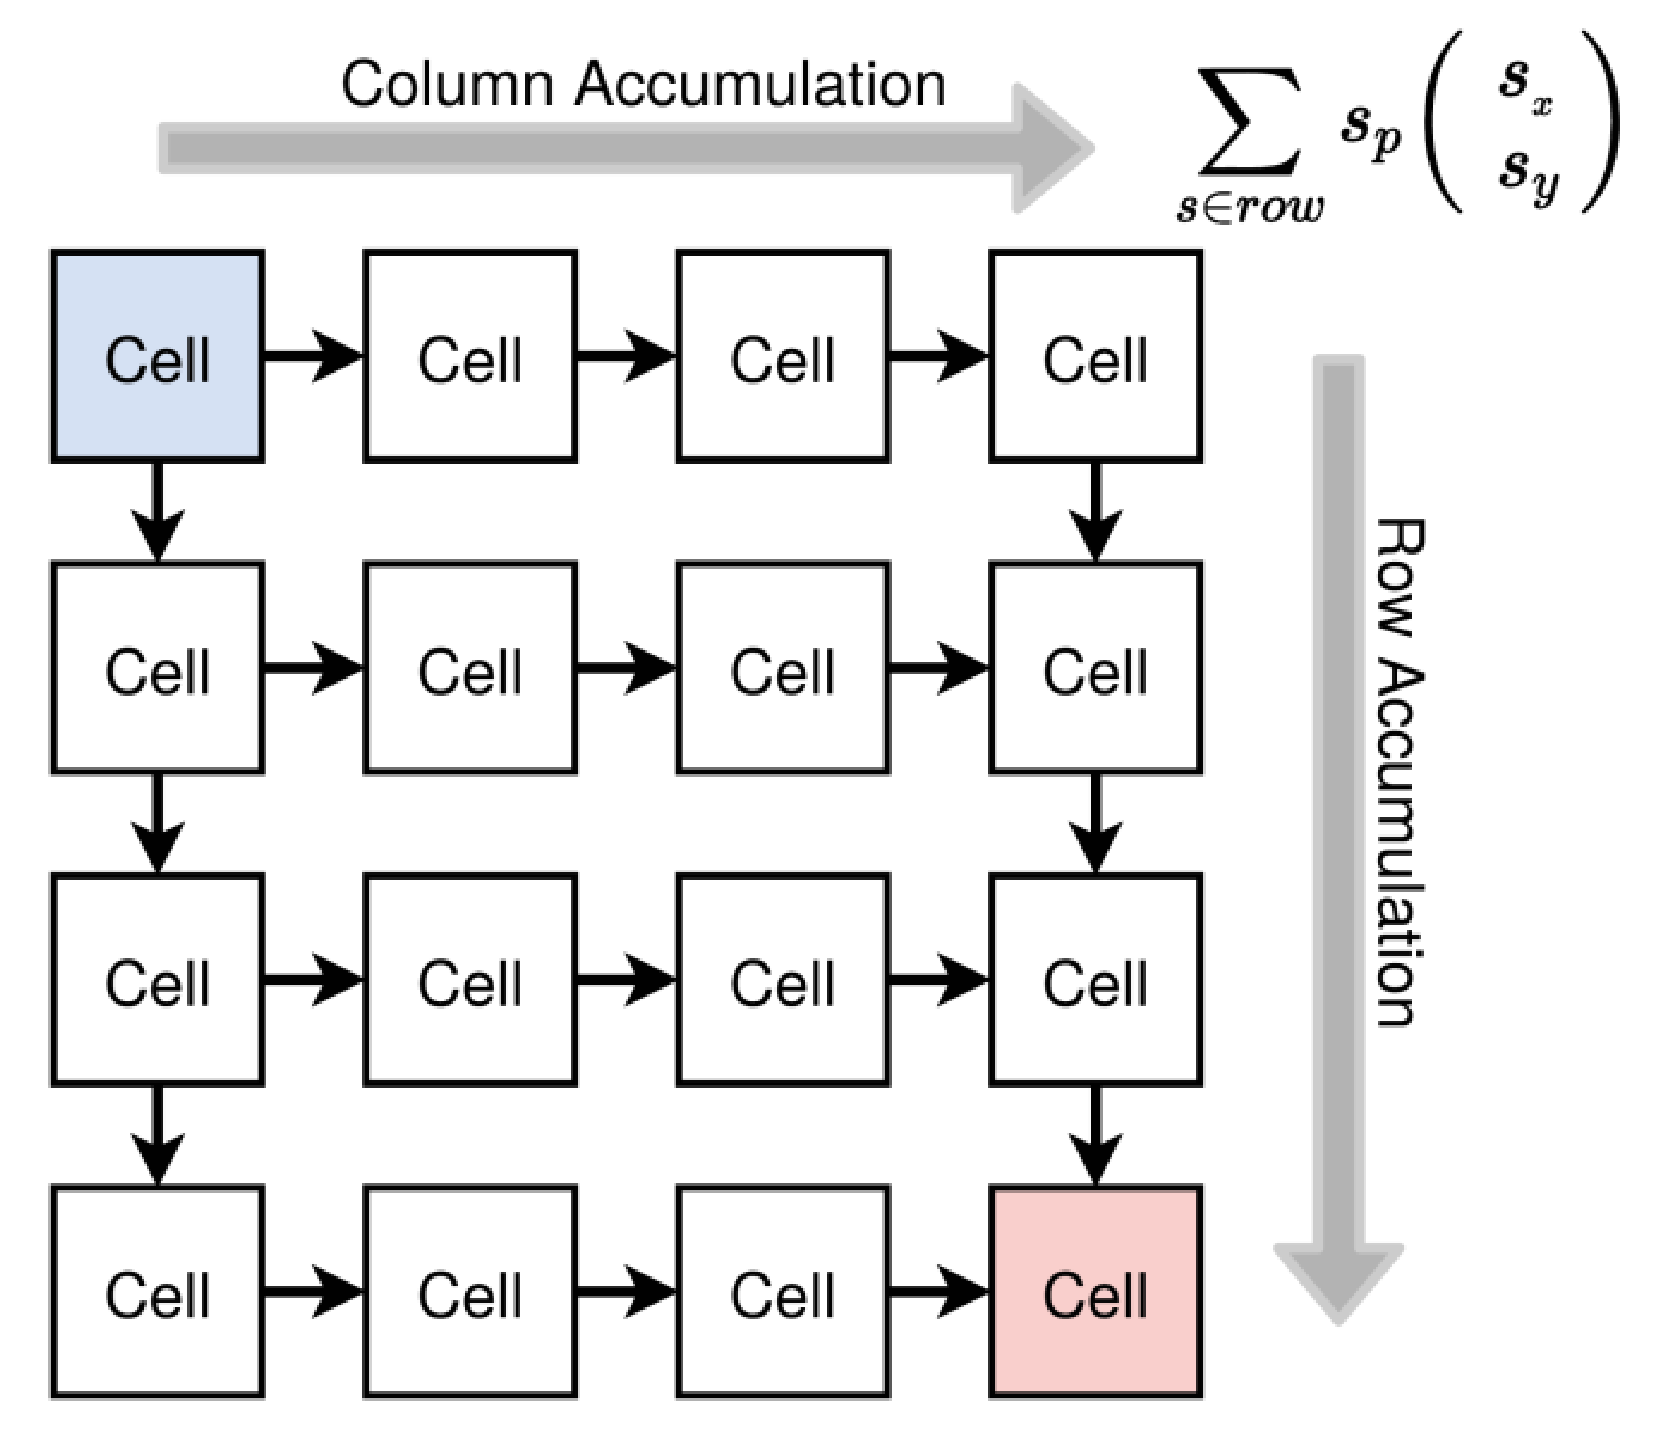
Distributed Center of Mass (Cellular Automata).
The previous algorithms collect all node prediction results and perform the damage localisation on a dedicated centralised node. To avoid any centralised instances for scalability and robustness reasons a distributed COM algorithm is processed by the network nodes, i.e., an algorithm based on a cellular automata model with neighbourhood communication only. The algorithm bases on the fully weighted COM approach and Cellular Automata (CA).
The basic concept of a distributed weighted COM (DCOM) is the propagation of partials sums in rows and columns of the network, assuming more or less logical regular grid communication architecture. The logical position of a node with respect to the sensor network have to satisfy an ordering constraint, i.e., an East neighbour is physically located on the right, a West neighbour is located on the left side, and so on.
The first upper left node of the CA network initiate the propagation of the partial sum calculation from left to right (horizontal axis) and downwards (only initiators of further row propagations). Each node at the end of the row propagates the row accumulation downward. The last lower right node finally computes the approximated centre position of the damage. Each cell has a state, defined in Algorithm 1. Only the first node must be marked (always position (1,1)). All other nodes derive their position from the neighbouring nodes, i.e., a node has not to know its absolute position in the network, only the relative neighbouring connectivity.
Assuming a regular mesh sensor network with
N ×
M nodes the DCOM approach requires
NM steps to compute the weighted damage position.
| Algorithm 1. Data structure of CA cell |
| 1: type cell = { |
| 2: state : { |
| 3: activation : number, |
| 4: prediction : number, |
| 5: // accumulator for horizontal axis propagation |
| 6: right : comsum {}|null, |
| 7: // accumulator for vertical axis propagation |
| 8: down : comsum {}|null, |
| 9: // accumulator for accumulated row results |
| 10: row : comsum {}|null, |
| 11: position : [x,y], |
| 12: }, |
| 13: activity : function |
| 14: } |
| 15: type comsum = { |
| 16: x: number, y:number, |
| 17: accux: number, accuy:number, |
| 18: mass: number, |
| 19: } |
The cell activity is shown in the Algorithm 2, and the principle right-down shift propagation of the weighted COM is shown in
Figure 10. There is a dedicated initiator and collector node. Note that any edge node can be initiator or collector by rotation of the node matrix. All four configurations can be processed overlapped increasing redundancy in a technical network with node or communication failures.
| Algorithm 2. CA cell COM accumulation algorithm |
| 1: cell.activity = function (neighbors,x,y) { |
| 2: if !neighbors.left and not neighbors.up) then |
| 3: if !neighbors.right and not neighbors.down then |
| 4: // Initiator |
| 5: right := {mass:prediction,x:1,y:1, |
| 6: accux:prediction,accuy:prediction} |
| 7: down := {mass:prediction,x:1,y:1, |
| 8: accux:prediction,accuy:prediction} |
| 9: position := [1,1] |
| 10: else |
| 11: if neighbors.right and neighbors.left and neighbors.left.right then |
| 12: right := copy(neighbors.left.right) |
| 13: right.mass :=+ prediction |
| 14: right.x :=+ 1 |
| 15: right.accux :=+ (prediction*right.x) |
| 16: right.accuy :=+ (prediction*right.y) |
| 17: position := [right.x,right.y] |
| 18: if !neighbors.left and neighbors.up and neighbors.up.down then |
| 19: // Next row initiator |
| 20: right := {mass:prediction,x:1,y:neighbors.up.down.y+1, |
| 21: accux:prediction,accuy:prediction} |
| 22: position := [right.x,right.y] |
| 23: if neighbors.down then |
| 24: down := {mass:prediction,x:1,y:up.down.y+1, |
| 25: accux:prediction,accuy:prediction} |
| 26: if !neighbors.right and neighbors.left.right then |
| 27: // horizontal end point |
| 28: // Propagate |
| 29: if !neighbors.up then |
| 30: row := copy(neighbors.left.right) |
| 31: row.x :=+ 1 |
| 32: elseif neighbors.up and neighbors.up.row then |
| 33: // accumulate with previous row |
| 34: row := copy(left.right) |
| 35: row.x :=+ 1 |
| 36: row.mass :=+ prediction |
| 37: row.accux :=+ (prediction*row.x) |
| 38: row.accuy :=+ (prediction*row.y) |
| 39: row.mass :=+ up.row.mass |
| 40: row.accux :=+ up.row.accux |
| 41: row.accuy :=+ up.row.accuy |
| 42: position := [row.x,row.y] |
| 43: if !neighbors.right and not neighbors.down then |
| 44: // final edge computation |
| 45: center := [row.accux/row.mass,row.accuy/row.mass] |
4.5. Training
The training of the RNN is rather simple. All model instances associated with virtual sensor nodes are trained independently (although, on a central computer sequentially). The feature transformed input signals activate each RNN sequentially. The first four DWT decomposition levels are used. After the RNN is activated, the prediction error is computed. It is just the difference of the target variable (binary damage label) at the last output value of the RNN (linearised in the interval [0,1], 1: damage, 0: no damage)). The desired target variable value (0/1) is passed to a gradient descent back propagation algorithm adapting the weights of the network and the parameterisation of the LSTM cells (primarily internal edge weights and gating parameters).
The basic training algorithm for one node is shown in Algorithm 3.
| Algorithm 3. Basic training algorithm for one node and one training sample |
| 1: function train(node,data) is |
| 2: target=data.target |
| 3: error=0 |
| 4: repeatn times |
| 5: node.model.clear() |
| 6: ∀ val ∈ data,signal do |
| 7: out=node.model.activate(val) |
| 8: node.model.propagate(rate,momentum,[target]) |
| 9: error := error+|out-target| |
| 10: error := error/n |
| 11: if error>0.2 then |
| 12: if target>0.2 then error0 := 0, error1 := 1 |
| 13: else error0 := 1, error1 := 0 |
| 14: else error0 := error1 := 0 |
| 15: if target>0.2 then state := 1 else state := 0 |
| 16: return error,error0,error1,state |
| 17: |
| 18: function test(node,data) is |
| 19: target := data.target |
| 20: error := 0 |
| 21: node.model.clear() |
| 22: ∀ val ∈ data,signal do |
| 23: out := node.model.activate(val) |
| 24: error :=+ |out-target| |
| 25: if error>0.2 then |
| 26: if target>0.2 then error0 := 0, error1 := 1 |
| 27: else error0 := 1, error1 := 0 |
| 28: else error0 := error1 := 0 |
| 29: if target>0.2 then state := 1 else state := 0 |
| 30: return error,error0,error1,state |
The training is applied to all nodes with a randomly sequential selection of training instances. After a spatially averaged mean error is below a threshold value, selected nodes with false-positive and/or false-negative predictions are trained, shown in Algorithm 4. The false-positive rate for the non-damage case must be zero, the local false-positive or false-negative rates in damage experiments should be minimised.
| Algorithm 4. Iterative and adaptive training algorithm for all nodes and all samples |
| 1: // Average Training |
| 2: phase 1: |
| 3: while errorT0 > thres0 and errorT1 > thres1 do |
| 4: sample := random.select(trainingData); |
| 5: ∀ node ∈ nodes do |
| 6: {error,error0,error1,state} := train(node,sample)∪ |
| 7: errorT0 := 0.9*errorT0+0.1*error0; |
| 8: errorT1 := 0.9*errorT1+0.1*error1; |
| 9: |
| 10: // Cross Validate |
| 11: phase 2: |
| 12: maybenodes=[[],badnodes=[[]; |
| 13: ∀ node ∈ nodes do |
| 14: ∀ sample ∈ testData ∪ trainingData do |
| 15: {error,error0,error1,state} := train(node,sample) |
| 16: if error0 > 9.5 and node ∉ badnodes then |
| 17: add node to badnodes |
| 18: if node ∈ maybenodes then |
| 19: remove node from maybenodes |
| 20: else if error > 0.5 and node ∉ badnodes ∪ maybenodes then |
| 21: add node to maybenodes |
| 22: // Selected Training |
| 23: phase 3: |
| 24: while badnodes not empty do |
| 25: ∀ node ∈ badnodes do |
| 26: phase1 with nodes=[node] |
| 27: phase2 wtih nodes=[node] |
4.6. Results
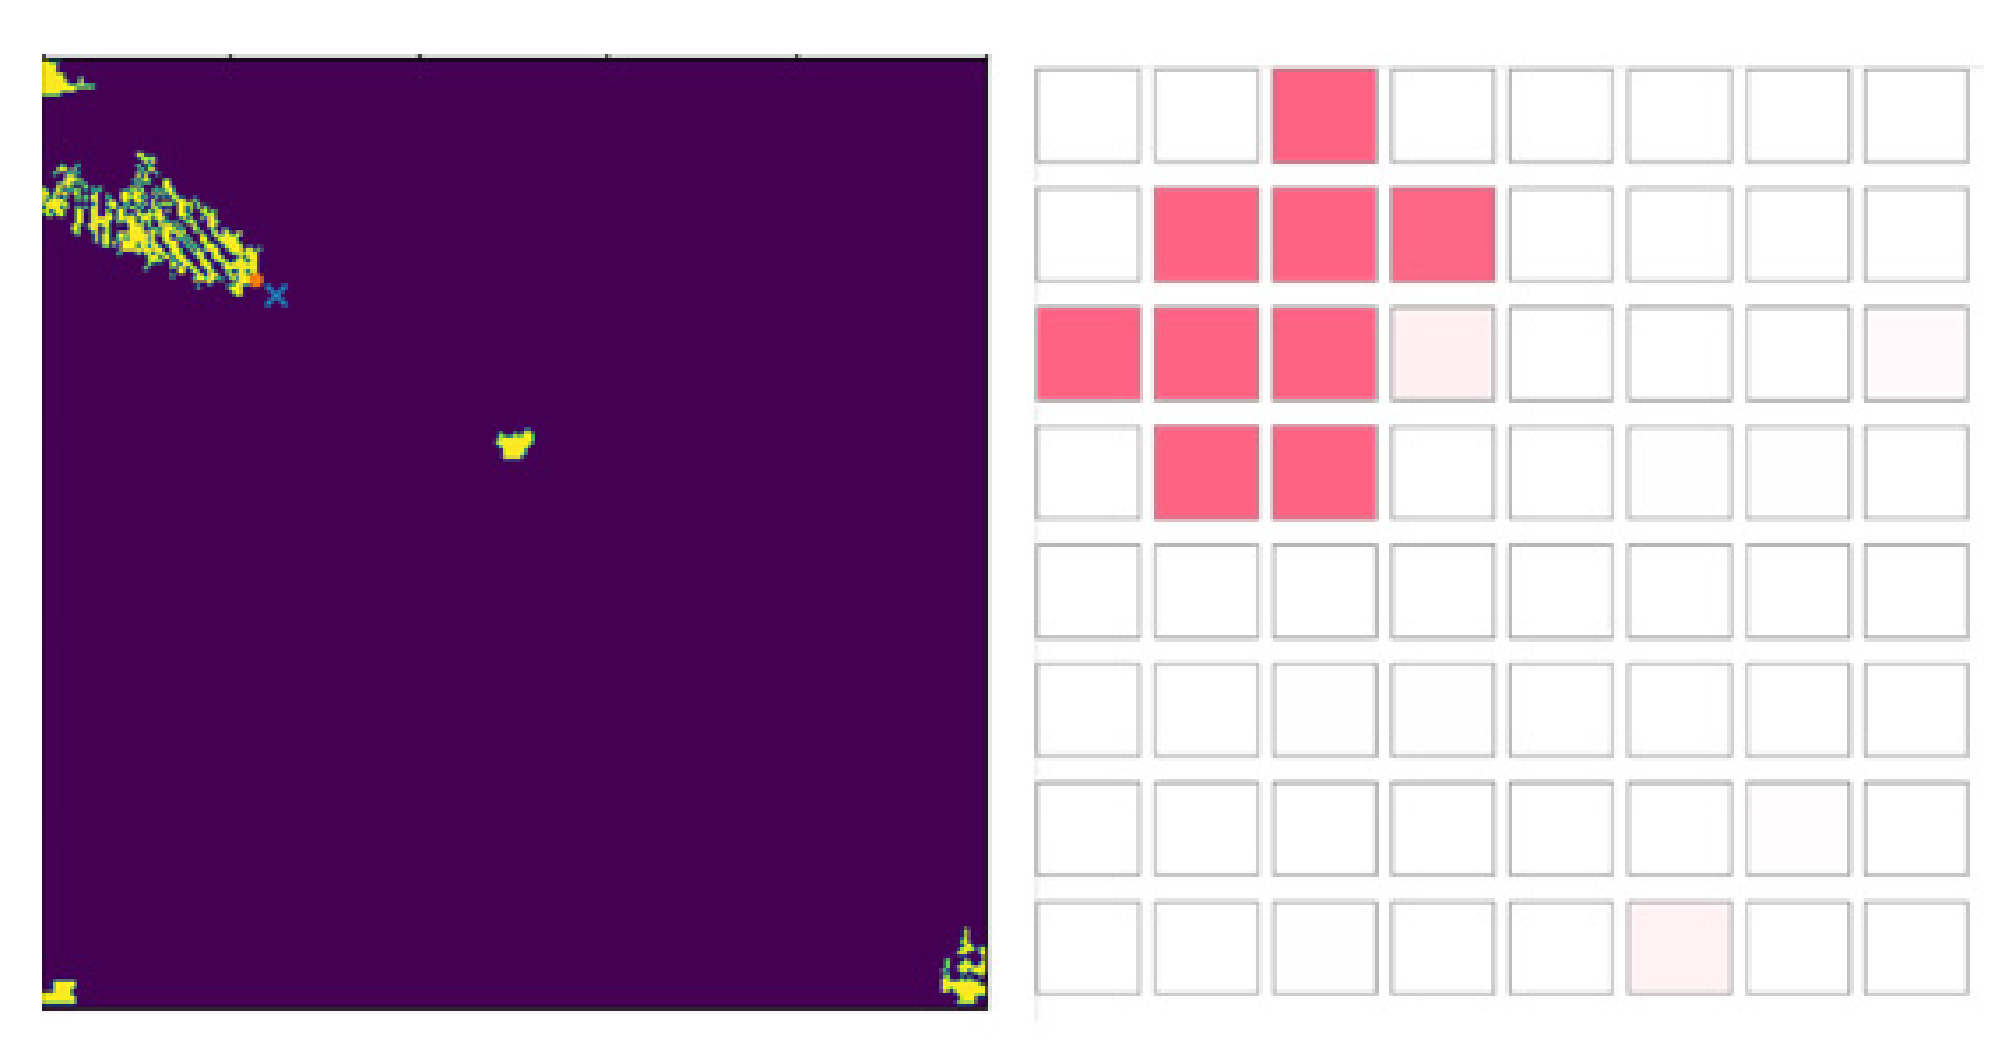
In
Figure 11, some results of the distributed sensor network activation and damage prediction are shown for the training set consisting of 9 damage positions (MMA) and one base-line experiment.
The following
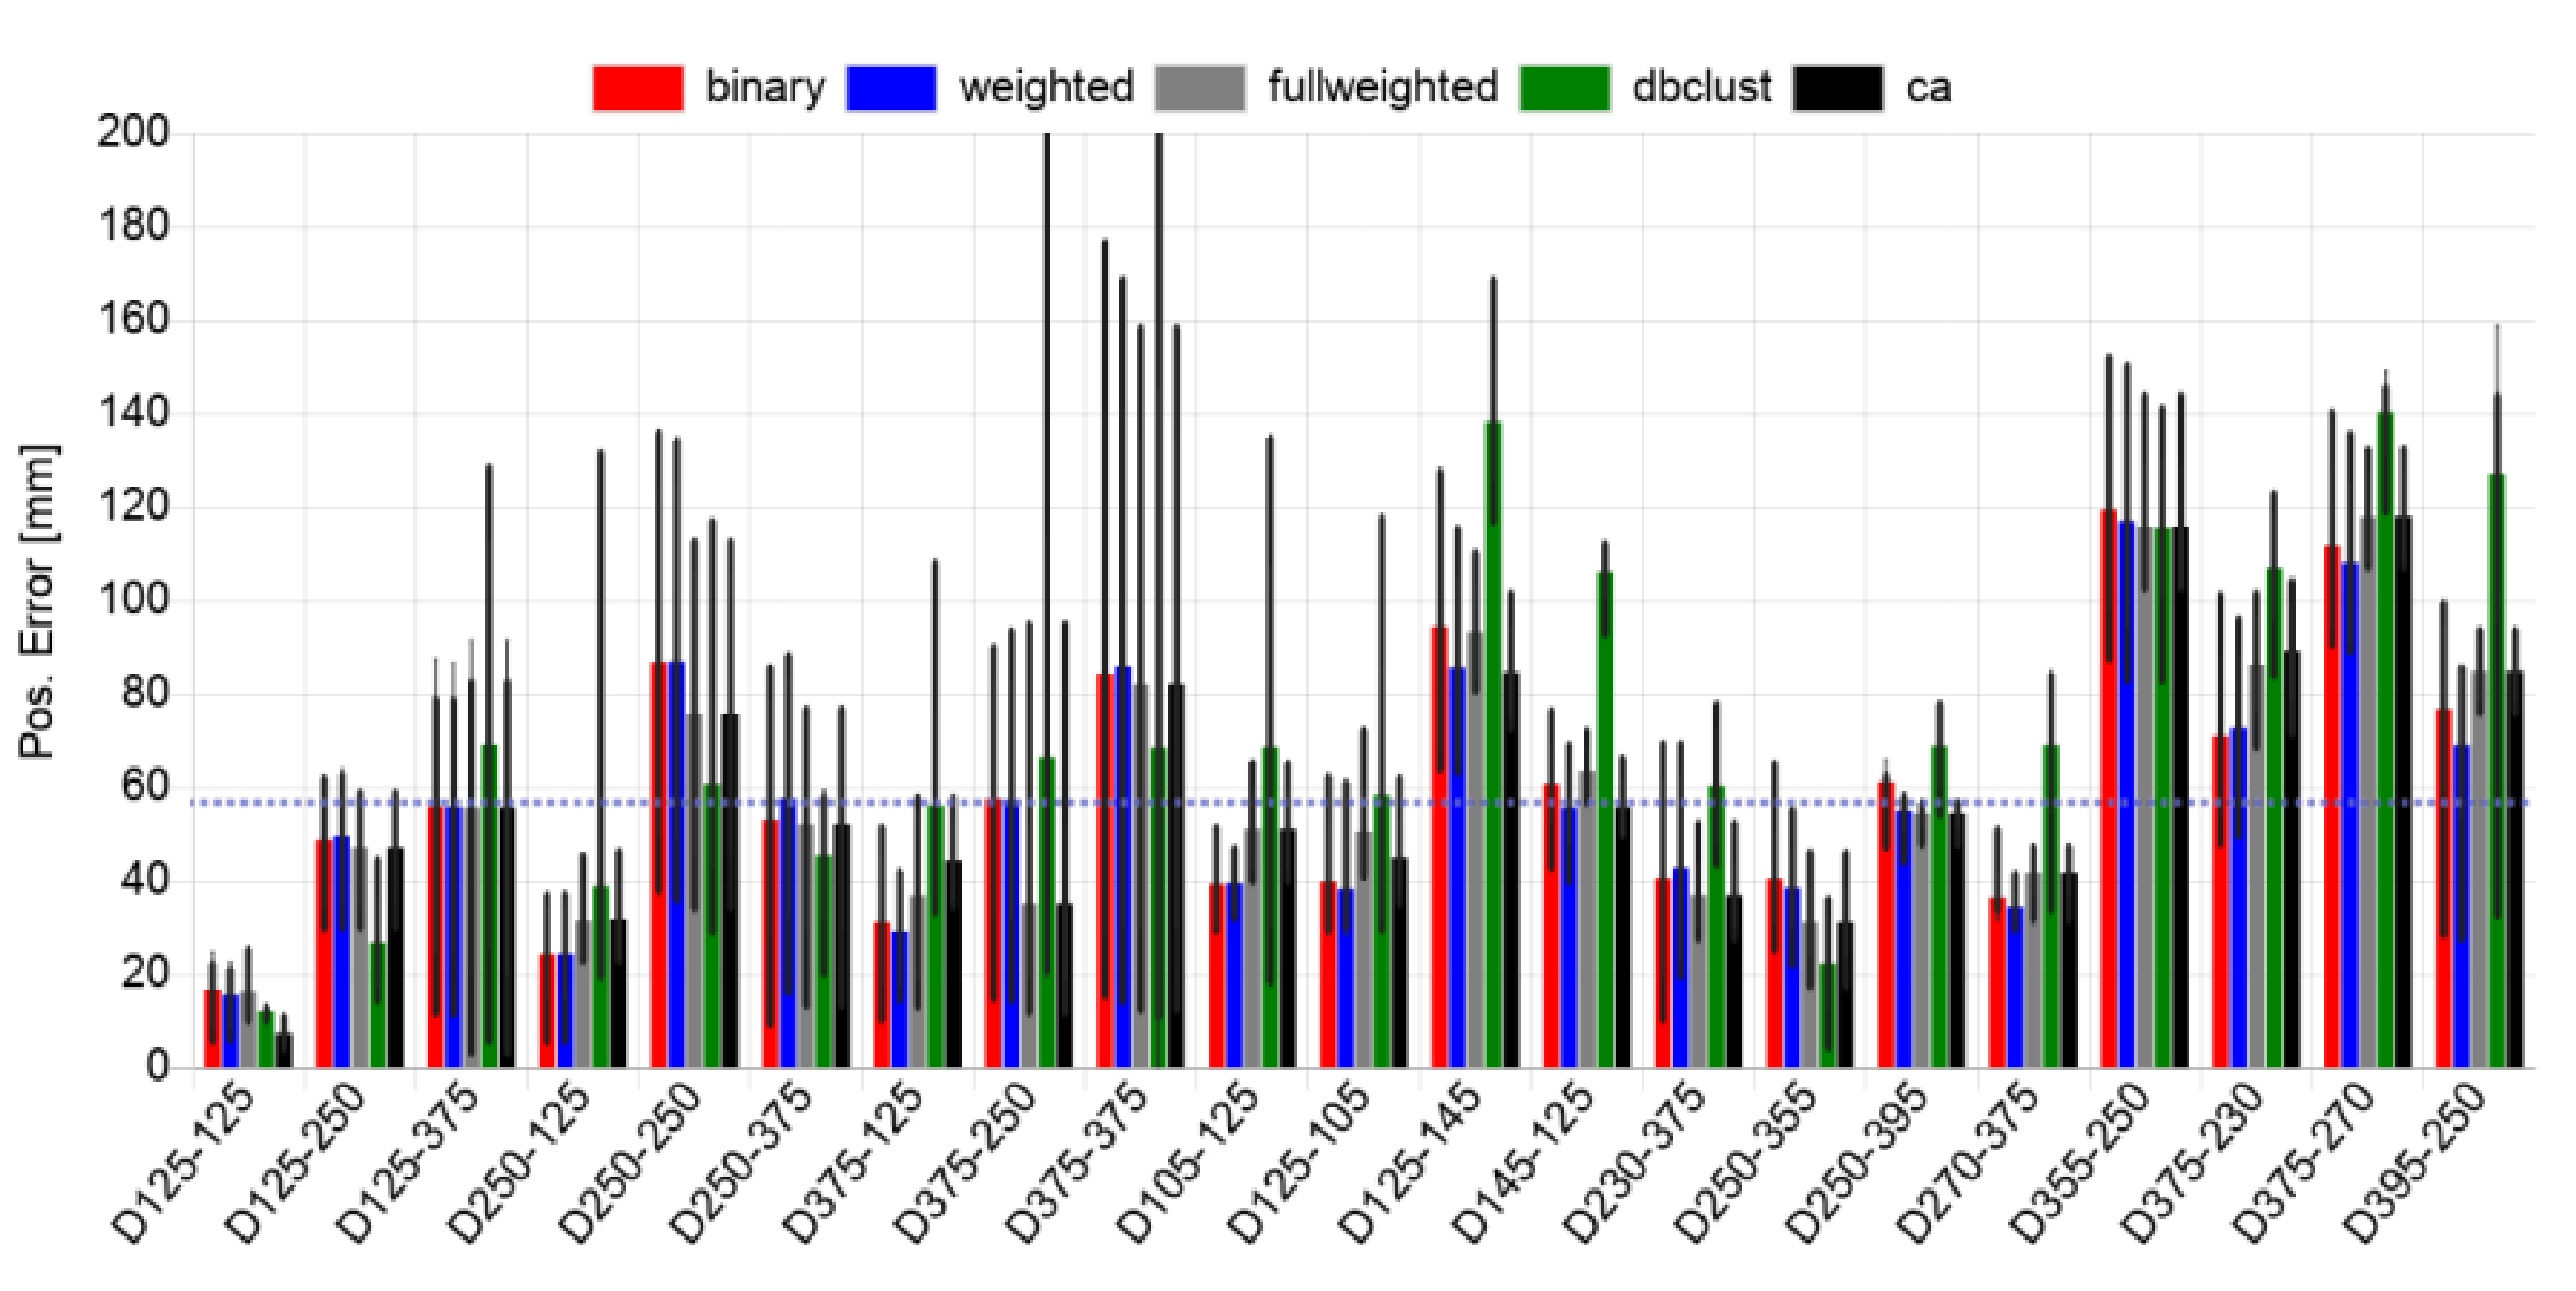
Table 1 and the bar plot in
Figure 12 shows the prediction accuracy of the trained LSTM model using DWT features of the time-resolved sensor signal. The positions errors of the weighted centre point calculation of a predicted damage (pseudo defect) is in mm and must be evaluated with respect to the overall DUT plate dimension of 500 × 500 mm and the sensor node spacing of 60 mm. The prediction accuracy is averaged over all data sets. The first data set was used for the ANN training and for the test evaluation. The mean position accuracy is about 60 mm averaged over all experiments and data sets, i.e., in the order of the sensor node spacing distance (60 mm). The mean position accuracy is about 20 mm for training data experiments only, i.e., 1/3 of the spatial sensor node spacing distance.
In
Figure 12, five different global fusion algorithms are compared (see
Section 4.4 for details). In most damage cases the fully weighted COM approach shows the best average accuracy results. Some damage cases show still good average position accuracy but with larger variance and in few cases with a large maximal error (e.g., D375-250), i.e., extending the error boundary, another important statistical feature of a SHM system. This shows the dependence of the damage position estimation from the spatial sensor-actuator-damage triangle and their positions relative to each other and relative to the edges and sides of the plate. At the edges there are significant wave distortion effects, such as edge reflections, with a significant impact on the damage prediction. Fortunately, due to the spatial specialisation of the trained predictor functions of the sensor nodes near the edges and sides of the plate they are able to discriminate these wave distortions sufficiently.
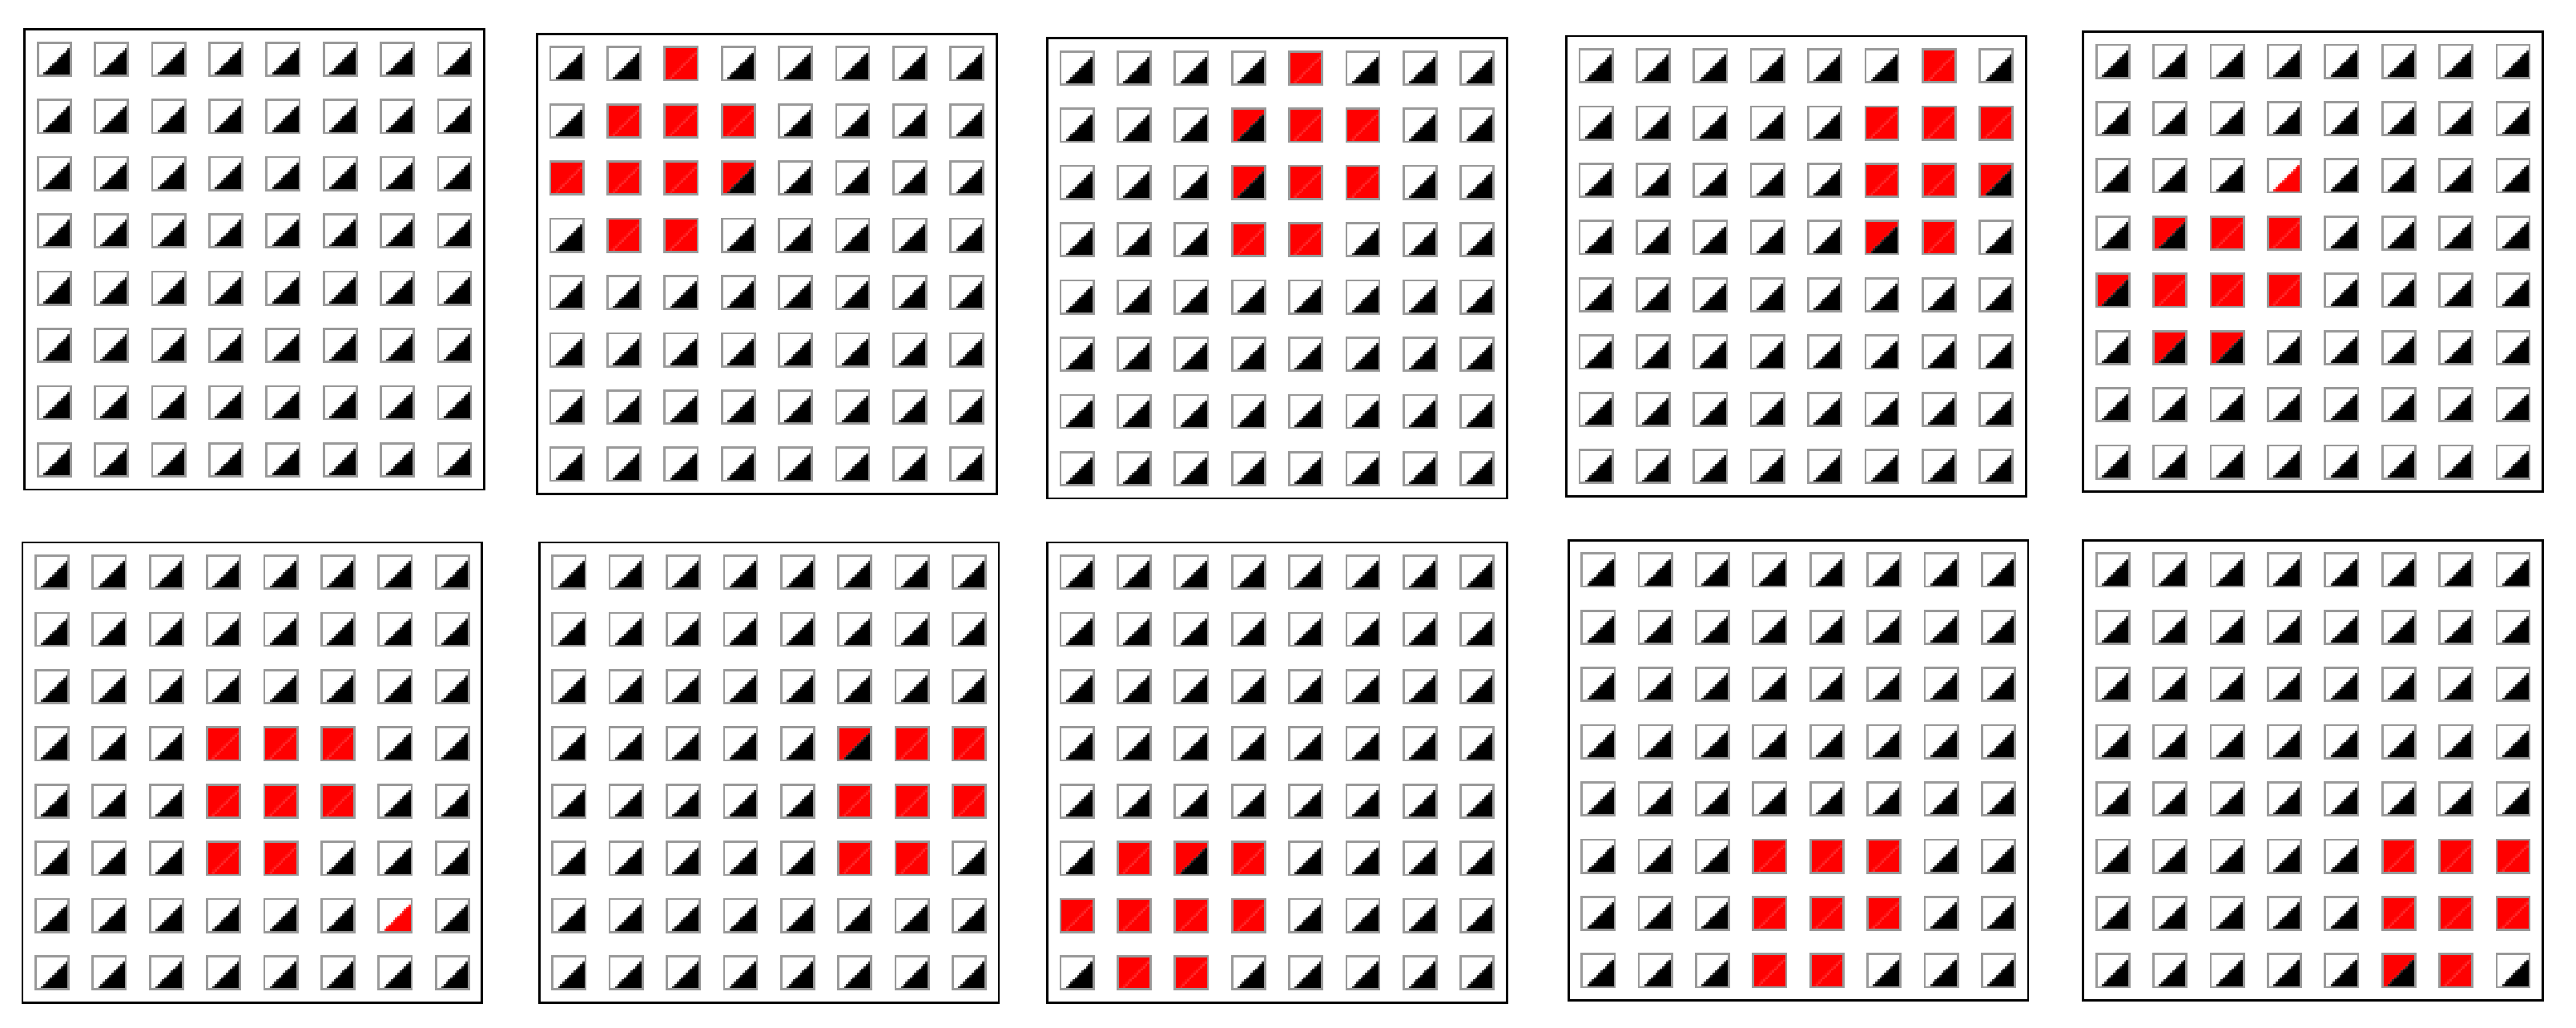
In
Figure 13 some typical network activation patterns with local false-positive activation clusters are shown. The density-based clustering approach can lower the average of the damage localisation error, but increases the maximal error boundary. This increase of the maximal error is a result of (1) Wrong cluster discrimination (selecting the cluster with the highest number of points), and (2) the false-positive prediction compensate a position estimation by a geometrical distorted (non-separable) true-positive cluster. The binary unweighted COM approach using a threshold discrimination produces only in some cases lower localisation errors. The fully weighted COM approach shows mostly the best results. The distributed approach with a CA model shows comparable results and is fully suitable to approximate the damage position.
5. Single-Instance Learning of an Auto-Encoder with Multi-Instance Prediction (STMP Class)
In this section, the second high-resolution approach using unsupervised generalised single-instance learning of a signal auto-encoder is introduced. The output of the trained auto-encoder is used to predict the damage position (pseudo defect) by using weighted point density (WPD) analysis.
5.1. Concept
In contrast of the concept of the MTMP approach directly predicting damage features, the second STMP approach consists of two stages:
A predictor function is trained using data only from a damage-free baseline experiment. Any non-conformity to the base-line data (features) is detected by the predictor function with a “damage” classification. The challenge is to derive a generalised predictor function (independence from spatial location of sensor, actuator, and damage) which discriminates damages from other signal non-conformity, i.e., noise, variance in the measuring configuration, reflection of waves at edges, and many more non-damage related artifacts. It can be assumed that there are commonly sufficient training data sets with varying damage-free sample instances, i.e., with a variance in operational and measuring conditions.
One unsupervised method to detect differences to a base-line signal is using an auto-encoder and decoder to code and reconstruct (decode) the sensor signal. If the auto-encoder function is trained only with damage-free sensor signals it is not able to reconstruct a signal resulting from wave interactions nearby a damage. Comparing the reconstructed signal with the actually measured signal gives a binary damage classificator by applying a threshold function to the mean average error of the reconstructed signal and the originally measured signal. The basic signal processing architecture is shown in
Figure 14.
The auto-encoder and decoder was implemented with a state-based recurrent ANN and LSTM cells using the Tensorflow ML framework [
22]. Computation (training and inference) was primarily performed on a GPU. The network configuration is [64,32,32,64,2], i.e., an input layer of 64 LSTM cells, a hidden layer of 32 LSTM cells (encoder) and a hidden layer of 64 and 32 LSTM cells implementing the decoder, and two output neurons.
5.2. Feature Selection and Training
Similar to the MTMP class with supervised training, the single model instance is trained unsupervised with features selected from the sensor signal, processing the sensor signal in the following order:
Temporal down sampling 1:10 going from 4000 samples down to 400;
Transform the data by scaling the input between −1 and 1;
Discrete Wavelet Transformation (Debuchet-4 function) with 4 levels of decomposition;
Third and fourth down sampled level coefficients serve as the input features for the network.
Note that there is no data labelling performed. The single model instance is trained with all spatial data points (250 × 250) sequentially from the original scanned ultrasonic measurements. The training is performed again with a network activation of the down-sampled and DWT feature transformed input data sequence, with a following back propagation of the prediction error. In this case the error is defined by the difference between the input signal and the reconstructed output signal by the auto-encoder and decoder. Details of the network architecture can be found in the next section.
5.3. Network Architecture
The network is based on LSTM-cells arranged in an encoder-decoder setting, shown in
Figure 15. Both the encoder and the decoder consist of 2 layers of LSTM-cells with a decreasing/increasing amount of units respectively. This arrangement serves as a bottleneck where only the most essential information from the input features are kept. The compressed information is then used to decode it back to its original form. The network therefore is an LSTM-based auto-encoder. This also means that prior labelling becomes unnecessary as it is an unsupervised learning technique. By training the network with global data of undamaged CFK-plates, it learns to accurately compress and decompress its undamaged input data on any local position individually. However, supplying the network with signal data that includes damage information, e.g., wave reflections, results in a much greater error, because the network intentionally never saw damage information during training. The reconstruction error of the network is therefore an indication of a possible defect.
5.4. Post Processing
The mean averaged error derived from the decoder output is then classified into damage or no damage features using a simple threshold function. Because of the globally trained network this procedure can then be repeated for sensors with different locations on the CFK-plate, which, applied iteratively, results in a binary image of spatially resolved damage/no damage feature classifications of any resolution. This image can then be used as the input for a weighted point density analysis using DBSCAN to estimate the damage location.
Typical examples of the post-processed images are shown in
Figure 16. The dependency of the position accuracy with respect to the sensor-actuator-damage configuration is shown in
Figure 17. Damages near by the actuator (nearly in the plate centre) cannot be detected accurately. There are feature activations near by the edges and corners of the plate due to wave reflections, interferences and mode conversions (conversion of one Lamb wave mode into another mode). These artifacts disturb the damage prediction and localisation. Moreover, in this work a specimen structure consisting of only one composite material is considered. Hybrid structures in terms of combined section regions of different materials, e.g., with intermediate stringers, will pose similar artifacts.
5.5. Results
Results of the base-line approach using the auto-encoder output and density clustering feature extraction are shown in
Figure 18. The accuracy measures are derived from all three data sets by Monte Carlo simulation adding Gaussian noise to the originally measures data sets. Some samples show false-negative predictions (indicated by black bars in the plot, typically 10–20% of the samples of one experiment). The training was only performed with the sensor data from the defect-less experiment. In contrast to the first local multi-instance learning, the global single-instance learning shows some false-negative predictions, i.e., no defect (position) was detected in case of an existing defect, indicated by black bars. The maximal prediction error occurs by a defect placed in the centre of the plate near by the actuator. The mean position error averaged over all sets and neglecting the three high error cases (D125-250, D250.250, and D250-375) is about 18 mm. The high position errors of the three aforementioned cases are a result of a low-contrast feature marking with fuzzy boundaries of the point clouds and high noise areas at the edges and corners of the plate due to wave interaction artifacts).
The following two box plots in
Figure 19 show the dependency of the position accuracy on sensor noise (additive Gaussian noise added to the raw sensor signal) obtained by MCS. In both plots, the data are divided according to the individual noise levels. The first of the accumulated box plots summarises all experiments on all data sets. It can be seen that the median of all noise levels is slightly above an error of 20 mm, whereby with an SNR of 0 dB (same noise as signal strength) slightly higher errors occur. In the second grouped box plot the data was divided by noise levels, but also by the data sets. It can be seen that the largest error occurs in the second data set with VST defect mounting due to a weaker damage-wave interaction. Both plots also show outliers that differ significantly from the other points.
By inserting noise, many previous unrecognised cases now result in quite large position errors, since noise is now recognised as a damage feature, which can be observed clearly with the second data set. With the other data sets, this is reflected in the outliers.
7. Conclusions
Two different ML architectures were introduced that predict damages of a carbon fibre laminate plate with a high accuracy and reliability. Both approaches deliver a binary damage classification and an estimation of the damage location relative to the plate boundaries. The first is a low-, the second a high-resolution method with respect to sensor density and accuracy.
The first approach is a distributed multi-instance architecture with supervised training and suitable for the deployment in sensor networks. The sensor density is sparse (here 8 × 8 sensors). Each trained model instance is capable of predicting a damage in the neighbouring region around the sensor node. Global fusion finally approximates the spatial position of the damage achieving an average accuracy in the order of the sensor node distance (60 mm). The distributed approach showed 100% true-positive and 0% false-positive/negative damage classifications in all test data instances. The spatial graph of sensor, actuator, and damage and its position relative to the plate boundaries has an impact on the location prediction accuracy. The multi-instance models are bound to their spatial region where they are trained, thus they pose no spatial generalisation.
The second approach is a spatially generalised single-instance architecture with unsupervised training based on a base-line anomaly prediction using an auto-encoder. The single model instance can be replicated supporting multi-instance prediction. The sensor density is high (here 250 × 250 sensors). This approach showed an improved averaged accuracy in the order of tenth times of sensor distance (20 mm). This approach is not suitable for processing on embedded nodes of a sensor network due to high computational time and resource requirements (e.g., one GPU) and is considered as a laboratory diagnostics system and a reference analysis method. The main advantage of this approach is the unsupervised training method compared to the supervised first approach, avoiding labelling difficulties and a higher degree of generalisation (with respect to spatial, temporal, and environmental parameters).
Common to both architectures is a state-based recurrent ANN using a Long-short term memory cell processing feature transformed time-series data. Discrete wavelet decomposition is used as the primary feature transformation (the distributed multi-instance approach uses the first to fourth level, the auto-encoder approach uses the third and fourth decomposition level). The high-resolution approach delivered about 5% false-negative and 0% false-positive predictions. The false-negative rate can be dropped to zero by fusing and coupling both architectures. The binary damage classification is taken from the first system, the high-resolution position estimation by the second or by the first if the second system cannot find a damage.
There are still a lot of questions and evaluations to be done:
Measurement and processing of more reference data with a broader range of different damage locations, mounting technologies, and environmental variations;
Considering experiments with more than one damage (training and inference);
Enhancing data augmentation beyond Monte Carlo simulation;
Applying the methods to carbon fibre laminate plates with real impact damages;
More rigorous investigation of the influence of sensor density, sensor failure, and sensor variations on prediction results;
Implementing the distributed MTMP approach on a real sensor network with embedded low-resource computers.


