
Novel Approach for Emotion Detection and Stabilizing Mental State by Using Machine Learning Techniques


Department of Computer Science and Engineering, Koneru Lakshmaiah Education Foundation, Vaddeswaram, Guntur, Andhra Pradesh 522502, India
*
Author to whom correspondence should be addressed.
Computers 2021, 10(3), 37; https://0-doi-org.brum.beds.ac.uk/10.3390/computers10030037
Submission received: 15 January 2021
/
Revised: 4 March 2021
/
Accepted: 15 March 2021
/
Published: 19 March 2021
(This article belongs to the Special Issue Artificial Intelligence for Health)
Abstract
:The aim of this research study is to detect emotional state by processing electroencephalography (EEG) signals and test effect of meditation music therapy to stabilize mental state. This study is useful to identify 12 subtle emotions angry (annoying, angry, nervous), calm (calm, peaceful, relaxed), happy (excited, happy, pleased), sad (sleepy, bored, sad). A total 120 emotion signals were collected by using Emotive 14 channel EEG headset. Emotions are elicited by using three types of stimulus thoughts, audio and video. The system is trained by using captured database of emotion signals which include 30 signals of each emotion class. A total of 24 features were extracted by performing Chirplet transform. Band power is ranked as the prominent feature. The multimodel approach of classifier is used to classify emotions. Classification accuracy is tested for K-nearest neighbor (KNN), convolutional neural network (CNN), recurrent neural network (RNN) and deep neural network (DNN) classifiers. The system is tested to detect emotions of intellectually disable people. Meditation music therapy is used to stable mental state. It is found that it changed emotions of both intellectually disabled and normal participants from the annoying state to the relaxed state. A 75% positive transformation of mental state is obtained in the participants by using music therapy. This research study presents a novel approach for detailed analysis of brain EEG signals for emotion detection and stabilize mental state.
1. Introduction
According to theories of emotion, as a human being we experience different events; our nervous system develops physical reactions to these events. Examples of these reactions include increased heart rate, trembling, and upset stomach, etc. These physical reactions, in turn, create emotional reactions such as anger, fear, sadness, joy, happiness, and excitement. It can be said that emotions are the condition of feeling that results in physical and psychological changes that control our behavior. Hence, emotions can be defined as psychological states that comprise thoughts and feelings, physiological changes, expressive behaviors, and inclinations to act. Emotions play a vital role in people’s everyday life. It is a media of expressing yourself. Emotional recognition of the mentally disabled is a quite an interesting topic. More research is expected in this area to understand their mental state and analyze brain activity. The research is in process to recognize basic emotions like happy, sad, relax, and non-relaxed. Autistic-mentally challenged people may have greater difficulty with subtle which are much more socially oriented and they face greater difficulty in understanding emotions of others. There is intense need to recognize such emotions. Inner thinking process develops emotions by refereeing to the brain from the human senses for example: audio, visual, tactile, taste and odor. There are various methods to capture the brain signals such as CT-SCAN (Computed Tomography Scan), fMRI (functional magnetic resonance imaging), PET (positron emission tomography), MEG (magneto electroencephalography) and EEG (electroencephalography). To understand the mind of the people in special need, emotion detection by analyzing brain waves is more beneficial owing to continuous and inconsistent movement of eyes and face expression and also EEG is high speed and a non-invasive method. EEG is a strong technique for analyzing brain activity as compared to other approaches such as PET and FMRI as it has very high time resolution, it is low cost and gives an instant response [1]. EEG is a medical imaging technique that reads scalp electrical activity generated by action potentials. It is defined as electrical activity of an alternating type recorded from the scalp surface after being picked up by conductive media and metal electrodes [2]. In a medical set up, a wired EEG capturing cap is used but that type of environment is not useful to detect emotion. Most of the research is done on capturing basic emotions and classification using machine learning techniques. The research work is expected on recognizing delicate emotions and emotions of those people who cannot express it, so that better therapies can be provided to them to stable their emotions. Music therapy is very effective to stable mental state. Music acts as a medium for processing emotions, trauma, and grief—but music can also be utilized as a regulating or calming agent for anxiety or for deregulations, hence it is very effective for changing a mental state and reducing stress. By keeping these things in mind, this research is in progress. This research study consists in capturing of brain EEG signals by Emotive Epoc 14 channels EEG headset of normal and mentally disabled people. Preprocessing is done to reduce noise and other artifacts, and Chirplet transform, feature extraction, classification of emotions in 12 subtypes: excited, happy, pleased, annoying, angry, nervous, sleepy, bored, sad, calm, peaceful, relaxed and tests the effect of mediation music on mental state. This research study will be helpful for intellectually disable people for detecting their emotions and provide meditation music therapy as therapeutic intervention for stabilizing their mental state. The arrangement of this paper is as follows. In Section 1, a brief introduction of EEG and need of emotion detection is mentioned. In Section 2, the literature survey is mentioned. In Section 3, a proposed system is explained. In Section 4, a detailed description of method of collection of data, preprocessing, feature extraction and classification is mentioned. In Section 5, conclusion and recommendations are discussed.
2. Literature Survey
In Table 1, a detail literature survey on emotion detection using only EEG signals is mentioned [3]. Happy and sad emotions are recognized with best accuracy. Accuracy increases with increase in number of training samples. According to Gawali Bharati, 100% classification result for relaxed state are achieved when EEG signals of the subjects were in complete synchronization with the state of mind at that particular time. A good result for happy and sad are achieved [4]. Blaiech, Hayfa, et al. concluded that a favorable rate of recognition is obtained for joy, anger and disgust emotions and an acceptable rate for four other emotions [5]. Kaundanya, Vaishnavi L. classified emotions using a K-nearest neighbor (KNN) classifier and good results are obtained by KNN [6]. Murugappan, Muthusamy considered the classification of discrete emotions rather than dimensional emotions valence/arousal [7]. The multi-resolution analysis based on non-linear feature works well with the context of discrete emotion classification. These results represent a possibility of determining the emotional changes of human mind through EEG signals and also differentiate and classify the human emotions as the linear and non-linear features. Mehmood, Raja Majid, and Hyo Jong Lee observed that Hijroth parameter, band-pass filtering and combination of several EEG channels into specific brain lobes extracted the significant features for the support vector machine (SVM). Feature selection is a key challenge in affective computing. It is also observed that accuracy in these experiments greatly increased on the small group of emotions [8]. RM Mehmood, HJ Lee found that the SVM correctly classify affects in valence and arousal dimension with accuracy of 32% and 37%, respectively [9]. WL Zheng, BL Lu used DBN (Deep Belief Network) models to construction of EEG-based emotion recognition models for three categories of emotions (positive, neutral and negative).The weights learned by DBNs (Deep Belief Network) suggests that neural signatures associated with positive, neutral and negative emotions do exist and they share commonality across individuals [10]. RN Duan, JY Zhu calculated the average classification accuracies using features DE (Differential Entropy), DASM (Differential Asymmetry), RASM (Rational Asymmetry) and ES (Differential Entropy) on EEG data collected are 84.22%, 80.96%, 83.28% and 76.56%, respectively [11]. J Harischandra, MUS Perera prepared a system which enables severely disabled as well as able users to interact with the system using eye movement in order to respond to detected emotion. The solution can be used to detect emotions of motor disabled people and provision a means of communication; also it is a learning tool for trainee neurologists [12]. According to Jing Fan, the classification results were promising, with over 80% accuracy in classifying engagement and mental workload, and over 75% accuracy in classifying emotional states [13].
Bin Yunus, Jasmy concluded that the results obtained by independent component analysis (ICA) could provide the most accurate result for classifying emotional states in brain activity than other methods [14]. Sriharsha Ramaraju used EEG in analyzing brain activity of autism children and measure asymmetry in frontal EEG activity which is associated with motivational approach and avoidance tendencies [15]. S Koelstra created a DEAP (Database for Emotion Analysis using Physiological Signals) database and analyzes brain activity by providing different stimulus. Researchers also worked on song recommendation system by considering mood of the customer. It is particularly designed for radio listeners [16]. The major research gap found in all these papers are listed below:
- Subtle emotions are not recognized.
- No work on emotion detection of mentally disabled people is done.
- Emotions are captured in controlled environment. Because of that natural emotions are not get captured.
- Therapeutic intervention is not proposed to stable emotional state.
In this research study, a research gap found in above mentioned literature survey are tried to overcome. Five stage preprocessing is done on the captured signals to remove noise and unwanted data. Chirplet transform is performed on the signals before extraction of the features. The 24 time and frequency domain features are calculated by a statistical modeling technique. A multi-model approach of classifiers is used to classify emotions. The effect of meditation is tested on the mentally disabled and normal people. Finally music is recommended to the person depending on the emotional state. In the following section, the proposed system is explained.
3. Proposed System
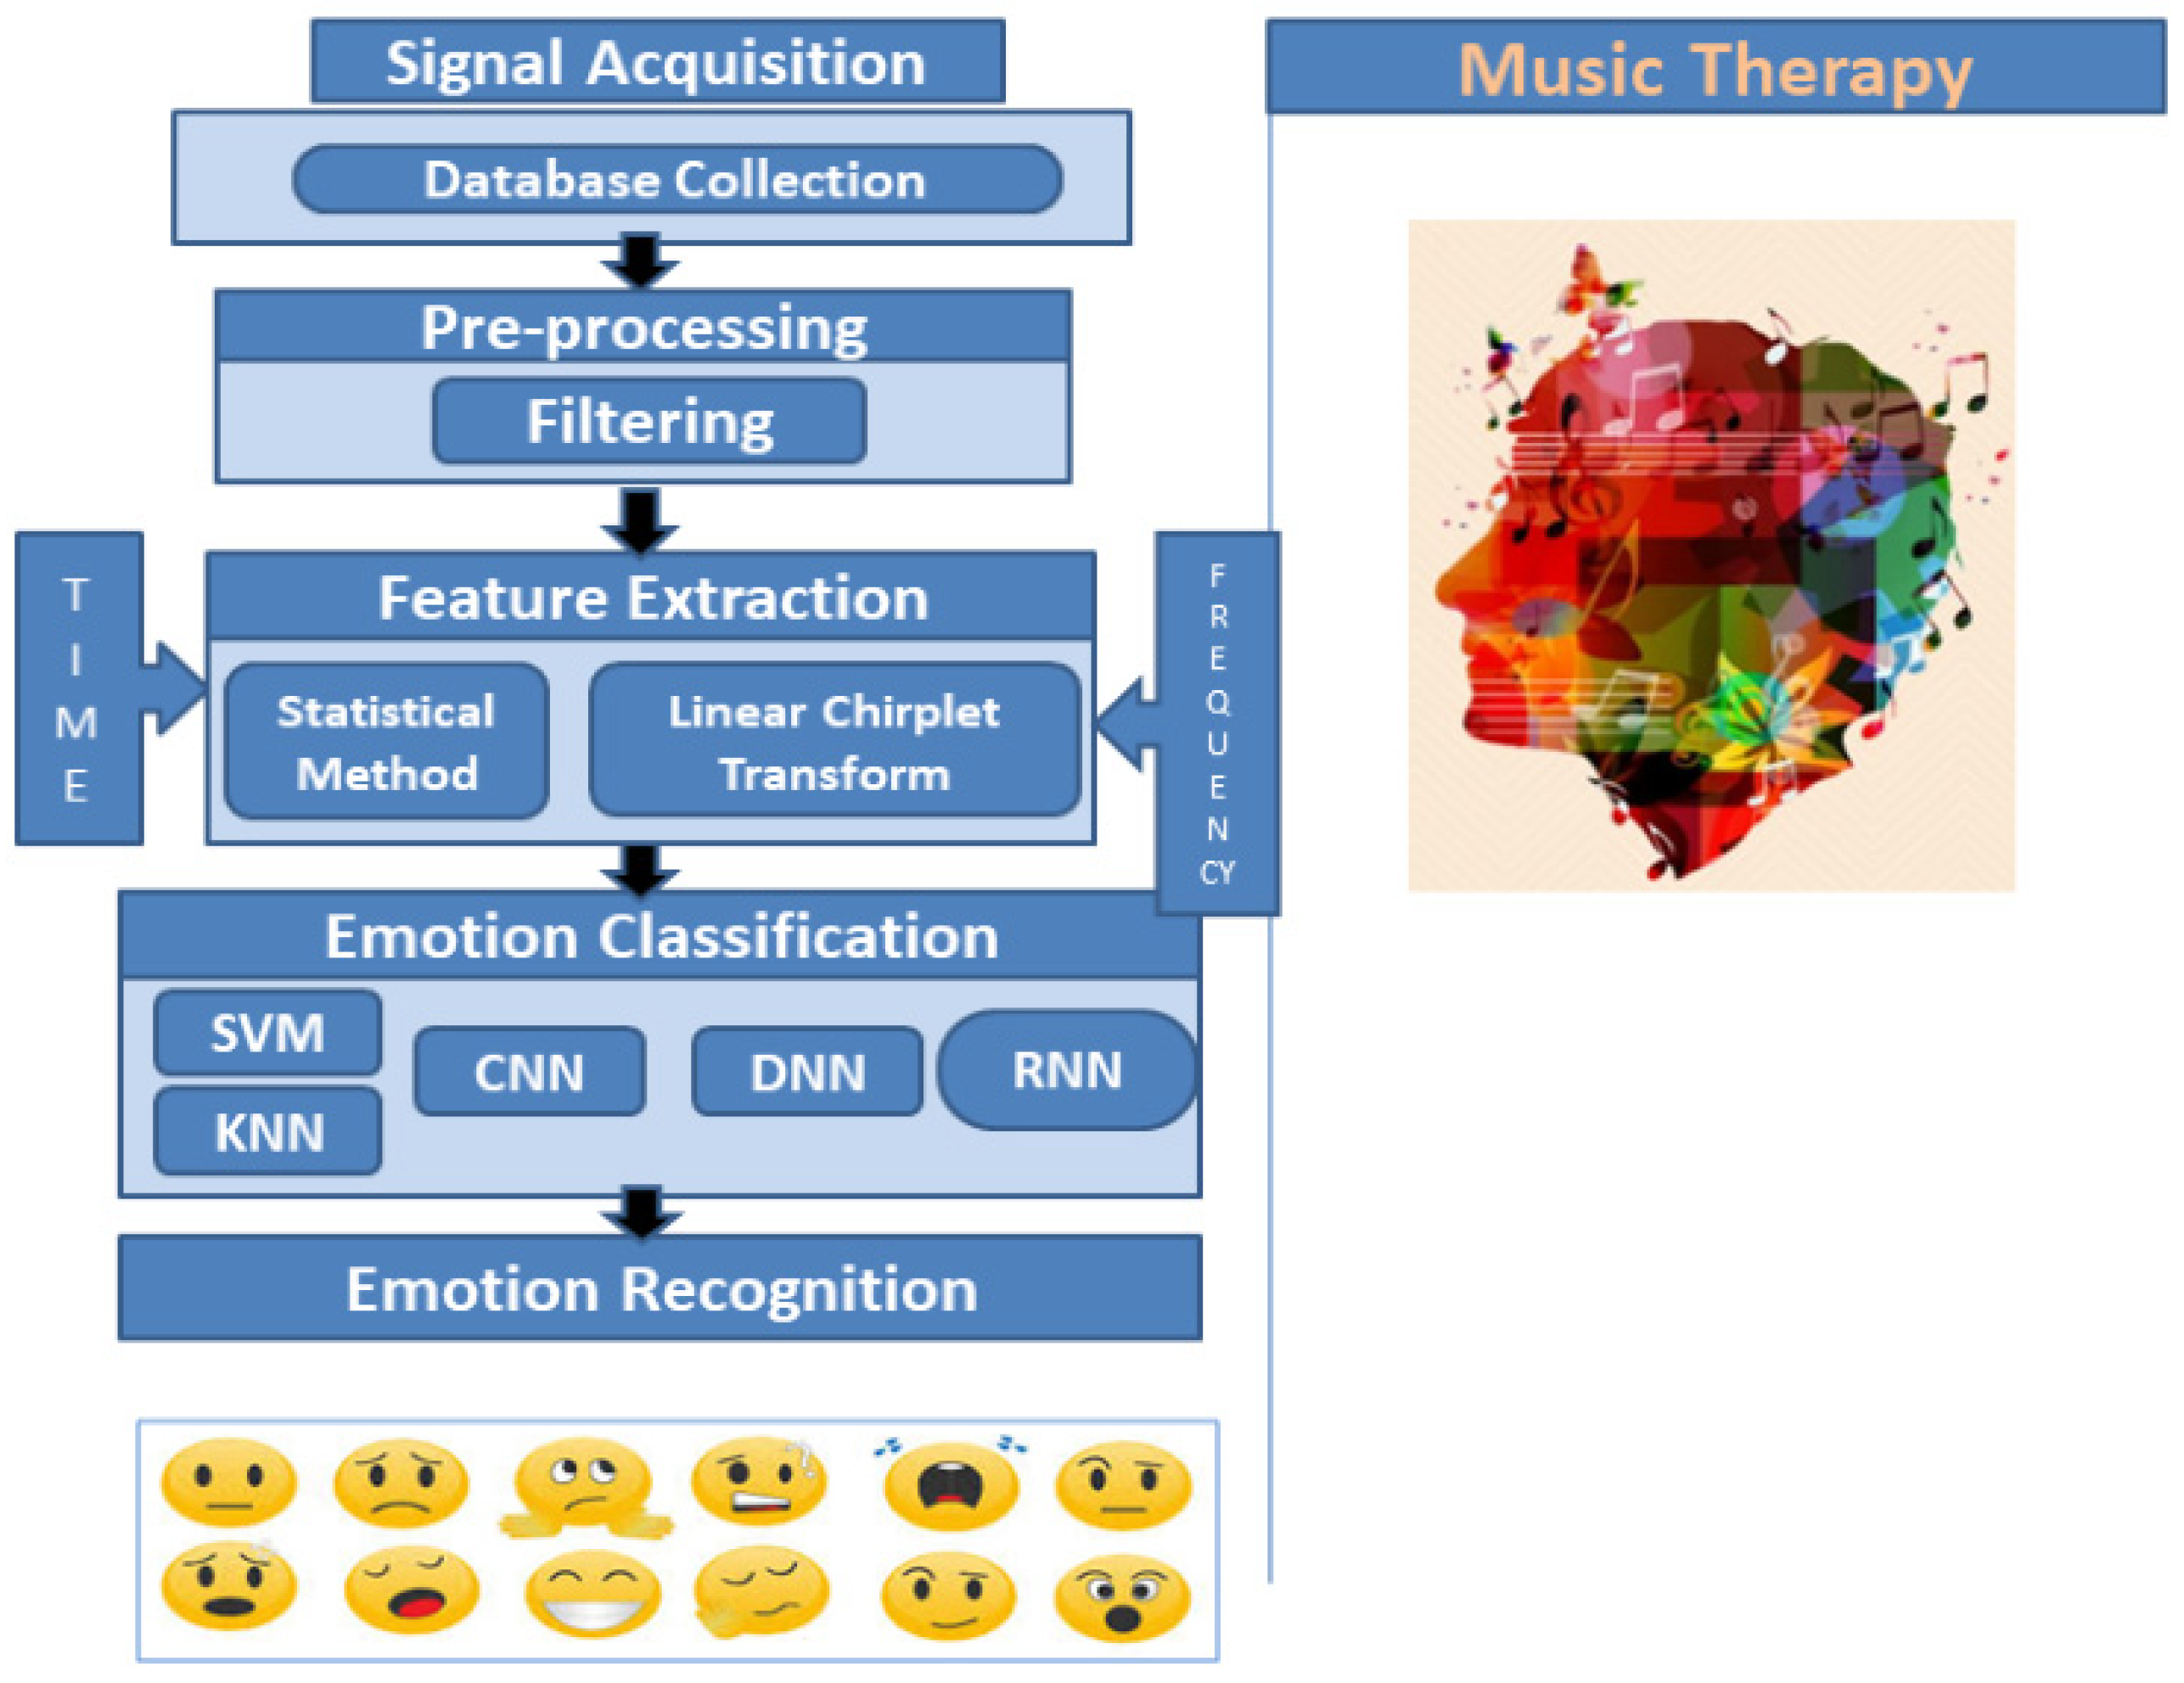
In this section proposed system is explained. Figure 1 represented training phase. This phase include acquisition, pre-processing, feature extraction, classification and labelling. For the database collection, the EMOTIVE EPOC 14 channel headset is used. It is handy as well as portable and very much comfortable device with higher cost. With this device, there is need to purchase EMOTIVE PRO software subscription for signal acquisition and storing it offline on our machine. It is observed that this device is very much comfortable while dealing intellectually disable people.
While signal acquisition it is observed that accuracy of EEG headset varies because of the variation in the placement of electrodes and head movement and thick hairs on the head. When the signals are captured for 1 min. Variable size files are generated. In the emotive research manual [3], it is mentioned to save the files only for 128 samples as the sampling frequency used is 128 Hz. The files were edited and only 128 samples of 14 channel data is saved in .csv format. In the pre-processing stage, baseline and noise is removed by using the filtering technique. Five steps are used in the pre-processing stage. In Section 5, feature extraction technique is explained in detail. The mathematical modelling technique is used to calculate features of the signals. Among 24 features, band power is ranked as a prominent feature. For feature ranking linear regression, the RFE—recursive feature elimination model is used. It is also called as feature selection model. The variations in band power are shown for each collected signal in EMOTIV Pro software. The band power is divided into theta, alpha, lower beta, beta and gamma waves. K-nearest neighbour classification model is used to classify emotion. In the testing phase, intellectually disable participants and normal participant’s mental state were tested. Meditation music therapy is used to stable emotional state. It is observed that music therapy stabilizes mental state. It lowers brain activity and calms down, the mental state. It is found to be useful technique for human beings to change mental state.
4. Method
In this section, detailed descriptions of data collection and other steps of system implementation is explained. To conduct the study, normal participants are chosen on the basis of their willingness and intellectually disable participants are chosen by taking consent of their parents. The Emotive Epoc 14 channel EEG headset is simple and very handy. It can only receive signals of brain and it is absolutely no harm device.
4.1. Participant
A total of 22 healthy voluntary participants (15 females, 7 males) with an age range of 12–70 years (mean = 35.55, SD = 16.97) took part in the study for collection of training data. Each participant signed an informed consent form prior to their participation. One of the participant has moderate level autism. She has language and is able to express basic emotions.
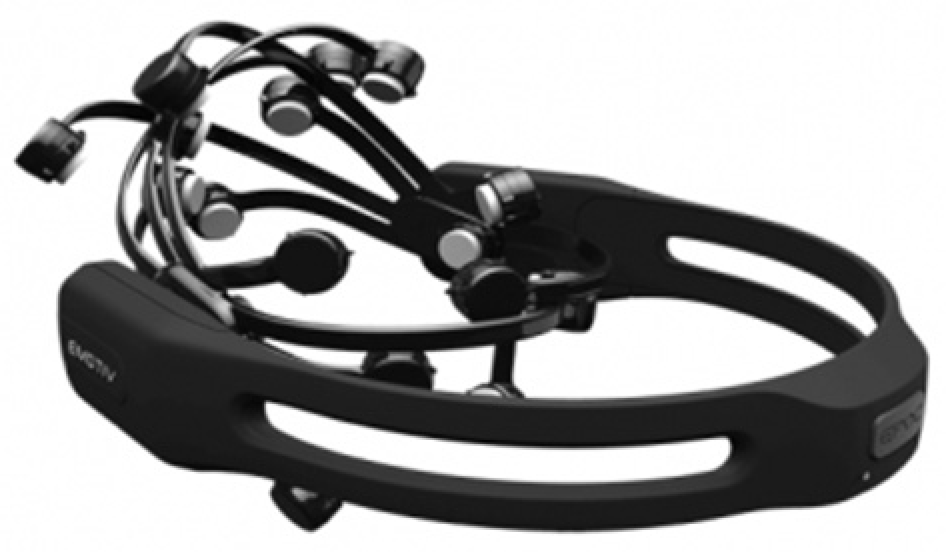
4.2. Equipment and Brain Signals
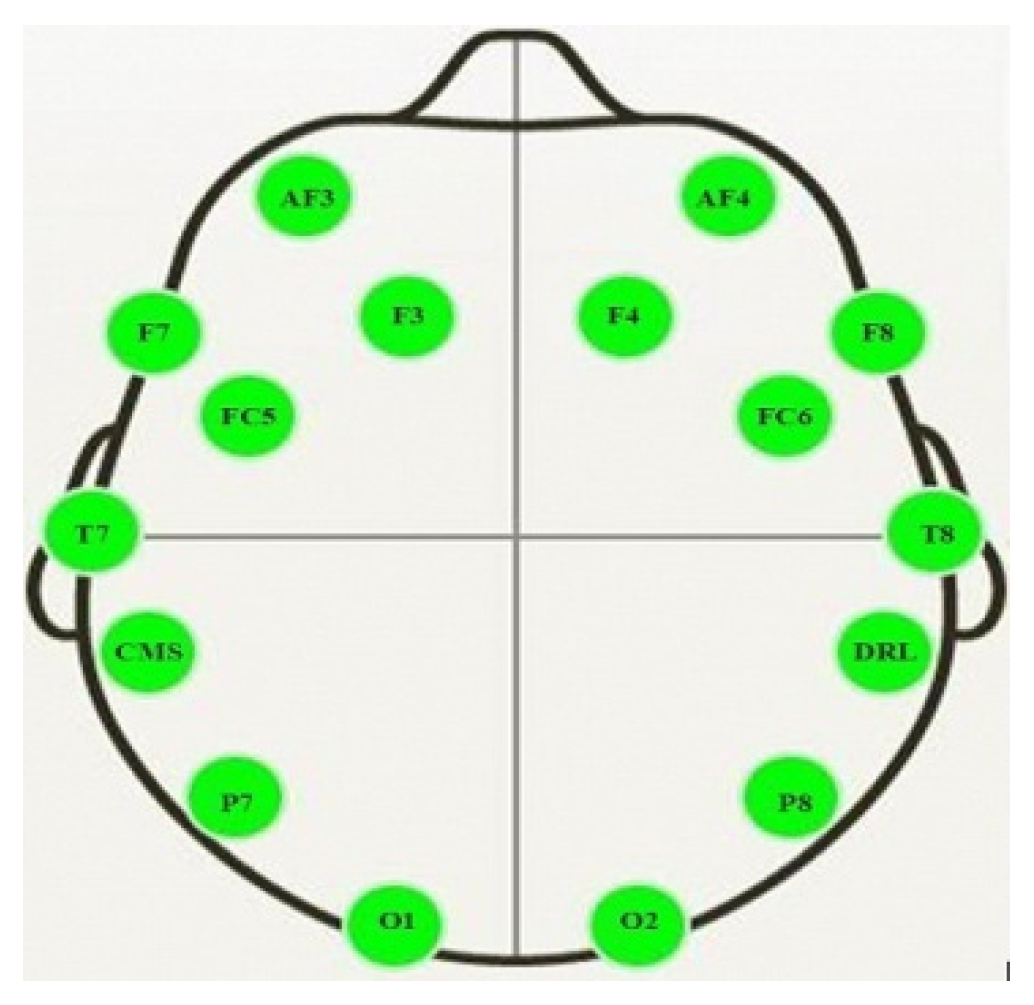
For brain signal acquisition Emotive Epoc 14 channel headset is used. Figure 2 is showing 14 channel EEG headset used in the study. The electrodes of an EEG device capture electrical activity expressed in various EEG frequencies. Using an algorithm called a fast Fourier transform (FFT), these raw EEG signals can be identified as distinct waves with different frequencies. Frequency, which refers to the speed of the electrical oscillations, is measured in cycles per second—one hertz (Hz) is equal to one cycle per second. By using Emotive Epoc, with proper coverage and electrode configuration, it is possible to reconstruct a source model of all important brain regions and to see their interplay. The Emotive Epoc 14 Channel EEG Headset is configured on AF3, F7, F3, FC5, T7, P7, O1, O2, P8, T8, FC6, F4, F8, AF4 and two reference channels: CMS/DRL references at P3/P4; left/right mastoid process alternative. In Figure 3, representation of the electrode point on the skull of human being is shown. The sensor material is saline soaked felt pads. Sequential sampling and the single ADC method is used. The rate of sampling is 2048 internal down sampled to 128 SPS or 256 SPS (user configured). Built in digital 5th order sinc filter is used. Bandwidth: 0.16–43 Hz, with digital notch filters at 50 Hz and 60 Hz [17].
4.3. Procedure
4.3.1. Database Collection
When a participant arrived, the experimenter introduced the Emotive EPOC 14 channel EEG headset and asked the participant to fill out an informed consent form and a back ground questionnaire. Before the actual experiment, a practice trial was run to get participants used to the stimulation and the procedure. The data collection task is done in a normal environment setting including noisy situations. The steps are mentioned below:
- The participant was seated in front of the experimenter.
- When the participant getst settled down, the experimenter starts the experiment.
- Renu saline solution is applied on the sensor material to increase sensing capacity.
- Epoc 14 channel EEG Headset is placed on the skull of the participant.
- Electrode is adjusted till the maximum accuracy is not achieved.
- Some time is given to the participant to understand his/her mental state.
- Participant is asked to choose stimuli for activation of the emotion.
- Three types of stimulus thoughts, audio and video are used to elicit emotions in them. Subjects are asked to choose the type of stimulus.
- When participants convey the ready signal, EEG signal acquisition started. The minimum time of the recording is 1 min. Recording is done at a 128 Hz sampling rate.
- This procedure is repeated for capturing four types of emotion signal (angry, calm, happy and sad).
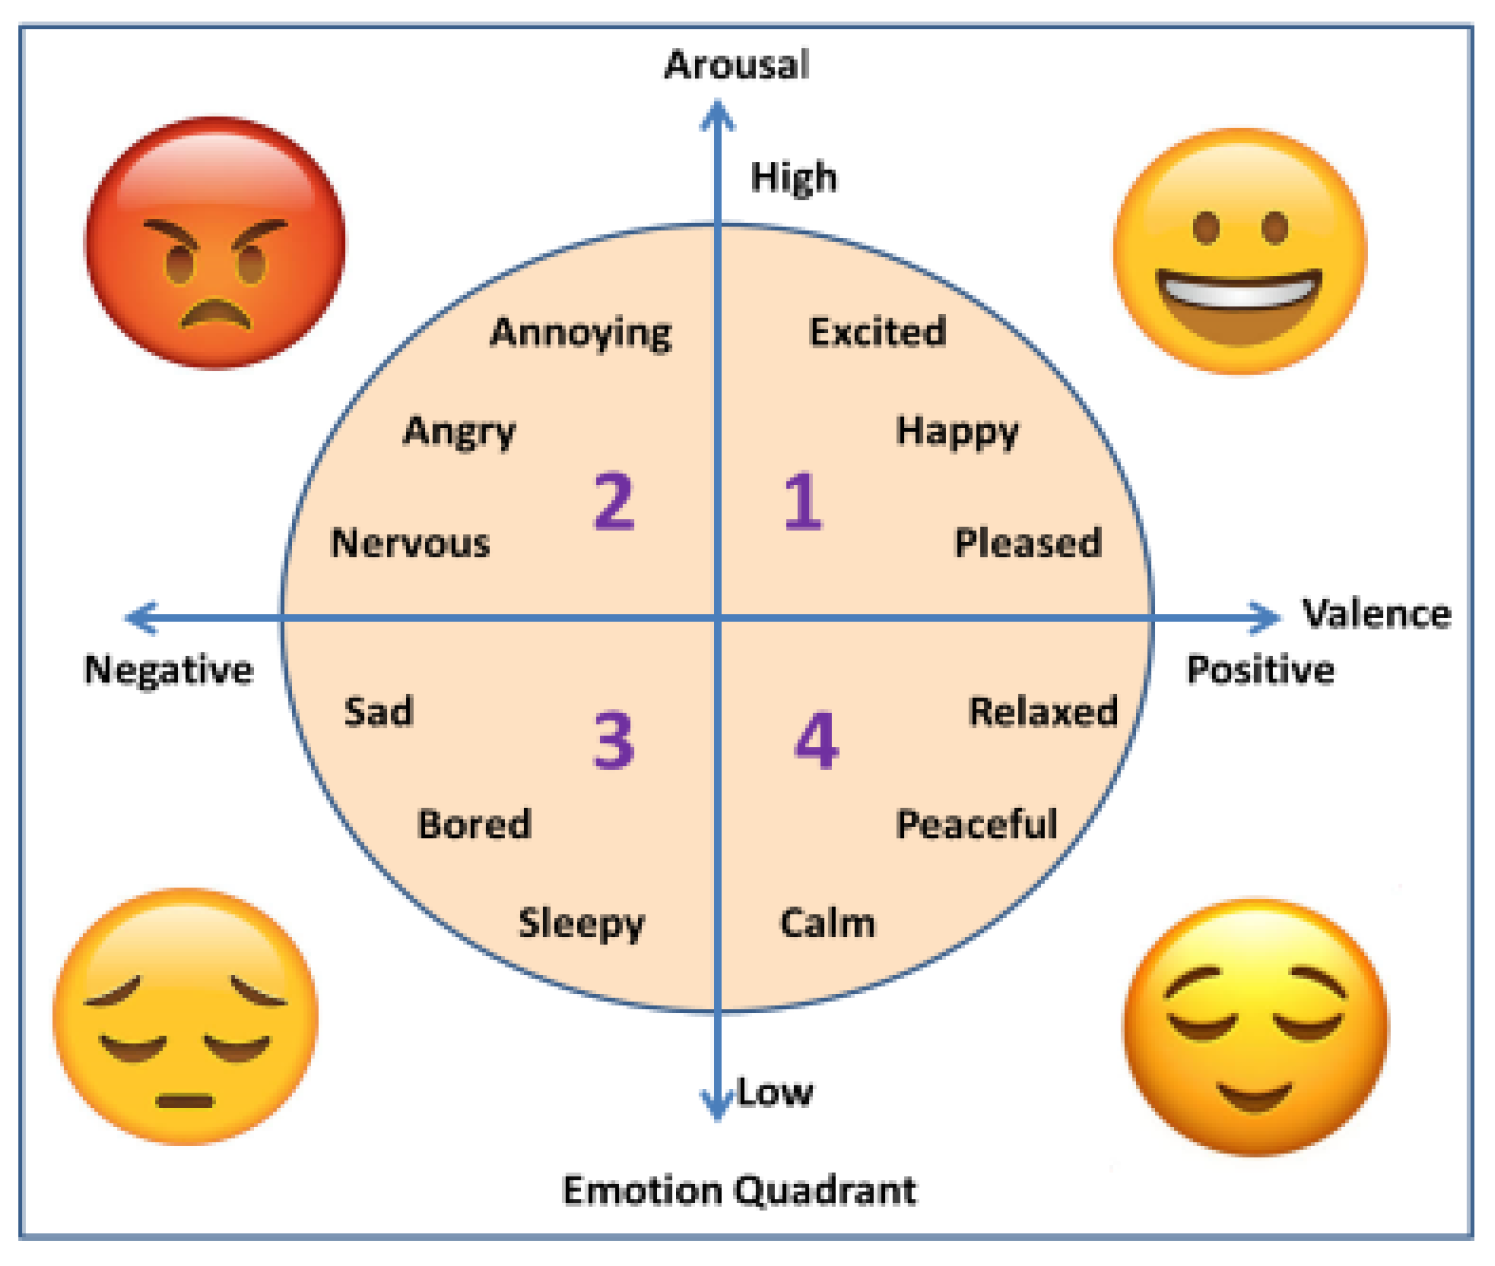
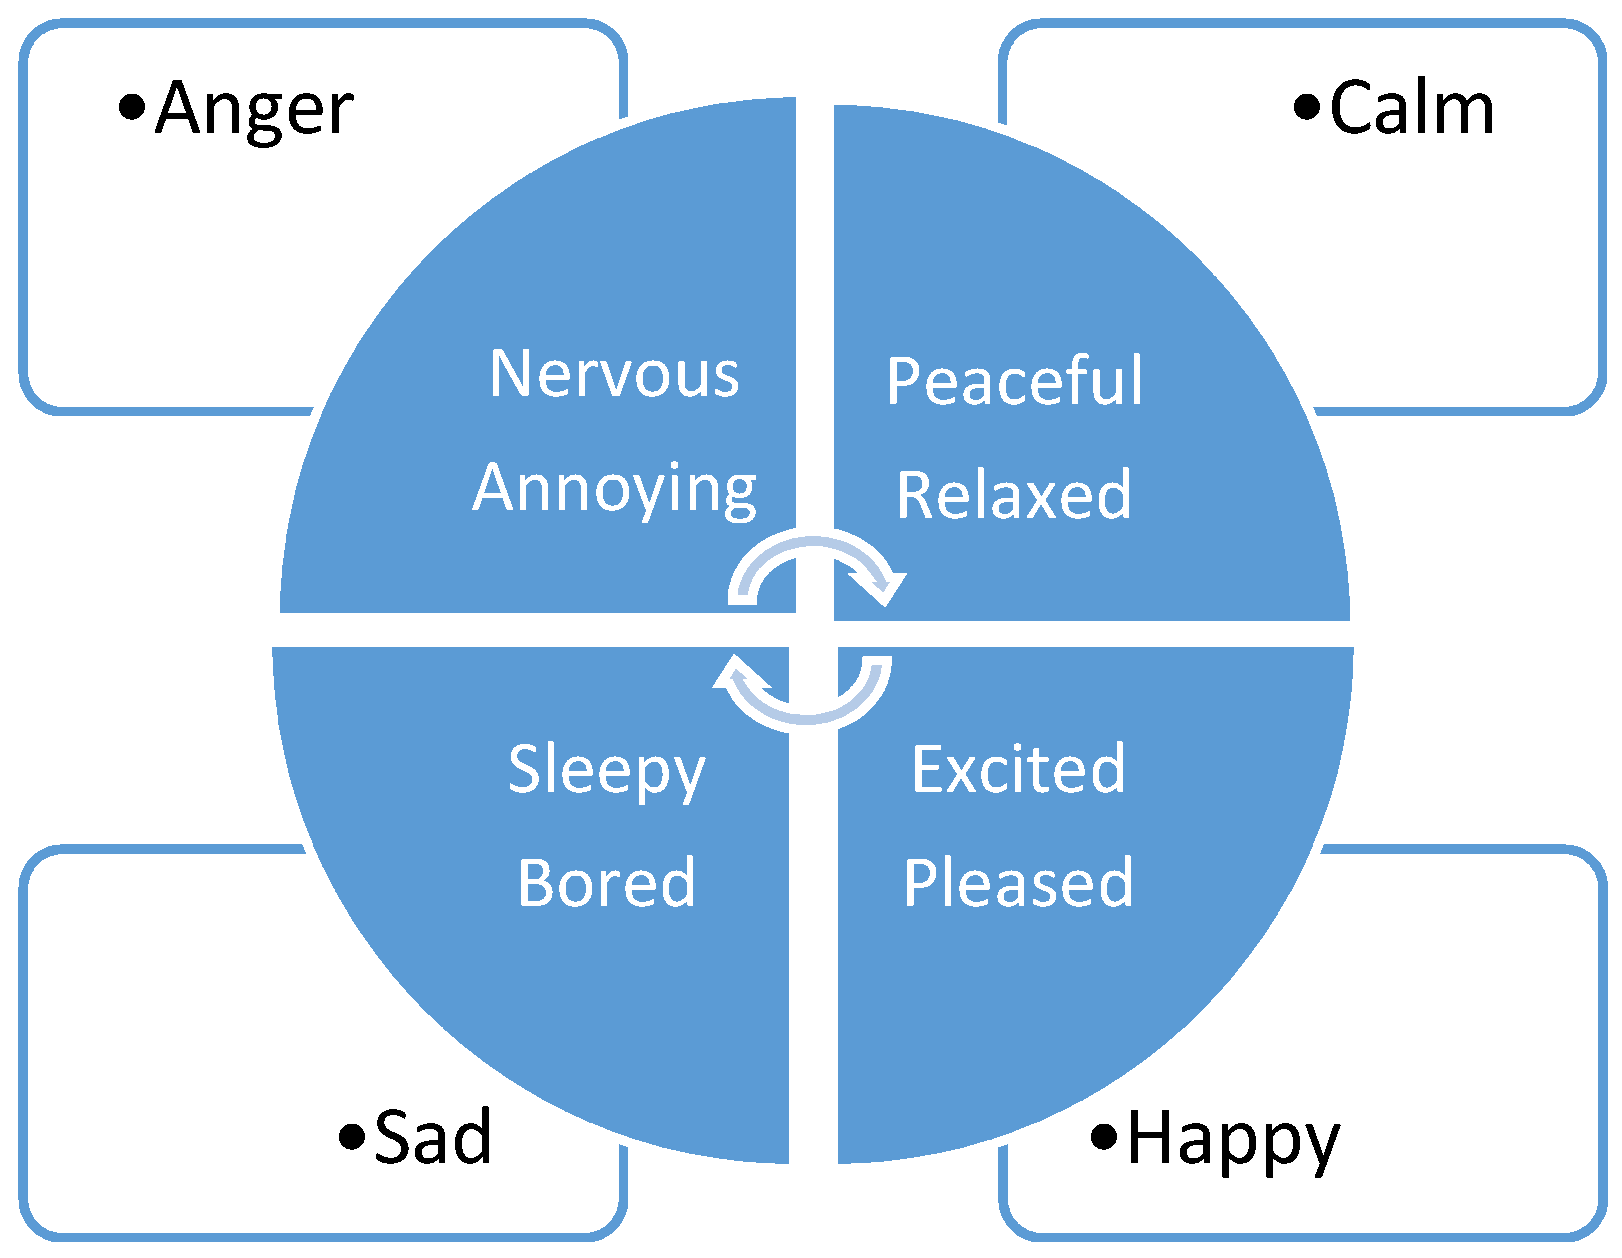
A total 120 emotion signals are captured. The 30 emotions signal of each emotion class. The four main classes of emotion along with 12 subtypes are represented in Figure 4. Signals get stored on the Emotive cloud. It can be latter saved to experimenter machine. Participants were choosing audio stimulus to elicit calm type of emotion. Video stimulus is used to elicit anger type of emotions. Subjects choose self-thoughts also for eliciting emotion. Some of the past experiences are deep rooted in our brain and while recalling it same type of intense emotion could be experienced. It is observed that thoughts are also a very effective type of stimulus for eliciting emotions.
● Challenges in data collection state:
It is found to be very difficult to get the signal at intense emotion arousal state. Sometimes the subject felt confusion in labelling the emotion. It is also observed that while recording signals, subjects experience changing emotions. Database collection was the difficult task. While collecting the database, it is observed that collection of the sad emotional state is not easy. Different types of stimulus were used to elicit sad emotion but eliciting intense sad emotion was near about impossible when it was purposefully tried. Initially, when emotive EEG headset is placed on the subjects head, subjects felt anxious and excited too and after getting settle down they felt relax, they called it a normal state. It is also observed, that the accuracy of the EEG headset was fluctuating while signal capturing process. It was different for every subject and for every emotion.
4.3.2. Pre-Processing
For pre-processing, at the first stage ZERO-PHASE, the low pass filter is designed. The coefficient of filters are Alpha = 0.8 and NumCoef = 1 − Alpha as a numerator coefficient and DenCoef = [1 − Alpha] as a denominator coefficient. [h, t] = impz (NumCoef, DenCoef, N) returns the impulse response of the digital filter with numerator coefficients alpha and denominator coefficients NumCoef. This function chooses the number of samples and returns the response coefficients in h and the sample times in t. In this case N = 100. FS, the recording frequency, is 128. In the second stage, Filtfilt is used for filtering, which preserves features in a filtered time waveform exactly where they occur in the unfiltered signal. It performs zero-phase digital filtering by processing the input data, x, in both the forward and reverse directions. After filtering the data in the forward direction, filtfilt reverses the filtered sequence and runs it back through the filter.
The result has the following characteristics:
- Zero phase distortion.
- A filter transfer function equal to the squared magnitude of the original filter transfer function.
- A filter order that is double the order of the filter specified by coefficients of denominator and numerator.
In the third stage, baseline removal is used. Baseline can be removed from data by either including a baseline function when fitting a sum of functions to the data, or by actually subtracting a baseline estimate from the data. In the fourth stage, the low pass filter is used. In the fifth stage, independent component analysis is used to separate independent sources linearly mixed in several sensors. For instance, when recording electroencephalograms (EEGs) on the scalp, ICA can separate out artefacts embedded in the data (since they are usually independent of each other). Independent component analysis is a signal processing method to separate independent sources linearly mixed in several sensors. For instance, when recording electroencephalograms (EEG) on the scalp, ICA can separate out artifacts embedded in the data (since they are usually independent of each other). The EEG signal is a mixture of linearly independent source components (IC) that can be separated by ICA, visually examined, and classified as artifact or EEG signal components. Once the artifact components have been identified, they can be removed and the remaining EEG signal components can be projected back to the original time domain. This procedure yields the reconstruction of an artifact-free EEG [18].
4.3.3. Feature Extraction
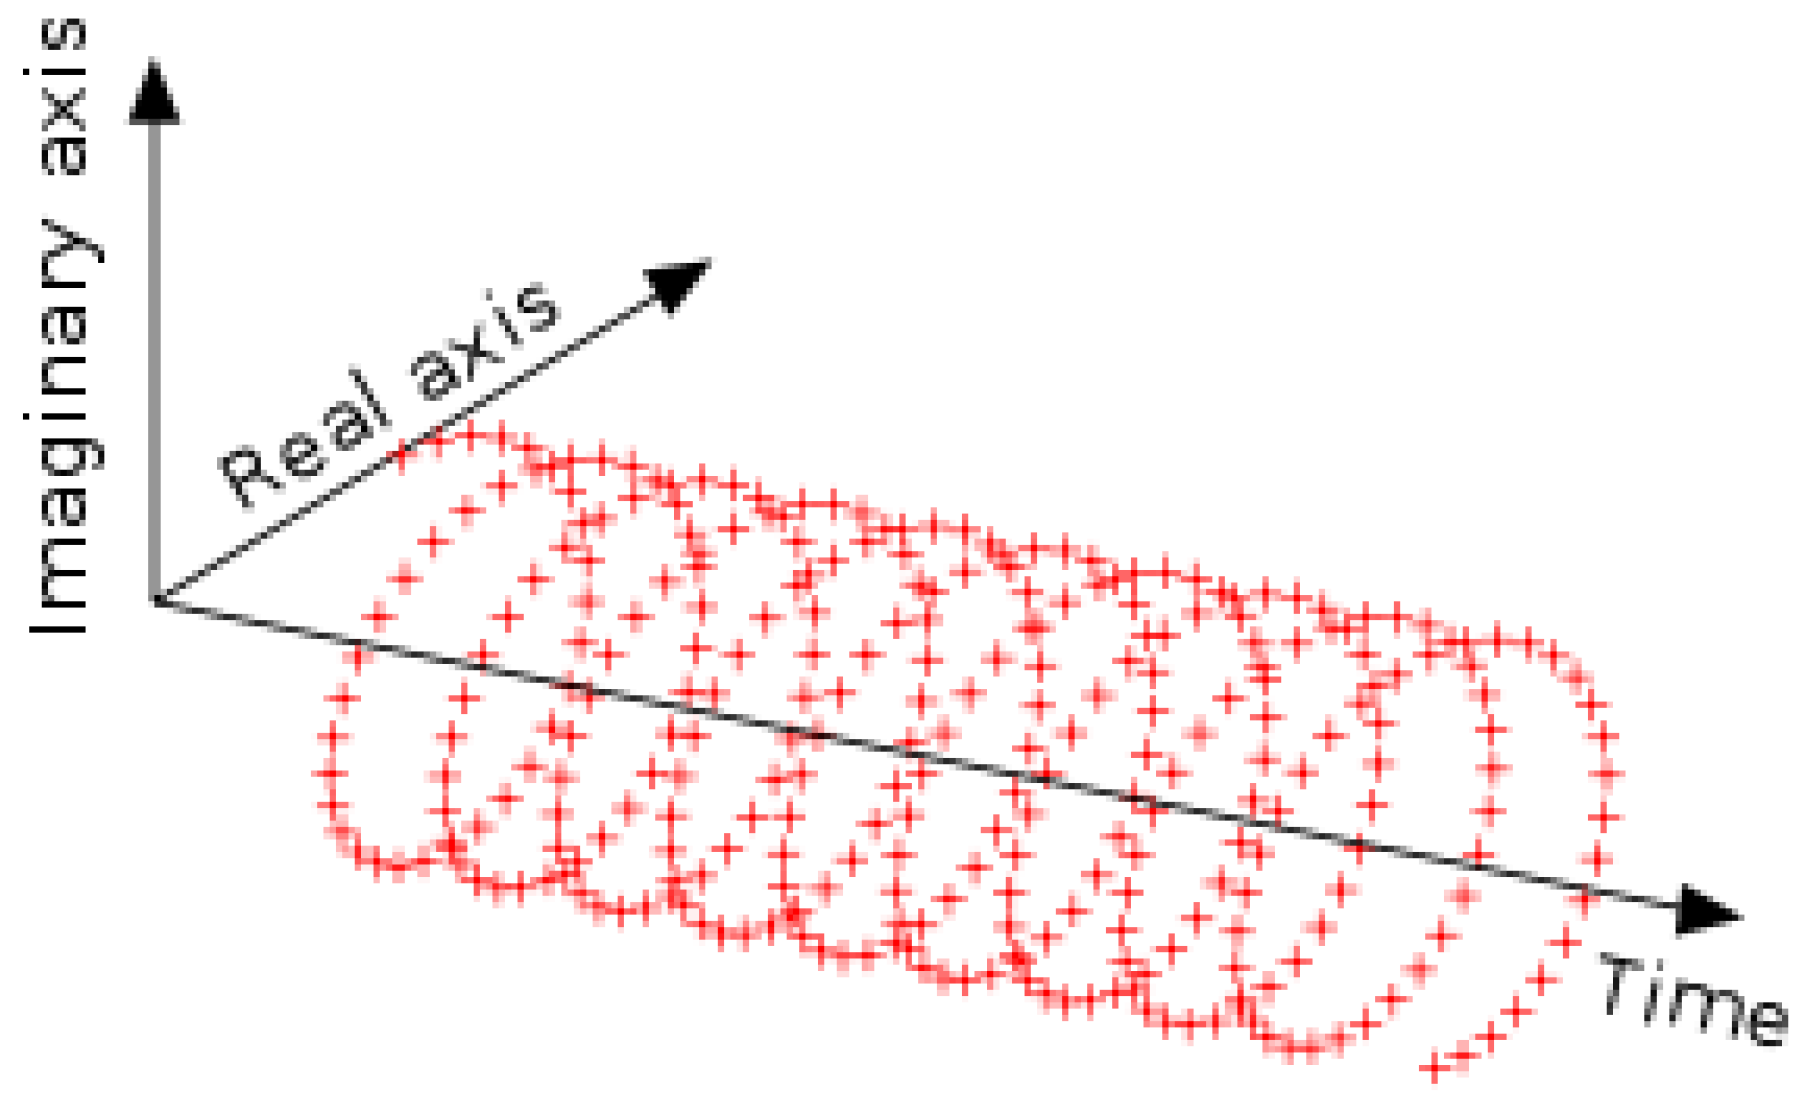
After obtaining the noise-free signals from the signal enhancement phase, essential features from the brain signals were extracted. Feature extraction aims at describing the signals by a few relevant values called “features”. With the help of feature extraction, the original EEG data is retrieved with reduced number of variables so as to find a difference in the different brain states during different tasks. Various temporal and spatial approaches have been applied to extract features from the physiological signal. The 24 features of EEG signal are extracted by using statistical modeling technique. Chirplet transform is performed on the signal before extracting frequency domain feature. In traditional signal processing, wavelet transform were used. Waves are harmonic oscillations, such as sin (wt), where w is the frequency of the wave. In a more strict use of the term, there are other mathematical restrictions such as the absence of a DC component. A recently-proposed alternative to waves and wavelets are the chirplets. It has the most flexible time frequency window and successfully used in practices. The chirplet transform is a useful signal analysis and representation framework that has been used to excise chirp-like interference in spread spectrum communications, in EEG processing, and Chirplet time domain reflectometry.
- (a)
- Chirplet Transform
The Chirplet transform is an inner product of an input signal with a family of analysis primitives called Chirplet. In Figure 5 chirplet is shown.
The algorithm of Chirplet transform is mentioned below
- Convert signal column vector into row vector.
- Select chirp rate as 5 and sampling frequency as 128;
- C = 5;
- Fs = 128 hz;
- The length of window function can be selected as
- h = 2v; v = {0, 1, 2, 4, 8, 16, 32}
- h = {1, 2, 4, 8, 16, 32, 64, 128}
- Ideally the value of window function, h should be equal to sampling frequency.
- Use reshape function:
- RESHAPE function returns the M-by-N matrix whose elements
- are taken column wise from X. An error results if X does not have have M*N elements. RESHAPE(X, …, [], …) calculates the length
- of the dimension represented by [], such that the product
- of the dimensions equals NUMEL(X). The value of NUMEL(X) must be evenly divisible by the product of the specified dimensions.
- SIGLCT = reshape(SIGLCT,size(SIGLCT,2)/h,h);
- [Sig_Len] = size(SIGLCT,1);%Row
- WindowVector = 1:Sig_Len;
- Lh = 0;
- tt = (1:Sig_Len)/fs;
- TFR= zeros (Sig_Len,Sig_Len);
- tau = 0;
- for i1 = 1:Sig_Len
- % Amplitude
- Ti = WindowVector(i1);
- tau = -min([round(Sig_Len/2)-1, Lh, ti-1]):min([round(Sig_Len/2)-1, Lh, Sig_Len-ti]);
- indices= rem(Sig_Len + tau,Sig_Len) + 1;
- rSig = SIGLCT(ti + tau, 1);
- TFR(indices,i1) = rSig. ∗ conj(h(Lh + 1+tau)). ∗ exp(-j ∗ 2.0 ∗ pi ∗ (c/2) ∗ (tt(ti + tau)-tt(i1)).^2)’;
- end
- TFR = fft(TFR);
- TFR = TFR(1:round(end/2),:);
- TFR1 = mean (TFR, 1);
Compared with the conventional and advanced time frequency analysis (TFA) methods, general linear chirplet transform (GLCT) shows a superior ability to characterize the non-linear time frequency (TF) features accurately for both mono-component and multi-component signals. By estimating the IF, of the signal and reconstructing the signal, the results indicate that GLCT is more robust against noise than conventional TFA methods [19].
A total of 24 features were extracted from the database. The dimension of feature set file is 24 ∗ 120. Mean, standard deviation, variances, skewness, kurtosis, IEEG—integrated EEG, mean absolute value (MAV), modified mean absolute value type 1, modified mean absolute value type 2, simple square integral—SSI, variance of EEG—VEEG, root mean square—RMS, difference absolute standard deviation value mean2 (DASTD), autoregressive power spectral density-PXX, Hjorth activity—HA, Hjorth mobility—HM, Hjorth complexity—HC, waveform length—WL, band power, MaxPow, MaxPowIndex, harmonic distortion, Hilbert parameter, and power spectral density features were selected. In Table 2, extracted features are mentioned.
- (b)
- Feature Ranking
Variable Ranking is the process of ordering the features by the value of some scoring function, which usually measures feature-relevance. It is the process of selecting a subset of relevant features (variables, predictors) for use in model construction:
model = LinearRegression (), rfe = RFE (model, 1)
It is found that for the lower value of h, the correlation between frequency domain features are more. They ranked very high by feature ranking algorithm [20].
Load data—feature set file
Names: = [‘Mean’, ‘STD’, ‘VAR’, ‘SKEW’, ‘Kurtosis’, ‘IEEG’, ‘MAV’, ‘MAV1′, ‘MAV2′, ‘SSI’, ‘VEEG’, ‘RMS’, ‘DASTD’, ‘AREG_PXX’, ‘HA’, ‘HM’, ‘HC’, ’WL’, ‘BANDPOWER’, ‘PERODOGRAM1 (MaxPow)’, ‘PERODOGRAM2 (max Pow index)’,‘ENVOLEPE (Harmonic Dis)’, ‘Hilbert’, ‘PSD’, ‘label’]
dataframe = read_csv (url, names = names)
array = dataframe.values
X = array [:,0:24]
Y = array [:,24]
# feature extraction
model = LinearRegression()
rfe = RFE (model,1)
fit = rfe.fit (X,Y)
print (“Num Features:”, fit.n_features_)
print (“Selected Features:”,fit.support_)
print (“Feature Ranking:”,fit.ranking_)
- (c)
- Observations
- It is found that there is high correlation between features.
- It is suggested that in Chirplet transform value of h, window function should be equal to sampling frequency fs but It is observed that for the increasing value of h, the calculated value of all the features was getting very low which is difficult to processed. The ranking of the features are mentioned in Table 3.
- For h = 64, the harmonic distortion of the signal is calculated as negligible near about 0. The lower value of harmonic distortion (THD) of the signal is represented a more faithful reproduction of the original recording; and communication systems and also less interference with other devices and higher transmit power for the signal of interest.
- Power spectral density function (PSD) ranked first by feature selection algorithm. It shows the strength of the variations (energy) as a function of frequency. In other words, it shows at which frequencies variations are strong and at which frequencies variations are weak. Best and worst feature ranked by linear regression model.
- The band power is ranked high for all the value of h. Hence the band power could be the most prominent feature to classify emotion. The delta band power for both deep sleep and wakefulness, the former would be very high and the latter very low.
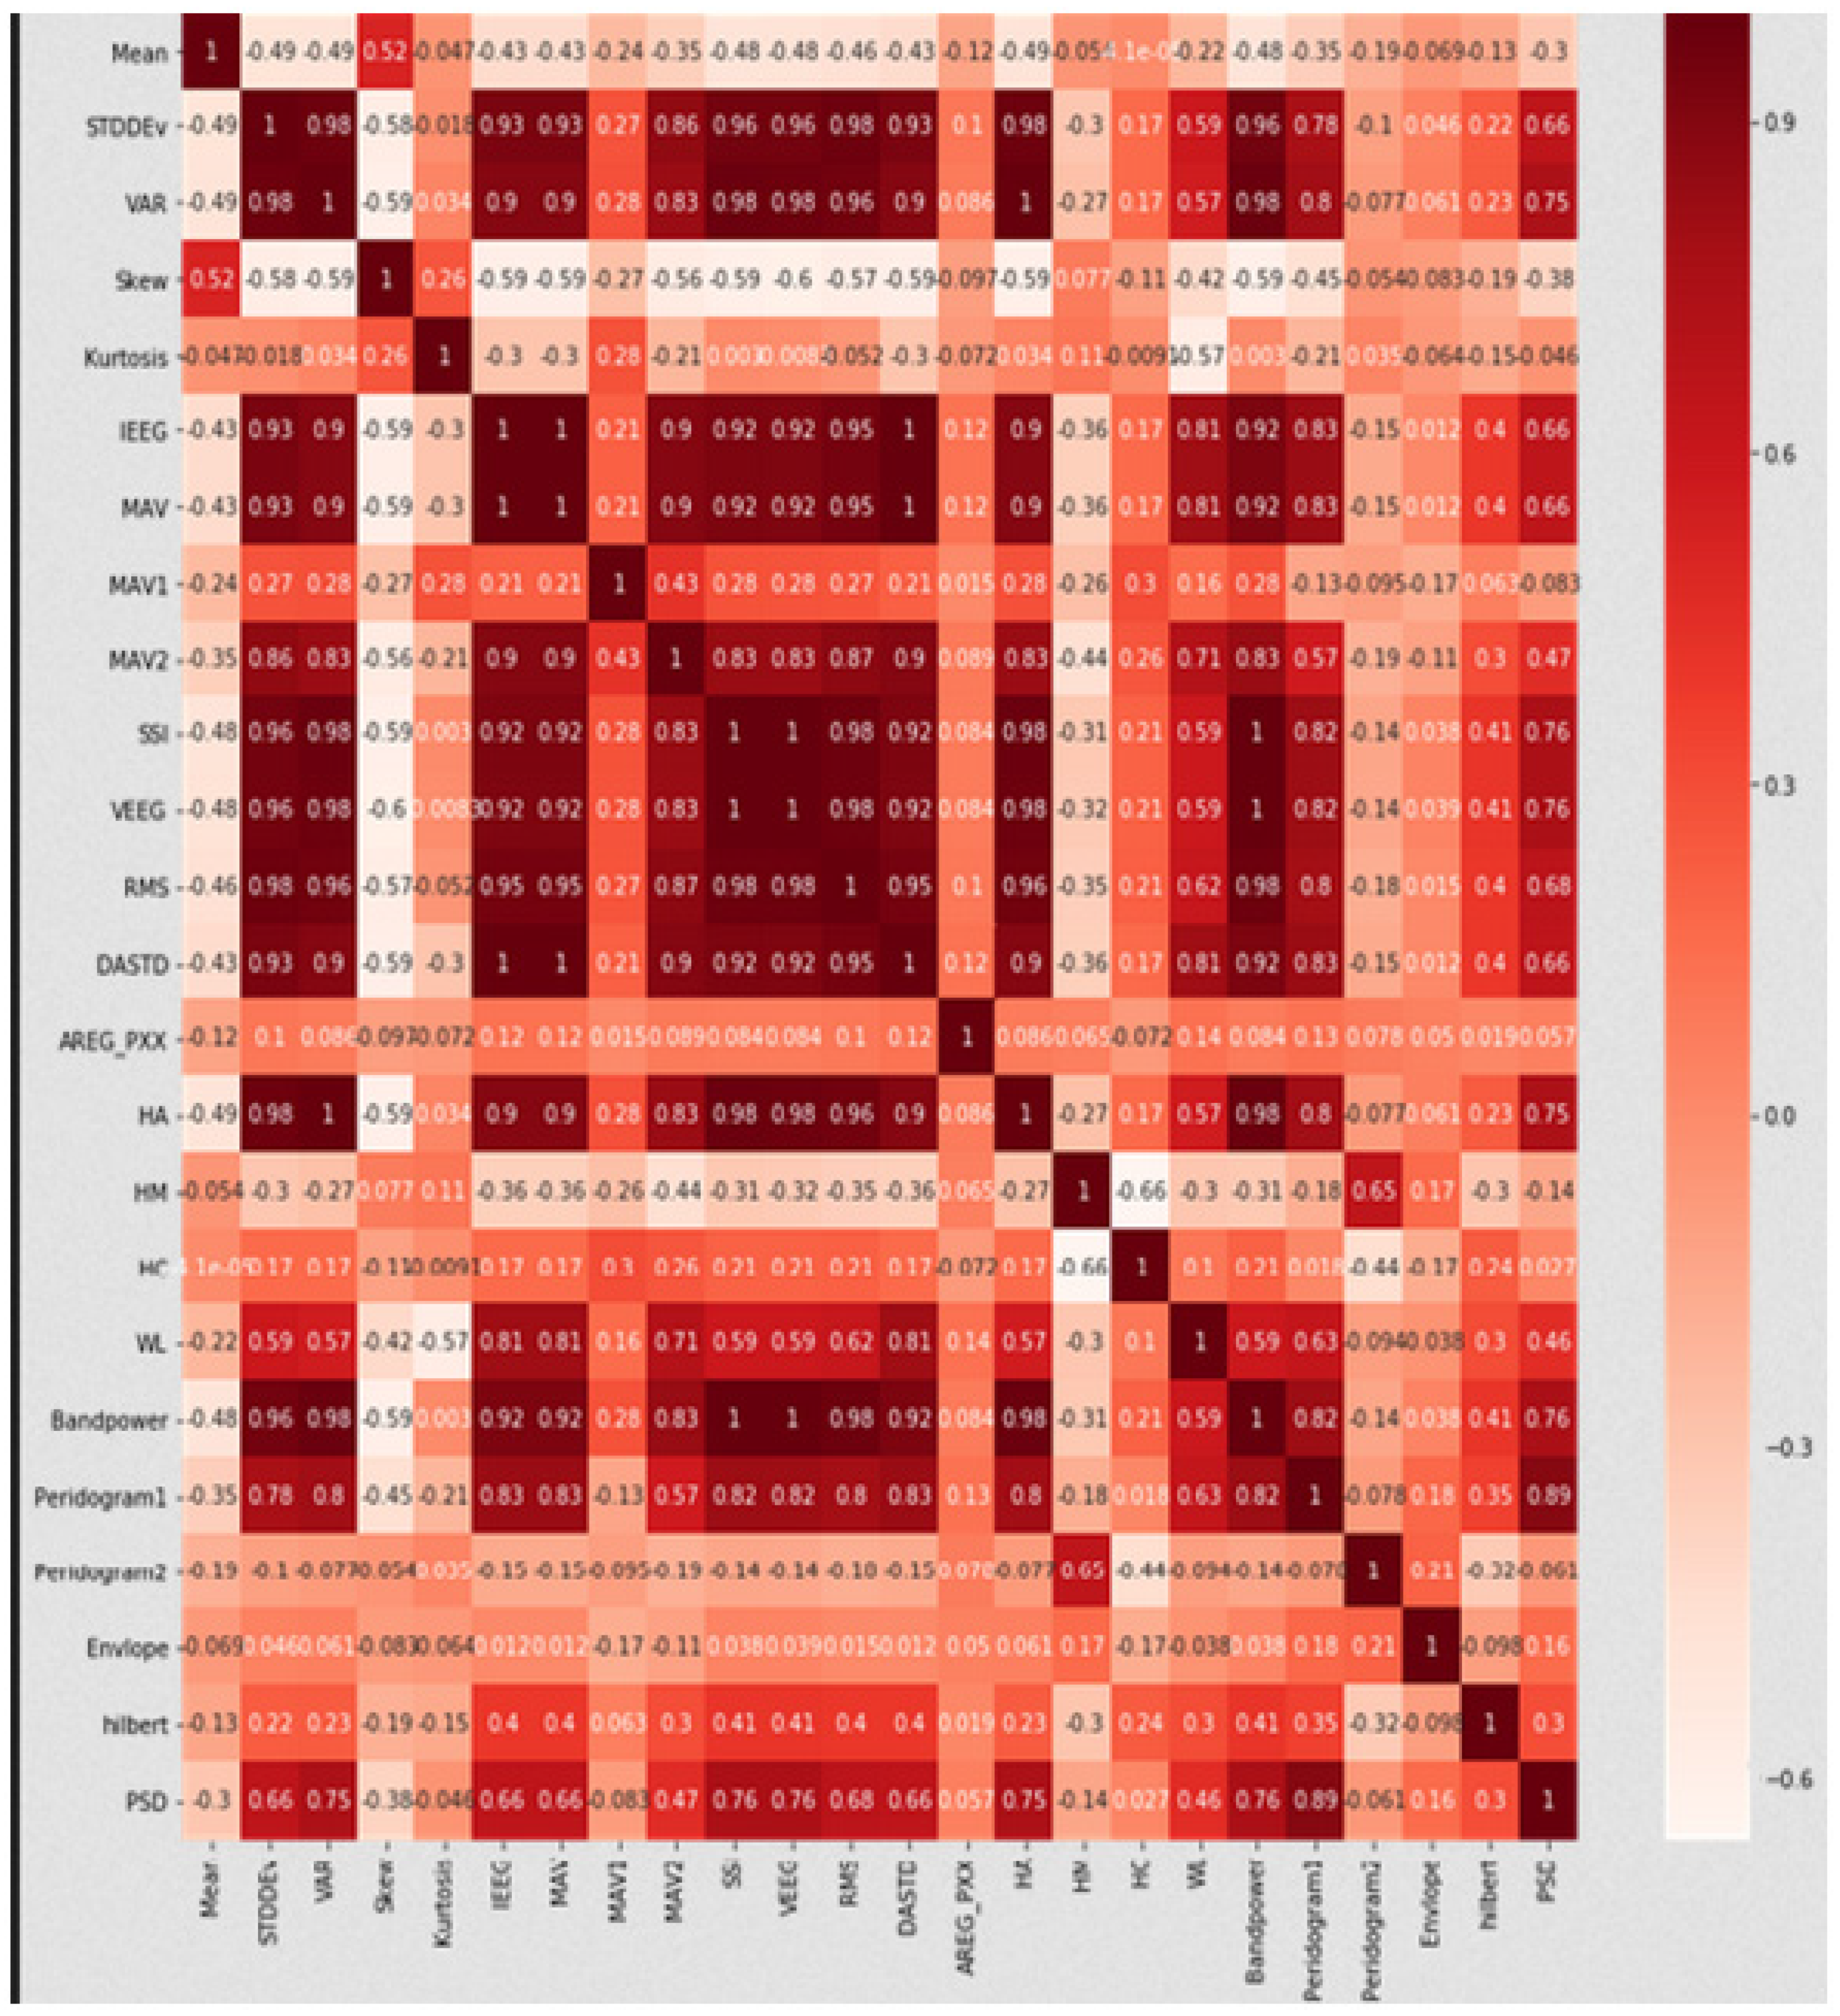
- In Figure 6, correlations between features are shown. It is observed that the correlation between all the features are very high, hence, first all 24 features are considered for classification of emotion and then accuracy of KNN classifier is tested for the features which are ranked high by feature ranking algorithm. For classification, the KNN classifier is used.
4.3.4. Classification
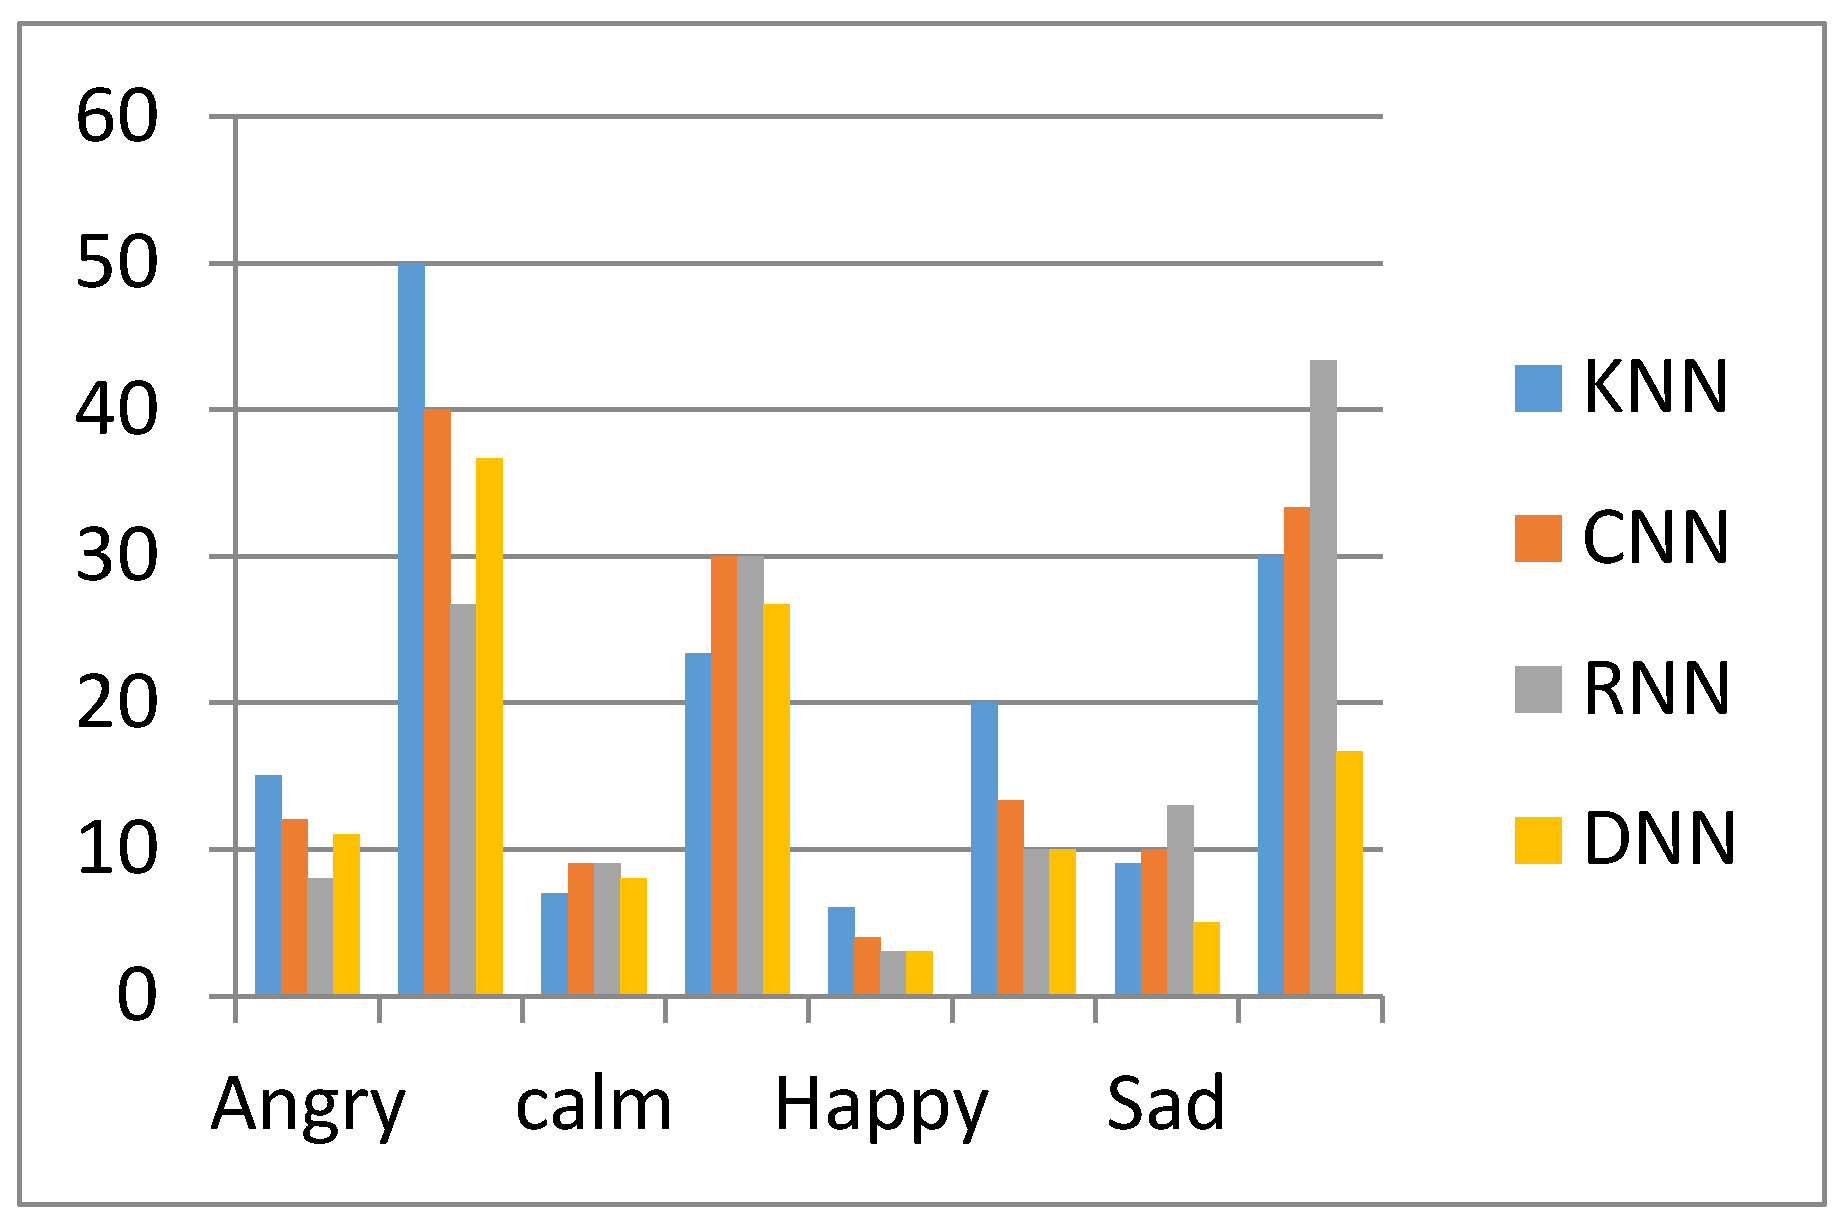
- The FVSET file is created after feature extraction. The dimension of the file is (24 rows ∗ 120 cols). Each row represent extracted feature of signal. Each column represents 24 feature of the signal. The 1 to 30 columns represent features of anger (annoying, angry, and nervous) emotion class. The 31 to 60 columns represent features of calm (calm, peaceful, relaxed) emotion class. The 61 to 90 columns represent features of happy (excited, happy, pleased) emotion class. The 91 to 120 columns represent features of sad (sleepy, bored, sad) emotion class. In Figure 7, accuracy of K nearest neighbour-KNN, convolutional neural network—CNN, recurrent neural network—RNN and deep neural network—DNN is graphically mentioned. It is found to be very low. [20] The accuracy of emotion detection is mentioned below.
Reasons for the low accuracy of the classifiers could be as follows:
- At the time of signal acquisition it was getting difficult for the subject to label the emotion.
- Participants experienced sudden change in the emotions.
- Participants selected stimulus randomly.
- Features are highly correlated with each other.
- The calculated values are very low to discriminate from other feature.
It is observed that results of KNN classifier is more as compare to other classifier because of small size of database. An emotion overlapping is found in the testing results. It is shown in Figure 8. It is very difficult for the human being to discriminate between subtle emotions. Sometimes people could not discriminate between anger and sad, calm and happy.
Accuracy of KNN classifier is found to be high as compare to other algorithms. KNN classifier works efficiently good for less number of samples [20]. Hence detailed performance analysis of KNN classifier is done. In Table 4, accuracy of KNN classifier with emotion overlapping is mentioned and in Figure 9, it is represented graphically.
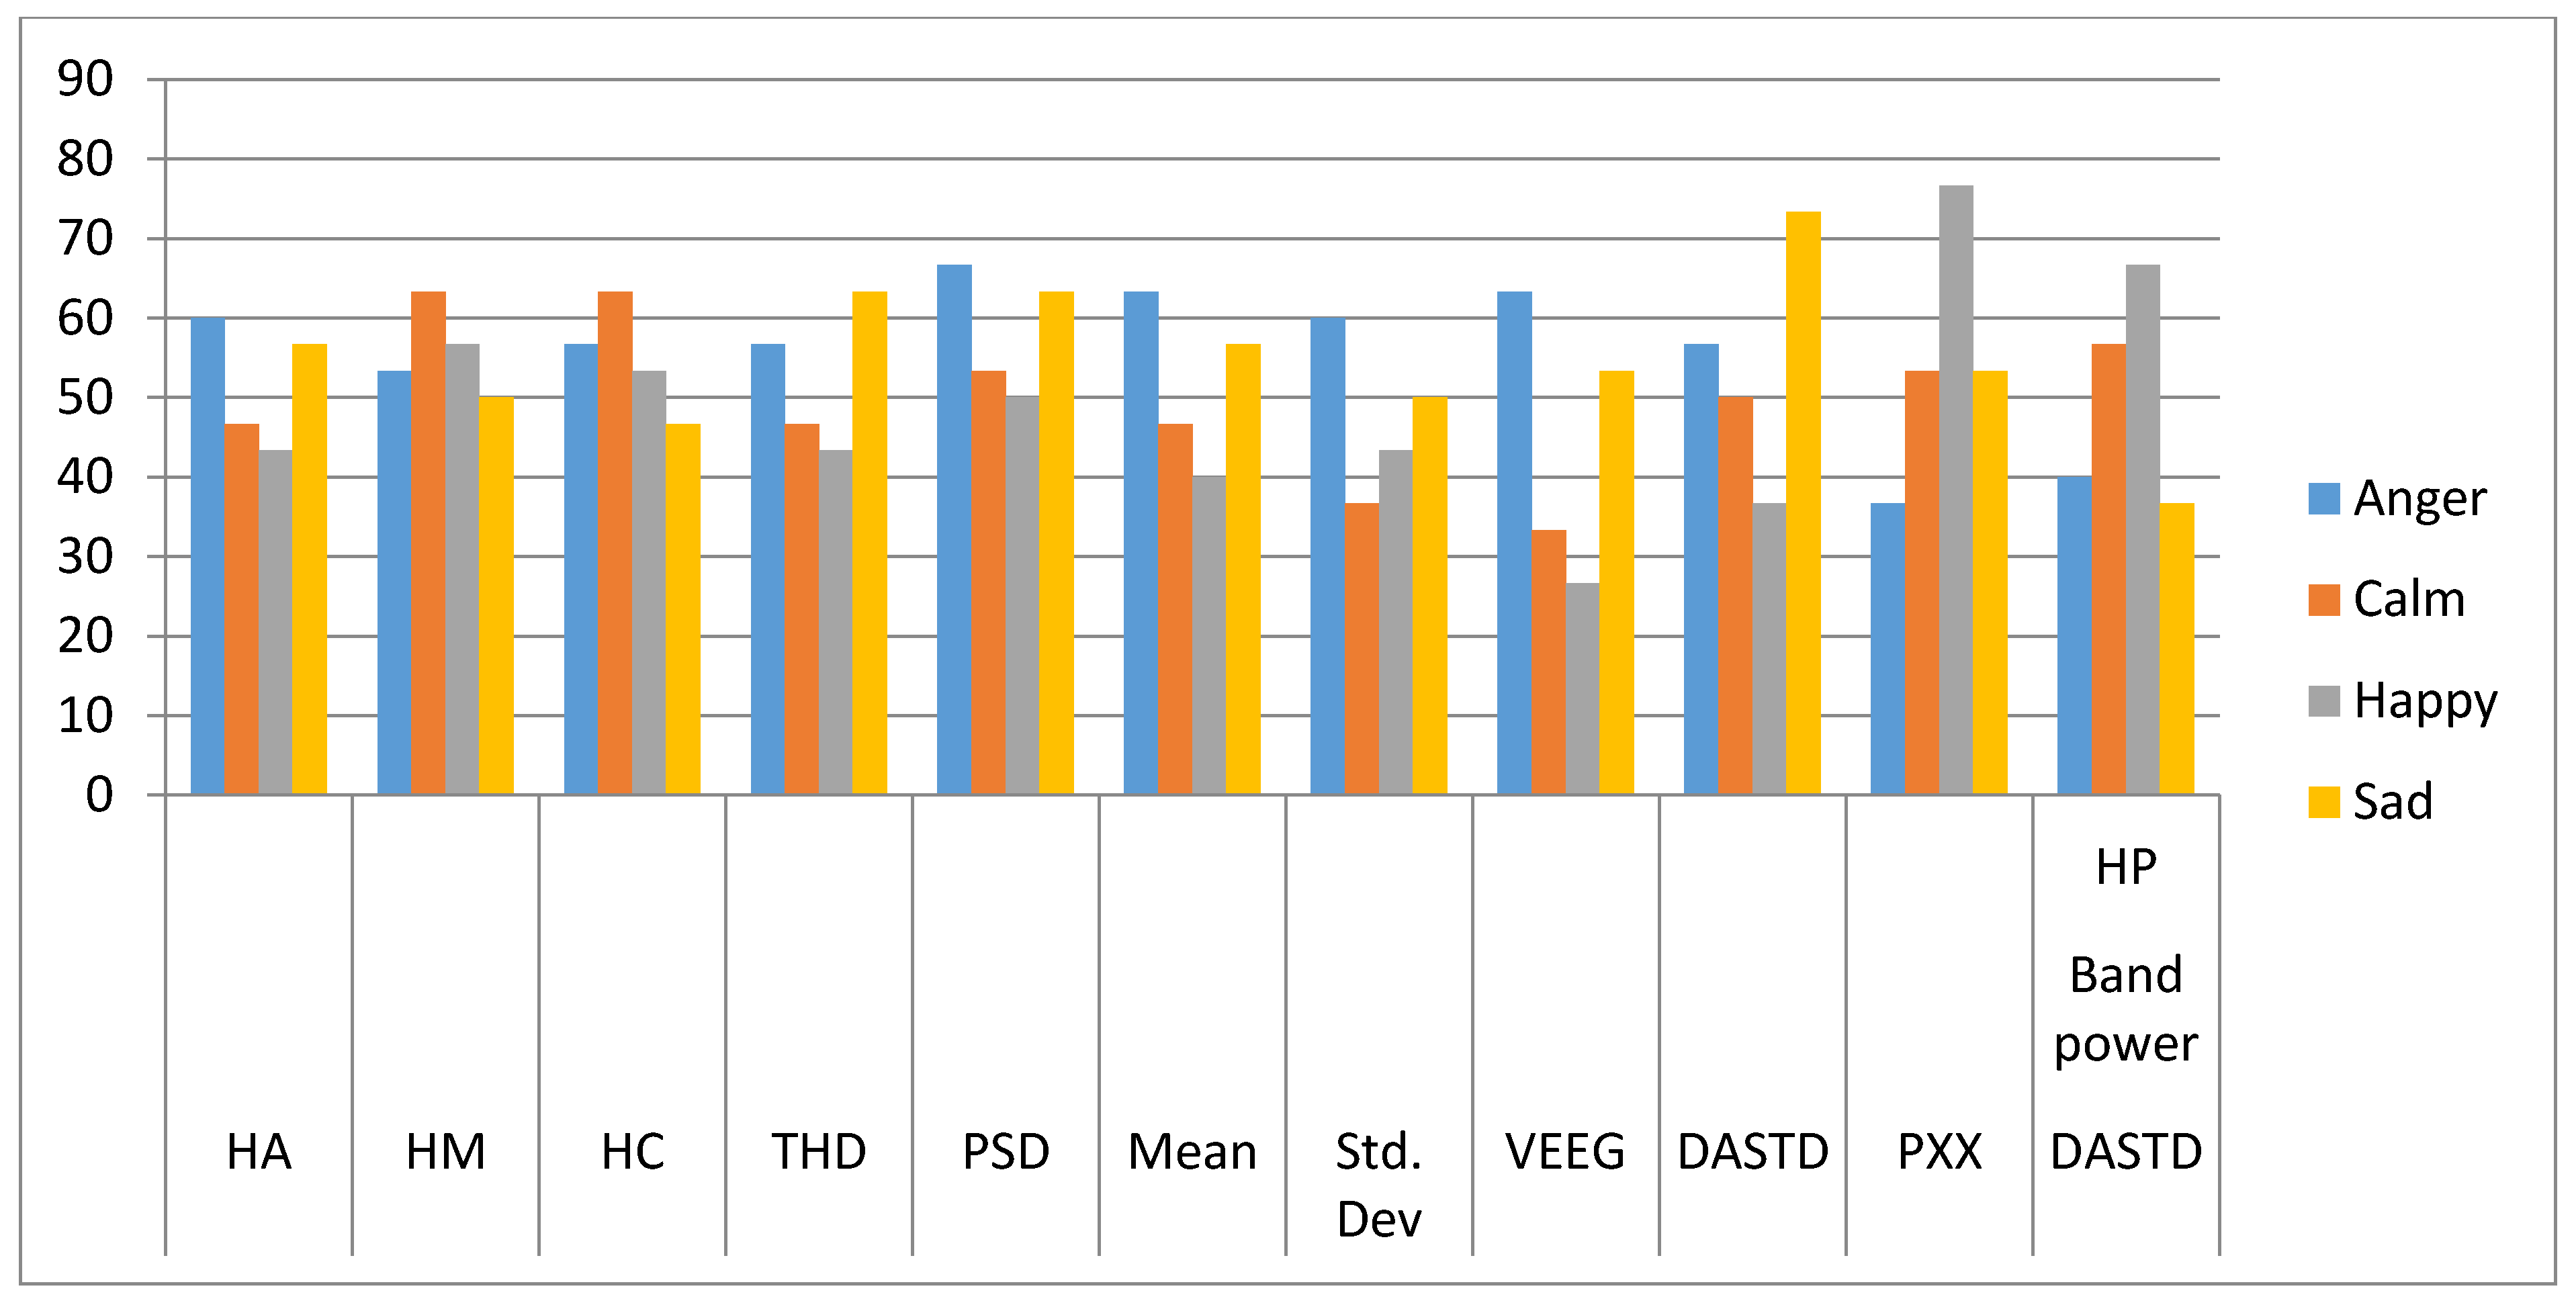
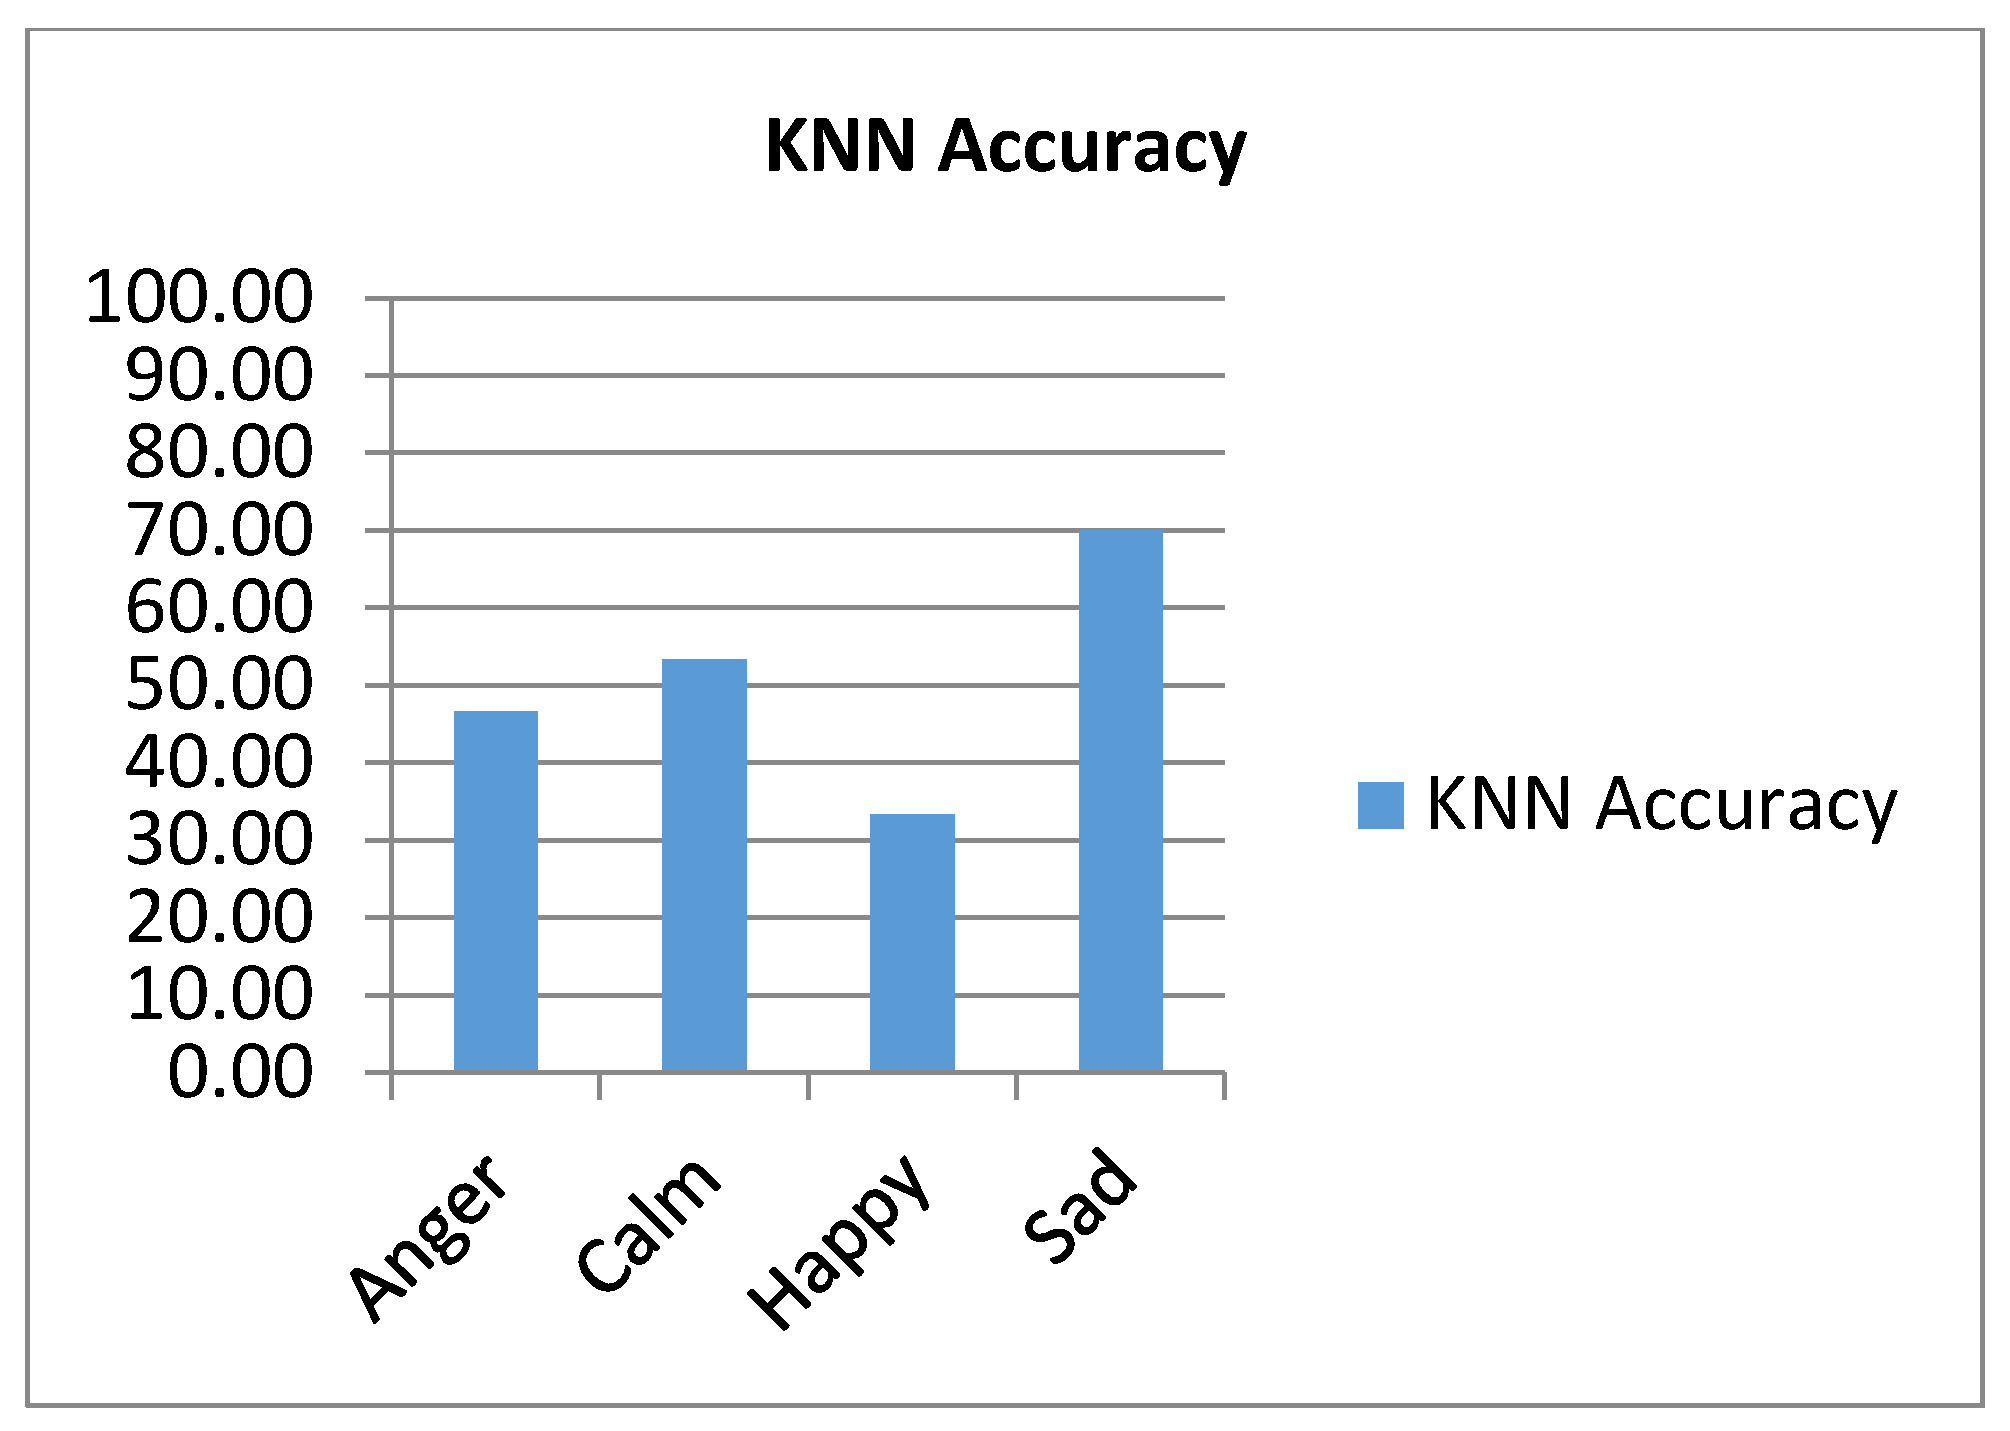
It is observed that accuracy is increased substantially after considering emotion overlapping. In Table 5, the accuracy of KNN is calculated by considering highly ranked features [21] and in Figure 10, it is represented graphically.
In Table 4 and Table 5, accuracy of emotion recognition using KNN Classifier is shown. Considerable accuracy is achieved by using power spectral density feature and DASTD.
It is observed that subjects felt some difficulties in labelling emotions. Hence, accuracy of the classifiers is less. It can be improved if several signal collection trials would be performed on the subject for collecting database for each type of emotion and size of the database should increase for each emotion class. Some challenges are there to collect data because of the unstable mood of human beings.
To detect emotion of intellectually disabled people, brain signals of nine intellectually disable participant were collected. The nine signals were collected at normal environment condition without eliciting emotion. Their emotions were captured in the post noon session, after school timing. The system is trained by 120 signals of 22 normal participants. The ratio of normal participant to intellectually disable participant is 70:30 in percentage. The results are shown in Table 6. This system is developed to detect emotions of intellectually disabled people who cannot express their emotions, and for the people who work under pressure.
4.3.5. Music Therapy as an Intervention Technique
Meditation music is used to stable the mental state. Music therapy is used as an intervention to address a person’s psychological needs and helps them express their inner conflicts and unexpressed emotions. Meditation music stimulates the brain and has a positive effect on the cognitive, emotional and physical functions. The meditation music files which are used as an intervention technique are selected from highly viewed and recommended meditation music on Youtube. To test effect of music on mental state, 20 brain signals of nine normal participants were collected. Signals were collected at normal environment condition without eliciting emotion. These signals used for testing. Brain signals were collected when the participants were listening meditation music.
Out of 20 test signals, the relaxed state is detected for 15 test signal while listening to meditation music. In Table 7, results are shown. A total of 75% of positive transformation is observed in to relaxed mental state after using is music therapy. Music therapy can help to calm our physiology without making a conscious effort, and that can alleviate stress from our mind. Music can also lift our mood and slow down our breathing, and create other stress-inducing changes. If music therapy is used as a part of routine for intellectually disable people, then they can get habitual to this process and it can definitely helpful for them to maintain stable mental state most of the time. It can be very helpful for parents and therapists to introduce new concepts and learning strategies to them which will be helpful for their wellbeing.
5. Discussion
This research study included database of 120 emotion signals. The 30 signals of each emotion: anger, calm, happy and sad, are collected by using Emotive 14 channel EEG headset. Emotions are elicited by audio, video and thought stimuli. Subject choose type of stimuli for eliciticing emotion. Signals are stored in .csv file format. The signals were stored as 128 rows*14 channels cols. Other data is eliminated from the file. Signals are recorded by 128 FS sampling rate. Dataset (SIG) five stage pre-processing is applied on the signal for baseline and noise removal. In the feature extraction, 18 time domain features are extracted by the statistical modelling method. For extraction of frequency domain feature, Chirplet transform is applied on the signal and 6 frequency domain features are extracted. The feature set file, FVSET (24 ∗ 120) is prepared. The linear regression model is used for feature ranking. Band power and power spectral density ranked high. This study includes analysis of feature values by changing window length in the Chirplet transform which was helpful in selecting appropriate feature. It is observed that with the increasing value of window function the correlation between features was decreased but the calculated values of features are very less and some of the values were computed as a Nan values. The multimodal approach of classifier is used to classify emotions. Several challenges were faced at each stage of system. Good accuracy of emotion detection is achieved by way of the KNN classifier [23]. As the study is being conducted in India, schools and education centers of intellectually disabled people were very reluctant to cooperate. It is observed that while collection of brain signals, participants were experiencing sudden change in emotion or they were having confusion to label the emotion. According to them, too much excitement leads them to an annoying stage. When they were experiencing the calm stage, they started feeling sleepy and very relaxed. As the brain emotional system is also related with other function of the body, head movement, eye lid open—close movement, change in facial expression and other parameters of the body can change the readings. Motion should be considered in the future work of the research. The challenges and observation of each stages are mentioned in each section. Observations for most highly ranked feature band power are mentioned below.
- There are variations in the band power of each person.
- The visualization of the band power of each captured signal can be viewed in Emotive Epoc Pro. The band power is graphically represented by showing theta wave (4–8 Hz), alpha (8–12 Hz), low beta (12–16 Hz), beta (16–25 Hz) and gamma (25–45 Hz) variations in the captured signal with respect to time. The significance of each wave is mentioned in the Table 8.
- It is observed that theta wave activity is very high for the intense emotion of any type.
- Mostly gamma wave activity is very low near to negligible for any type of emotion. Gamma wave activity can be observed when the participants were trying to remember or recall bad events.
- It is observed that gamma wave activity got reduced after application of intervention in the form of meditation music.
- While listening meditation music, it is found that all types of brain activity got reduced and participants were feeling calm mental stage.
- Meditation music lowers brain activity.
Signals were captured while participants were listening favourite bollywood and Hollywood songs. Participant’s experienced change in emotion and they experienced excited emotion.
Music has the capacity to relate every individual with it. Sometime they experienced annoying emotion also. It can be concluded from the result of the post experiment that Music therapy is the best therapy to stabilize emotion. Guided meditation music is beneficial for calming down mental state and release stress. This work would be beneficial for those who cannot express their emotions and people who work under stress and pressure. In this research study, emotion detection of normal, as well as intellectually disabled people, and use of music therapy to stabilize their emotional state is addressed. A major challenge is to collect accurate data for emotion labelling. Because of unstable mood of human being, it is a crucial task to label emotions. The number of trials for signal collection can be increased for each class of emotion. To increase accuracy of classifiers, size of the database should be huge. Emotions collection should be done in two environments. First, is in a natural setting, and the other is at the experimental setup. This is so that comparative results can be studied. This research study can be further extended by implementing IOT based technology to create wearable device. This is s the unstable emotional state of the person can be conveyed to caretakers and preventive actions can be taken in a time.
Author Contributions
Data curation, N.V.K.; formal analysis, N.V.K.; investigation, N.V.K.; methodology, N.V.K.; project administration, N.V.K.; resources, N.V.K.; software, N.V.K.; supervision, N.V.K. and B.V.B.; validation, N.V.K.; visualization, N.V.K.; writing—original draft, N.V.K.; writing—review & editing, N.V.K. All authors have read and agreed to the published version of the manuscript.
Funding
This research received no external funding.
Institutional Review Board Statement
This research study was conducted according to the guidelines of the Declaration of Helsinki. This research study is not at all being conducted for diagnosis or treatment of disease on any patients. This research study is purely used for research application and personal use.
Informed Consent Statement
Informed consent was obtained from all subjects involved in the study. Subjects participated in this study on their wish. Informed consent was obtained from the parents of intellectually disable person. 14 channel Emotive Epoc EEG Headset is used for database collection. It is a wireless Bluetooth device designed for research applications. It is completely harmless device. No harmful procedure or device is used in this study. All the steps involved in this research study are purely ethical and not harmful to subject as well as to the environment.
Data Availability Statement
In this research study own database is used which is collected in database collection phase.
Conflicts of Interest
The authors declare no conflict of interest.
References
- Matiko, J.W.; Beeby, S.P.; Tudor, J. Real time emotion detection within a wireless sensor network and its impact on power consumption. IET Wirel. Sens. Syst. 2014, 4, 183–190. [Google Scholar] [CrossRef]
- Kimmatkar, N.V.; Vijaya Babu, B. A Survey and Comparative Analysis of Various Existing Techniques Used to Develop an Intelligent Emotion Recognition System Using EEG Signal Analysis; Serials Publications Pvt. Ltd.: New Delhi, India, 2017; pp. 707–717. [Google Scholar]
- Bhardwaj, A.; Gupta, A.; Jain, P.; Rani, A.; Yadav, J. Classification of human emotions from EEG signals using SVM and LDA Classifiers. In Proceedings of the 2015 2nd International Conference on Signal Processing and Integrated Networks (SPIN), Noida, India, 19–20 February 2015. [Google Scholar]
- Gawali, B.W.; Rao, S.; Abhang, P.; Rokade, P.; Mehrotra, S.C. Classification of EEG signals for different emotional states. In Proceedings of the Fourth International Conference on Advances in Recent Technologies in Communication and Computing (ARTCom2012), Bangalore, India, 19–20 October 2012; pp. 177–181. [Google Scholar]
- Blaiech, H.; Neji, M.; Wali, A.; Alimi, A.M. Emotion recognition by analysis of EEG signals. In Proceedings of the 13th International Conference on Hybrid Intelligent Systems (HIS 2013), Gammarth, Tunisia, 4–6 December 2013. [Google Scholar]
- Kaundanya, V.L.; Patil, A.; Panat, A. Performance of k-NN classifier for emotion detection using EEG signals. In Proceedings of the 2015 International Conference on Communications and Signal Processing (ICCSP), Melmaruvathur, India, 2–4 April 2015. [Google Scholar]
- Murugappan, M. Human emotion classification using wavelet transform and KNN. In Proceedings of the 2011 International Conference on Pattern Analysis and Intelligence Robotics, Kuala Lumpur, Malaysia, 28–29 June 2011. [Google Scholar]
- Mehmood, R.M.; Lee, H.J. Towards emotion recognition of EEG brain signals using Hjorth parameters and SVM. Adv. Sci. Technol. Lett. Biosci. Med. Res. 2015, 91, 24–27. [Google Scholar]
- Mehmood, R.M.; Lee, H.J. Emotion classification of EEG brain signal using SVM and KNN. In Proceedings of the 2015 IEEE International Conference on Multimedia & Expo Workshops (ICMEW), Turin, Italy, 29 June–3 July 2015. [Google Scholar]
- Zheng, W.L.; Lu, B.L. Investigating critical frequency bands and channels for EEG-based emotion recognition with deep neural networks. IEEE Trans. Auton. Ment. Dev. 2015, 7, 162–175. [Google Scholar] [CrossRef]
- Duan, R.N.; Zhu, J.Y.; Lu, B.L. Differential entropy feature for EEG-based emotion classification. In Proceedings of the 2013 6th International IEEE/EMBS Conference on Neural Engineering (NER), San Diego, CA, USA, 6–8 November 2013. [Google Scholar]
- Harischandra, J.; Perera, M.U.S. Intelligent emotion recognition system using brain signals (EEG). In Proceedings of the 2012 IEEE-EMBS Conference on Biomedical Engineering and Sciences, Langkawi, Malaysia, 17–19 December 2012. [Google Scholar]
- Fan, J.; Wade, J.W.; Bian, D.; Key, A.P.; Warren, Z.E.; Mion, L.C.; Sarkar, N. A Step towards EEG-based brain computer interface for autism intervention. In Proceedings of the 2015 37th Annual International Conference of the IEEE Engineering in Medicine and Biology Society (EMBC), Milan, Italy, 25–29 August 2015. [Google Scholar]
- bin Yunus, J. The effect of noise removing on emotional classification. In Proceedings of the 2012 International Conference on Computer & Information Science (ICCIS), Kuala Lumpur, Malaysia, 12–14 June 2012. [Google Scholar]
- Ramaraju, S.; Izzidien, A.; Roula, M.A. The detection and classification of the mental state elicited by humor from EEG patterns. In Proceedings of the 2015 37th Annual International Conference of the IEEE Engineering in Medicine and Biology Society (EMBC), Milan, Italy, 25–29 August 2015. [Google Scholar]
- Koelstra, S.; Muhl, C.; Soleymani, M.; Lee, J.S.; Yazdani, A.; Ebrahimi, T.; Pun, T.; Nijholt, A.; Patras, I. Deap: A database for emotion analysis; using physiological signals. IEEE Trans. Affect. Comput. 2011, 3, 18–31. [Google Scholar] [CrossRef] [Green Version]
- Ekanayake, H. P300 and Emotiv EPOC: DoesEmotiv EPOC Capture Real EEG? 2010. Available online: http://neurofeedback.visaduma.info/emotivresearch.htm (accessed on 28 April 2020).
- EMOTIV. Brain Controlled Technology Using Emotiv’s Algorithms |EMOTIV [Online]. 2020. Available online: https://www.emotiv.com/brain-controlled-technology/ (accessed on 12 June 2020).
- Yu, G.; Zhou, Y. General linear chirplet transform. Mech. Syst. Signal Process. 2016, 70, 958–973. [Google Scholar] [CrossRef]
- Feature Selection for Machine Learning in Python. Available online: https://machinelearningmastery.com/feature-selection-machine-learning-python/ (accessed on 12 May 2020).
- Caesarendra, W.; Tjahjowidodo, T.; Pamungkas, D. EMG based classification of hand gestures using PCA and ANFIS. In Proceedings of the 2017 International Conference on Robotics, Biomimetics, and Intelligent Computational Systems (Robionetics), Bali, Indonesia, 23–25 August 2017. [Google Scholar]
- Kimmatkar, N.V.; Babu, B.V. Initial analysis of brain EEG signal for mental state detection of human being. In Proceedings of the 2017 International Conference on Trends in Electronics and Informatics (ICEI), Tirunelveli, India, 11–12 May 2017; pp. 287–295. [Google Scholar] [CrossRef]
- Kimmatkar, N.V.; Babu, V.B. Human Emotion Classification from Brain EEG Signal Using Multimodal Approach of Classifier. In Proceedings of the 2018 International Conference on Intelligent Information Technology, Chennai, India, 11–14 December 2018. [Google Scholar]
Figure 1.
Proposed System.

Figure 2.
Emotive Epoc+ 14.

Figure 3.
Electrode Placement Channel Electroencephalography (EEG) Headset.

Figure 4.
Four Classes of Emotions.

Figure 5.
Chirplet.

Figure 6.
Correlations of Features.

Figure 7.
Accuracy of classifiers by considering all 24 features.

Figure 8.
Emotions overlapping.

Figure 9.
Graphical representation of emotion detection accuracy using prominent features by KNN Classifier.
Figure 9.
Graphical representation of emotion detection accuracy using prominent features by KNN Classifier.

Figure 10.
Graphical representation of emotion detection accuracy using 24 features by KNN classifier.
Figure 10.
Graphical representation of emotion detection accuracy using 24 features by KNN classifier.


Table 1.
Literature Survey.
| Paper | Signal Acquisition | Pre Processing | Feature Extraction | Features | Classification | Emotional State Detection |
|---|---|---|---|---|---|---|
| [3] | BIOPAC, MP150 4 channel | BPF | ICA | Power Spectral Density | SVM | Happy, Sad, Disgust, Neutral, Fear, Surprised Anger |
| [4] | 64 Channel EEG Cap | BPF | STM | Mean, St. Dev. Variance, Covariance | LDA | Happy, Relaxed, Sad |
| [5] | Emotiv EPOC 14 channel EEG headset | BPF | FFT | Arousal, Valance, Dominance | Fuzzy Rules | Neutrality, Joy, Sadness, Fear, Anger, Disgust, Surprise |
| [6] | An ADlnstruments’ power lab instrument | BPF | WT | Mean, St Dev. Variance, RMS Value, Skewness, Power, Entropy | KNN | Sad, Happy |
| [7] | 64 channel EEG electrodes | BPF | WT, STFT | Standard Deviation, Entropy, Power | KNN | Disgust, Happy, Surprise, Fear, Neutral |
| [8] | Emotiv EPOC 14 channel EEG headset | BPF | STM | Valence Arousal | SVM, KNN | Happy, Calm, Neutral, Sad, Scare |
| [9] | Emotiv EPOC 14 channel EEG headset | ICA | STM | Frequency Band Power | SVM, KNN | Happy, Calm, Sad, Scared |
| [10] | 64 Channel EEG Cap | BPF | PCA | DE, RASM, ASM | DBN, SVM, LR and KNN | Negative, Positive, Neutral |
| [11] | 64 Channel EEG Cap | BPF | PCA | DE, DASM, RASM, ES | SVM, KNN | Negative, Positive, Neutral |
| [12] | 64 Channel EEG Cap | BPF | DWT | Frequency Band Power | Fuzzy Rules | Bands |
| [13] | 14-channel EEG | STM | FFT, STM | Spectral Features, Power Spectral Density | BN, NB, SVM, MMPN, KNN | Engagement, Mental Workload, Enjoyment, Frustration, Boredom |
| [14] | 14-channel EEG | ICA, PCA | CSP | Frequency Band Power | SVM | Bands Separation |
| [15] | 14-channel EEG | PCA | CSP | Frequency Band Power | SVM | Neutral and Humor |
| [16] | 64 Channel EEG Cap | BPF | WT, FT | Frequency Band Power Spectral Density | Single-Trial Classification | Sadness, Amusement, Fear, Anger, Frustration, And Surprise. |
BPF—Band Pass Filtering, ICA—Independent Component Analysis, STM—Statistical Modeling, PCA—Principal Component, CSP—Common Spatial Patterns, DE—Differential Entropy, RASM- Rational Asymmetry, ASM—Asymmetry, ES—Energy Spectrum, SVM—Support Vector machine, LDA—Linear Discriminant Analysis, KNN—K- Nearest Neighbor, BN—Bayesian Network, Naïve Bayes, MMPN- Multilayer Perceptron.
Table 2.
Features Set.
| Mean | ∑fx/∑f |
| Std | √[∑D²/N] |
| Variance | σ×σ |
| IEEG | |
| Mean Absolute Value | |
| Modified mean absolute value type 1 | |
| Modified mean absolute value type II | |
| Simple Square Integral SSI | |
| Variance of EEG VEEG | |
| Root mean square RMS | |
| Difference absolute standard deviation value mean2(DASTD) | |
| Autoregressive PXX | |
| Hjorth activity HA | |
| Hjorth mobility HM | |
| Hjorth complexity HC | |
| Waveform length WL | |
| `Harmonic Distortion |
Table 3.
Feature Ranking.
| Feature Set | h = 2 | h = 64 |
|---|---|---|
| Mean | 19 | 21 |
| STD | 11 | 10 |
| VAR | 7 | 9 |
| SKEW | 18 | 17 |
| Kurtosis | 20 | 18 |
| IEEG | 4 | 7 |
| MAV | 3 | 4 |
| MAV1 | 12 | 19 |
| MAV2 | 22 | 22 |
| SSI | 2 | 16 |
| VEEG | 9 | 11 |
| RMS | 10 | 14 |
| DASTD | 5 | 5 |
| AREG_PXX | 24 | 23 |
| HA | 6 | 12 |
| HM | 16 | 8 |
| HC | 15 | 15 |
| WL | 14 | 13 |
| BANDPOWER | 1 | 2 |
| PERODOGRAM1(Max Pow) | 13 | 6 |
| PERODOGRAM2(max Pow index) | 21 | 20 |
| ENVOLEPE(Harmonic Distance), | 23 | 24 |
| Hilbert | 8 | 3 |
| PSD | 17 | 1 |
Table 4.
Emotion detection accuracy using prominent features by the KNN Classifier.
| Emotion | HA | HM | HC | THD | PSD | Mean | Std. Dev | VEEG | DASTD | PXX | DASTD |
|---|---|---|---|---|---|---|---|---|---|---|---|
| Band Power | |||||||||||
| HP | |||||||||||
| Anger | 60 | 53.33 | 56.67 | 56.67 | 66.67 | 63.33 | 60 | 63.33 | 56.67 | 36.67 | 40 |
| Calm | 46.67 | 63.33 | 63.33 | 46.67 | 53.33 | 46.67 | 36.67 | 33.33 | 50 | 53.33 | 56.67 |
| Happy | 43.33 | 56.67 | 53.33 | 43.33 | 50 | 40 | 43.33 | 26.67 | 36.67 | 76.67 | 66.67 |
| Sad | 56.67 | 50 | 46.67 | 63.33 | 63.33 | 56.67 | 50 | 53.33 | 73.33 | 53.33 | 36.67 |
HA—Hjorth activity, HM—Hjorth mobility, HC—16. Hjorth complexity, THD—harmonic Distortion, PSD—power spectral density, HP—parameter, VEEG—variance of EEG, DASTD—difference absolute standard deviation value mean 2, PXX-autoregressive [22].
Table 5.
Emotion detection accuracy using 24 features by way of the KNN classifier.
| Emotion | KNN Accuracy |
|---|---|
| Anger | 46.67 |
| Calm | 53.33 |
| Happy | 33.33 |
| Sad | 70.00 |
Table 6.
Emotions of intellectually disabled participants.
| Sr. No | Signal | Detected Emotion by KNN Classifier |
|---|---|---|
| 1 | Test1 | Angry |
| 2 | Test2 | Sleepy |
| 3 | Test3 | Calm |
| 4 | Test4 | Sleepy |
| 5 | Test5 | Angry |
| 6 | Test6 | Calm |
| 7 | Test7 | Angry |
| 8 | Test8 | Calm |
| 9 | Test9 | Sleepy |
Table 7.
Effect of music therapy on emotion.
| Signal | Detected Emotion | Signal | Detected Emotion |
|---|---|---|---|
| Test1 | Relaxed | Test11 | Relaxed |
| Test2 | Pleased | Test12 | Relaxed |
| Test3 | Relaxed | Test13 | Nervous |
| Test4 | Relaxed | Test14 | Sleepy |
| Test5 | Nervous | Test15 | Pleased |
| Test6 | Relaxed | Test16 | Relaxed |
| Test7 | Nervous | Test17 | Nervous |
| Test8 | Nervous | Test18 | Relaxed |
| Test9 | Relaxed | Test19 | Relaxed |
| Test10 | Relaxed | Test20 | Pleased |
Table 8.
Different mental states and frequency range.
| Brain Wave Type | Frequency Range (Hz) | Location | Mental States and Conditions |
|---|---|---|---|
| Delta wave | 0–3.5 Hz | Frontal Lobe | Dreamless, deep, sleep, unconscious |
| Theta wave | 4–7.5 Hz | Midline, Temporal | Enthusiastic, fantasy, imaginary |
| Alpha wave | 8–12 Hz | Frontal, Occipital | Relaxed, calm, conscious |
| Low beta wave | 12–15 Hz | Frontal | Relaxed and focused, integrated |
| Mid-range beta wave | 16–20 Hz | Frontal, | Thinking, aware of self and surroundings |
| High beta wave | 21 to 30 Hz | Frontal, Central | Alertness, agitation |
| Gamma wave | 30 to 100 Hz | Frontal, Central | Motor functions, higher mental activity |
Publisher’s Note: MDPI stays neutral with regard to jurisdictional claims in published maps and institutional affiliations. |
© 2021 by the authors. Licensee MDPI, Basel, Switzerland. This article is an open access article distributed under the terms and conditions of the Creative Commons Attribution (CC BY) license (http://creativecommons.org/licenses/by/4.0/).
Share and Cite
MDPI and ACS Style
Kimmatkar, N.V.; Babu, B.V. Novel Approach for Emotion Detection and Stabilizing Mental State by Using Machine Learning Techniques. Computers 2021, 10, 37. https://0-doi-org.brum.beds.ac.uk/10.3390/computers10030037
AMA Style
Kimmatkar NV, Babu BV. Novel Approach for Emotion Detection and Stabilizing Mental State by Using Machine Learning Techniques. Computers. 2021; 10(3):37. https://0-doi-org.brum.beds.ac.uk/10.3390/computers10030037
Chicago/Turabian StyleKimmatkar, Nisha Vishnupant, and B. Vijaya Babu. 2021. "Novel Approach for Emotion Detection and Stabilizing Mental State by Using Machine Learning Techniques" Computers 10, no. 3: 37. https://0-doi-org.brum.beds.ac.uk/10.3390/computers10030037
Note that from the first issue of 2016, this journal uses article numbers instead of page numbers. See further details here.