1. Introduction
Due to the financial pressure caused by the international economic crisis of 2008, in the last decade, several organizations have faced a slow economy that has restrained their growth and revenue possibilities. The constant pressure to reduce the overall operational costs led their Information Technology (IT) divisions to considerably reduce all major investments, especially for new technologies, equipment, and hardware purchasing. Most organizations invested the bare minimum and mainly for the critical maintenance needed to assure business continuity by utilizing their seriously constrained in-house resources [
1].
Organizations that survived the financial meltdown are now facing several problems caused by of the above practices. Some of these problems are: (a) maintenance of obsolete hardware without support contracts, (b) infrastructure complexity with many under-utilized systems, (c) usage of legacy applications and unsupported operating systems (End of Life), and (d) inability to upgrade and expand provided services due to limitation of physical resources [
2].
In addition to the above direct problems, there are several indirect issues that need to be addressed, such as: (a) significant power consumption and rack space waste, (b) increased and continuous maintenance expenditures, (c) increased operational risk from security threats and vulnerabilities, (d) decreased Mean Time Between Failures (MTBF), (e) high recovery time, and (f) low performance that leads to productivity and efficiency reduction. A direct result of the above problems is the need to investigate whether the employment of modern enabling technologies, such as virtualization, may assist in the effective upgrading of legacy infrastructures and, thus, minimize the operational costs.
As it can be inferred from the above, the upgrade of such infrastructures is essential. A growing competitive environment and the explosive technological growth render the adoption of new technologies and methodological approaches imperative for most organizations. Nevertheless, the implementation of an upgrade process should carefully consider parameters such as expandability, sustainability, and flexibility of the resulting infrastructure. Additionally, a Return of Investment (ROI) study needs to be undertaken [
3] to assure the viability of the effort. To achieve long term results and maximum agility, the use of new underlying and supporting technologies is strategically imperative. The demands for adding new services and products in addition to the pressure for a constant reduction of operational costs create the necessity to reform IT procedures and operations. Additionally, most organizations worldwide need to employ new smarter technologies in order to achieve better hardware utilization, higher performance, reduction of total costs [
4] and also to assure high availability and security for their computer systems [
1]. These demands may be fulfilled by employing new techniques for virtualization, centralized management, consolidation, and automated resource allocation at the maximum possible level.
This research was conducted to evaluate the use of virtualization technology based on an actual productive environment and not on theoretical or simulated models. The advantage of this approach is that it reveals weaknesses and problems that are difficult to predict and take under consideration by employing other more theory-oriented models. Additionally, results based on data taken from actual operating environments encourage other researchers to study these real life examples when validating or enriching their own approaches.
Continuing in this direction, this paper analyses the infrastructure of an operating financial institution based in the European Union to propose a viable improvement and upgrade plan on both the service-level and the hardware infrastructures. First, this paper aims to identify possible weaknesses and, then, propose improvements regarding business performance in an efficient and sustainable manner. Specifically, a virtualization adoption study for the entire infrastructure is conducted and the resulting consolidation data are presented and analyzed.
This paper is organized as follows: In
Section 2, related works are presented.
Section 3 presents and describes the research structure and roadmap that was followed during the study.
Section 4 presents an extended analysis of the research process followed and analyses the collected results. Concluding,
Section 5 is concerned with the analysis of these results along with propositions for future work and further research in such business environments.
2. Related Work
Virtualization technologies became increasingly relevant in the wider financial sector during the international economic crisis of 2008. The financial situation forced IT departments to investigate new technologies in order to minimize capital and operational expenditures while adding new value-added services for both internal and external use [
1]. Microsoft Corporation in collaboration with the independent research firm KRC Research conducted the “Virtualization in Banking Survey 2008”. This survey indicates that banking organizations in the United Kingdom and in the United States had started employing a variety of virtualization solutions to achieve cost savings, centralized deployment, application management, simplification of their IT infrastructures, and improvement of their overall business continuity. According to this survey, 58% of tier-one banks were already employing virtualization technology across multiple aspects of their infrastructures, such as applications (61%), networking (54%), operating systems (48%) and presentation (27%) [
5].
In the direction of energy and cost savings, other studies have revealed that most traditional datacenters are under-utilized as much as 30% since each physical server provides very few or even a single service while operating continuously [
6]. Virtualization technologies may bring cost savings of up to 31% by simply consolidating multiple server workloads on fewer hosts [
7].
Virtualization technologies have gained a lot of traction due to the constant evolution of information systems and the growing needs for better security, reliability, flexibility, and overall cost reduction. Additionally, the need for outsourcing information technology systems by many companies has assisted in the increased adoption of Virtualization techniques for the implementation of cloud infrastructures. The main purpose of a virtualized system is utilization improvement regarding integrated operating platforms and the combining of autonomous resources to increase the overall performance [
8].
In the same direction, several corporations see virtualization as the key enabling technology for their IT development strategy, by highlighting the ability to consolidate workloads from many under-utilized systems on a single physical server [
9], while virtual machine migrations between different virtualization hosts appear as a reliable method for further energy and resource savings [
10]. Even though virtual machine migration is an applicable solution for resource and consumption management, it has been proven that virtual machines may not operate in the same way on hosts with different physical attributes. In that case, they may consume resources differently than expected, leading to the opposite results in terms of energy consumption and performance [
11]. Such issues can be resolved by the employment of power-aware software applications that detect underutilization and energy consumption rising among physical hosts [
12].
Leading corporations in the field of virtualization have produced tools for business analysis and resource capacity planning for deploying virtualization technologies in large heterogenous corporate environments. These tools have been created to assist IT professionals to plan virtualization deployment throughout their infrastructures, in order to effectively optimize the usage of their available physical resources such as servers and storages. In this research, the VMware Capacity Planner (VCP) was utilized. VPC provides a variety of features such as the ability to automatically calculate consolidation rates and infrastructure utilization in order to further assist the process of benchmarking and virtualization deployment planning [
13]. Another tool that was considered during this research is the SolarWinds Virtualization Manager suite that also includes a toolset for capacity planning [
14].
Other relevant studies analyzed the adoption of virtualization technology for high-performing computer environments. Specifically, Virtualization is considered the most important underlying technology of cloud computing infrastructures, since most cloud services are currently hosted and provided by high-performing hypervisors of different architectures [
15]. The key characteristics of cloud infrastructures are the utilization of virtual environments and dynamic resource allocation when necessary. In other words, Cloud Computing is the next step of evolution for Virtualization Technology. Due to this, concerns about administration security and other vulnerabilities of virtualized infrastructures are addressed and analyzed, mostly proposing risk prevention techniques in the Virtual Machine Monitor (VMM) Layer [
16]. The Virtual Machine Monitor (VMM) is a software-based mechanism within the host machine that allows it to support multiple runtime environments. Virtual Machine Monitor has the ability to prevent any software running within a guest from over consuming the physical resources of the host system [
17].
The continuous adoption of virtualization technology by large corporations is directly related to the reduction of their physical infrastructure footprint, while addressing the ever-growing need for scalability and availability. This rapid adoption rate brings new security concerns and issues that need to be addressed and studied [
18]. These concerns are mainly focused on the fact that in a virtualized infrastructure, a potentially large number of virtual systems are controlled and distributed by a single hypervisor. These threats include potential methods of attack against hypervisors either externally or internally by a compromised virtual machine. Attacks against virtualization hosts may be categorized according to the location of the attacker, the host’s functionality exploitation and the attack target [
19]. Such issues are commonly addressed by creating clustered infrastructures. The automatic virtual machine failover in the event of a host failure is provided as a standard feature in virtualization technology, however, careful design and implementation is required to avoid prolonged service downtimes in the event of several simultaneous hosts failures [
20].
Even though virtualization technology raises several new security concerns, in the wider financial sector, organizations are implementing virtualization-based solutions due to the ever-growing necessity to provide more services for their customers in a faster and massive way. In this direction, financial organizations worldwide are moving a step further by providing cloud-based financial services. These services are either provided by their own on-premises cloud infrastructures or by leased cloud infrastructures provided through Service Level Agreements (SLAs) by trusted third parties [
21].
Another important factor for integrating a new technology in a business environment is the alignment of the organization’s IT strategy with tangible business results. Since the majority of the global corporations are highly depended on new technologies, the ability to rapidly align and reform their IT strategy according to their business needs is imperative [
22]. The expected outcome from the introduction of new technologies in a corporate environment is to gain a significant business value. Experimenting with new technologies is not always a viable option due to budgetary constraints. Towards this direction, the implementation of simulation-based approaches provides a much more affordable and reliable solution [
23]. As far as financial analysis is concerned, an effective way to assess potential technology investments is the Return of Investment index (ROI). ROI is commonly used for evaluating an investment that involves equipment and software procurement. It is considered as one of the most valuable measurement and evaluation indexes for business analysis and a reliable tool for strategic purchasing decisions [
3].
3. Research Structure and Roadmap
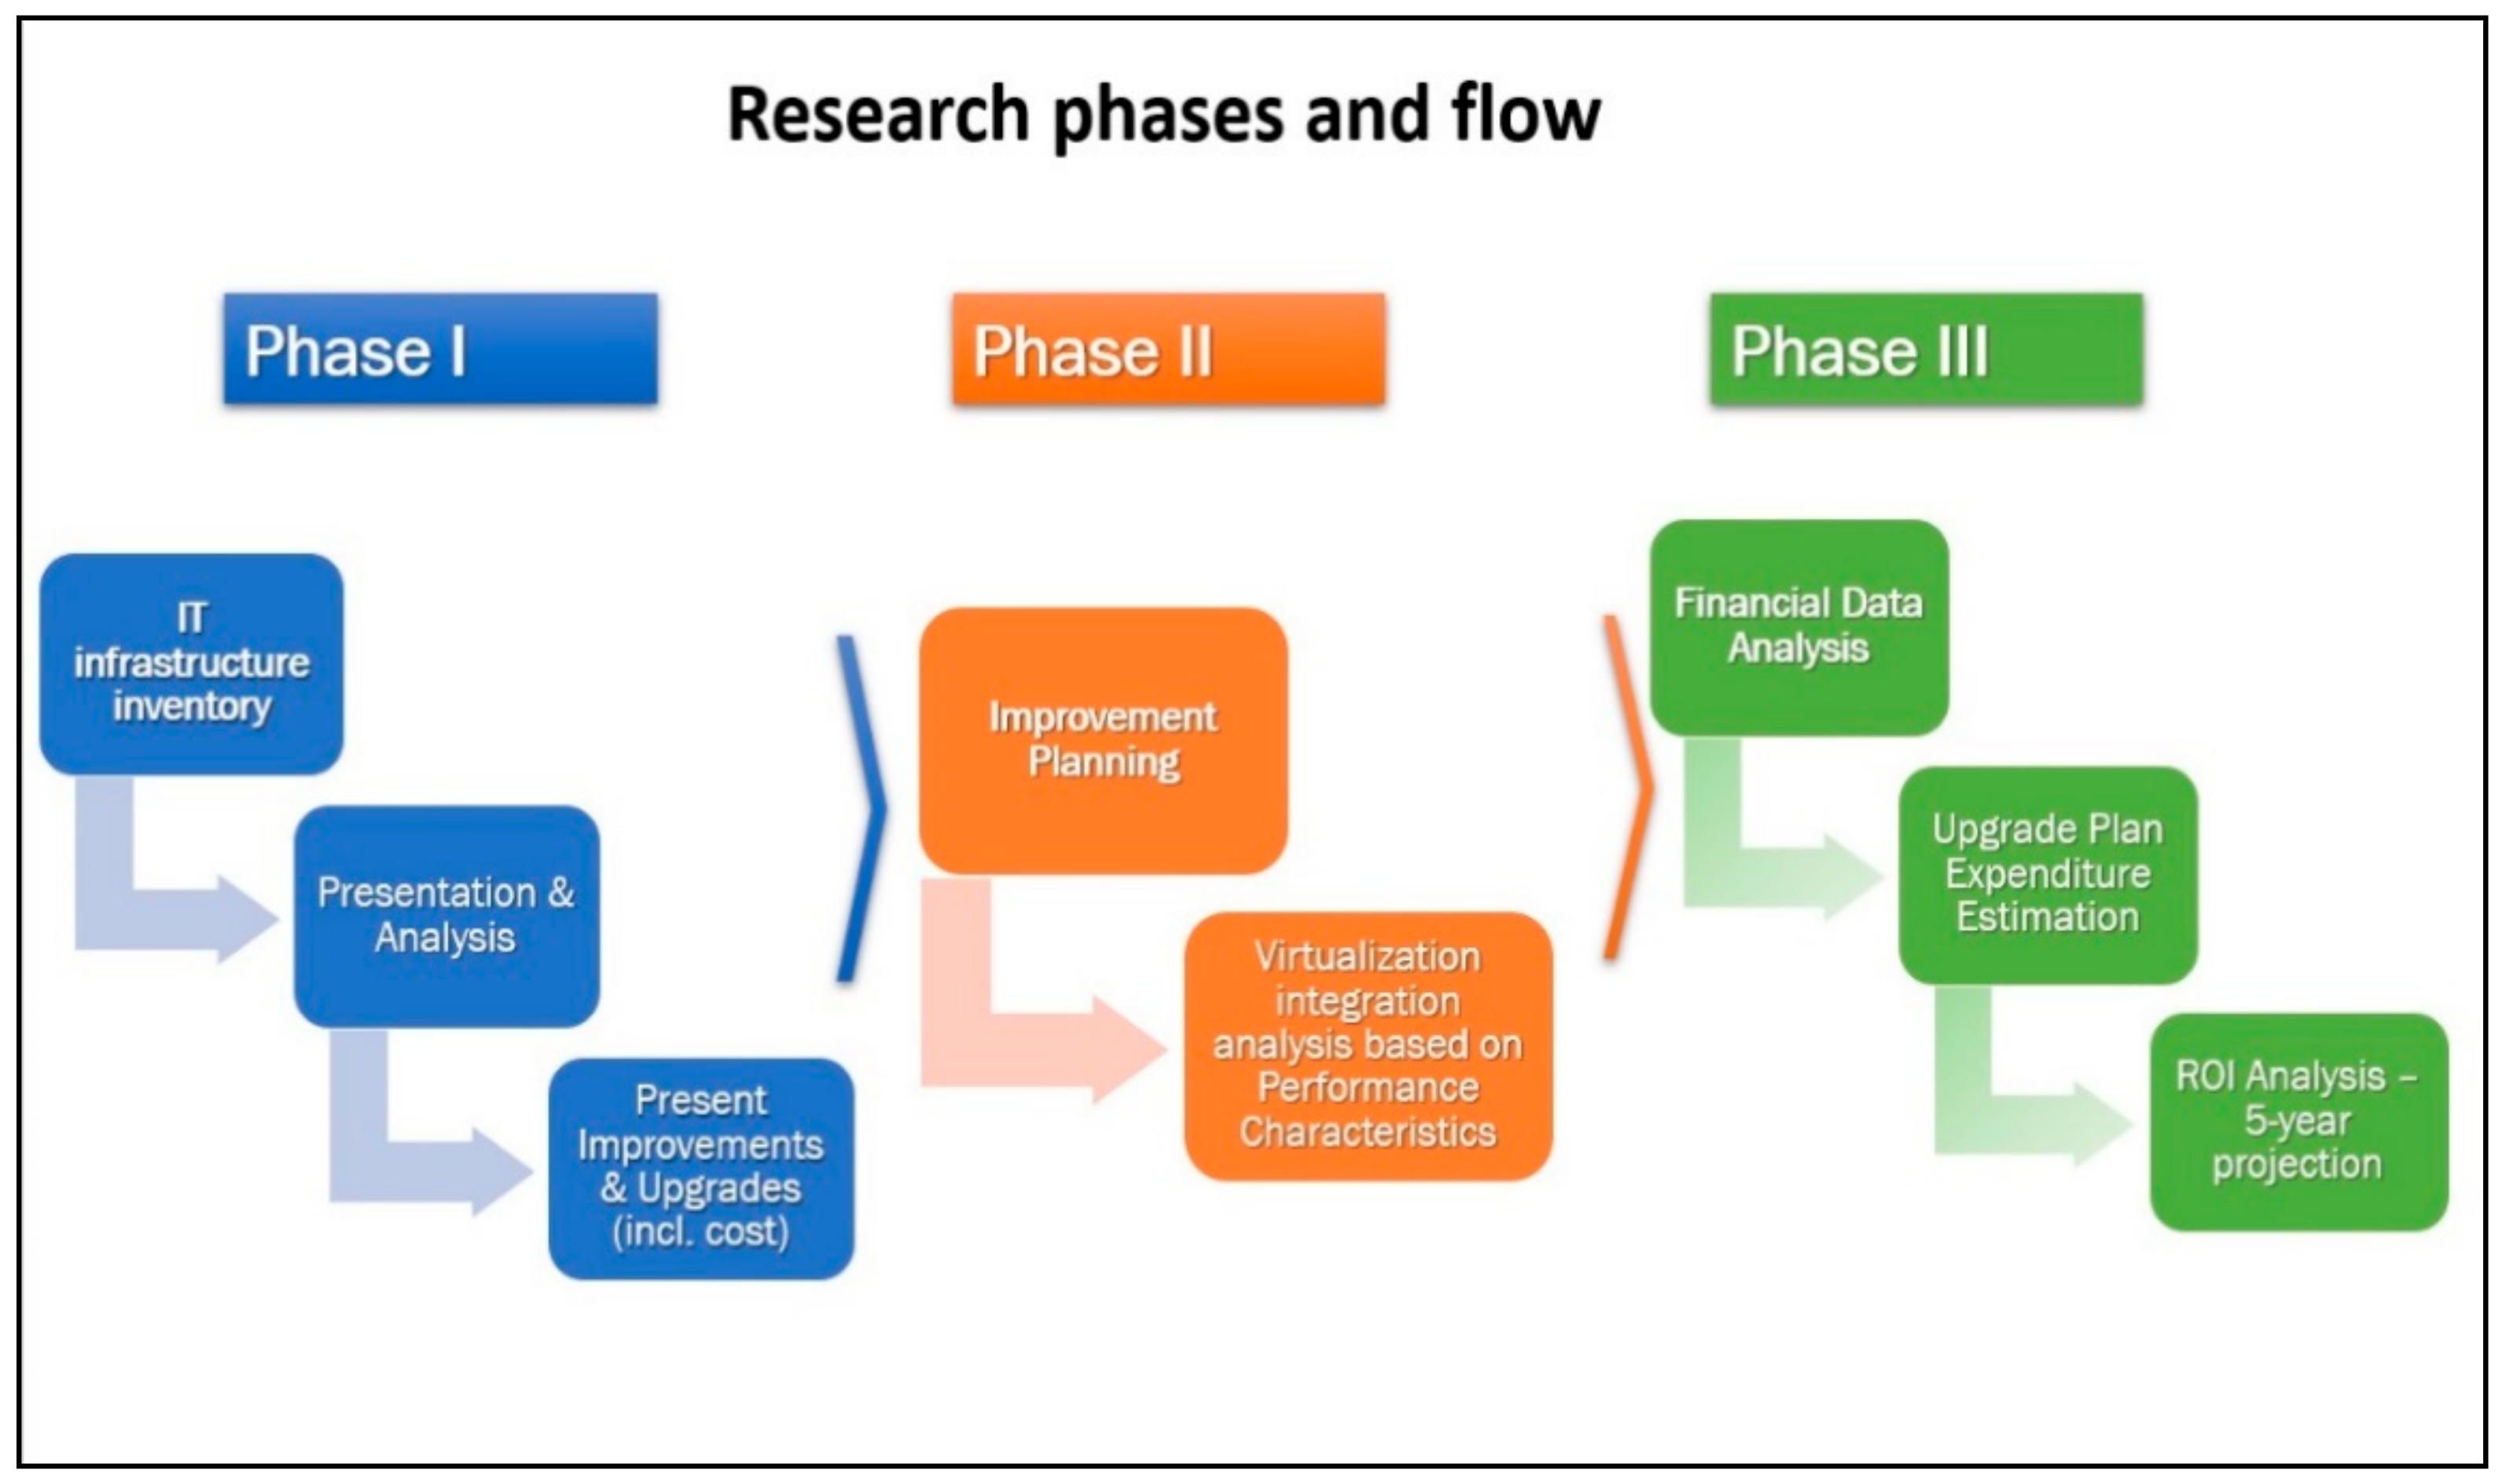
This entire research is based on the study and analysis of data taken from an operating European financial organization. The organization to be researched fulfilled the prerequisites for this study. To extract all the necessary information in order to assess the actual benefit of virtualization technology in this specific business environment, it is necessary to divide the research process in three separate phases. Specifically:
During the first phase, a full IT infrastructure inventory is presented and analyzed. The inventory process includes all provided IT services along with the current supporting mechanisms for each of them. It also includes current server and storage hardware characteristics. After the inventory process is completed, the first phase concludes by presenting necessary improvements and upgrades concerning the currently provided services along with an indicative estimation of service and licensing costs.
In the second phase, the improvement planning by integrating virtualization technology takes place. This phase includes an analysis for integrating virtualization technology based on performance characteristics of each physical system, previously collected during the first phase.
The third phase presents a financial data analysis concerning the IT infrastructure proposed upgrade plan and estimates the overall expenditures of the entire integration process. Additionally, a (ROI analysis is conducted, and a 5-year financial projection is presented and discussed.
The research flow, which is structured in three main phases, is presented in
Figure 1.
Research Considerations and Limitations
This research aims to evaluate the efficiency of virtualization technology in an actual productive environment by considering parameters such as consolidation, system utilization, energy consumption and overall financial impact. For this specific research, a European financial organization was selected after considering the following characteristics:
Absence of a significant virtualization technology implementation
Large physical infrastructure with systems of different age and hardware specifications
Different operating system versions and significant number of legacy applications
Several needs concerning service-level upgrades that require hardware purchasing
High-energy consumption considering overall hardware performance
Increased maintenance costs due to old hardware and administration complexity.
As a security precaution and for privacy reasons, all the information included in this paper is limited only to the essential for conducting and validating this research. Specifically, sensitive information that is not included concerns:
The identity of the financial organization
The location of each physical site (i.e., headquarters, branches, etc.)
The exact networking topology and architecture
The computer names or proprietary services that reveal the organization’s identity.
Sensitive information that was deemed necessary to be included in this paper is masked or anonymized without interfering with the course of the research or altering any results. Specifically, sensitive services or computer names are mentioned with generic names to assure anonymity (i.e., Service XX, Application XX and Server XX).
During the planning of the research, the following information was received by the organization’s IT division:
The large number of legacy operating systems can be explained either by hardware limitations or proprietary applications that cannot operate on newer versions but are essential due to regulatory or other business compliance reasons.
For security reasons, all systems marked as legacy have limited network connectivity and no Internet access.
All system updates are delivered via on-premises update servers after the appropriate administrative approval
Upon the organization’s IT department request, during the improvement and upgrade prerequisites analysis, all the upgrade recommendations are based on the minimum supported version and not on the latest released version. For example, Windows Server 2012 R2 is still supported and maintained until 10 October 2023 [
24] and Microsoft Exchange Server 2016 CU3 until 14 October 2025 [
25].
An additional reason for selecting a financial institution for this research has to do with the strict regulatory framework in which it must comply. Specifically, according to the European Banking Association (EBA), all licensed financial institutions should comply with the following requirements [
26] that are also addressed in the scope of this research:
The overall performance of the ICT operations should be aligned to business requirements
The life cycle of the ICT assets should be monitored to ensure support continuation and updating according to documented specifications. Any risk stemming from outdated or unsupported ICT assets should be assessed and mitigated.
The performance and capacity planning processes should be conducted in order to prevent, detect, and respond to significant performance issues such as capacity shortages in a timely manner [
26].
EBA regulations are applicable to all licensed European financial institutions and, as a result, the objectives of this research are relevant to a large number of similar organizations such as banking institutions, payment organizations, insurance companies and others [
27].
In conclusion, this research is limited to the analysis of the provided IT services and server-level infrastructure of the organization. Other areas such as networking, digital e-services and telecommunications are not currently assessed or covered by it.
4. Case Study: A Financial Organization’s Infrastructure
The main scope of this section is the analysis and the review of the current IT infrastructure implementation and configuration to suggest possible improvements. These improvements are deemed necessary as part of the overall infrastructure and services upgrade process. In the analysis that follows, the two main areas that were investigated are the following:
IT services (Active Directory (AD) structure, security services, Internet services, email services)
Servers and Hardware (Servers, storage devices, backup devices and software licensing).
The proposed integration solutions and improvements are to be organized within an IT services upgrade framework based on a structured evolving process to achieve the optimal result.
4.1. Current Situation of IT Infrastructure and Provided Services
The current IT infrastructure of the organization offers to the corporate users a variety of services. Specifically, the services to be examined are: (a) Active Directory, (b) Email, (c) Database, (d) Backup, (e) Management and Monitoring and (f) Disaster Recovery. The analysis for each of these services is presented below:
4.1.1. Active Directory Services
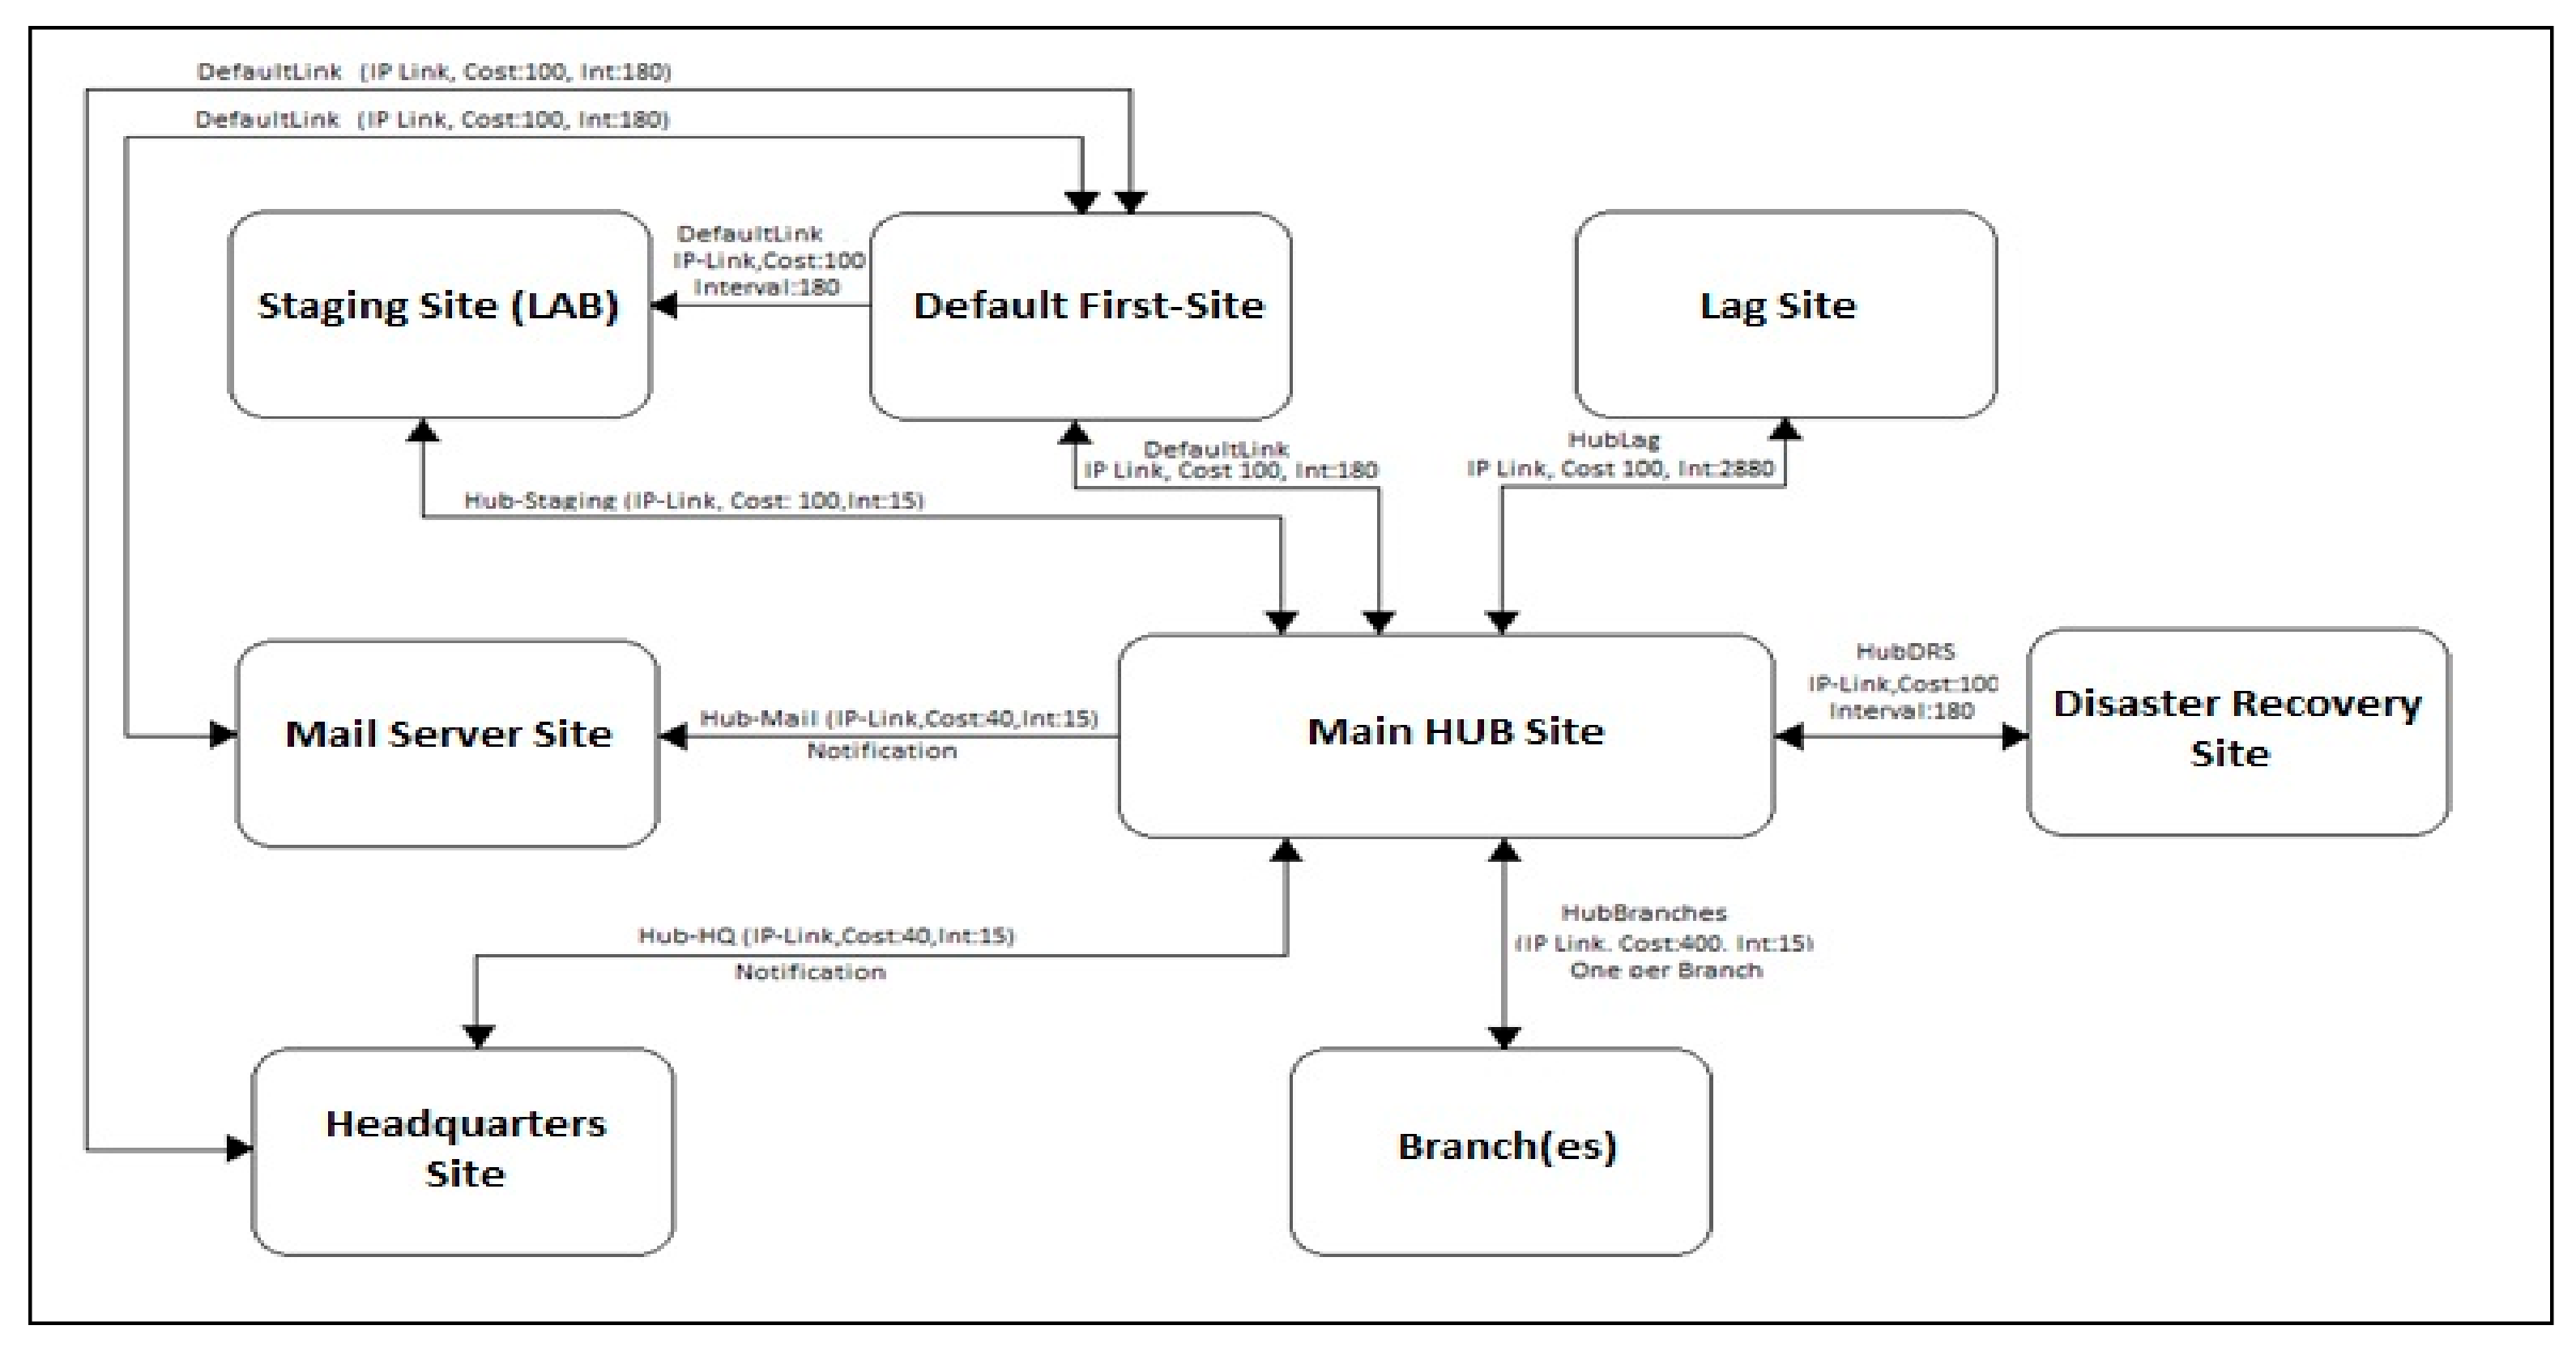
To fulfill the needs of the organization, the main domain serves approximately 30 member servers, 1600 member users and 165 domain controllers. The active directory service is provided by the three main premises of the organization, as well as for each of the remote branches (150 during the inventory process). The exact number and location of each domain controller is illustrated in
Table 1:
Within the Main IT Datacenter site, two (2) domain controllers serve exclusively the needs of the email services (Microsoft Exchange Servers site) and a third one is responsible for automatically synchronizing the information among them with a delay interval of 38 h (Lag-site) in order to avoid synchronizing erroneous changes.
Due to the large number of branches, communication is achieved via a Hub-site to optimize performance. A single domain controller supports the needs of a Staging site within the premises of the main datacenter. This Staging site is currently used for the initial installation of new domain controllers (mostly for the institution’s branches) when necessary.
Several of the existing branches still feature Windows 2003 R2 Domain controllers. Due to this fact, both the Forest and the domain functional levels are still set for Windows 2003. It has been planned to gradually update these domain controllers to at least Windows 2012 R2. This process requires a significant hardware upgrade and because of that it was still in progress at the time of the study.
Figure 2 shows the infrastructure’s topology (AD sites) and relevant interconnections. For simplicity, only one branch is illustrated since all branches are interconnected identically.
To achieve centralized management within the premises of the organization, group policy objects have been created for each organizational unit in order to assure the following:
Application and access restrictions for branch users: Branch users may execute only the necessary applications for everyday operations according to their job description. Networking access is also limited to the minimum necessary services required for their unit operational needs.
Folder redirection: The users’ folders are automatically redirected within the infrastructure to ensure that they may be securely accessed from any terminal within the organizational unit that a user logs in.
Login restrictions: A user may only login to terminals within the organizational unit in which he is currently employed or dispatched.
4.1.2. Email Services
The email services of the organization are provided by a Microsoft Exchange 2010 infrastructure. During the inventory, this infrastructure included approximately 1450 user mailboxes. All incoming and outgoing email traffic is controlled by two (2) Secure Email Gateways, located within the DMZ, which are interconnected with the exchange infrastructure of the organization. These gateways are responsible for performing all the necessary email checking, from and towards the organizations’ mailboxes by integrating antivirus, content filtering and anti-spam mechanisms. User access to email services is achieved either by email client software such as Microsoft Outlook or by accessing the webmail. The size of the unique database is 90 MB because of strict quota limitations for each user’s mailbox.
4.1.3. Database Services
The database services used in the organization are installed in a variety of servers according to the application needs. The total estimated size is approximately 2.4 Terabytes (TB). Specifically, the entire infrastructure features 8 Microsoft SQL servers, 1 IBM DB2 Server and 3 Oracle Servers.
4.1.4. Backup Services
Currently, the infrastructure backup and management policy enforcement are implemented by the IBM Tivoli Storage Manager (TSM) [
28] which operates in all the main locations (Main IT Datacenter, Headquarters Datacenter and Disaster Recovery Site). Backup jobs include file servers, all the domain controllers, and the Microsoft exchange and Database servers. Backup Storage is achieved by an IBM TotalStorage robotic library with optical interconnection (FC). This library uses four IBM Tape drives with maximum tape capacity of 300 GB (900 GB compressed) each. Two of these tape drives are used exclusively for backup needs of the Mainframe.
4.1.5. Management and Monitoring Services
To administer and control the IT systems and the services of the organization, the Microsoft System Center Configuration Manager (SCCM) and Microsoft System Center Operations Manager (SCOM) platforms were implemented. The SCCM platform (also known as the Microsoft Endpoint manager) features centralized inventory and updating and upgrading capabilities for all Microsoft-based operating systems installed in the organization and provides detailed changes reporting and remote software installation for system administrators. The SCOM platform features centralized management for all endpoints, either in predefined groups or individually. By using SCOM, the administrators are notified for system errors and hardware faults as well as for other alerts to prevent system downtimes and service disruption [
29].
Additional to the two platforms, the IBM Systems Director is used to monitor the hardware of all the IBM systems. The IBM System Director provides centralized monitoring only at the hardware level and helps the prevention of hardware-related failures, such as high temperatures, and power supply and non-maskable interrupt (NMI) failures [
30].
4.1.6. Disaster Recovery Services
To assure the uninterruptable operation of the organization, a detailed disaster recovery plan was implemented. This plan includes all necessary operations and processes to transfer all critical IT operations to the Disaster recovery site, in the event of partial or total outage of the main IT datacenter. The restoration plan is maintained by the IT division of the organization, with periodical outage testing and revising in order to be always up-to-date. Data transfer is achieved either via automatically storage replication automation or by manually restoring the latest backup.
4.2. Systems and Hardware Specifications
The current IT infrastructure of the organization includes 85 servers and two storages while virtualization technology has not yet been implemented. Since the infrastructure consists of many similar model types, it is easier to categorize them in groups according to their model, operating system, CPU cores and physical memory (RAM).
As it is shown in
Table 2, most systems are IBM x-Series (51) and IBM BladeCenter (20) family servers. There are also several HP ProLiant and Fujitsu Primergy family servers (5 of each type). In addition, there is a small number of workstation computers that are used as servers (4). As far as the installed operating systems are concerned, most systems use Microsoft Windows 2012 R2, whereas there is a significant number of systems still using Windows 2008 R2 (6) and Windows 2003 R2 (17) family operating systems, mostly due to hardware limitations. It is essential to upgrade these systems as soon as possible since their official support has ended (EOL) since 2020 and 2015 respectively [
31].
Table 3 shows storage systems with their currently hosted applications and capacity.
4.3. Improvement and Upgrade Prerequisites
This section discusses and presents all the necessary improvement and upgrade prerequisites for the existing IT infrastructure of the Banking Organization. Keeping in mind that a virtualized infrastructure may be more vulnerable to common security weaknesses rather than a traditional one and since most of the IT infrastructure is to be virtualized, it is highly recommended that most of the newly virtualized servers run up-to-date operating systems with the latest security updates. Moreover, since the entire infrastructure is to be re-implemented many administrative difficulties mostly concerning system complexity and availability of the provided services, may be remedied. In these two directions, the improvement and upgrade processes focus on two different categories:
Improvement of the existing provided services: In this category, all the discussed improvements focus on the technologies used for the enhancement of service provisioning, so they may cover all the organizational needs and ensure low administrative costs.
Improvement of the IT systems and of the infrastructure: In this category, various scenarios will be presented which focus on the transition of the IT infrastructure to Virtualization technology, as well as the results from the collection of data to increase performance of systems that are currently in place.
The purpose of this section is to produce practical solutions so that the IT Division of the organization may be able to effectively design and sort the evolution of the IT landscape by upgrading the existing infrastructure while at the same time migrating to a new infrastructure featuring Virtualization.
4.4. Improvement of the Existing Provided Services
Currently, the provided services have been designed and implemented in-house from a specialized team of IT professionals with contributions made from large organizations in the field of IT. In the spirit of the continuous development and improvement of the provided services, various areas that need a careful view:
4.4.1. Active Directory
The active directory is currently under development, with the goal to upgrade it to include all the branches of the Organization. In this context, it is suggested that a study takes place for the improvement of the systems currently in place in the main IT Datacenter site which will be responsible for the service provisioning such as upgrading both the forest and the functional level from Windows 2003 to at least Windows server 2012 R2 or later [
32]. Some of the improvements that such an upgrade would bring include:
The development of read only domain controllers whose purpose is for solitary facilities with reduced physical protection, increasing the level of security of the organization data being stored with reduced administrative costs.
The ability to develop multiple password policies and assign them per different user group.
The enhancement in the method of exchanging information/data between the domain controllers of the organization (Sysvol DFS replication) allowing the exchange of information between systems even through low-speed internet lines.
The ability to restore previously deleted data from the active directory (AD recycle bin) which significantly improves the time it takes to restore data in case there has been a human error or malicious intent.
The careful study of all the parameters for the implementation of the above proposed improvements is deemed necessary since many applications that are constantly being used by the active directory for the certification of every user will need to be checked for compatibility issues. The cost of this upgrade can be covered within the framework of the enterprise agreement between the Banking Organization and Microsoft Corporation.
4.4.2. E-mail Services
The current email system covers all the needs of the organization. It is imperative that a study be undertaken to assess the upgrade transition from Microsoft Exchange 2010 to at least Microsoft Exchange 2016 CU3 or later [
33]. Such an upgrade would enhance and enrich the existing infrastructure by providing more options regarding database privacy and protection (Database Availability Groups) while at the same time will improve maintenance costs, administrative costs and, finally, development costs. Higher versions of Microsoft Exchange in conjunction with Microsoft Office will allow users to enjoy improved functionalities regarding the communication and management of the messages as well as enhanced management capabilities of their accounts using mobile devices [
33]. The goal is to build a large base of employees who will use the same platform to create an environment in which users can communicate effectively with each other. The cost of this upgrade can also be covered within the confines of the enterprise agreement between the organization and Microsoft Corporation.
4.4.3. Mail Archiving Services
Within the framework of surveying and assessing the current situation, it was found that there is a significantly heavy burden of email correspondence that is being currently stored on file servers in the form of .pst files. This large volume of files is the result of the organizational policies pertaining to the storage of user mailboxes on Exchange 2010 with the purpose to maintain the capacity of the server to low levels. The management of these files negatively impacts both administrators and users as they are forced to initiate queries across many different locations causing various delays. It is deemed necessary that the implementation and configuration of a new system which will automatically archive a user’s email history, while at the same time it provides the ability to execute efficient search queries from a single location. One application that caters to this specific need is the Symantec Enterprise Vault which among other things also offers the following [
34]:
An automated process for the removal of correspondence to be archived by the Exchange database based on the size of the users’ mailbox or on a time-range without the user’s intervention.
Indexing capabilities and the ability to create shortcuts in users’ mailbox, decreasing the time of search queries.
The ability to access and manage the users archived emails through the internet (Outlook web access).
The ability to transfer and exchange stored .pst files to the database server of the application, maintaining the structure of the archive of each user (i.e., sort by year).
The implementation and roll out of this application can be realized for a small carefully selected number of users or for all the mailboxes in the organization allowing it to observe the growth rate of the archive and to make plans accordingly in order to keep costs as low as possible.
4.4.4. Management and Monitoring Services
For the effective management of the plethora of systems in place, but also for safeguarding against malfunctions in the infrastructure which can result in the interruption of services, it is highly recommended that the completion, integration, and configuration of the SCCM and SCOM platforms takes place as soon as possible. This project is currently under development in collaboration with Microsoft so that upon completion, the IT system administrators will have a clear picture of the infrastructure they are managing and so that they can be informed of any changes that take place.
The collection of results and of data from the existing platforms will significantly improve the response time to address any errors or malfunctions from the administrators, updating them ahead of time on about the root of the problem so that they can take preemptive measures. Through the available management packages for various technologies/applications, we would see an increase in the effectiveness of the collected data that are consolidated by the system administrators resulting in the platforms themselves becoming more flexible.
4.4.5. Disaster Recovery Services
It is deemed necessary to upgrade the disaster recovery protocol so that it may address and include other services and applications such as e-mails but also to incorporate other, newer management and monitoring technologies which are being developed in restoration procedures and decision making during the implementation of the protocols. With this method, the restoration plan in case of emergency (such as a physical destruction) will continue to be an important component of the services being provided which will be developed in parallel to the infrastructure ensuring the effective operation of the central and of the regional branches in the event of a total or a partial disaster. The restoration plan after a likely destruction will need to be tested after it has been updated to work in unison with other services and applications. This will be implemented with the assistance of external partners who have the expertise to judge the integrity of the procedures and, thus, of the system.
4.5. Financial Information for System Optimization
In the following section, the indicative costs associated with the improvement of the system and its services are presented. This financial data includes the estimated cost of services as well as the estimated cost of licensing.
Table 4 shows that the most significant cost for optimizing the systems comes from the services provisioned and not from the acquisition of new equipment.
4.6. Server Infrastructure Assessment
Taking into consideration the proposals presented in the previous section regarding to improvement of the system and its infrastructure, a virtualization adoption study took place in parallel to the evaluation of the system utilizing daily statistical information in conjunction with the VMware’s Capacity Planner [
13].
The purpose of this study was to showcase the benefits and improvements that could be achievedby employing Virtualization Technologies on the specific infrastructure. In more detail the following cost factors need to be considered:
Energy consumption for system operations as well energy usage for air conditioning/climate control.
New floor management for the better utilization of facilities that can be repurposed for organization needs.
The ability to fully utilize all the available system features and all the available resources and to manage them more effectively.
Data Gathering, Analysis and Assumptions
This section analyses the process, duration, and results of the data gathering process which was based on the VMware’s Capacity Planner’s Reports. Each physical system included in this analysis was examined as per capacity (Processors, Memory, Disk, and Network Interfaces) and as per estimated utilization. Specifically, the duration of the above data collection process lasted 4 months and the data that was collected for analysis contained information for the CPU, physical memory, and disk I/0 performance.
Data collection occurred daily, periodically every hour and, for security reasons, the data collection did not acquire sensitive information, such as the server name and its total number of users. Following this (when necessary), this information was masked with a temporary placeholder name to ensure anonymity (i.e., Server XX).
Out of the 85 total servers included in the research, only 77 of them had enough useful information.
For the execution of the virtualization scenario, the already existing storage (IBM DS5100) shall be reused with the specifications shown in
Table 5.
It is assumed that a cluster which will be linked to a common storage that shall be used by the hosts. This assumption is necessary in order to achieve storage consolidation as well as, because of the requirement to reuse the older equipment.
For all systems the limitations (maximum load thresholds) shown in
Table 6 are considered.
Based on the total number of hosts, and the previous assumptions, the utilization figures of
Table 7 can be calculated.
As it appears in
Table 7, during the study, the total CPU capacity of the infrastructure was 685,971 MHz. This CPU capacity was utilized at 5.4% during peak hours and at 2.4% on the average. Moreover, the total power consumption was 9.2 KW and the total cooling needs were 2.869 Tons BTU per Hour.
Considering the above metrics, the infrastructure appears to be under-utilized but power consuming and, as a result, inefficient.
4.7. Virtualization Deployment Scenario
In this section, an optimization scenario will be presented, based on the performance of the systems included in the above study. In this scenario, and following a specific request by the organization, the hardware to be used for hosting the new hypervisors shall have the characteristics described in
Table 8.
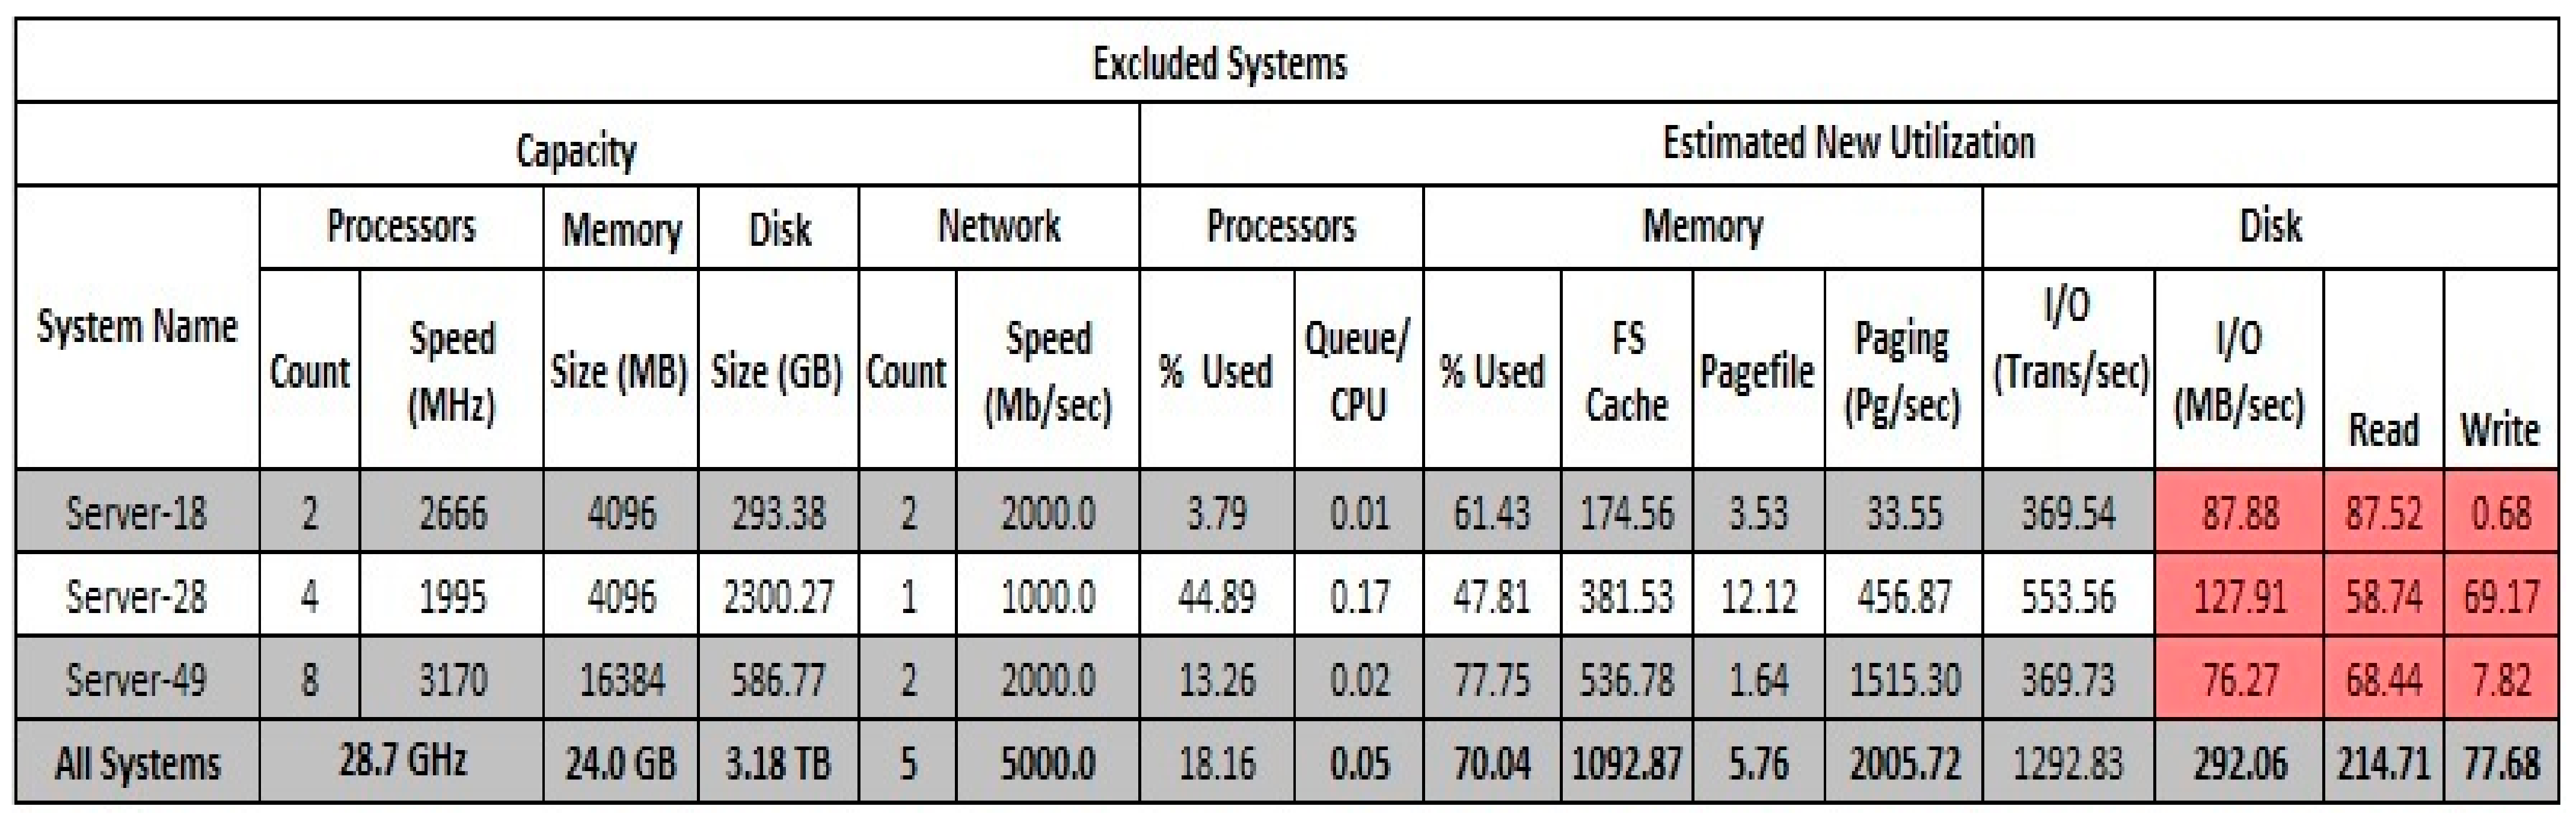
During the data analysis process, three (3) systems were found operating at a constantly high disk I/O workload. As a future step, it is advised that their consolidation will be considered separately and that they shall be hosted in a hypervisor specifically designed for read/write intensive operation (special RAID controller and local hard drives). These hosts and their attributes are presented in
Figure 3. It is recommended that these hosts will not participate in this virtual infrastructure.
The results of the system analysis are summarized in
Table 9.
Total hardware resources before and after the analysis are presented in
Table 10.
The total resources usage before and after the analysis are presented in
Table 11.
The virtualization scenario concludes that nine hosts of the specs specified in
Table 8 are required at a minimum to consolidate and manage the workload of 74 systems of the total 77 included in the study.
As it was mentioned before, three systems were excluded due to high disk I/O that would severely impact the total performance of the infrastructure. After analyzing these results, it is safe to conclude that to cover future workloads the use of 12 hosts is sufficient to implement the above scenario with an estimated consolidation ratio of 84%.
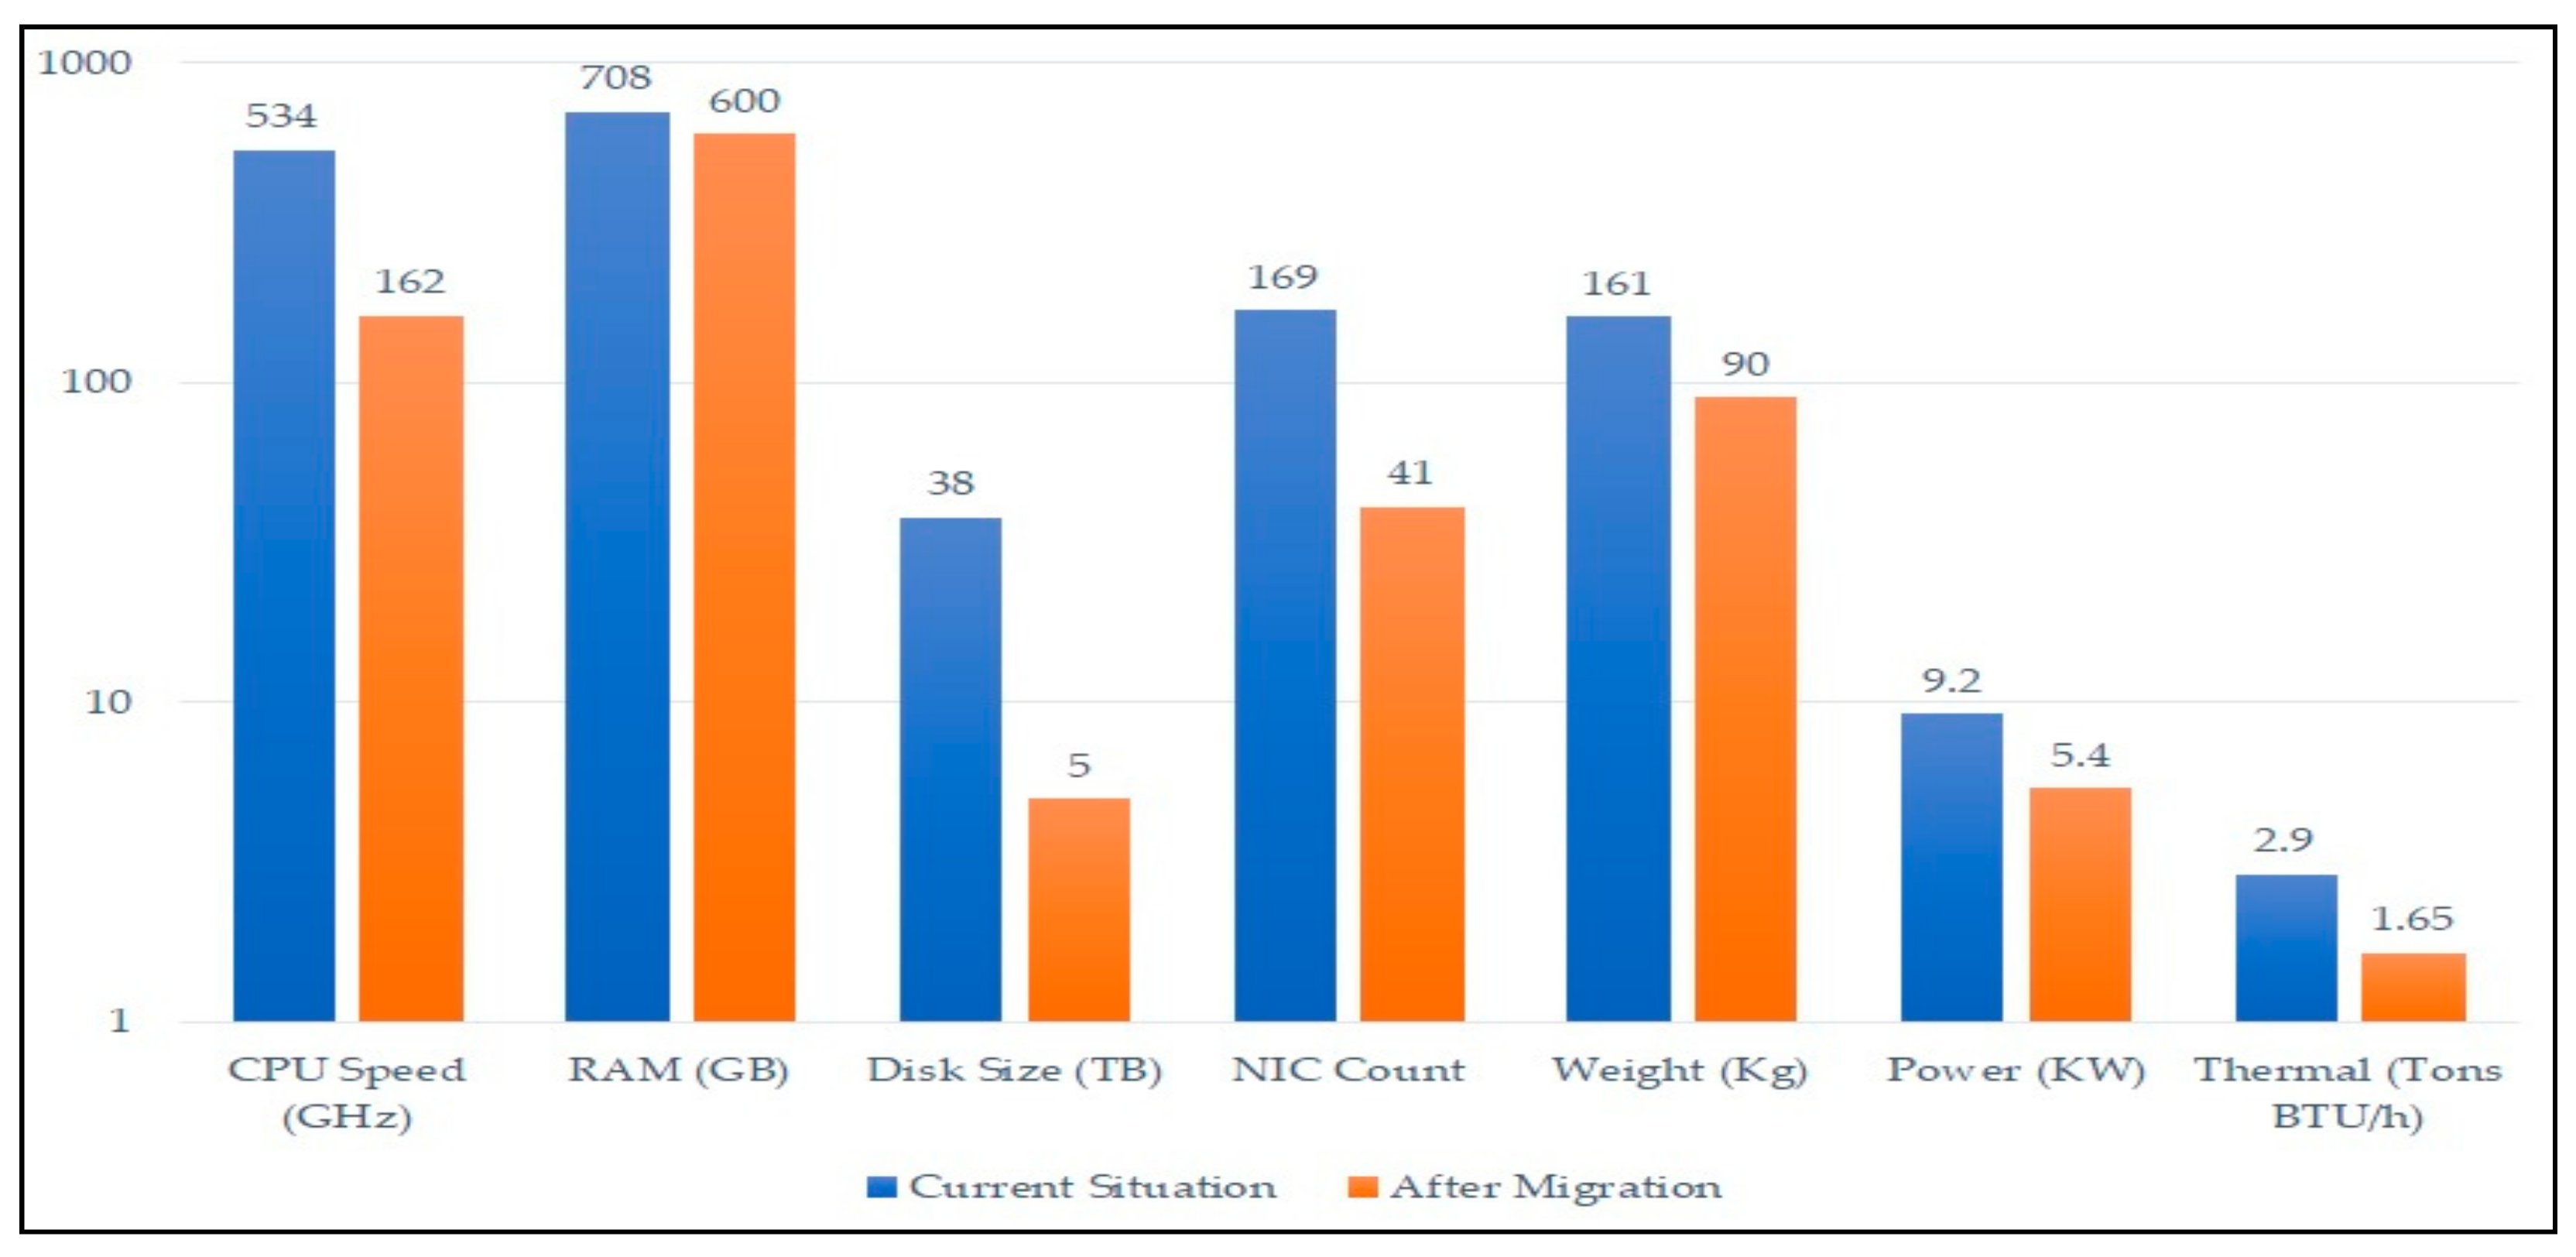
Figure 4 shows a comparison of current hardware attributes (CPU speed, RAM, Disk size, weight, power consumption and Thermal) and after the migration process.
4.8. Financial Data: Analysis and Assumptions
In this subsection, the financial data for the existing IT infrastructure is presented and analyzed, as well as the benefits that can be attained by investing in virtualization technology applications over a period of 5 years.
The results of the investment plan analysis are based on the following assumptions and considerations:
The complete transition of the IT infrastructure to a virtual environment will be achieved in the first year.
Based on the results previously presented, a total of 15 hosts are required to implement this improvement (12 VM hosts + 3 excluded systems).
A 5% increase in workload capacity every year is expected, regardless of whether the organization is to employ a virtual or a traditional infrastructure.
The old hardware equipment shall be reused by the organization for its branches in a period of 3 years.
The estimated lifespan of the newly purchased equipment is estimated at 4 years.
The hourly rate of the human resources required for this project is 18 Euros.
For the management of the systems, it is assumed that 70% of them are employees and 30% are external partners working monthly.
Regarding the consumption of electrical energy, it is assumed that all computer rooms operate 24 h/7 d, with the following constants:
The information was processed by the VMware ROI/TCO calculator [
35], The results of the processed information are presented in the
Table 12 and
Table 13.
Table 12 analyzes the expenditure of the new IT infrastructure on a 5-year time frame.
Table 13 presents analytical information on the different sectors and the profitability of each one, 5 years after the implementation of the proposed changes.
The above results contain both capital expenses (CapEx) and operational expenses (OpEx). Capital expenses commonly refer to the purchase of a new asset, such as business equipment and represent a business investment [
36]. In this case, they include client, server, storage, networking, security hardware and software licensing. Operational expenses (OpEx) commonly refer to expenditures that occur during regular business, such as service leasing, administrative expenses, and training [
36]. In this case, they include infrastructure administration costs, power, and cooling costs as well as rack space and office space costs.
Additionally, there are certain other costs that cannot be categorized either as OpEx or as CapEx. These other expenditures relate to planned, unplanned and business downtime due to upgrades or system failures. The consolidated results from investment over the 5-year period are aggregated in
Table 14.
4.9. Discussion on Financial Results
This section summarizes the financial data presented above in order to present all the findings regarding the present situation of the examined infrastructure, as well as the benefits that the virtualization technology integration shall bring over a 5-year period (
Table 15).
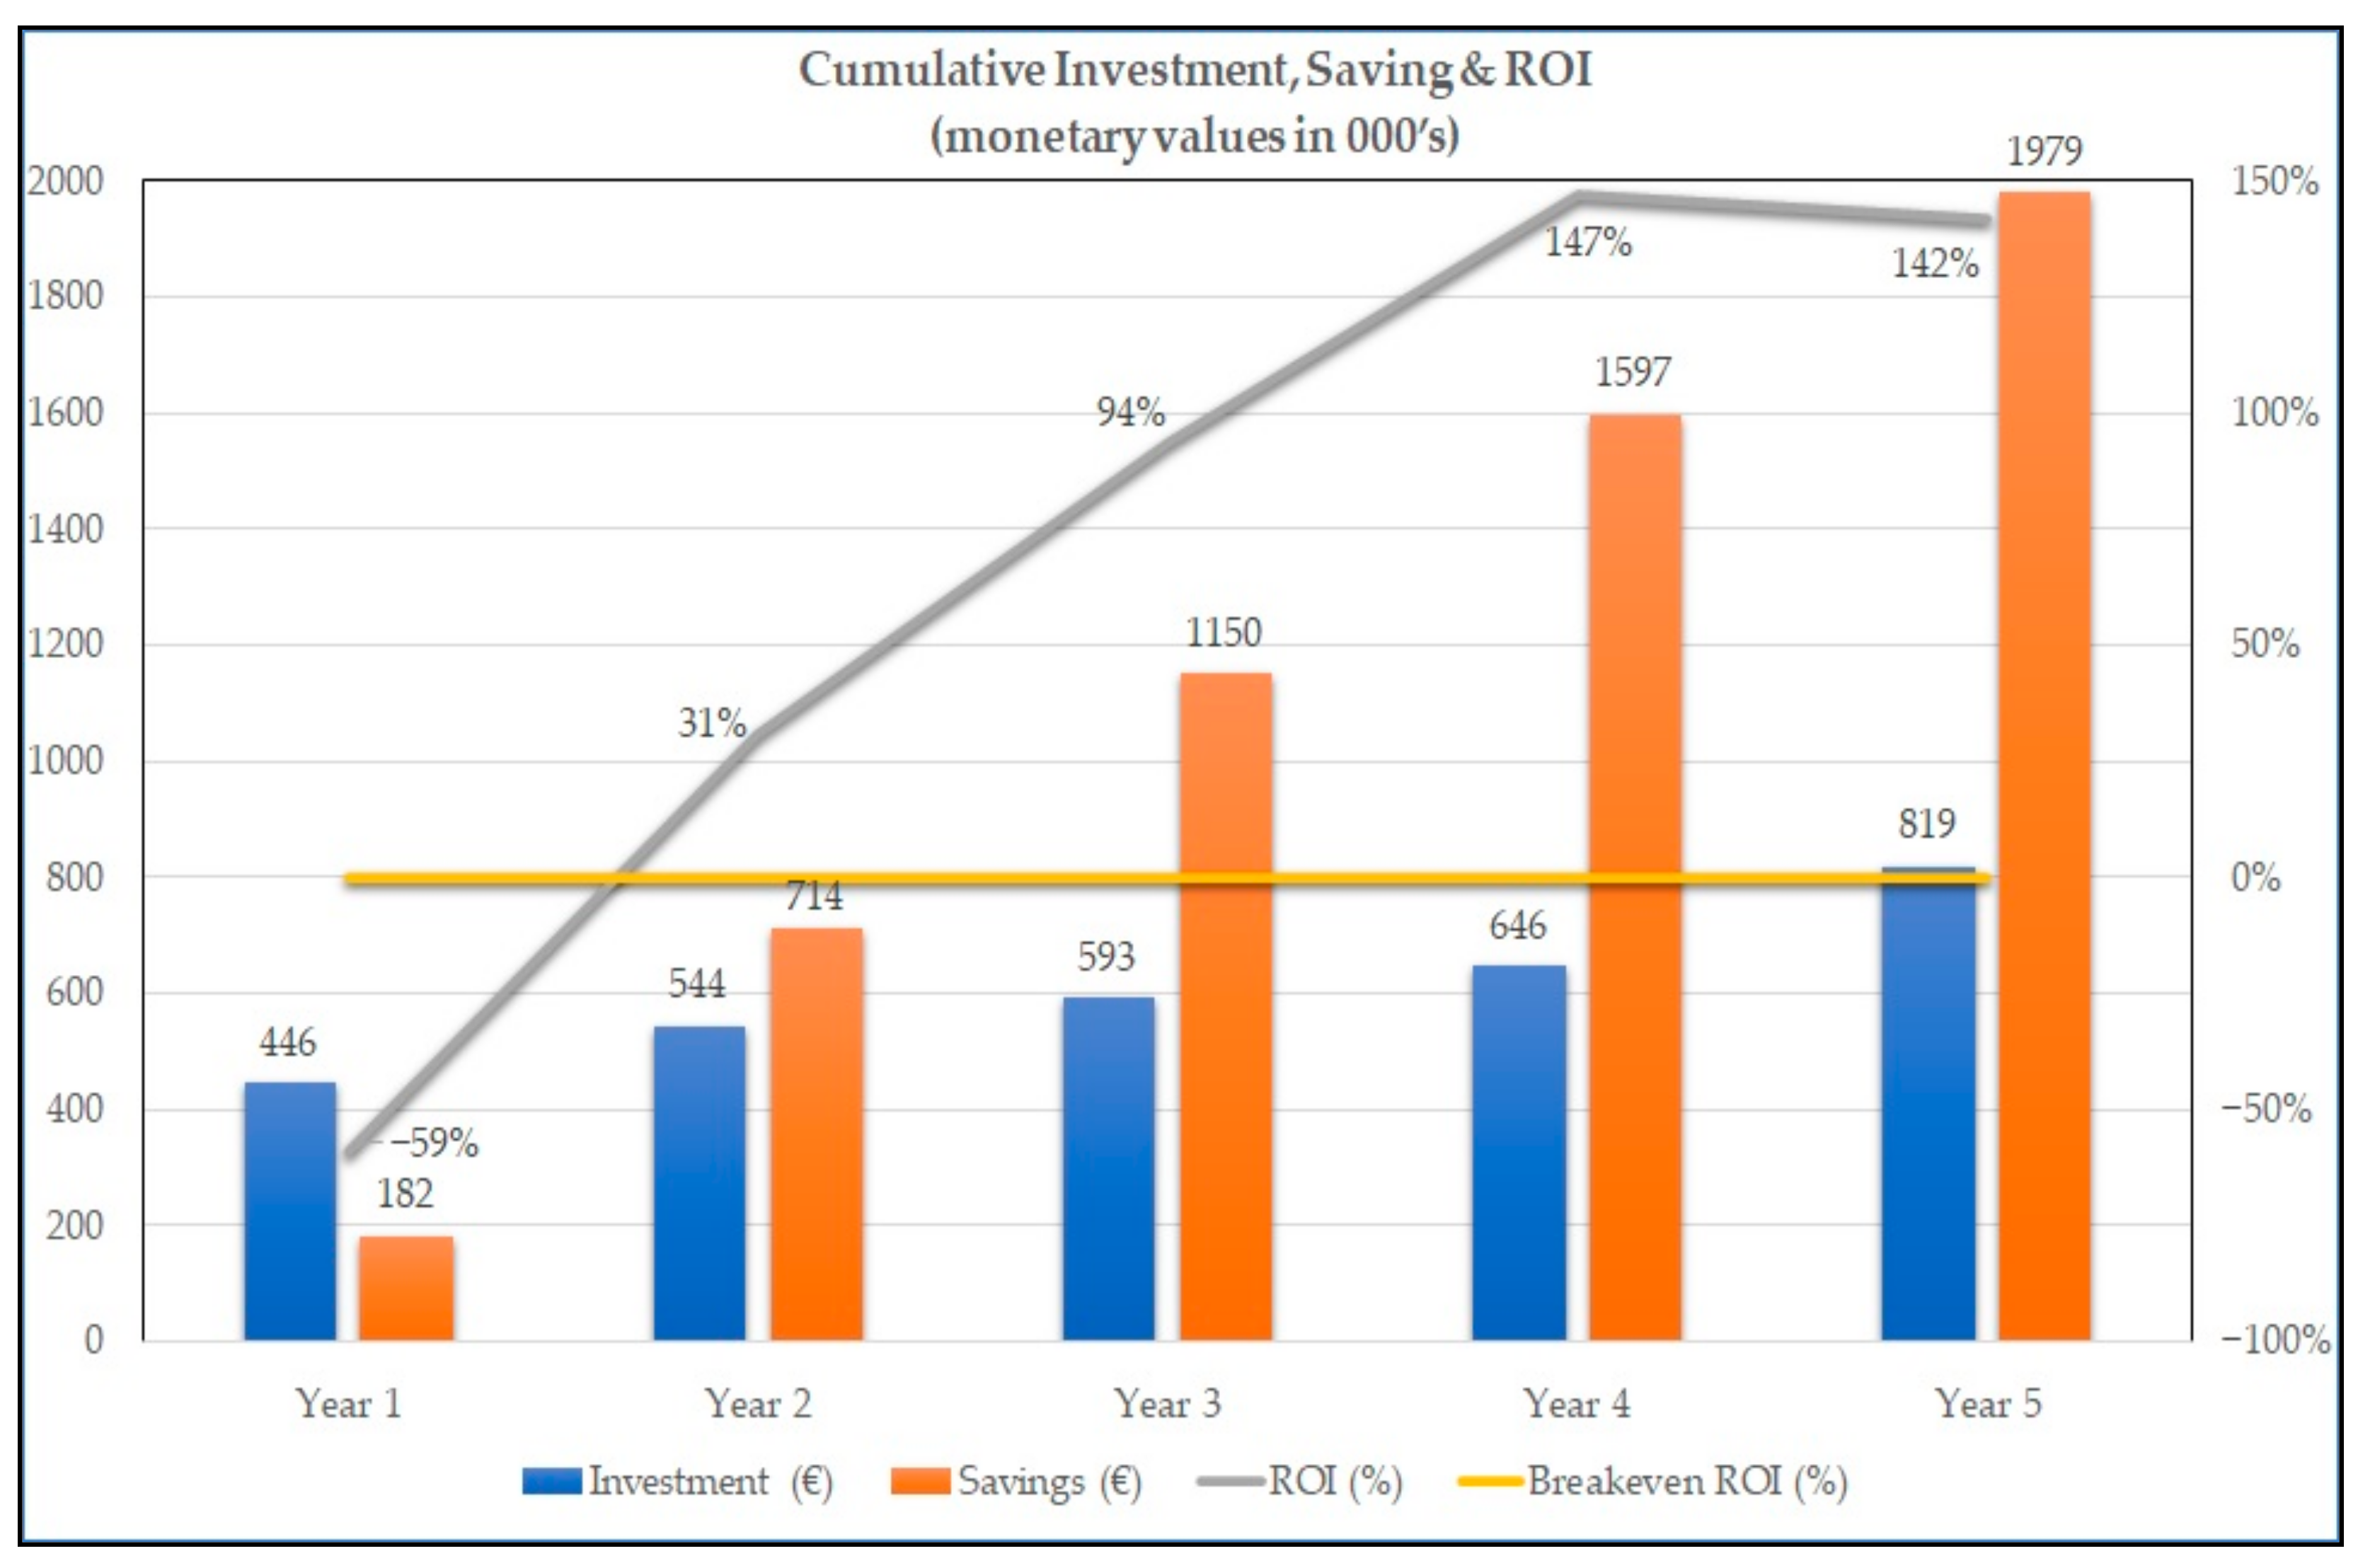
From
Table 15, one can see that during the year of the implementation (year 1), the investment cost (446,223 €) is considerably higher than the total earnings (181,502 €). After the second year, the investment gradually starts to yield increasingly positive earnings against the annual investment costs. Specifically, earnings are estimated at 714,239 € against 544,276 € for the second year, 1,150,283 € against 592,790 € for the third year, 1,597,000 € against 646,470 € for the fourth year and 1,978,993 € against 818,785 € for the fifth year.
The Return of Investment (ROI) index is commonly used for evaluating an investment that involves equipment and software purchasing [
3]. According to
Figure 5, ROI is negative for the first year of the investment and increasingly positive after the second year. During the second year, ROI is expected to be positive with an index of 31%. During the third year, ROI is projected at 94% with expected total earnings of 1,150,283 €. During the fourth year ROI is projected at 147% which is the peak value as well as 47% over the breakeven ROI (100%). In other words, during the fourth year, the total investment cost is expected to be considerably lower than the total projected earnings (1,597,000 €). Finally, during the fifth year, the ROI is expected to reach 142% with total earnings of 1,978,993 €.
5. Conclusions and Future Work
By considering both the technical and the financial analysis findings, it appears that the benefits for the organization by employing virtualization as the core enabling technology for the entire server infrastructure are met in multiple levels. According to the results of the current study, virtualization offers a consolidation rate of 84%. In other words, 77 physical servers are consolidated to 12 newly installed hosts with higher availability, performance, and expandability. This fact not only considerably reduces costs such as administration, maintenance, power consumption, cooling, and space needs but also increases the administrative flexibility and overall infrastructural agility.
In addition, as far as the financial analysis is concerned, the total investment earnings are considerably higher than the total expenditures and visible in the short term after the upgrade process. This fact further strengthens the assumption that virtualization technology integration shall bring significant benefits for the entire investment. Specifically, the index of break-even ROI (the return of the entire investment) occurs in a very short period (less than three years), which is a very important factor that assures the financial viability of the entire upgrade project.
Regarding the upgrade expenses, they should be considered after the fourth year when the organization should re-invest to a certain degree, which is still considerably lower than the projected total earnings.
Additionally, our methodology can be also applied in other organizations, featuring similar issues and limitations, especially, in the European financial domain, but also in other business domains with similar operating characteristics.
The difficulty of obtaining relevant data from financial institutions due to confidentiality reasons, as well as the time-consuming process concerning both the collection and the anonymization, create a lack of similar case studies. Thus, it is of a high importance that this work provides the research community with an initial case study with actual data which could be the base for future research, further analysis, and comparison.
As far as future work is concerned, we will analyze the available commercial virtualization technology solution products to determine the most appropriate for the current business environment. The process of this analysis should include installations in a testing environment to practically determine the efficiency of each solution. The next step will be to define new management and operating procedures that is aligned with the security policy of the organization, to realize the installation, support, and administration processes to be followed. This step is essential to provide in the roadmap form of a guide with all the necessary technical details to securely integrate these new technologies to the actual production environment. This future work will be evaluated using the balanced scorecard methodology and towards the direction of leveraging improved internal processes effectiveness, high quality user and customer experience and finally better financial results for the examined financial organization [
22].


