
On the Effect of Standing and Seated Viewing of 360° Videos on Subjective Quality Assessment: A Pilot Study †


Blekinge Institute of Technology, Valhallavägen 1, SE-37179 Karlskrona, Sweden
*
Author to whom correspondence should be addressed.
†
This paper is an extended version of our paper published in IEEE Virtual Reality and 3D User Interfaces Abstracts and Workshops, Atlanta, GA, USA, 22–26 March 2020
Computers 2021, 10(6), 80; https://0-doi-org.brum.beds.ac.uk/10.3390/computers10060080
Submission received: 31 March 2021
/
Revised: 4 June 2021
/
Accepted: 7 June 2021
/
Published: 12 June 2021
(This article belongs to the Special Issue Advances in Seated Virtual Reality)
Abstract
:Due to the advances in head-mounted displays (HMDs), hardware and software technologies, and mobile connectivity, virtual reality (VR) applications such as viewing 360° videos on HMDs have seen an increased interest in a wide range of consumer and vertical markets. Quality assessment of digital media systems and services related to immersive visual stimuli has been one of the challenging problems of multimedia signal processing. Specifically, subjective quality assessment of 360° videos presented on HMDs is needed to obtain a ground truth on the visual quality as perceived by humans. Standardized test methodologies to assess the subjective quality of 360° videos on HMDs are currently not as developed as for conventional videos and are subject to further study. In addition, subjective tests related to quality assessment of 360° videos are commonly conducted with participants seated on a chair but neglect other options of consumption such as standing viewing. In this paper, we compare the effect that standing and seated viewing of 360° videos on an HMD has on subjective quality assessment. A pilot study was conducted to obtain psychophysical and psychophysiological data that covers explicit and implicit responses of the participants to the shown 360° video stimuli with different quality levels. The statistical analysis of the data gathered in the pilot study is reported in terms of average rating times, mean opinion scores, standard deviation of opinion scores, head movements, pupil diameter, galvanic skin response (GSR), and simulator sickness scores. The results indicate that the average rating times consumed for 360° video quality assessment are similar for standing and seated viewing. Further, the participants showed higher resolving power among different 360° video quality levels and were more confident about the given opinion scores for seated viewing. On the other hand, a larger scene exploration of 360° videos was observed for standing viewing which appears to distract from the quality assessment task. A slightly higher pupil dilation was recorded for standing viewing which suggests a slightly more immersed experience compared to seated viewing. GSR data indicate a lower degree of emotional arousal in seated viewing which seems to allow the participants to better conduct the quality assessment task. Similarly, simulator sickness symptoms are kept significantly lower when seated. The pilot study also contributes to a holistic view of subjective quality assessment and provides indicative ground truth that can guide the design of large-scale subjective tests.
1. Introduction
Virtual reality (VR) applications such as viewing 360° videos on head-mounted displays (HMDs) have become increasingly popular in recent years. In particular, 360° videos are expected to account for a majority of VR content [1] and to support VR services such as IMAX theater, 360° video streaming, and VR live broadcasting [2]. Further, fifth-generation (5G) mobile networks have been developed to accommodate VR services. An even increased portfolio of immersive media including digital twins and holopresence are foreseen to shape the development of future 6G mobile networks [3].
To quantify the quality of experience (QoE) of VR environments in the context of a variety of vertical industries, human ratings on the quality of related applications are needed to provide a ground truth for system design. Applications of such ground truth in the design of digital media systems include benchmarking of digital media processing algorithms, assessing and modeling of the quality of related services as perceived by humans, and deriving guidelines for service integrity parameter settings for networked immersive media applications.
However, standardized test methodologies to assess the subjective quality of VR applications such as 360° videos on HMDs are subject to further study. While participants in subjective tests for conventional videos are typically seated on a fixed chair when viewing and assessing the test stimuli, subjective test methodologies for VR stimuli should also include viewing conditions that account for the additional degrees of freedom in exploring virtual environments presented on HMDs. Specifically, 360° videos allow 3+ degrees of freedom (3DoF+) [4], i.e., three unlimited rotational movements (pitch, yaw, and roll) around the x, y, and z axes, and limited translational head movements along these axes. As such, not only different types of chairs but also the option of standing while viewing 360° video stimuli on HMDs may be considered in subjective tests.
Inspired by all of the above, we have conducted a pilot study on the effect that standing and seated viewing has on the subjective quality assessment of 360° videos presented on an HMD. A panel of experts covering expertise in VR and multimedia signal processing participated in this pilot study to obtain indicative results. The following research questions are perused in this paper based by way of a comprehensive statistical analysis of the data recorded in this pilot study: (1) What are the effects of standing and seated viewing on psychophysical measures that reveal participants’ 360° video quality perception? (2) What are the effects of standing and seated viewing on psychophysiological measures that relate to covert processes inducing emotional arousal? (3) Which of the two viewing conditions would be more suitable to produce a benchmark ground truth of subjective 360° video quality for digital media system design?
1.1. Related Work
The research reported in this paper draws on two subject areas: (1) subjective test methodologies for quality assessment of digital media, and (2) research on viewing conditions in terms of seating arrangements and locomotion interfaces in relation to users’ experience in VR. The former area typically uses fixed or swivel chairs in the experimental setup for participants to execute a quality assessment task while the latter area commonly focuses on questions related to immersion, presence, and efficient locomotion in VR.
1.1.1. Subjective Quality Assessment for 360° Videos
Subjective video quality assessment methods for conventional videos have been standardized by the International Telecommunication Union (ITU) such as the absolute category rating (ACR), ACR with hidden reference (ACR-HR), and double stimulus impairment scale (DSIS) method as described in [5,6,7]. The ACR method shows each test video once in a randomly ordered sequence of test stimuli. The ACR-HR method implicitly shows also the reference videos in the sequence of test stimuli to remove bias due to participants’ likes or dislikes of scene contents. While the ACR methods use a five-level quality scale, the DSIS method uses a five-level impairment scale.
Several other methods have been proposed in recent years including the subjective assessment of multimedia video quality (SAMVIQ) method [8], subjective assessment of multimedia panoramic video quality (SAMPVIQ) method [9], and the pair comparison (PC) method [5]. The SAMVIQ and SAMPVIQ method are multi-stimulus approaches allowing us to view each test stimulus multiple times while the PC method requires a large number of video pairs to be compared. Because these methods are more laborious than the ACR, ACR-HR, and DSIS method, participants’ fatigue may have an impact on their opinion scores.
The above subjective quality assessment methods, originally proposed for conventional videos, have also been used for assessing the quality of 360° videos, digital games, and 3D graphics on HMDs. For example, subjective quality assessment of 360° videos using the ACR method can be found in [10,11,12,13,14,15,16,17], the ACR-HR method is applied in [14,18], the DSIS method is used in [19,20], the SAMVIQ method is chosen in [9], and the SAMPVIQ method is used in [9,21].
Given that viewing of immersive media on HMDs is still new to the consumer market, the modified ACR (M-ACR) method was proposed in [22] for subjective quality assessment of 360° videos. In this method, each 360° video stimulus is shown twice back-to-back with a mid-gray screen in between. Because the first stimulus is shown for only a short duration of 10 s, the second presentation of the stimulus of the same duration is thought to allow participants unfamiliar with immersive media to give a more confident opinion score. On the other hand, the overall duration of a session in the M-ACR method increases significantly compared to the ACR and ACR-HR method. The M-ACR method was used, e.g., in [22] for subjective quality assessment of HEVC/H.265-encoded 360° videos at different bitrates and resolutions using an Oculus Rift HMD.
Further, standardized methodologies for 360° video applications are being developed within the varies standardization bodies. Specifically, ITU-T Study Group 12 and the Video Quality Experts Group (VQEG) have joint forces to develop Recommendation ITU-T P-360-VR on subjective test methodologies for 360° video on HMDs [23]. A tool that supports the set of methodologies and functionalities of the current P.360-VR test plan has been reported in [24] for Android-based HMDs. However, viewing arrangements in these efforts and the above works are limited to seated viewing but neglect other viewing conditions such as standing viewing.
1.1.2. Viewing Conditions and Users’ Viewing Experience in VR
In [25], the effect of fixed, half-swivel, and full-swivel chairs on users’ viewing experience of 360° videos on a FOVE-DK-0 HMD with a resolution of pixels was investigated. Eye-tracking, questionnaires, tasks, and semi-structured interviews were used in a between-subject experiment in which participants were shown one training and five 360° test videos of 4K resolution. While fixed and half-swivel chairs were found to discourage exploration for some of the shown videos compared to the full-swivel chair, no significant differences were found regarding incidental memory, general engagement, and simulator sickness. It was also revealed that participants under the fixed chair condition had a greater concern of missing something out for certain videos compared to those sitting on a full-swivel chair.
An evaluation of the effect of display type on viewing experiences for panoramic videos for cinematic VR applications was conducted in [26]. In this study, participants watched four 360° videos on an Oculus Rift CV1 HMD, a surround video+ system, and a standard TV with a 16:9 widescreen aspect ratio while sitting on a fixed chair for all scenarios. The choice of a fixed chair was motivated by the assumption that home viewers would most likely be seated on a fixed chair or couch when watching cinematic VR. Regarding the aspects of attention guidance and participants’ concern of missing something, there were no significant differences between the three display conditions. It was conjectured that using a fixed chair places a soft limit on the field of regard that is more limited than the available field of view. It was pointed out that the unexpected finding of participants under HMD conditions not feeling to miss out on visual events may have interesting practical implications for the creation of 360° videos watched seated on a fixed chair.
Recently, there has been increased attention given to research on seated VR regarding user interfaces, perception, locomotion, and related topics. This includes work on fully immersive desktop VR that supports immersive virtual environments and are integrated with existing workflows where users are staying seated as reported in [27]. The feasibility of non-stationary office desk substitution for desk-based and HMD-projected VR was evaluated in [28] regarding cybersickness, presence, and task performance. In [29], an augmented reality (AR)-based interface for data presentation was presented and evaluated that assists reading and typing data into a computer system.
In [30], four locomotion interfaces allowing for limited translation combined with full rotation were used in a mixed-method experiment to compare the associated four levels of translational cues in terms of measures such as task performance, task load, and simulator sickness. Specifically, four locomotion modes providing different amounts of translational cues and control, and full rotation were realized: (1) swivel chair with translation performed using a touchpad, (2) swivel chair based NaviChair with movement direction and speed controlled by participants’ upper-body leaning, (3) NaviBoard allowing for whole-body leaning and stepping, (4) free walking. The virtual scene for the navigational search task was shown on an HTC Vive HMD with TPcast wireless adapter. The results indicate that the NaviBoard performs best in the different measures followed by the NaviChair. Further, the trends obtained from statistical analysis of the data gathered in this mixed-mode experiment suggest that suitable translational cues and control may be beneficial to reduce simulator sickness. Related research on different aspects of locomotion, locomotion interfaces, and self-motion perception in VR can be found, e.g., in [31,32,33,34].
In [35], motion sickness properties of commercial video games when presented on an HMD were evaluated for standing and seated play. Although motion sickness occurred for both conditions, it was reported to be more common when participants played the video games while standing. Furthermore, during seated play, significant differences in head movements between sick and well participants were observed before the onset of motion sickness.
The viewing conditions and associated user’s viewing experiences in VR reported in the above works are evaluated in terms of immersion, presence, cybersickness, task performance, and task load. However, subjective 360° video quality assessment for the wide range of viewing conditions using subjective test methods as in the works reviewed in Section 1.1.1 is missing.
1.2. Motivation and Contributions
In this paper, in continuation of the encouraging results in [36], we compare the impact of standing and seated viewing on subjective 360° video quality assessment. Given the relatively early phase in the development of 360° video streaming systems, especially regarding the evolution of digital value platforms for 5G and 6G mobile systems, a pilot study on subjective video quality assessment for standing and seated viewing of 360° videos on HMDs has been conducted. The approach of conducting pilot tests with small groups of experts provides indicative results to guide the experimental design of large-scale subjective tests as was stated in [5]. In addition, in view of recent public health concerns, the role of pilot tests may become increasingly important in the future as a measure to constrain potential risks of spreading diseases through test equipment such as controllers and HMDs despite of exercising state-of-the-art hygiene procedures [37,38]. The research reported in this paper hence contributes to both subjective test methodologies and the understanding of QoE for 360° videos on HMDs.
Due to the additional degrees of translational and rotational freedom offered by 360° videos on HMDs, ground truth for immersive media system design needs to account for the impact of the actual viewing conditions on subjective quality assessment. Subjective test methodologies for conventional videos, which focus on seated viewing of test stimuli, therefore require an expansion to include conditions such as standing viewing for 360° videos on HMDs. For this purpose, the pilot study reported in this paper approaches subjective 360° video quality assessment in relation to participants’ experience with 360° videos on HMDs for standing and seated viewing. The overall aim of this study is to reveal differences in participants’ subjective quality assessment depending on the viewing conditions by using psychophysical and psychophysiological measures. The psychophysical data explicitly relates to the opinion scores about the quality that the participants have consciously given to the different 360° video stimuli. In contrast, the psychophysiological data implicitly sheds light on perceptual and cognitive processes which assists here to explain differences in subjective quality assessment for standing and seated viewing. The subjective test conducted in this pilot study provides indicative results on the subjective quality assessment of 360° video stimuli for both standing and seated viewing.
Contributions of this paper on the effect of standing and seated viewing of 360° videos on subjective video quality include the following:
- Average rating times, mean opinion scores (MOS), and their standard deviations for different 360° video stimuli covering a wide range of resolutions and degrees of compression are obtained from the psychophysical data for standing and seated viewing. These measures relate to the opinion scores that were consciously given by the participants in the quality assessment of the shown stimuli. The results shed light on the participants’ ability to resolve different quality levels and the confidence they have in their quality assessment for both viewing conditions.
- Psychophysiological data in terms of head movements, pupil dilations, and GSRs are analysed, which provides insights into stimuli exploration behavior and emotional arousal. This analysis assists in revealing reasons for the performance differences between standing and seated viewing in the quality assessment of 360° videos on HMDs.
- Simulator sickness cluster scores are provided to further support the performance comparison. The well-known simulator sickness questionnaire (SSQ) suggested in [39] is used to collect the participants’ scores on a standard display before and after exposure to the virtual world presented on the HMD. In this way, the change in simulator sickness symptoms due to watching the stimuli on an HMD is obtained supporting a comparison of both viewing conditions.
The remainder of this paper is organized as follows. Section 2 provides a detailed description of the experimental setup of the pilot study. The experimental results are presented and discussed in Section 3 along with a statistical analysis of the wide range of recorded psychophysical and psychophysiological data. A summary of the work, together with findings and conclusions, are given in Section 4.
2. Experimental Setup of the Pilot Study
In the following sections, the experimental setup used in this pilot study is described to the extent needed for the understanding of the statistical analysis of the psychophysical and psychophysiological data that was recorded in the subjective tests for standing and seated viewing. More details about the experimental design regarding the 360° video scenes, processing and preparation of reference and test videos, software suite, and hardware equipment of the test platform used in our subjective test campaigns on different aspects of 360° video quality assessment can be found in [40].
2.1. Software and Technical Equipment
The Unity 3D game engine Version 2018.3.11f1 and Visual Studio 2017 were used to develop the test platform. The test platform schedules the presentation of the test stimuli, provides the graphical user interface for giving opinion scores according to the ACR-HR method, and records the given opinion scores as well as a variety of sensor data. The Unity build-in random function was used to randomize the video presentation such that each participant views the test stimuli in a different order. The Viveport SDK was used for the implementation of the test platform, which utilities the SteamVR framework. Furthermore, the Tobii XR SDK was used for eye-tracking calibration and data collection. The viewing of the 360° test stimuli and the category scale for rating their quality are shown on an HTC Vive Pro HMD with a Tobii Pro prototype eye-tracker integrated into the HMD. The HTC Vive controller is used to cast the opinion scores within the virtual world on the HMD after each 360° video stimulus. The location of the controller was tracked with the SteamVR Tracking System Version 1.5. The GSR was recorded using the iMotion Software Version 7.1 by iMotion A/S, Copenhagen, Denmark, with a wireless Shimmer GSR biosensor. Before and after each session, an SSQ was answered by each participant outside the HMD and recorded using the iMotion software. A Corsair One i160 Gaming- PC with an Intel I9-9900K Processor of 3.6 GHz clock rate was used, which has an NVIDIA GeForce RTX 2080 TI graphics card with 4352 CUDA cores and allows a maximum digital resolution of 7680 × 4320 pixels. Figure 1 shows the setup of the HTC Vive Pro HMD and HTC Vive controller on a participant for standing viewing and seated viewing on a fixed chair. In both viewing conditions, participants were constrained to the play area marked at the floor, allowing unlimited rotational movements around the x, y, and z axes but limited translational head movements along these coordinates.
2.2. Test Procedure
The participants were asked to rate the 360° video quality on a five-level quality scale, i.e., (5) excellent, (4) good, (3) fair, (2) poor, (1) bad, according to the ACR-HR method [5]. In the ACR-HR method, the test stimuli are presented one at a time and rated independently on the category scale. The reference version of each test stimulus had to be included in the set of test stimuli and was shown as any other test stimulus. The presentation of the test stimuli was done in random order such that they were shown in a different order to each participant. Each of the two sessions (standing and seated) lasted around 25 min, depending on the time needed by each participant for rating the test videos. The schedule of stimulus presentation in the ACR-HR method and other components used in each test session of the pilot study are shown in Figure 2. A session started with giving instructions to the participants about the subjective tests such as equipment, voting task of 360° video scenes, and the screen-based SSQ. Then, the two electrodes of the GSR sensor were placed on the skin using snap-on Velcro straps to non-invasively record skin conductivity. The well-known SSQ introduced in [39], which accounts for 16 symptoms, was answered by each participant before and after each session. Because the two sessions, i.e., standing and seated viewing of 360° videos, were conducted on different days, the pre-session SSQ (Pre-SSQ) provided a baseline for comparison with the post-session SSQ (Post-SSQ) at the end of each session.
2.3. Reference and Test Videos
Four 360° video scenes of 8K resolution (2D width) were selected from the publicly available VQA-ODV database [41,42], which span over different contents. Figure 3 shows sample frames of the 360° video scenes: “Alcatraz”, “BloomingAppleOrchards” (Blooming), “FormationPace” (Formation), and “PandaBaseChengdu” (Panda). These natural scenes were selected to reduce the potential risk of simulator sickness, which otherwise could affect the video quality assessment task in both standing and seated viewing of the reference and test videos. All 360° reference videos generated from the four scenes were of 10 s duration and were presented with a frame rate of 29.97 frames per second (fps). To reduce the excessively high bitrates of the uncompressed 8K reference videos ranging from 352.35 Mbps to 844.65 Mbps, perceptual near to lossless encoding was performed using the constant rate factor (CRF) option of H.265 encoding [43,44] with CRF = 10. As a result, the bitrates of the perceptually near to lossless encoded 8K reference videos were reduced to range from 136.68 Mbps to 226.79 Mbps.
Additional reference videos with resolutions of 6K, 4K, and 2K were generated from the 8K reference videos of the four scenes using the bi-cubic scaling algorithm for downsampling and subsequent near to lossless encoding with CRF = 10. Reference videos with optimal resolution (OR) of pixels, suggested in [18] to align the 360° video resolution with the HTC Vive Pro HMD resolution, were also generated for all four scenes. The test videos were generated by compressing the reference videos with quantization parameter (QP) set to QP = 22, 27, 32, 37, and 42 using the libx265 encoder of the FFmpeg tool. As a result, 30 videos were produced for each of the four scenes with parameter settings shown in Table 1, i.e., five reference videos (five resolutions) with near to lossless encoding using CRF = 10 and 25 test videos (five QPs for each of the five resolutions). The available total of 120 videos, comprising of 30 videos for each of the four scenes, allow for subjectively assessing a wide range of 360° video quality levels.
2.4. Participants
Five experts participated in this pilot study, which viewed all 120 360° videos (four different scenes) on an HTC Vive Pro HMD under both viewing conditions, i.e., standing and seated on a fixed chair. All experts were academic staff and familiar with immersive media and/or media signal processing (two females and three males). The ages of the experts spanned between 31 to 60 years with an average age of 38.6 years. These experts passed the visual acuity and color vision tests in the context of recent subjective tests that were conducted on other aspects of immersive visual media quality assessment.
3. Experimental Results
This section provides a statistical analysis of the data gathered in the subjective tests and a comparison of the obtained results for standing and seated viewing. In relation to the psychophysical data, the rating times needed for casting the opinion scores are presented and discussed. The opinion scores, representing conscious responses to the 360° video stimuli, are averaged across participants and scenes giving MOS and average MOS, respectively, along with the related standard deviations. A psychophysiological assessment is also provided for both viewing conditions regarding head movements, pupil dilations, and GSRs, which relate to the physiological bases of perception and cognitive processes. The amount of simulator sickness induced by standing and seated viewing is evaluated in terms of sickness symptom clusters.
3.1. Rating Times
Figure 4 shows the box plots of rating times that were consumed by the participants to cast opinion scores about the quality of the shown reference and test stimuli for standing (ST) and seated (SE) viewing. The rating times are grouped with respect to the 30 test videos produced for each of the four scenes covering 30 different resolution-QP pairs. In addition, average rating times over the four scenes with the same resolution-QP pair were calculated to also obtain content independent insights. Given that five participants provided ratings for each group of 30 test videos, a data set of 120 rating times is available for each scene and for the average rating time over all scenes.
As can be seen from the figure, depending on the scene, the median (50th percentile) of the rating times may be slightly lower or higher for seated viewing of 360° videos compared to viewing them while standing (see Table 2 for numerical values). The same applies for the interquartile ranges, representing the difference between the upper quartile (25th percentile) and lower quartile (75th percentile), which were quite narrow for all four scenes. However, several outliers were observed for each scene outside the range that is bound by the whiskers where some participants required a longer rating duration for particular resolution-QP pairs. Similar results were obtained for the content independent average rating times which indicated a low degree of dispersion of the data but a somewhat skewed distribution toward higher rating times. It should be noted that the outlier of almost 9 s needed by one participant for scene “Panda” for seated viewing does not carry over to the box plot for the average rating time because ratings were averaged over all four scenes for this metric.
Table 2 presents the median, mean, and standard deviation (SD) of the rating times for each scene and the average rating times over the four scenes. These numerical results suggest that the duration it took to rate 360° video quality did not depend much on whether a participant was standing or seated. In either case, median and mean rating times were well below 2 s which may assist the design of subjective tests such that exposure to the virtual world in an HMD is kept within acceptable limits.
3.2. Opinion Score Analysis
The opinion scores given by the participants about the quality of the 360° video stimuli represent a psychophysical assessment with conscious responses. The statistical analysis of the data set of opinion scores was conducted in this pilot study in terms of mean and SD.
Specifically, the MOS has been widely used as an indicator of perceptual media quality and is defined as the average of the opinion scores across the participants as [5]
where denotes the opinion score given by participant to test case of scene . Similarly, in the considered context, the average MOS may be defined as the average of the MOS in (1) across the different 360° video scenes as follows:
To reveal the dispersion of the opinion scores around the MOS for a given test case j and scene k, the standard deviation was used as [5]
while the SD of the average MOS was given by
Further, the SD of opinion scores (SOS) hypothesis has been introduced in [45,46] to assess the diversity of subjective ratings on a five-level quality scale. This work postulates a square relationship between MOS and SOS suggesting the SOS fitting function as follows [45]:
where a is called the SOS parameter and variable x represents the MOS. Note that the SOS parameter a was determined by minimizing the least square errors between the SD of the opinion scores and the SOS fitting function (5). It has been shown in [45] that the SOS parameter a assists in identifying the type of application, e.g., images, video streaming, voice-over-IP, web surfing, and cloud gaming. Accordingly, as the ACR-HR method also uses a five-level quality scale, the SOS fitting function can be applied to assess the diversity of subjective ratings of the pilot study for standing and seated viewing of 360° videos on an HMD.
3.2.1. Mean Opinion Scores
Figure 5 shows average MOS values over all four scenes versus quantization parameter for different resolutions. Although the progressions of the MOS values are similar for standing and seated viewing, i.e., decreasing MOS with increasing QP for each resolution, the participants’ ability to resolve different resolution-QP pairs appeared to be higher for seated viewing. This can be observed for the reference videos (Ref.) where the participants much better differentiated among the resolutions of 8K, 6K, 4K, and OR when seated while the MOS values were more narrowly clustered when standing. Furthermore, the reference and test videos with resolutions of 4K and OR ( pixels for the HTC Vive Pro HMD) could be clearly distinguished by the participants when seated resulting in higher MOS values for the videos of 4K resolution compared to OR. In contrast, the participants of the pilot study did not perceive any significant quality differences among these two resolutions for standing viewing. Additionally, for the highest level of quantization with QP = 42, slightly lower MOS values for each resolution were obtained when seated. These findings indicate that the participants of the pilot study executed the quality assessment task with higher resolving power when seated, i.e., could differentiate better among the resolution-QP pairs of the 360° test videos.
Figure 6 provides an alternative presentation of the opinion score analysis showing the average MOS values versus resolution for different quantization parameters. It is observed that the progression of the average MOS for the resolution from 4K to OR was almost constant for a given quantization parameter under standing viewing conditions. This characteristic for standing viewing applied in particular to the medium levels of quantization of QP = 27, 32, and 37. This result supports the conjecture that the resolving power among different resolution-QP pairs seemed to be lower for standing viewing.
3.2.2. Standard Deviation and SOS Fitting
Figure 7 depicts the SD of the average MOS for standing and seated viewing. The fittings of the SOS function (5) to the data points are also provided for both viewing conditions. It is observed that the SD became lower toward the lower end (bad) and the upper end (excellent) of the quality scale compared to the mid-quality range. This finding is consistent with the quality assessment statistics of conventional images and videos [46,47,48]. In other words, there was stronger agreement among the participants about the quality of the bad and excellent 360° video stimuli while the mid-quality stimuli were more difficult to assess. In addition, the SD for standing viewing was higher than for seated viewing for the entire average MOS range. As such, the participants not only had higher resolving power among the quality of stimuli with different resolution-QP pairs while seated but also were more confident about the given opinion scores compared to standing viewing.
The SOS parameter a and mean square error (MSE) obtained from fitting the SOS function (5) to the SD of opinion scores for the different data sets, i.e., average MOS and MOS of the four 360° video scenes are provided in Table 3. As can be seen from the table, the SOS parameter a was higher for standing viewing compared seated viewing for all considered cases. In particular, the curve fitting results in the SOS parameter were in the ranges of for standing viewing and for seated viewing. The SOS parameter irrespective of standing and seated viewing resided in the range of which is consistent with the results obtained in [45] for video streaming with SOS parameter being in the range of . Regarding the indicative MSE values obtained from the data of the pilot study, these were influenced by the number of participants and may be reduced by striving for participant that span beyond experts apart from increasing the number of participants.
Additional results regarding the MOS progression for different resolution-QP pairs and the related SDs for each of the four 360° video scenes are provided in Appendix A and Appendix B, respectively.
3.2.3. Subjective Qualitative Feedback
All participants were of the opinion that standing viewing allowed for a wider exploration of the 360° video scenes but were unsure if this would have influenced their quality ratings. The two female participants felt nervous at the beginning of the session for standing viewing because of the fear of falling which distracted them from the quality rating task. One female participant felt quite intense dizziness during the first 2 to 3 min of the standing viewing session which relates to the first 6 to 9 of the 120 videos. One participant suggested using a swivel chair for seated viewing in future experiments.
3.3. Head Movements
In order to shed more light on the effect of standing and seated viewing of 360° videos regarding participants’ viewing behavior during the quality assessment task, head movements were recorded for each participant throughout each session of the subjective test. In particular, head movement traces comprising of 125,350 samples in the average for yaw angle (head rotation to the left or to the right), pitch angle (upward or downward head rotation), and roll angle (head tilt toward the shoulders) were obtained to capture participants’ viewing behavior. In this article, we focus on analyzing the pitch and yaw angle traces to reveal participants’ exploration behavior of the virtual world during the sessions. In particular, the heat maps of these two angles essentially indicate the viewpoint at which the participants tend to focus.
Figure 8 provides a comparison of the heat maps regarding yaw and pitch angles for standing and seated viewing with the frequency of access increasing with hue from blue toward red. These heat maps show accumulated traces for all participants while heat maps of yaw and pitch angles for each participant can be found in Appendix C. It can be seen from this figure that the participants focused on the front view, i.e., horizontal and vertical zero line, for both standing and seated viewing. However, the exploration of the virtual world significantly increased for standing viewing compared to seated viewing with the left or right rotation of the head movement covering the entire yaw angle interval from −180° to 180°. A similar behavior can be observed for the upward or downward head rotation where the pitch angle covered a much larger interval for standing compared to seated viewing. This observation supports the finding of Section 3.2 that the participants could better and with higher confidence differentiate among 360° video quality levels when seated, which may be attributed to the rather narrow area of visual attention as indicated by the heat map for seated viewing. On the other hand, the larger exploration of 360° videos while standing appeared to distract the participants from the quality assessment task to some extent.
Table 4 provides numerical values of the maximum (max), minimum (min), and width ( = max − min) of the exploration interval in terms of the yaw and pitch angles for each participant, and both standing and seated viewing. The bottom row of the table depicts the extrema of each yaw and pitch column, thus, corresponding to the extrema of the yaw and pitch angles in the heat maps of Figure 8. Apart from the expected variation of head movements among participants, the width of the exploration intervals differed much less among participants for seated viewing compared to the case when the 360° videos are viewed while standing. Specifically, the yaw width varied between 127.1° and 191.1° among participants for seated viewing while it varied between 274.9° and 360° for standing viewing. Similarly, the pitch width varied only between 60.2° and 75.3° for seated viewing but between 78.5° and 162.8° for standing viewing. The head movements seemed therefore to be more consistent among participants for seated viewing which in turn suggests that the 360° video scenes were explored rather similarly during the subjective test. In contrast, given that the HTC Vive Pro HMD used in our experimental setup was connected to a computer via a cable, some participants may feel more hindered by the wired connection to fully explore the 360° videos while standing, compared to other participants which may be less disrupted by the cable.
In view of the discussion in Section 3.2, the above results suggest that 360° video quality assessment may use seated viewing arrangements because participants had higher resolving power regarding the quality levels of different resolution-QP pairs. In addition, due to the fact that the participants exercised relatively little scene exploration during seated viewing, the opinion scores given to the test videos were less influenced by the particular viewing path through the virtual world but were more dominated by the visual quality of a scene in the narrow area of visual attention. As such, it may be conjectured that MOS values obtained from opinion scores given by participants under seated conditions were more meaningful when it comes to 360° video quality benchmarking.
3.4. Pupil Dilation
Pupillometry deals with measuring the pupil of the eye such as pupil size and reactivity. Specifically, in psychology, the recordings of the diameter of the eye to visual stimuli are explored to determine a participant’s interest in the stimuli. The work reported in [49] indicates that the pupil diameter can be correlated to processing load, memory, emotion, and arousal. Regarding visual search tasks that engage distractors for making target recognition harder, pupil dilation increases have been reported in [50] for such tasks. The work in [51] reported bi-directional effects of emotion on pupil change. Specifically, it was found that pupil constricted when participants viewed unpleasant pictures and dilated when pleasant pictures were viewed. In [52], the arousal effects on pupil size, heart rate, and GSR in an emotional face task and the relationship between these measures was studied.
In the context of this paper, we have focused on analyzing the pupillometry data that were obtained using the integrated eye-tracker of the HTC Vive Pro HMD. The pupil diameter for the left and right eye were recorded for each participant. The average pupil diameter across the left and right eye was then calculated for each sample point. As a point of reference, pupils generally range in diameter from 2 to 8 mm, the diameter of a fully dilated pupil is typically in the range of 4 to 8 mm while the diameter of a constricted pupil is typically in the range of 2 to 4 mm [53].
Figure 9 shows box plots of the pupil diameters for each participant and across participants. The results show that the median pupil diameters increased for standing viewing compared to seated viewing for three of the five participants, remained almost the same for one participant, and decreased for one participant. The box plots labeled as “All” refer to the pupil diameters across all participants, i.e., the five individual data sets are merged to a single data set containing all pupil diameters. The increase in median pupil diameter due to standing viewing was more pronounced for this average of central tendency across all participants. Because the 360° video stimuli are shown in random order, another variant of averaging was performed across participants with respect to each time instant of the equidistantly sampled pupil diameters. In this way, an average pupil diameter for each time instant was obtained across participants with the related box plots labeled as “Average”. The results for this type of average pupil diameters also suggest that pupil dilated for standing viewing compared to seated viewing. In addition, the spread of average pupil diameters significantly reduced for both viewing conditions as the variation among the participants at a given time instant was averaged in this analysis. In view of the typical ranges of pupil diameters mentioned above, the medians of around 3 mm and below suggest that pupils were generally constricted when viewing the 360° video stimuli on the HTC Vice Pro HMD. The dilation for standing viewing needs therefore to be seen with reference to the observation that participant’s pupils were constricted during the sessions of the subjective test. Numerical values of the pupil diameter statistics, supporting the findings deduced from the box plots, are given in Table 5 in terms of median, mean, and standard deviation.
Apart from the differences in pupil diameters among the individual participants, the subjective experiment was repeated three times on different days for Participant 2 to illustrate the impact of changes in a participant’s physical state on the results. Figure 10 shows the box plots of pupil diameters for Participant 2 as well as average pupil diameters across the three sessions. In addition, numerical values of median, mean, and standard deviation of pupil diameters are provided in Table 6. Depending on the session, the pupil diameter of Participant 2 may be lower, similar, or higher for standing viewing compared to seated viewing. However, the box plots considering the set of all pupil diameters recorded during the three sessions (All) and the average pupil diameters across the same time instants of each session (Average) both suggest that the pupil dilates for standing viewing.
Overall, a slight increase in pupil dilation was observed for standing viewing. This result suggests a slightly more pleasant or immersed viewing experience for standing viewing compared to seated viewing which aligns well with the higher emotional arousal deduced from the GSR data (see Section 3.5). However, given the variability of pupil diameter readings among participants, their physical condition at the time of recording, and the limited number of participants of the pilot study, further research is needed to reveal the potential of pupillometry for quality assessment. Given the observed rather mild differences in pupil diameter between standing and seated viewing, pupillometry may not be seen in isolation but to be fused with other psychophysiology-based measurements (see [54] regarding multimodal measurements).
3.5. Galvanic Skin Response
The GSR or electrodermal activity (EDA) measures the resistance on the surface of the human skin, which can be translated to the emotional arousal of a person elicited by visual stimuli. In the following, the GSR traces recorded during the subjective tests for each participant are analysed to shed light on implicit responses in relation to the 360° video quality assessment task for standing and seated viewing.
The two main components of a GSR signal are the tonic component or skin conductance level (SCL) and the phasic component or skin conductance response (SCR). The tonic component captures the slow changes in the GSR signal over a time span in the order of tens of seconds to minutes and can vary significantly between participants as well as for an individual participant over longer periods of time. Changes in the tonic component of a GSR signal can be attributed to changes, e.g., the level of stress, and other general changes in autonomic arousal. Depending on the psychological state of a participant, the tonic component can vary in the range of around 2 to 20 micro-Siemens (μS). The phasic response represents the rapid changes in the GSR signal which occur in the order of seconds on top of the tonic level. These rapid changes or peaks in the GSR signal are also referred to as event-related SCRs (ER-SCRs) which result from sympathetic neuronal activity and occur in relation to a single stimulus. An analysis of GSR peaks is widely used when it comes to relating changes in emotional arousal to specific stimuli or unexpected events. We refer the reader to the handbook [55] for a comprehensive treatment of the principles behind electrodermal phenomena, methods of recording EDA, and applications of such recordings. It should be mentioned that the schedule of a test session (see Figure 2) used in this pilot study showing each 360° video for 10 s along with the subsequent voting time accounts for the slowness of ER-SCRs which commence around 1–5 s after an event onset and may then last up to a few seconds. In other words, the stimuli were shown sufficiently long to relate a GSR peak to a particular 360° video as well as to provide a cool-off stimulus by way of the rating scale and task between each stimulus.
Figure 11 shows the original GSR signal, phasic GSR signal, and GSR peaks obtained for Participant 1 in the respective test session for standing and seated viewing. It can be observed that the amplitude of the original GSR for standing viewing resided on a higher level compared to seated viewing. Specifically, for standing viewing, the GSR amplitude varied between a minimum of 2.825 μS and a maximum of 9.678 μS with an average amplitude of 5.575 μS. The original GSR signal for seated viewing varied around an average amplitude of 2.220 μS with a minimum of 1.194 μS and a maximum of 4.376 μS. These results indicate that Participant 1 was emotionally more aroused and under higher mental load for standing viewing as skin conductance was higher which in turn suggests higher sweat gland activity under this condition. In addition, the progression of the original GSR signal amplitude over time was more rugged for standing viewing which applies in particular to the period after 5 min of the test session. Furthermore, there were several periods in which Participant 1 commenced to fall into a rest mode where the amplitude of the original GSR signal decreased. For example, a transition into a more relaxed mode was quite pronounced for the period from minute 4.67 to 6.78. For seated viewing, in contrast, Participant 1 seemed to be rather relaxed throughout the entire test session. This observation supports the conjecture that the 360° video quality assessment task was more reliably executed by this participant under seated viewing conditions.
The GSR progression over time could be quite different between participants due to their initial mental state at the beginning of the subjective test and emotional arousal caused by the sequence of stimuli. More aggregated metrics associated with an original GSR signal were given by the number of GSR peaks and the peaks per minute that occurred during a session. A GSR peak or ER-SCR was observed as a significant change in GSR activity in response to a stimulus (see Figure 11). Table 7 shows the number of GSR peaks and peaks per minute contained in the original GSR signal of each participant for standing and seated viewing. The averages of these metrics across all participants are also provided in the bottom row of the table. Although the respective values differed relatively wide among the participants, the average number of GSR peaks and average number of peaks per minute indicated around twice as many GSR peaks per session and per minute for standing viewing compared to seated viewing. This means that the participants on the average seemed to be more emotionally aroused and potentially more immersed in the virtual world when viewing the sequence of 360° video stimuli while standing. Standing viewing with its higher degree of rotational movement appeared to better support immersion or engagement with the virtual world, while the lower degree of emotional arousal in seated viewing seemed to allow the participants to better conduct the quality assessment task.
It should be pointed out that the trends and conjectures deduced from the average values may be quite different for an individual participant. In relation to the GSR peaks, Participant 5 showed different responses than those observed for the other participants, which would translate to higher emotional arousal in seated viewing compared to standing viewing. Three additional sessions on different days were conducted for Participant 5 to shed more light on the variability of the unconscious responses to the stimuli. Table 8 provides the number of the results obtained for each of the three sessions along with the average values across the sessions. The average results for the GSR peaks calculated for Participant 5 suggest that higher emotional arousal was induced by standing viewing, although not as pronounced as for the averages obtained across participants shown in Table 7. These examples also show the challenges of psychophysiology-based quality assessment as was argued in [54] and the need for further research on multimodal approaches that integrate physiological and psychological processes.
3.6. SSQ Scores
The SSQ used in this study accounted for 16 symptoms, which can be further grouped into three symptom clusters [39], i.e., nausea (N), oculomotor (O), and disorientation (D) as follows:
- N:
- General discomfort, increased salivation, sweating, nausea, difficulty concentrating, stomach awareness, burping.
- O:
- General discomfort, fatigue, headache, eyestrain, difficulty focusing, difficulty concentrating, blurred vision.
- D:
- Difficulty focusing, nausea, fullness of head, blurred vision, dizziness (eyes open), dizziness (eyes closed), vertigo.
The respondents to the SSQ rate the presence of each symptom through a symptom variable score: (0) none, (1) slight, (2) moderate, (3) severe. These symptom scores are accumulated to produce symptom cluster scores, which are then weighted by empirically obtained constants to give weighted symptom cluster scores and a total score (TS).
Figure 12 shows the impact of standing and seated viewing on the simulator sickness clusters and the TS in terms of mean values over all participants along with the corresponding standard deviation. The Pre-SSQ scores were obtained from the scores given by the participants prior exposure to the virtual world in the HMD and hence represent the level of sickness symptoms at the beginning of the subjective test. Similarly, the Post-SSQ scores quantified the level of simulator sickness at the end of the 360° video quality assessment experiment. A normalized measure of the simulator sickness with reference to the Pre-SSQ score may be formulated as
As can be observed from the figures, viewing and rating the quality of the 360° video stimuli on the HTC Vive Pro HMD when standing resulted in much higher scores for the three simulator sickness clusters and the TS compared to seated viewing. Specifically, the nausea and disorientation related sickness symptoms significantly increased compared to the scores from the pre-session SSQ. This finding is in line with the postural instability theory of motion sickness established in [56]. In view of the above, subjective test designs for standing viewing may distribute the set of stimuli over several sessions with sufficiently long breaks in between. This may alleviate the possible impact of simulator sickness on the video quality assessment task.
4. Summary and Conclusions
This paper has reported a pilot study on subjective 360° video quality assessment using the ACR-HR method for 360° videos on an HTC Vice Pro HMD with integrated eye-tracker subject to standing and seated viewing. Psychophysical measures in terms of the opinion scores consciously given by the participants to 120 360° video stimuli with different qualities were recorded and analysed to produce MOS and related SD for both viewing conditions. An analysis of the psychophysiological data given as head movements, pupil dilations, and GSRs has shed more light on the covert responses of the participants to the 360° video stimuli for standing and seated viewing. In addition, simulator sickness cluster scores have been calculated from a standard SSQ in order to compare the impact of the viewing condition on this aspect. The indicative results obtained from this pilot study, contributing to answering the three research questions posed in the introduction section, include the following:
- The average rating times needed by the participants to cast an opinion score on the quality of the 360° video stimuli with different resolution-QP pairs are similar for standing and seated viewing.
- The MOS results suggest that participants seem to have higher resolving power among the different quality levels of the shown stimuli for seated viewing, i.e., were able to better differentiate among the different resolution-QP pairs of the 360° video stimuli.
- The standard deviation of the opinion scores around the MOS values indicates that participants were more confident about the given opinion scores for seated viewing. Further, for both viewing conditions, the participants were more confident about their rating for the lower end and the higher end of the quality scale while uncertainty increased for the mid-quality 360° video stimuli.
- The analysis of the head movements reveals a larger scene exploration of the 360° videos for standing viewing, which appears to distract from the quality assessment task. This leads to the conjecture that the reduced resolving power among the different quality levels observed for standing viewing is traded off for an increased emotional arousal.
- A slightly higher pupil dilation is recorded for standing viewing, which suggests a slightly more pleasant immersive experience compared to seated viewing.
- The analysis of the GSR data indicates that participants were in a state of lower emotional arousal in seated viewing. This seems to allow participants to conduct the quality assessment with higher precision and confidence regarding the different quality levels of the stimuli.
- Significantly lower simulation sickness has been reported for seated viewing compared to standing viewing. This is an important finding to be considered in the design of subjective tests for 360° video quality assessment.
- All of the above findings support the recommendation to conduct subjective tests on quality assessment of 360° videos on HMDs under seated viewing conditions when it comes to producing a ground truth for immersive media system design. As participants seem to be more precise and confident about their opinion scores for seated view, such a system design can be expected to also be sufficient for viewing conditions that induce higher levels of emotional arousal which in turn distracts from the actual stimuli quality.
The indicative results produced by this pilot study provide evidence that different viewing conditions should be accommodated into the development of novel subjective quality assessment methods for immersive media such as 360° videos on HMDs. Instead of focusing purely on the impact of resolution, source coding, and other multimedia signal processing on subjective quality under seated viewing conditions, additional options of viewing conditions should be accounted for in subjective tests. In this way, a more holistic understanding of quality aspects could be obtained to assist the design of efficient immersive media systems. The pilot study contributes to such a holistic view of subjective quality assessment and provides indicative ground truth that can guide the design of large-scale subjective tests. As the results of a pilot study by definition are indicative, we would like to suggest some future work that may be pursued in large-scale subjective tests on quality assessment of novel immersive media on HMDs such as 360° videos as follows:
- Conduct subjective tests for a larger panel of participants and a larger set of viewing conditions including fixed chair, half-swivel chair, full-swivel chair, couch, options of larger rotational and translational movements, and free walking.
- Conduct subjective tests for the above viewing conditions using different methods such as ACR, ACR-HR, M-ACR, DSIS, SAMVIQ, SAMPVIQ, and PC to compare their suitability for subjective quality assessment for immersive media and to obtain directions for the development of new subjective test methodologies that are better tailored for this type of media.
- Investigate the user behavior in relation to different contents and its impact on subjective quality assessment, viewing condition, and emotional arousal.
- Investigate subjective quality assessment subject to different levels of experience (experts, often, sometimes, never used) with watching immersive media on HMDs and different demographic data (age, gender).
- Produce publicly available annotated databases with related ground truths to support the benchmarking of processing algorithms and system design.
- Utilize the insights obtained from participants’ exploration behavior to produce content that fits the particular viewing condition, e.g., relatively narrow scene exploration for seated viewing.
- Develop objective perceptual quality metrics for immersive media that are able to predict the quality as it would be perceived by humans, which then can be used for automatic resource management and quality control in immersive media systems.
Author Contributions
Conceptualization, Y.H., M.E. and H.-J.Z.; methodology, Y.H., M.E. and H.-J.Z.; software, Y.H.; formal analysis, M.E. and H.-J.Z.; investigation, Y.H.; data curation, Y.H.; writing—original draft preparation, H.-J.Z.; writing—review and editing, Y.H., M.E. and H.-J.Z.; visualization, M.E.; supervision, H.-J.Z.; project administration, H.-J.Z.; funding acquisition, H.-J.Z. All authors have read and agreed to the published version of the manuscript.
Funding
This work was funded in part by The Knowledge Foundation, Sweden, grant number 20170056, ViaTecH project (https://a.bth.se/viatech-synergy/, accessed on 31 March 2021).
Institutional Review Board Statement
The study was conducted in accordance with good ethical practice as stated by Swedish law and the Declaration of Helsinki. An application for changes in the current Ethical Approval for “Subjective Quality assessment of 360 degree stimuli” by the Regional Ethics Review Board in Lund, Sweden (Dnr. 2018/863) was not sought as the pilot study was assessed to comply in all relevant aspects with the current approval and did not mean a significant change in the method of study nor the safety of the research subjects or the risk-benefit assessment made during the previous application.
Informed Consent Statement
Informed consent was obtained from all subjects involved in the study.
Data Availability Statement
The data presented in this study are available on request from the corresponding author.
Acknowledgments
We thank all volunteers who generously shared their time to participate in the subjective tests. We thank Tobii Pro for their support and providing the HMD with integrated eye-tracker.
Conflicts of Interest
The authors declare no conflict of interest.
Abbreviations
The following abbreviations are used in this manuscript:
| ACR | Absolute category rating |
| ACR-HR | Absolute category rating with hidden reference |
| CRF | Constant rate factor |
| DSIS | Double stimulus impairment scale |
| EDA | Electrodermal activity |
| ER-SCR | Event-related skin conductance response |
| GSR | Galvanic skin response |
| HMD | Head-mounted display |
| M-ACR | Modified ACR |
| MSE | Mean square error |
| MOS | Mean opinion score |
| OR | Optimal resolution |
| PC | Pair comparison |
| QoE | Quality of experience |
| QP | Quantization parameter |
| SAMPVIQ | Subjective assessment of multimedia panoramic video quality |
| SAMVIQ | Subjective assessment of multimedia video quality |
| SCL | Skin conductance level |
| SCR | Skin conductance response |
| SD | Standard deviation |
| SE | Seated |
| SOS | Standard deviation of opinion scores |
| SSQ | Simulator sickness questionnaire |
| ST | Standing |
| TS | Total score |
Appendix A. Mean Opinion Scores for the Four 360° Video Scenes
In this appendix, the MOS for the 360° reference and test videos for the different resolution-QP pairs are shown for each of the four 360° video scenes, i.e., “Alcatraz”, “Blooming”, “Formation”, and “Panda”. Specifically, Figure A1 shows MOS versus quantization parameter for different resolutions and Figure A2 depicts MOS versus resolution for different quantization parameters. In addition to the average MOS across these scenes for given resolution-QP pairs in Section 3.2, the MOS progression obtained for each 360° video scene reveals the variability of MOS subject to the specific content.
Figure A1.
Mean opinion score versus quantization parameter for different resolutions (a–h).

Figure A2.
Mean opinion score versus resolution for different quantization parameters (a–h).

Appendix B. Standard Deviation of the MOS for the Four 360° Video Scenes
In this appendix, the SD progressions over MOS values are provided for each of the four 360° video scenes, i.e., “Alcatraz”, “Blooming”, “Formation”, and “Panda”. Figure A3 shows the respective results along with the fit to the SOS function (5) for each scene indicating the dependence of the SD on the actual scene content compared to the SD shown in Section 3.2 for average MOS across the four scenes. Overall, the findings reported in Section 3.2 apply also to the four scenes for the entire MOS range from 1 (bad) to 5 (excellent). The findings reported in Section 3.2 apply strongly to scene “Alcatraz”, are less pronounced for scenes “Blooming” and “Formation”, and are also consistent for “Panda” but not as developed as for the other scenes. As such, future research may specifically evaluate the impact of the actual scene content on the opinion scores given to the quality of the respective 360° video stimuli and the confidence of the participants in their opinion scores for standing and seated viewing.
Figure A3.
Standard deviation versus MOS of the four 360° video scenes along with the SOS function fitted to the data points for standing and seated viewing (c,d).
Figure A3.
Standard deviation versus MOS of the four 360° video scenes along with the SOS function fitted to the data points for standing and seated viewing (c,d).

Appendix C. Heat Maps of Yaw and Pitch Angles for Each Participant
Figure A4 shows that the 360° video scene exploration is large in standing viewing for each participant. However, the degree of increased scene exploration in standing viewing varies among the participants from relatively similar exploration as for seated viewing for Participant 4 to a significant increase of scene exploration for Participant 5. As mentioned in Section 3.3, the difference in scene exploration among participants for standing viewing may be caused by the experimental setup using a cable to connect the HTC Vive Pro HMD with the computer. As such, the cable may stop some of the participants for standing viewing from fully exploring the scenes. In contrast, for seated viewing, the heat maps are quite similar for all participants indicating a focused view to the center region of the scenes.
Figure A4.
Heat mapsof yaw and pitch angles for each participant (a–j).

References
- Huawei iLab. VR Big Data Report; Huawei Technologies Co., Ltd.: Shenzhen, China, 2017. [Google Scholar]
- Huawei iLab. Cloud VR Network Solution White Paper; Huawei Technologies Co., Ltd.: Shenzhen, China, 2018. [Google Scholar]
- Yrjölä, S.; Ahokangas, P.; Matinmikko-Blue, M. White Paper on Business of 6G; 6G Research Visions, No. 3; University of Oulu: Oulu, Finland, 2020. [Google Scholar]
- 3rd Generation Partnership Project. Extended Reality in 5G (Release 16). 3GPP TR 26.928 V0.4.0. Available online: https://www.etsi.org/deliver/etsi_tr/126900_126999/126928/16.00.00_60/tr_126928v160000p.pdf (accessed on 31 March 2021).
- Recommendation ITU-T P.910. Subjective Video Quality Assessment Methods for Multimedia Applications; International Telecommunication Union—Telecommunication Standardization Sector: Geneva, Switzerland, 2008. [Google Scholar]
- Recommendation ITU-T P.915. Subjective Assessment Methods for 3D Video Quality; International Telecommunication Union—Telecommunication Standardization Sector: Geneva, Switzerland, 2016. [Google Scholar]
- Recommendation ITU-R BT.500-13. Methodology for the Subjective Assessment of the Quality of Television Pictures; International Telecommunication Union—Radiocommunication Standardization Sector: Geneva, Switzerland, 2012. [Google Scholar]
- Recommendation ITU-T BT.1788. Methodology for the Subjective Assessment of Video Quality in Multimedia Applications; International Telecommunication Union—Telecommunication Standardization Sector: Geneva, Switzerland, 2007. [Google Scholar]
- Zhang, B.; Zhao, J.; Yang, S.; Zhang, Y.; Wang, J.; Fei, Z. Subjective and Objective Quality Assessment of Panoramic Videos in Virtual Reality Environment. In Proceedings of the IEEE International Conference on Multimedia Expo Workshops, Hong Kong, China, 10–14 July 2017; pp. 163–168. [Google Scholar]
- Tran, H.T.T.; Ngoc, N.P.; Pham, C.T.; Jung, Y.J. A Subjective Study on QoE of 360 Video for VR Communication. In Proceedings of the IEEE International Workshop on Multimedia Signal Processing, Luton, UK, 16–18 October 2017; pp. 1–6. [Google Scholar]
- Singla, A.; Fremerey, S.; Robitza, W.; Raake, A. Measuring and Comparing QoE and Simulator Sickness of Omnidirectional Videos in Different Head Mounted Displays. In Proceedings of the IEEE International Conference on Quality of Multimedia Experience, Erfurt, Germany, 31 May–2 June 2017; pp. 1–6. [Google Scholar]
- Xu, M.; Li, C.; Liu, Y.; Deng, X.; Lu, J. A Subjective Visual Quality Assessment Method of Panoramic Videos. In Proceedings of the IEEE International Conference on Multimedia and Expo, Hong Kong, China, 10–14 July 2017; pp. 517–522. [Google Scholar]
- Duan, H.; Zhai, G.; Yang, X.; Li, D.; Zhu, W. IVQAD 2017: An Immersive Video Quality Assessment Database. In Proceedings of the International Conference on Systems, Signals and Image Processing, Poznan, Poland, 22–24 May 2017; pp. 1–5. [Google Scholar]
- Lopes, F.; Ascenso, J.; Rodrigues, A.; Queluz, M.P. Subjective and Objective Quality Assessment of Omnidirectional Video. In Proceedings of the SPIE Optical Engineering and Applications, San Diego, CA, USA, 17 September 2018; pp. 1–17. [Google Scholar]
- Fremerey, S.; Singla, A.; Meseberg, K.; Raake, A. AVTrack360: An Open Dataset and Software Recoding People’s Head Rotations Watching 360° Videos on an HMD. In Proceedings of the Proceedings of the ACM Multimedia Systems Conference, Amsterdam, The Netherlands, 12–15 June 2018; pp. 403–408. [Google Scholar]
- Yao, S.H.; Fan, C.L.; Hsu, C.H. Towards Quality-of-Experience Models for Watching 360° Videos in Head-Mounted Virtual Reality. In Proceedings of the International Conference on Quality of Multimedia Experience, Berlin, Germany, 5–7 June 2019; pp. 1–3. [Google Scholar]
- T. T. Tran, H.; Ngoc, N.P.; Pham, C.T.; Jung, Y.J.; Thang, T.C. A Subjective Study on User Perception Aspects in Virtual Reality. Appl. Sci. 2019, 9, 3384. [Google Scholar] [CrossRef] [Green Version]
- Zhang, Y.; Wang, Y.; Liu, F.; Liu, Z.; Li, Y.; Yang, D.; Chen, Z. Subjective Panoramic Video Quality Assessment Database for Coding Applications. IEEE Trans. Broadcast. 2018, 64, 42–51. [Google Scholar] [CrossRef]
- Alexiou, E.; Upenik, E.; Ebrahimi, T. Towards Subjective Quality Assessment of Point Cloud Imaging in Augmented Reality. In Proceedings of the IEEE International Workshop on Multimedia Signal Processing, Luton, UK, 16–18 October 2017; pp. 1–6. [Google Scholar]
- Singla, A.; Robitza, W.; Raake, A. Comparison of Subjective Quality Evaluation Methods for Omnidirectional Videos with DSIS and Modified ACR. In Proceedings of the Human Vision and Electronic Imaging, Burlingame, CA, USA, 28 January–2 February 2018; pp. 1–6. [Google Scholar]
- Zhang, B.; Yan, Z.; Wang, J.; Luo, Y.; Yang, S.; Fei, Z. An Audio-Visual Quality Assessment Methodology in Virtual Reality Environment. In Proceedings of the IEEE International Conference on Multimedia and Expo Workshops, San Diego, CA, USA, 23–27 July 2018; pp. 1–6. [Google Scholar]
- Singla, A.; Fremerey, S.; Robitza, W.; Lebreton, P.; Raake, A. Comparison of Subjective Quality Evaluation for HEVC Encoded Omnidirectional Videos at Different Bit-rates for UHD and FHD Resolution. In Proceedings of the Thematic Workshops of ACM Multimedia, Mountain View, CA, USA, 23–27 October 2017; pp. 511–519. [Google Scholar]
- Recommendation ITU-T P.360-VR. Subjective Test Methodologies for 360 Degree Video on HMD; International Telecommunication Union—Telecommunication Standardization Sector: Geneva, Switzerland, 2020. [Google Scholar]
- Pérez, P.; Escobar, J. MIRO360: A Tool for Subjective Assessment of 360 Degree Video for ITU-T P.360-VR. In Proceedings of the International Conference on Quality of Multimedia Experience, Berlin, Germany, 5–7 June 2019; pp. 1–3. [Google Scholar]
- Hong, Y.; MacQuarrie, A.; Steed, A. The Effect of Chair Type on Users’ Viewing Experience for 360-degree Video. In Proceedings of the ACM Symposium on Virtual Reality Software and Technology, Tokyo, Japan, 28 November–1 December 2018; pp. 1–11. [Google Scholar]
- MacQuarrie, A.; Steed, A. Cinematic Virtual Reality: Evaluating the Effect of Display Type on the Viewing Experience for Panoramic Video. In Proceedings of the IEEE Virtual Reality, Los Angeles, CA, USA, 18–22 March 2017; pp. 45–54. [Google Scholar]
- Zielasko, D.; Weyers, B.; Bellgardt, M.; Pick, S.; Meisner, A.; Verjahn, T.; Kuhlen, T.W. Remain Seated: Towards Fully-Immersive Desktop VR. In Proceedings of the IEEE Workshop on Everyday Virtual Reality, Los Angeles, CA, USA, 19 March 2017; pp. 1–6. [Google Scholar]
- Zielasko, D.; Weyers, B.; Kuhlen, T.W. A Non-Stationary Office Desk Substitution for Desk-Based and HMD-Projected Virtual Reality. In Proceedings of the IEEE Conference on Virtual Reality and 3D User Interfaces, Osaka, Japan, 23–27 March 2019; pp. 1884–1889. [Google Scholar]
- Jeong, H.; Singh, A.; Kim, M.; Johnson, A. Using Augmented Reality to Assist Seated Office Workers’ Data Entry Tasks. In Proceedings of the IEEE Conference on Virtual Reality and 3D User Interfaces Abstracts and Workshops, Atlanta, GA, USA, 22–26 March 2020; pp. 293–294. [Google Scholar]
- Nguyen-Vo, T.; Riecke, B.E.; Stuerzlinger, W.; Pham, D.M.; Kruijff, E. NaviBoard and NaviChair: Limited Translation Combined with Full Rotation for Efficient Virtual Locomotion. IEEE Trans. Vis. Comput. Graph. 2019. [Google Scholar] [CrossRef]
- Rieke, B.E.; Feuereissen, D. To Move or Not to Move: Can Active Control and User-Driven Motion Cueing Enhance Self-Motion Perception (“Vection”) in Virtual Reality? In Proceedings of the ACM Symposium on Applied Perception, Los Angeles, CA, USA, 3–4 August 2012; pp. 17–24. [Google Scholar]
- Kruijff, E.; Rieke, B.E.; Trepkowski, C.; Kitson, A. Upper Body Leaning Can Affect Forward Self-Motion Perception in Virtual Environments. In Proceedings of the ACM Symposium on Spatial User Interaction, Los Angeles, CA, USA, 8–9 August 2015; pp. 103–112. [Google Scholar]
- Kitson, A.; Hashemian, A.M.; Stepanova, E.R.; Kruijff, E.; Riecke, B.E. Comparing Leaning-Based Motion Cueing Interfaces for Virtual Reality Locomotion. In Proceedings of the IEEE Symposium on 3D User Interfaces, Los Angeles, CA, USA, 18–19 March 2017; pp. 73–82. [Google Scholar]
- Zhang, Y.; Riecke, B.E.; Schiphorst, T.; Neustaedter, C. Perch to Fly: Embodied Virtual Reality Flying Locomotion with a Flexible Perching Stance. In Proceedings of the ACM Designing Interactive Systems Conference, San Diego, CA, USA, 23–28 June 2019; pp. 253–264. [Google Scholar]
- Merhi, O.; Faugloire, E.; Flanagan, M.; Stoffregen, T.A. Motion Sickness, Console Video Games, and Head-mounted Displays. Hum. Factors 2007, 49, 920–934. [Google Scholar] [CrossRef] [PubMed]
- Hu, Y.; Elwardy, M.; Zepernick, H.J. On the Effect of Standing and Seated Viewing of 360° Videos on Subjective Quality Assessment. In Proceedings of the IEEE Conference on Virtual Reality and 3D User Interfaces Abstracts and Workshops, Atlanta, GA, USA, 22–26 March 2020; pp. 285–286. [Google Scholar]
- Feil-Seifer, D.; Haring, K.S.; Rossi, S.; Wagner, A.R.; Williams, T. Where to next? The Impact of COVID-19 on Human-Robot Interaction Research. ACM Trans. Hum. Robot Interact. 2010, 10. [Google Scholar] [CrossRef]
- Nåbo, A.; Hadi, M.; Johansson, E.; Krupenia, S.; Larsson, A.; Muthumani, A.; Söderman, M. SAFER Pre-Studies Final Report FP08; Task Force: Hygiene Procedures in Test with Research Persons; SAFER Vehicle and Traffic Safety Centre: Gothenburg, Sweden, 2020. [Google Scholar]
- Kennedy, R.S.; Lane, N.E.; Berbaum, K.S.; Lilienthal, M.G. Simulator Sickness Questionnaire: An Enhanced Method for Quantifying Simulator Sickness. Int. J. Aviat. Psychol. 1993, 3, 203–220. [Google Scholar] [CrossRef]
- Elwardy, M.; Zepernick, H.J.; Sundstedt, V.; Hu, Y. Impact of Participants’ Experiences with Immersive Multimedia on 360° Video Quality Assessment. In Proceedings of the IEEE International Conference on Signal Processing and Communication Systems, Gold Coast, Australia, 16–18 December 2019; pp. 40–49. [Google Scholar]
- Beihang University, School of Electronic and Information Engineering, Beijing, China. VQA-ODV. 2017. Available online: https://github.com/Archer-Tatsu/VQA-ODV (accessed on 12 September 2020).
- Li, C.; Xu, M.; Wang, Z. Bridge the Gap Between VQA and Human Behavior on Omnidirectional Video: A Large-Scale Dataset and a Deep Learning Model. In Proceedings of the ACM International Conference on Multimedia, Seoul, Korea, 22–26 October 2018; pp. 932–940. [Google Scholar]
- FFmpeg. H.264 Video Encoding Guide. 2018. Available online: https://trac.ffmpeg.org/wiki/Encode/H.264#crf (accessed on 12 September 2020).
- FFmpeg. FFmpeg and H.265 Encoding Guide. 2018. Available online: https://trac.ffmpeg.org/wiki/Encode/H.265 (accessed on 12 September 2020).
- Hoßfeld, T.; Schatz, R.; Egger, S. SOS: The MOS is Not Enough! In Proceedings of the International Workshop on Quality of Multimedia Experience, Mechelen, Belgium, 7–9 September 2011; pp. 131–136. [Google Scholar]
- Hossfeld, T.; Heegaard, P.E.; Varela, M.; Möller, S. QoE Beyond the MOS: An In-depth Look at QoE via Better Metrics and Their Relation to MOS. Qual. User Exp. 2016, 1, 1–23. [Google Scholar] [CrossRef] [Green Version]
- Engelke, U. Modelling Perceptual Quality and Visual Saliency for Image and Video Communications. Ph.D. Thesis, Blekinge Institute of Technology, Karlskrona, Sweden, 2010. [Google Scholar]
- De Simone, F.; Naccari, M.; Tagliasachi, M.; Dufaux, F.; Tubaro, S.; Ebrahimi, T. Subjective Assessment of H.264/AVC Video Sequences Transmitted Over a Noisy Channel. In Proceedings of the International Workshop on Quality of Multimedia Experience, San Diego, CA, USA, 29–31 July 2009; pp. 204–209. [Google Scholar]
- Beatty, J. Task-evoked Pupillary Responses, Processing Load, and the Structure of Processing Resources. Psychol. Bull. 1982, 91, 276–292. [Google Scholar] [CrossRef] [PubMed]
- Porter, G.; Trosciangko, T.; Gilchrist, I.D. Effort During Visual Search and Counting: Insights from Pupillometry. Q. J. Exp. Psychol. 2007, 60, 211–229. [Google Scholar] [CrossRef] [PubMed]
- Hess, E.H.; Polt, J.M. Pupil Size as Related to Interest Value of Visual Stimuli. Science 1960, 132, 349–350. [Google Scholar] [CrossRef] [PubMed]
- Wang, C.A.; Baird, T.; Huang, J.; Coutinho, J.D.; Brien, D.C.; Munoz, D.P. Arousal Effects on Pupil Size, Heart Rate, and Skin Conductance in an Emotional Face Task. Front. Neurol. 2018, 9, 1–13. [Google Scholar] [CrossRef] [PubMed]
- Walker, H.K.; Hall, W.D.; Hurst, J.W. Clinical Methods: The History, Physical, and Laboratory Examinations; Butterworths: Boston, MA, USA, 1990. [Google Scholar]
- Engelke, U.; Darcy, D.P.; Mulliken, G.H.; Bosse, S.; Martini, M.G.; Arndt, S.; Anton, J.N.; Chan, K.Y.; Ramzan, N.; Brunnström, K. Psychophysiology-Based QoE Assessment: A Survey. IEEE J. Sel. Top. Signal Process. 2017, 11, 6–21. [Google Scholar] [CrossRef] [Green Version]
- Boucsein, W. Electrodermal Activity, 2nd ed.; Springer Science & Business Media: New York, NY, USA, 2012. [Google Scholar]
- Riccio, G.E.; Stoffregen, T.A. An Ecological Theory of Motion Sickness and Postural Instability. Ecol. Psychol. 1991, 3, 195–240. [Google Scholar] [CrossRef]
Figure 1.
Setup on a participant in standing and seated viewing (a) Standing (b) Seated.

Figure 2.
Test session schedule used for standing and seated viewing of 360° videos on an HMD.

Figure 3.
Sample frames of the four scenes in equirectangular projection from sphere to plane (a) Alcatraz (b) BloomingAppleOrchards (c) FormationPace (d) PandaBaseChengdu [41,42].

Figure 4.
Box plots of rating times for each scene and average rating times over the four scenes.

Figure 5.
Average MOS versus quantization parameter for different resolutions. (a) Standing (b) Seated.
Figure 5.
Average MOS versus quantization parameter for different resolutions. (a) Standing (b) Seated.

Figure 6.
Average MOS versus resolutions for different quantization parameters. (a) Standing (b) Seated.
Figure 6.
Average MOS versus resolutions for different quantization parameters. (a) Standing (b) Seated.

Figure 7.
Standard deviation versus average MOS along with the SOS function fitted to the data points for standing and seated viewing.
Figure 7.
Standard deviation versus average MOS along with the SOS function fitted to the data points for standing and seated viewing.

Figure 8.
Heat maps of yaw and pitch angles for all participant. (a) Stnding (b) Seated.

Figure 9.
Box plots of pupil diameters for each participant and across participants.

Figure 10.
Box plots of pupil diameters and average pupil diameters across sessions for Participant 2.
Figure 10.
Box plots of pupil diameters and average pupil diameters across sessions for Participant 2.

Figure 11.
GSR progression for Participant 1 (a) Standing (b) Seated.

Figure 12.
Simulator sickness cluster scores for nausea, oculomotor, disorientation, and total score. (a) Standing (b) Seated.
Figure 12.
Simulator sickness cluster scores for nausea, oculomotor, disorientation, and total score. (a) Standing (b) Seated.


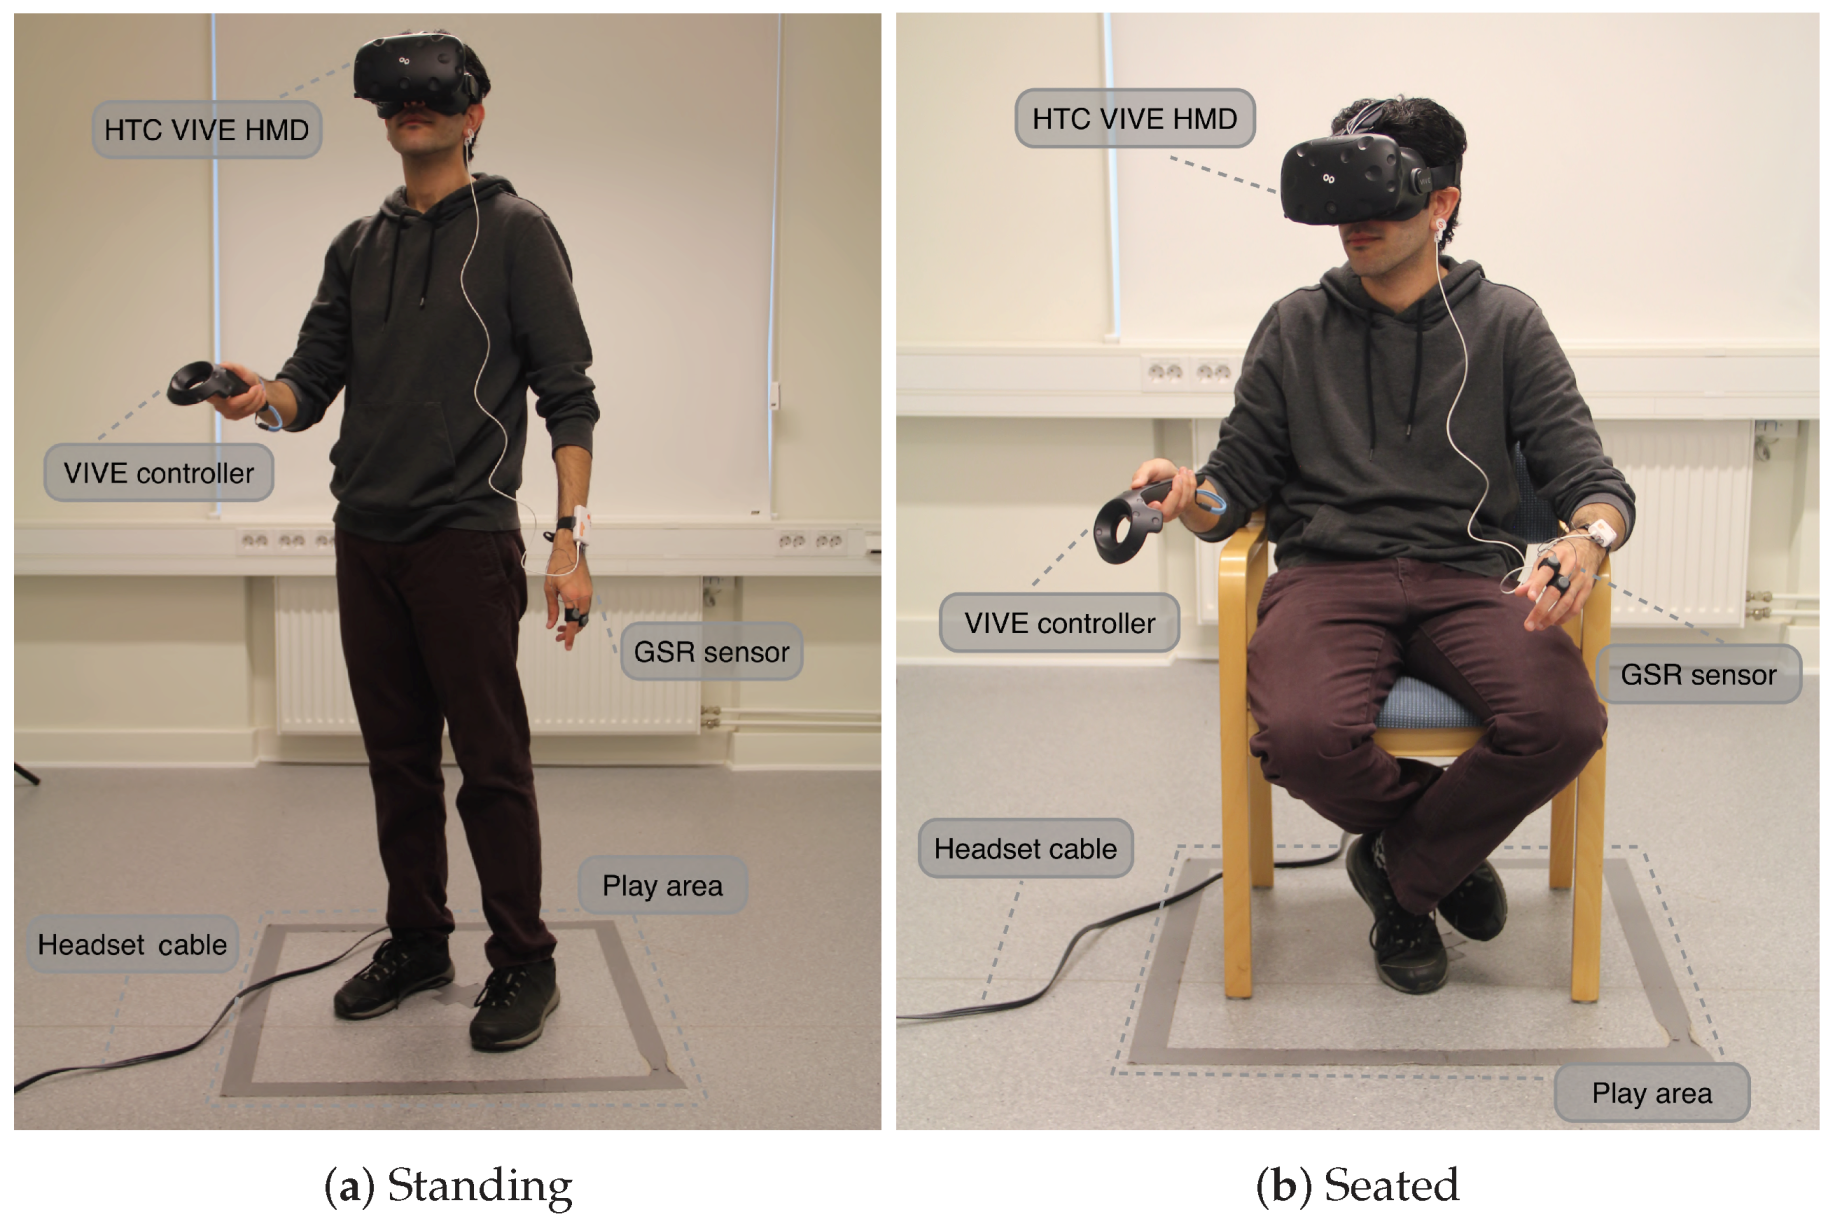
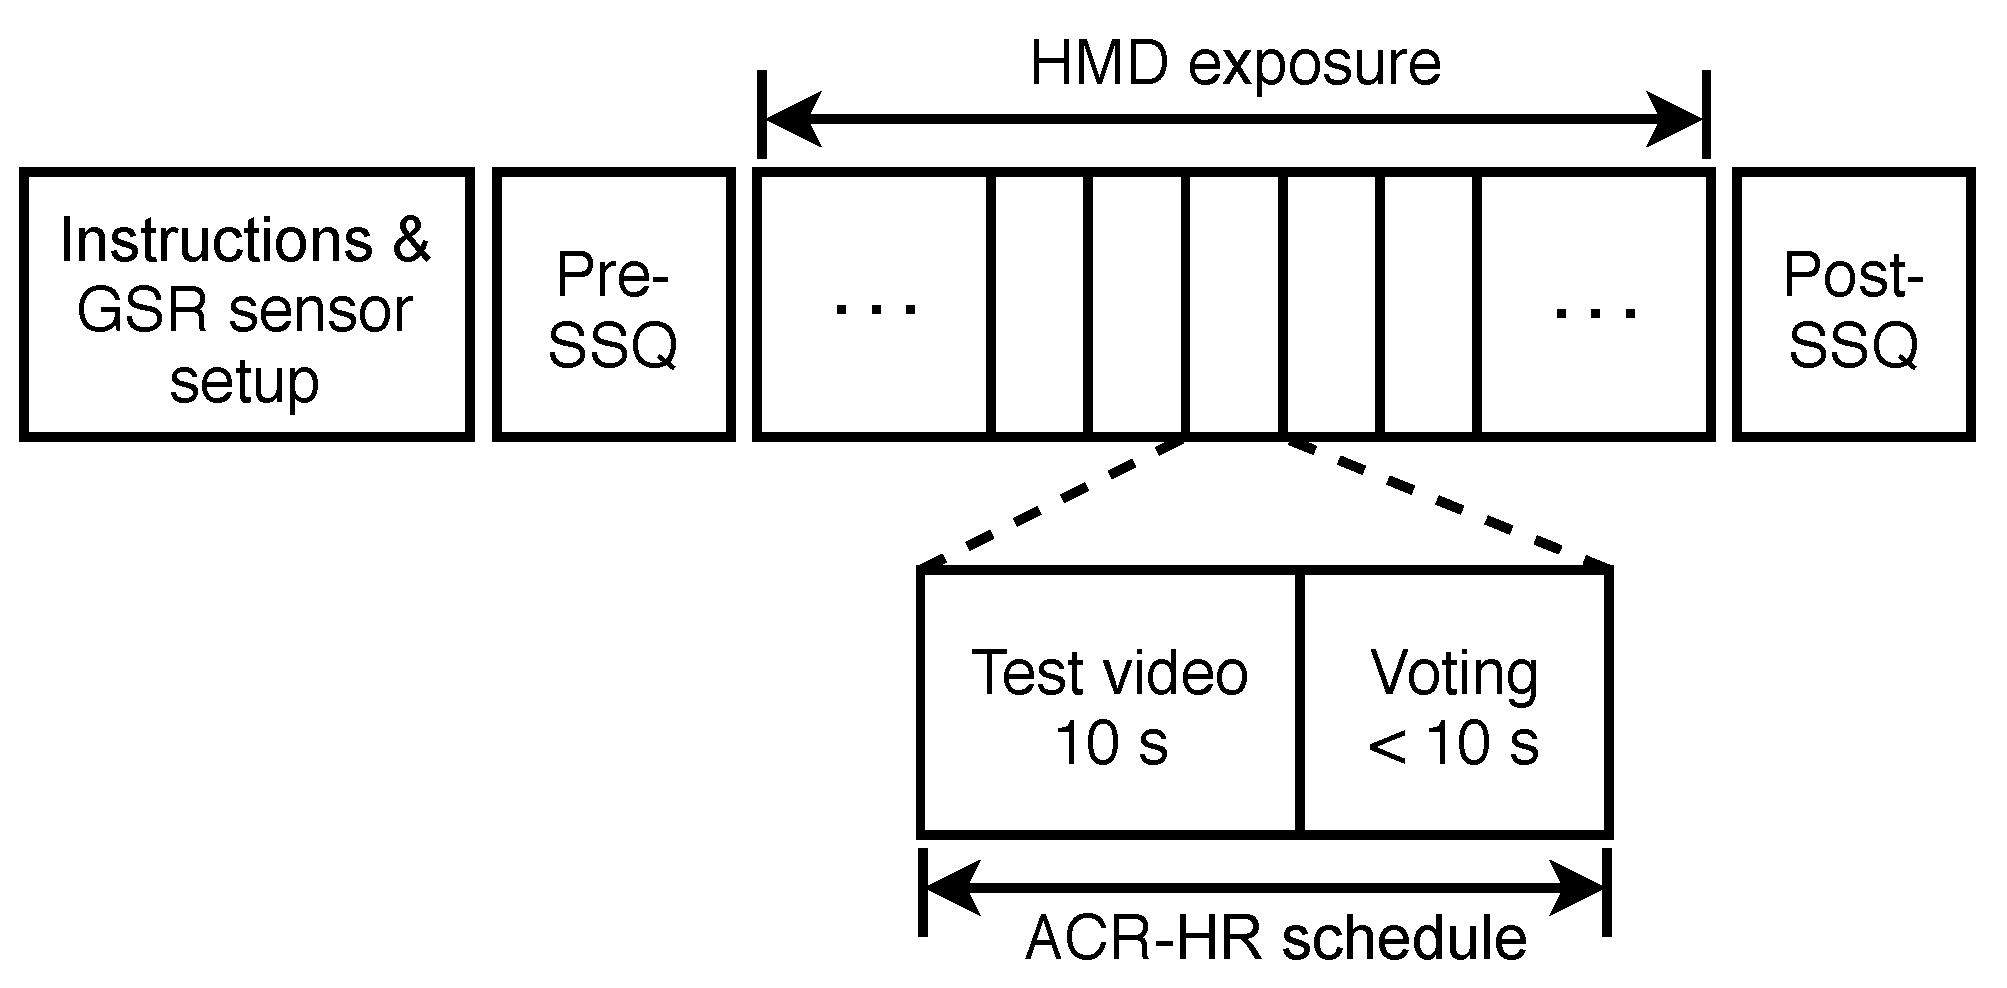
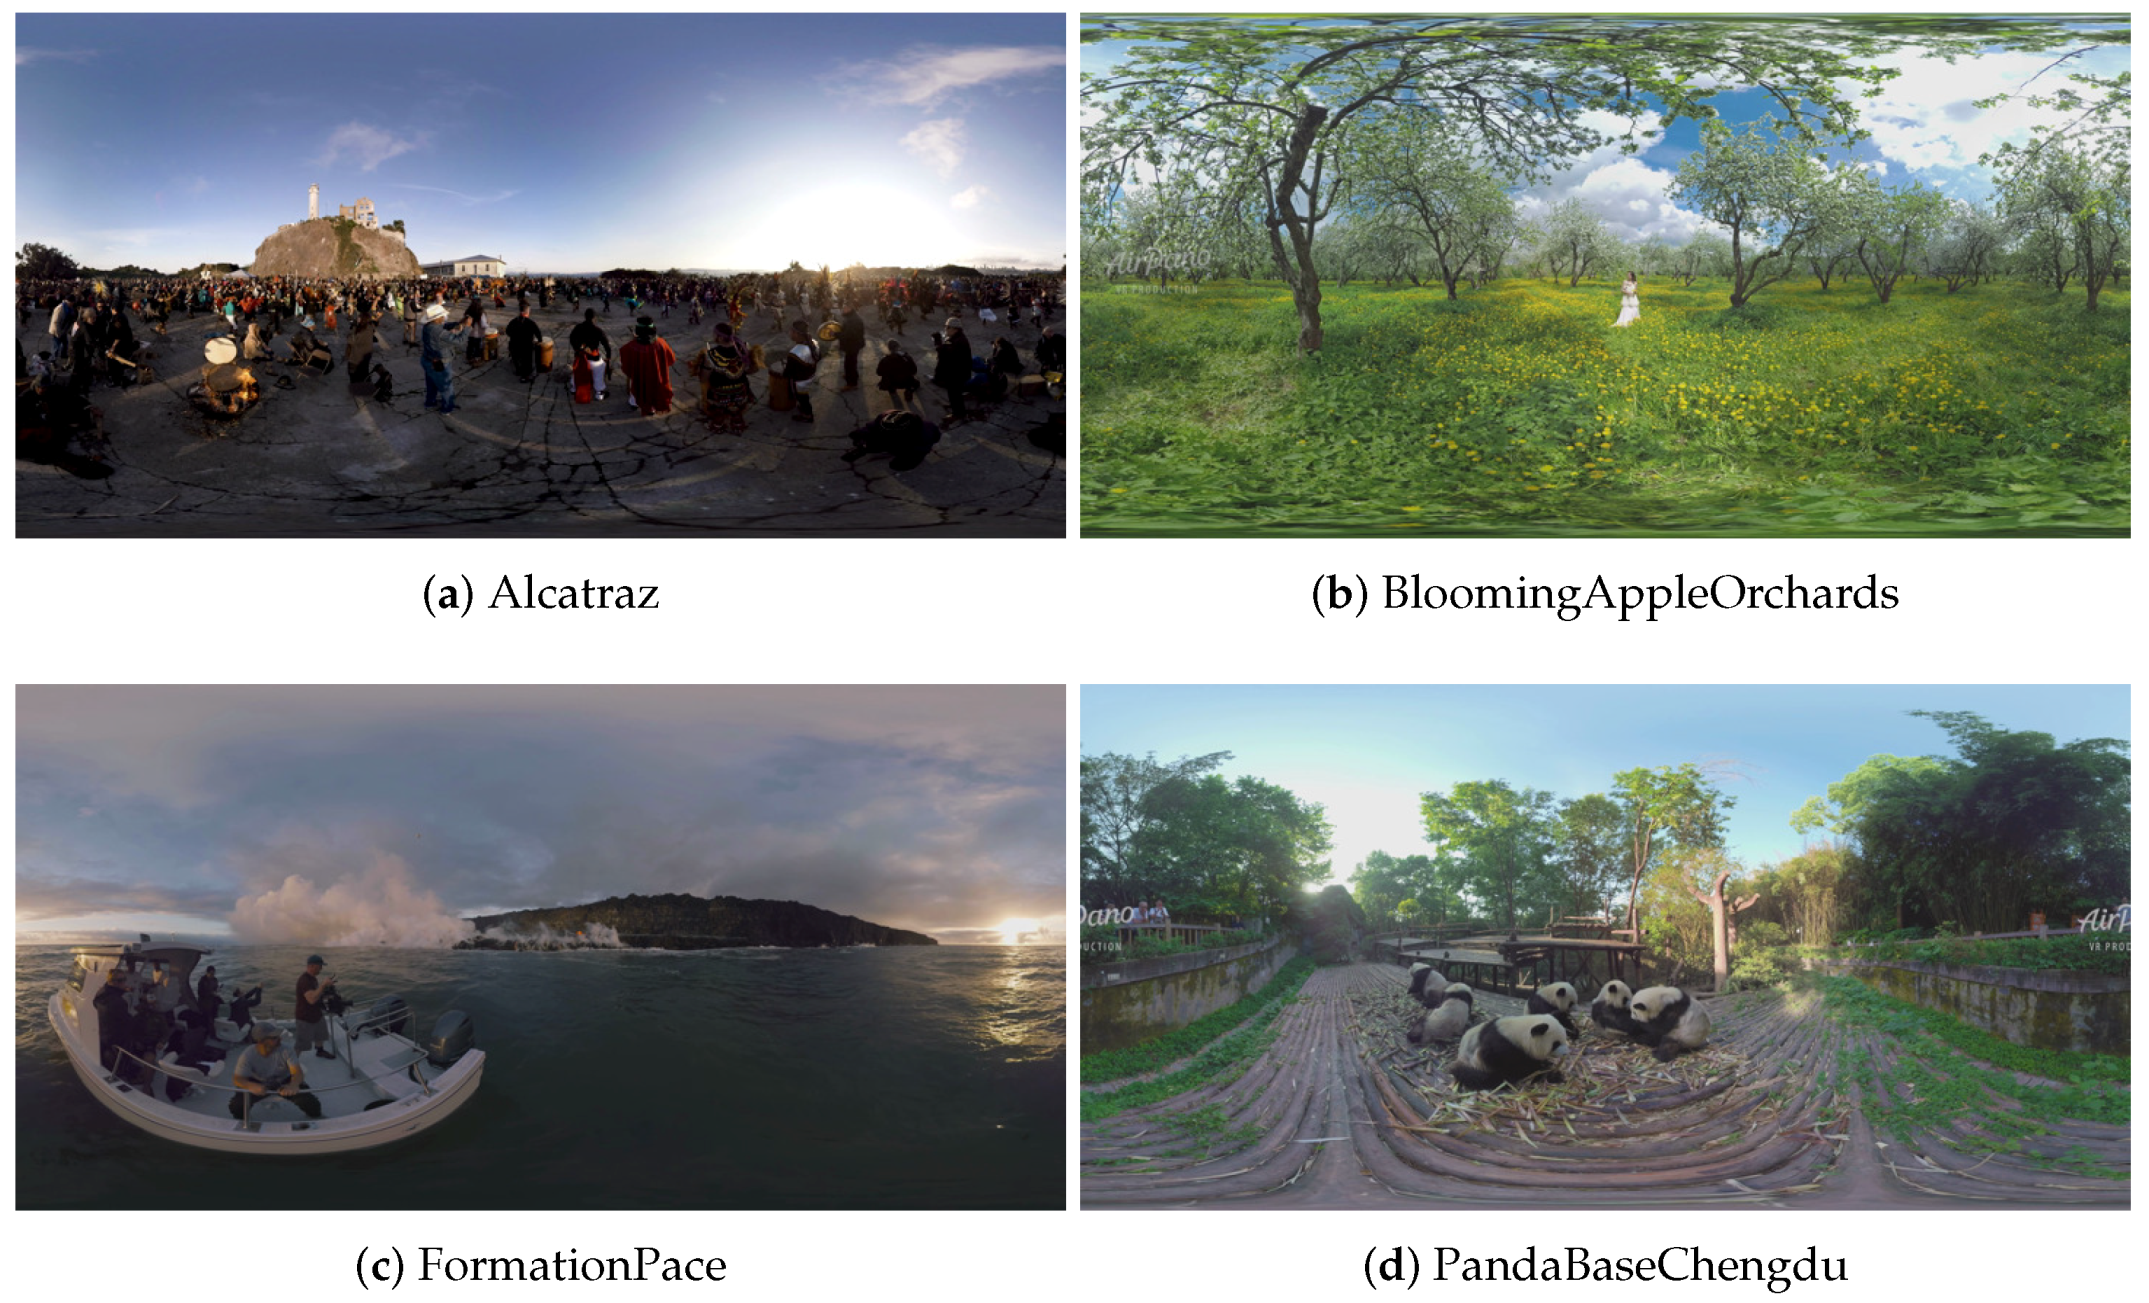
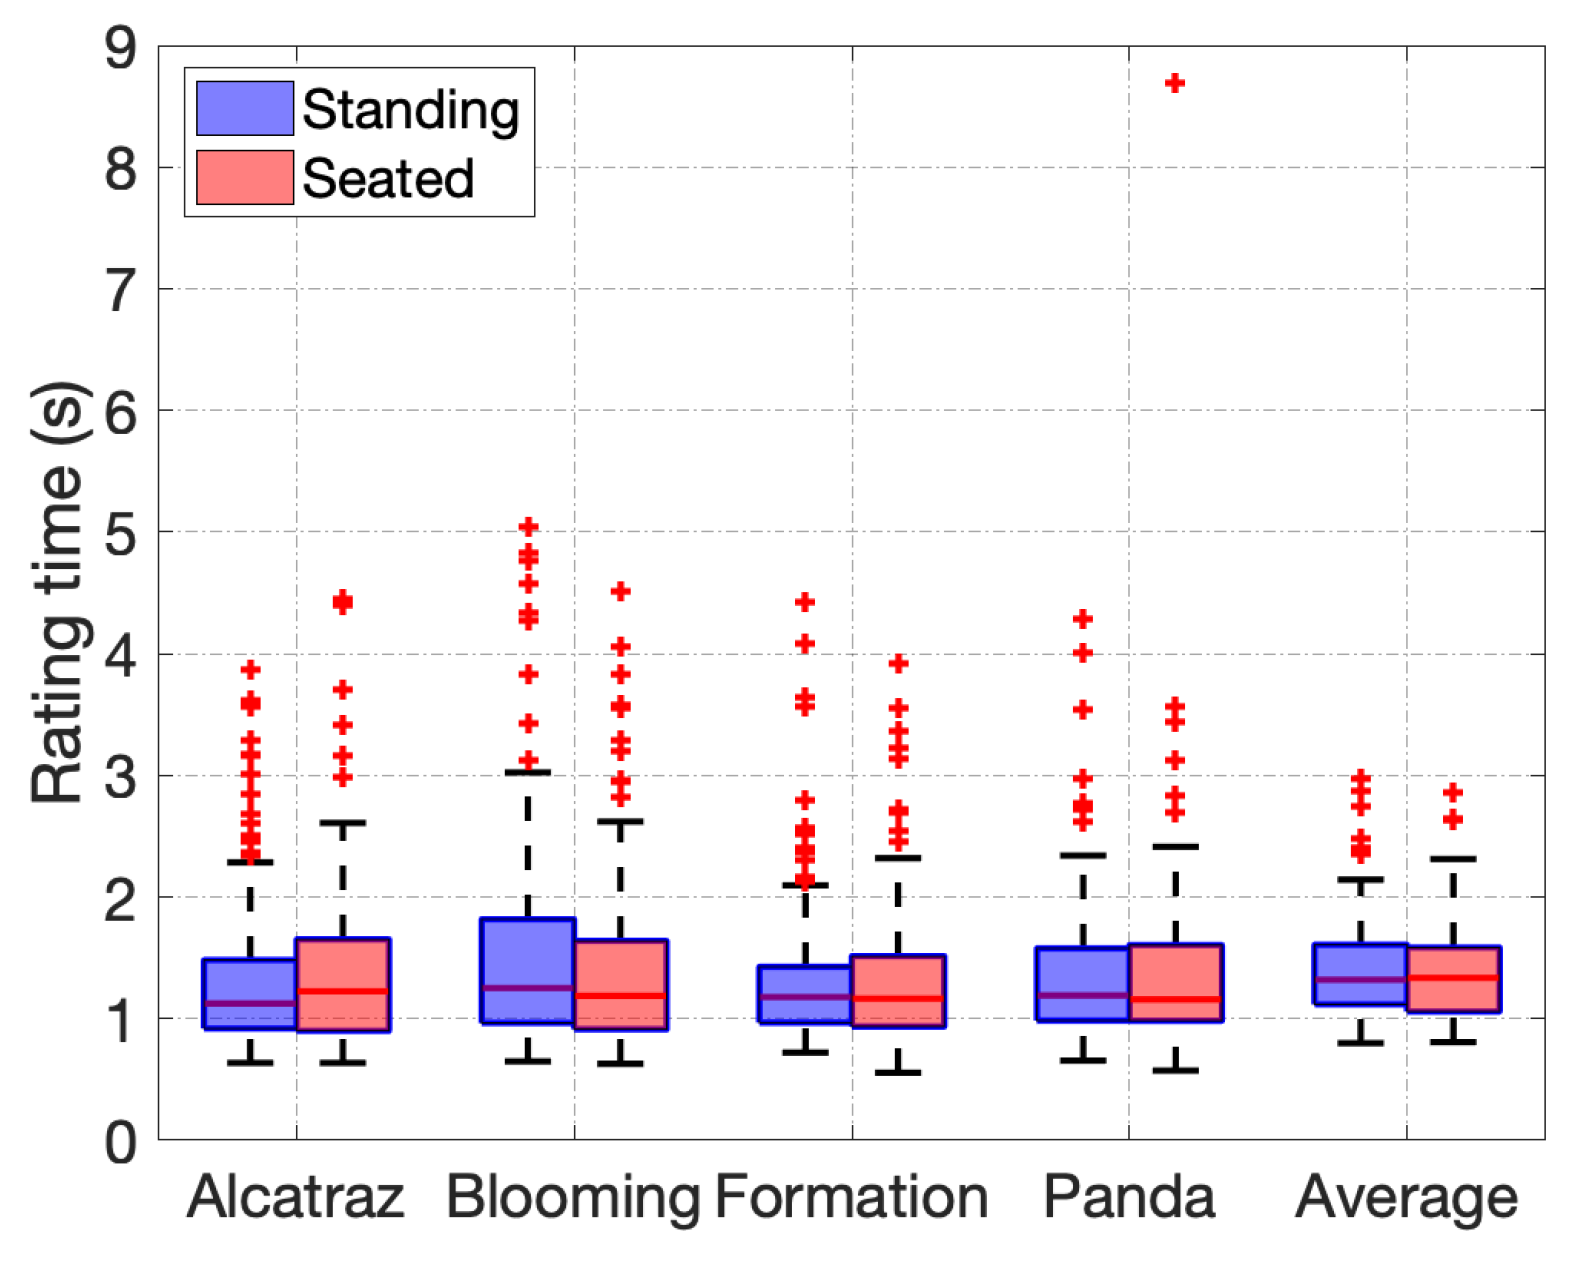
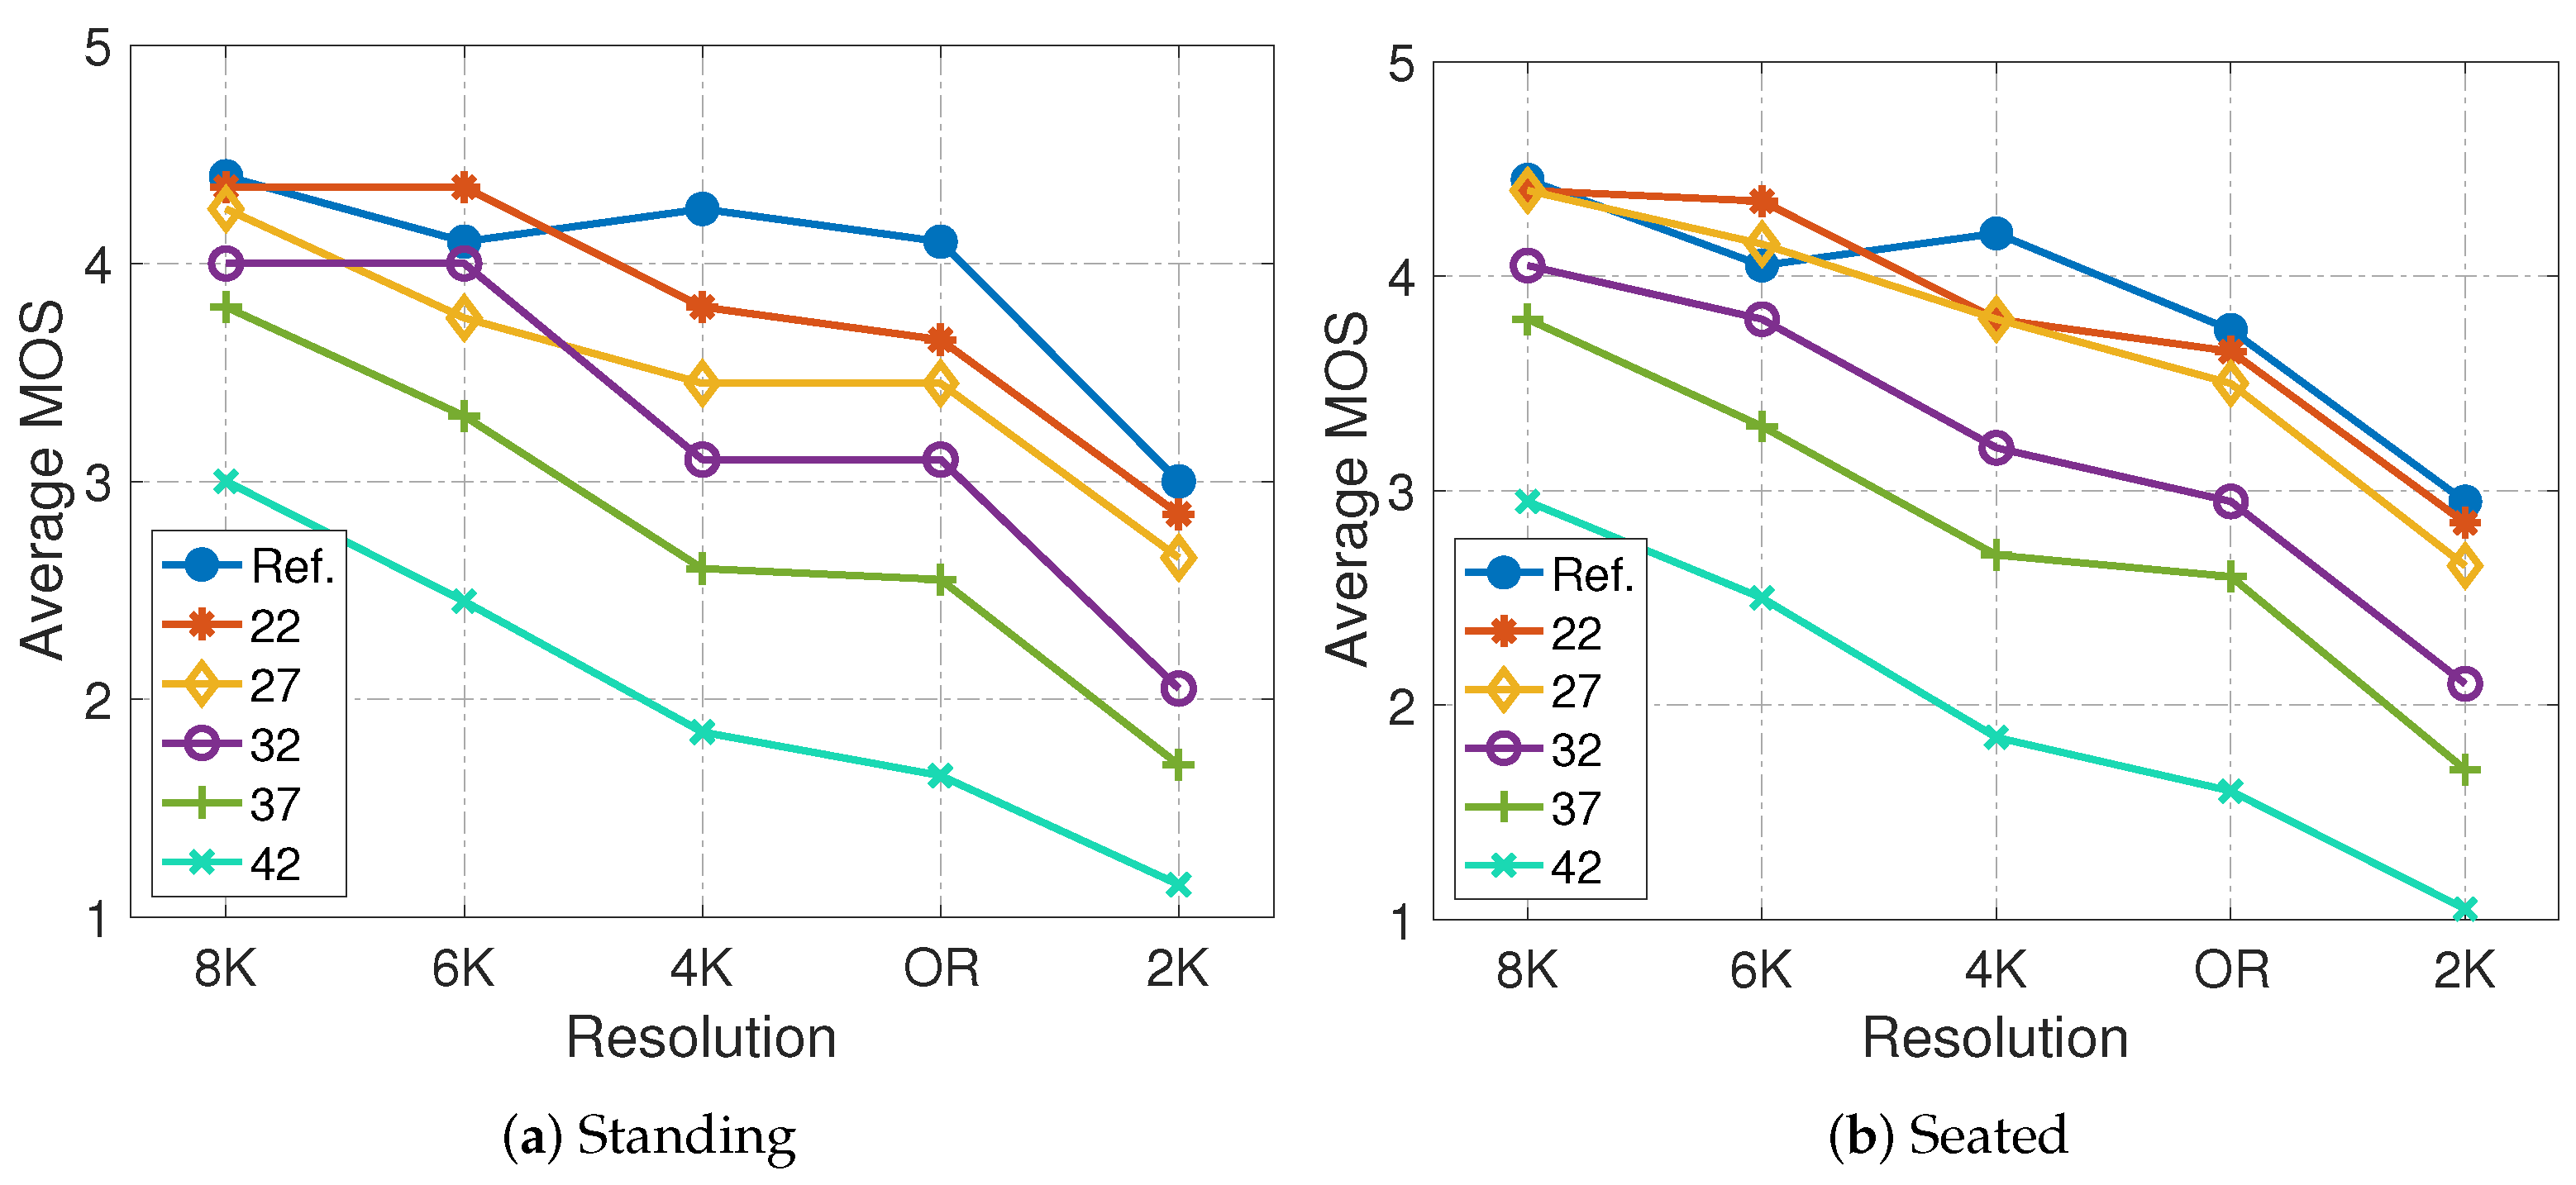
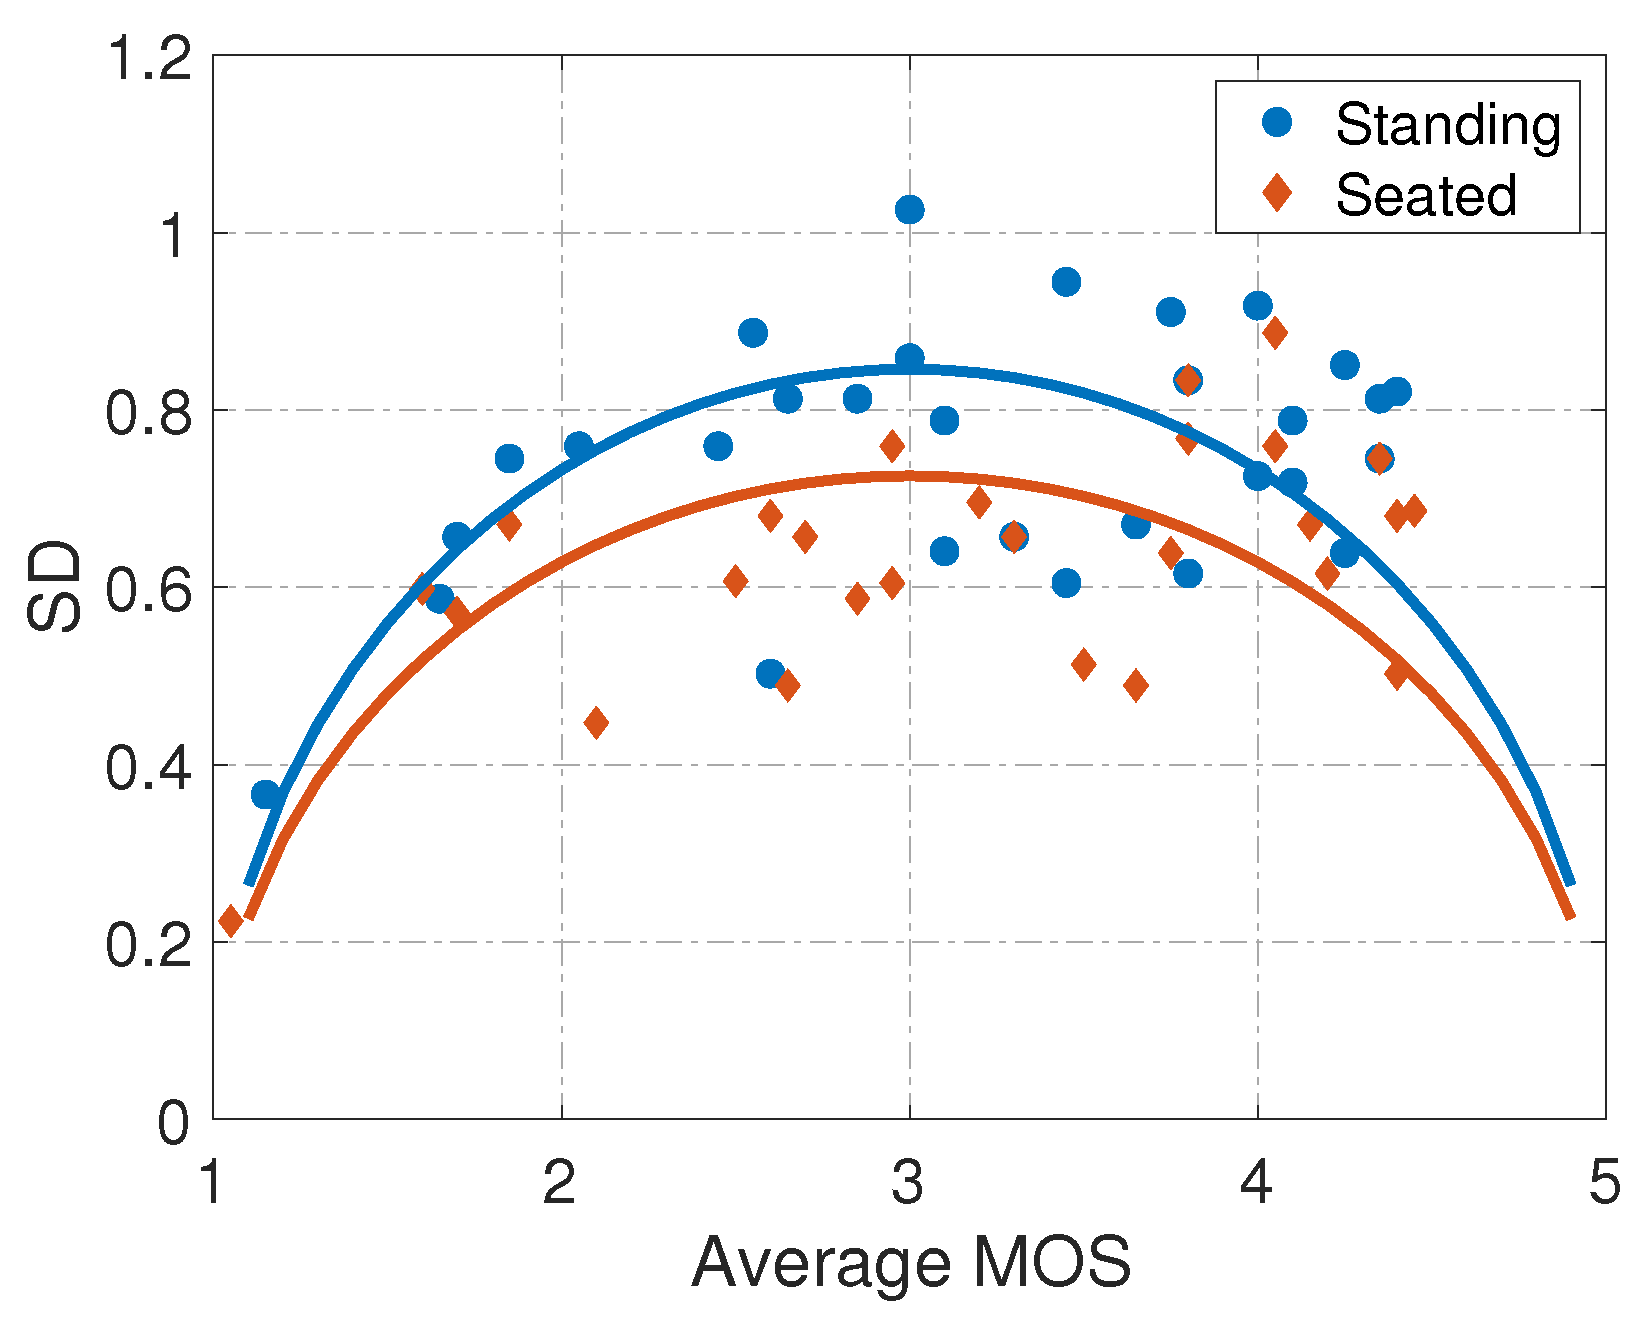
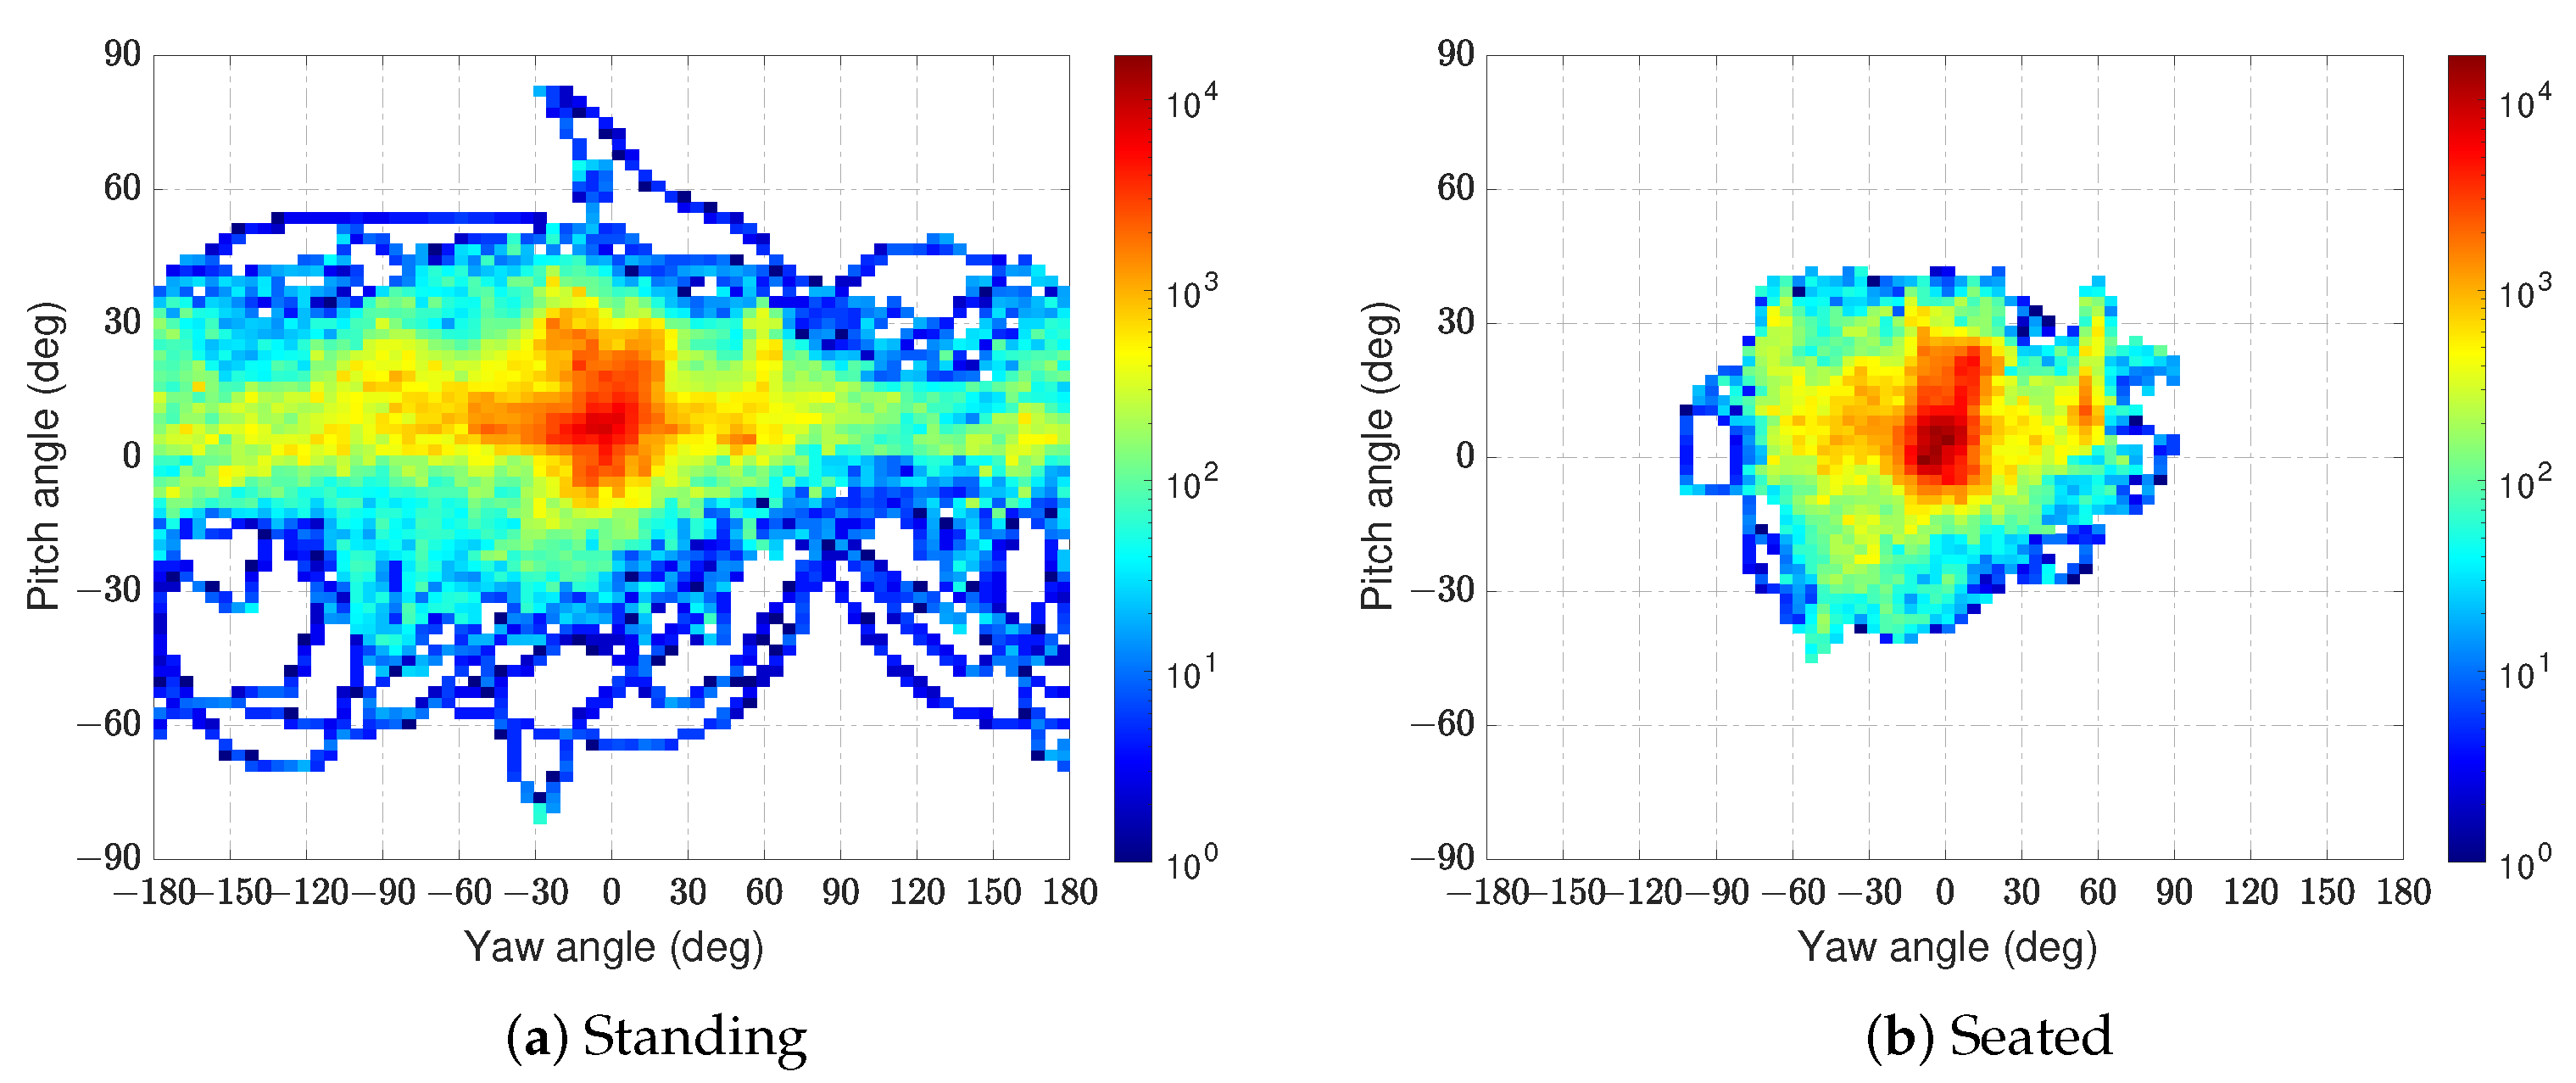
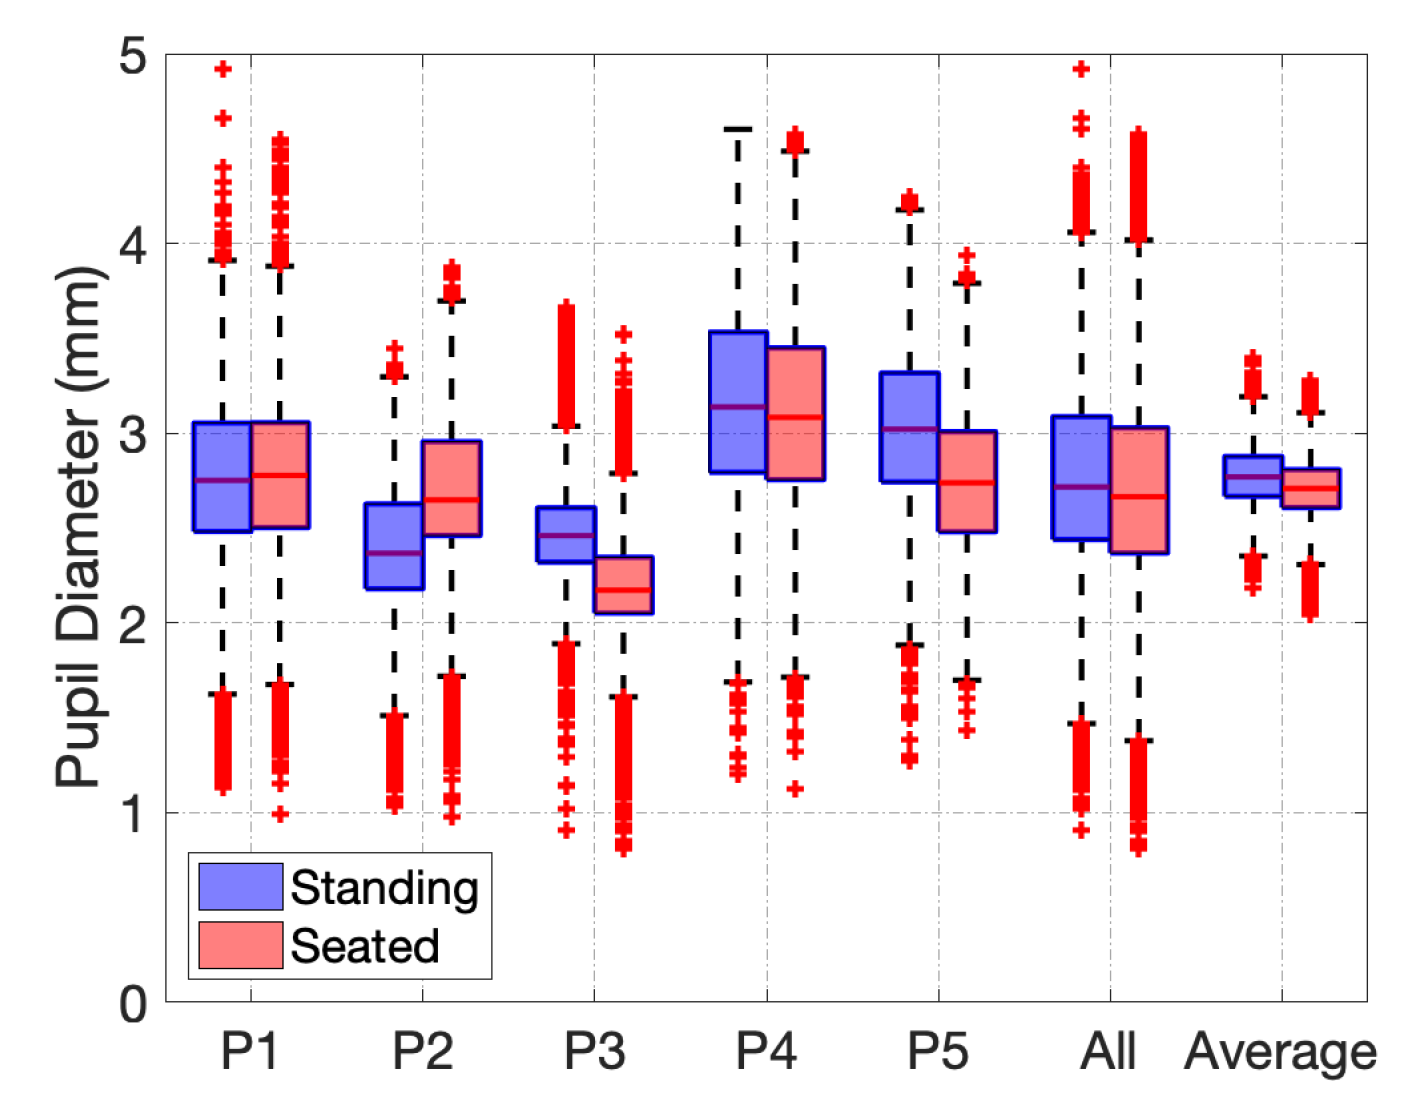
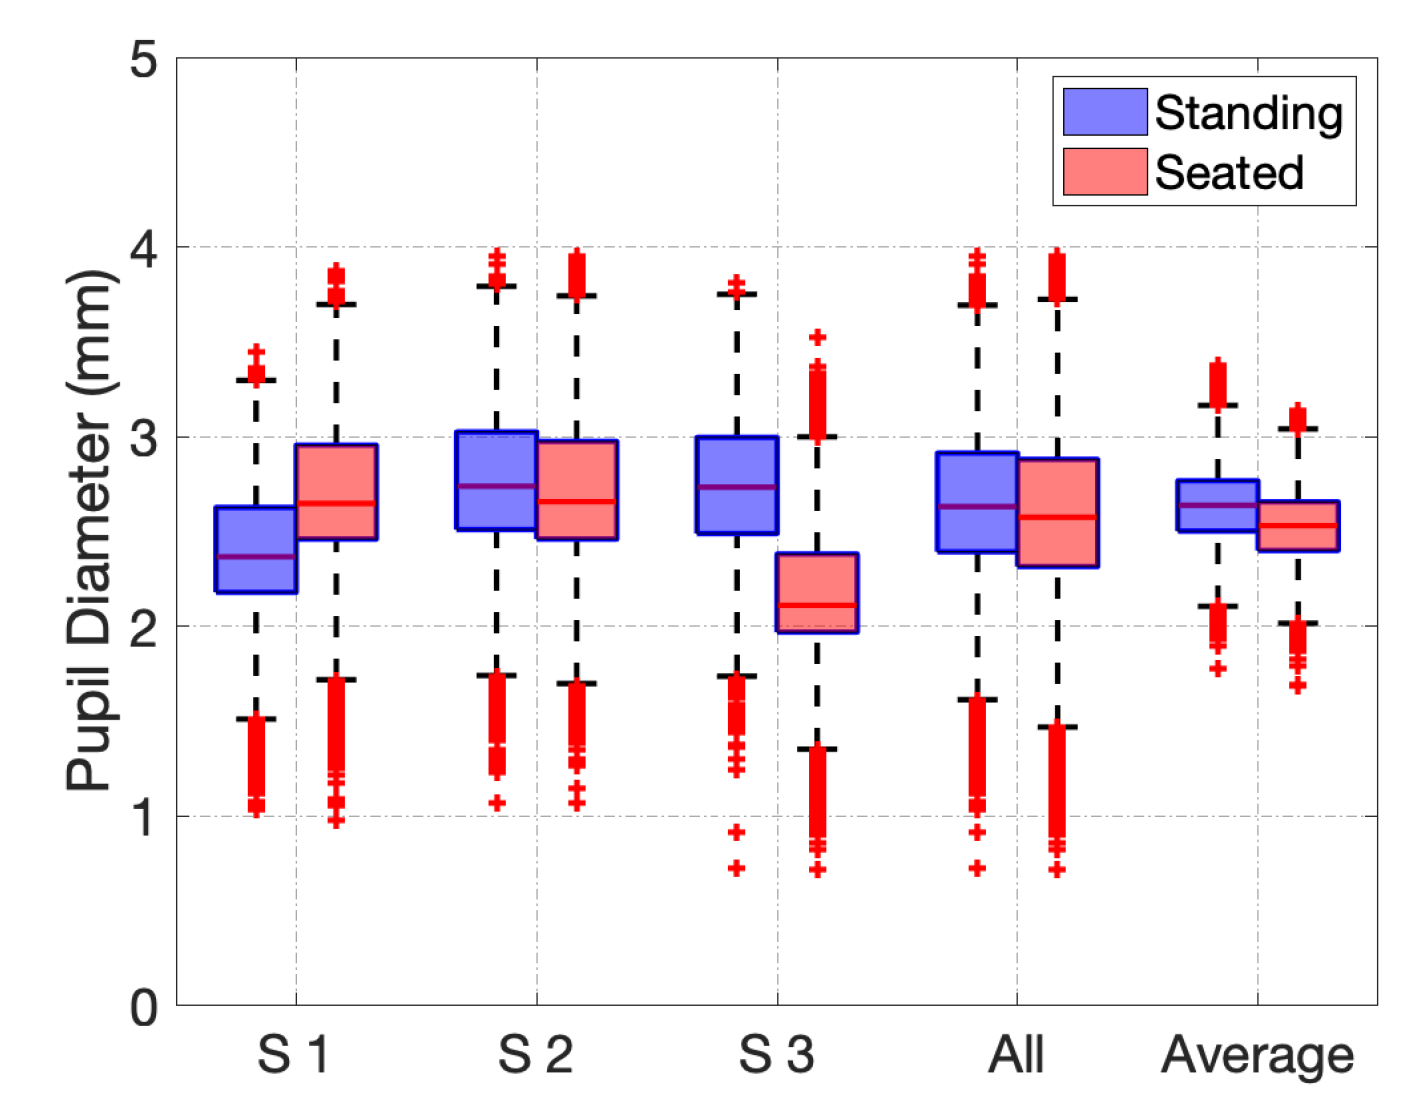
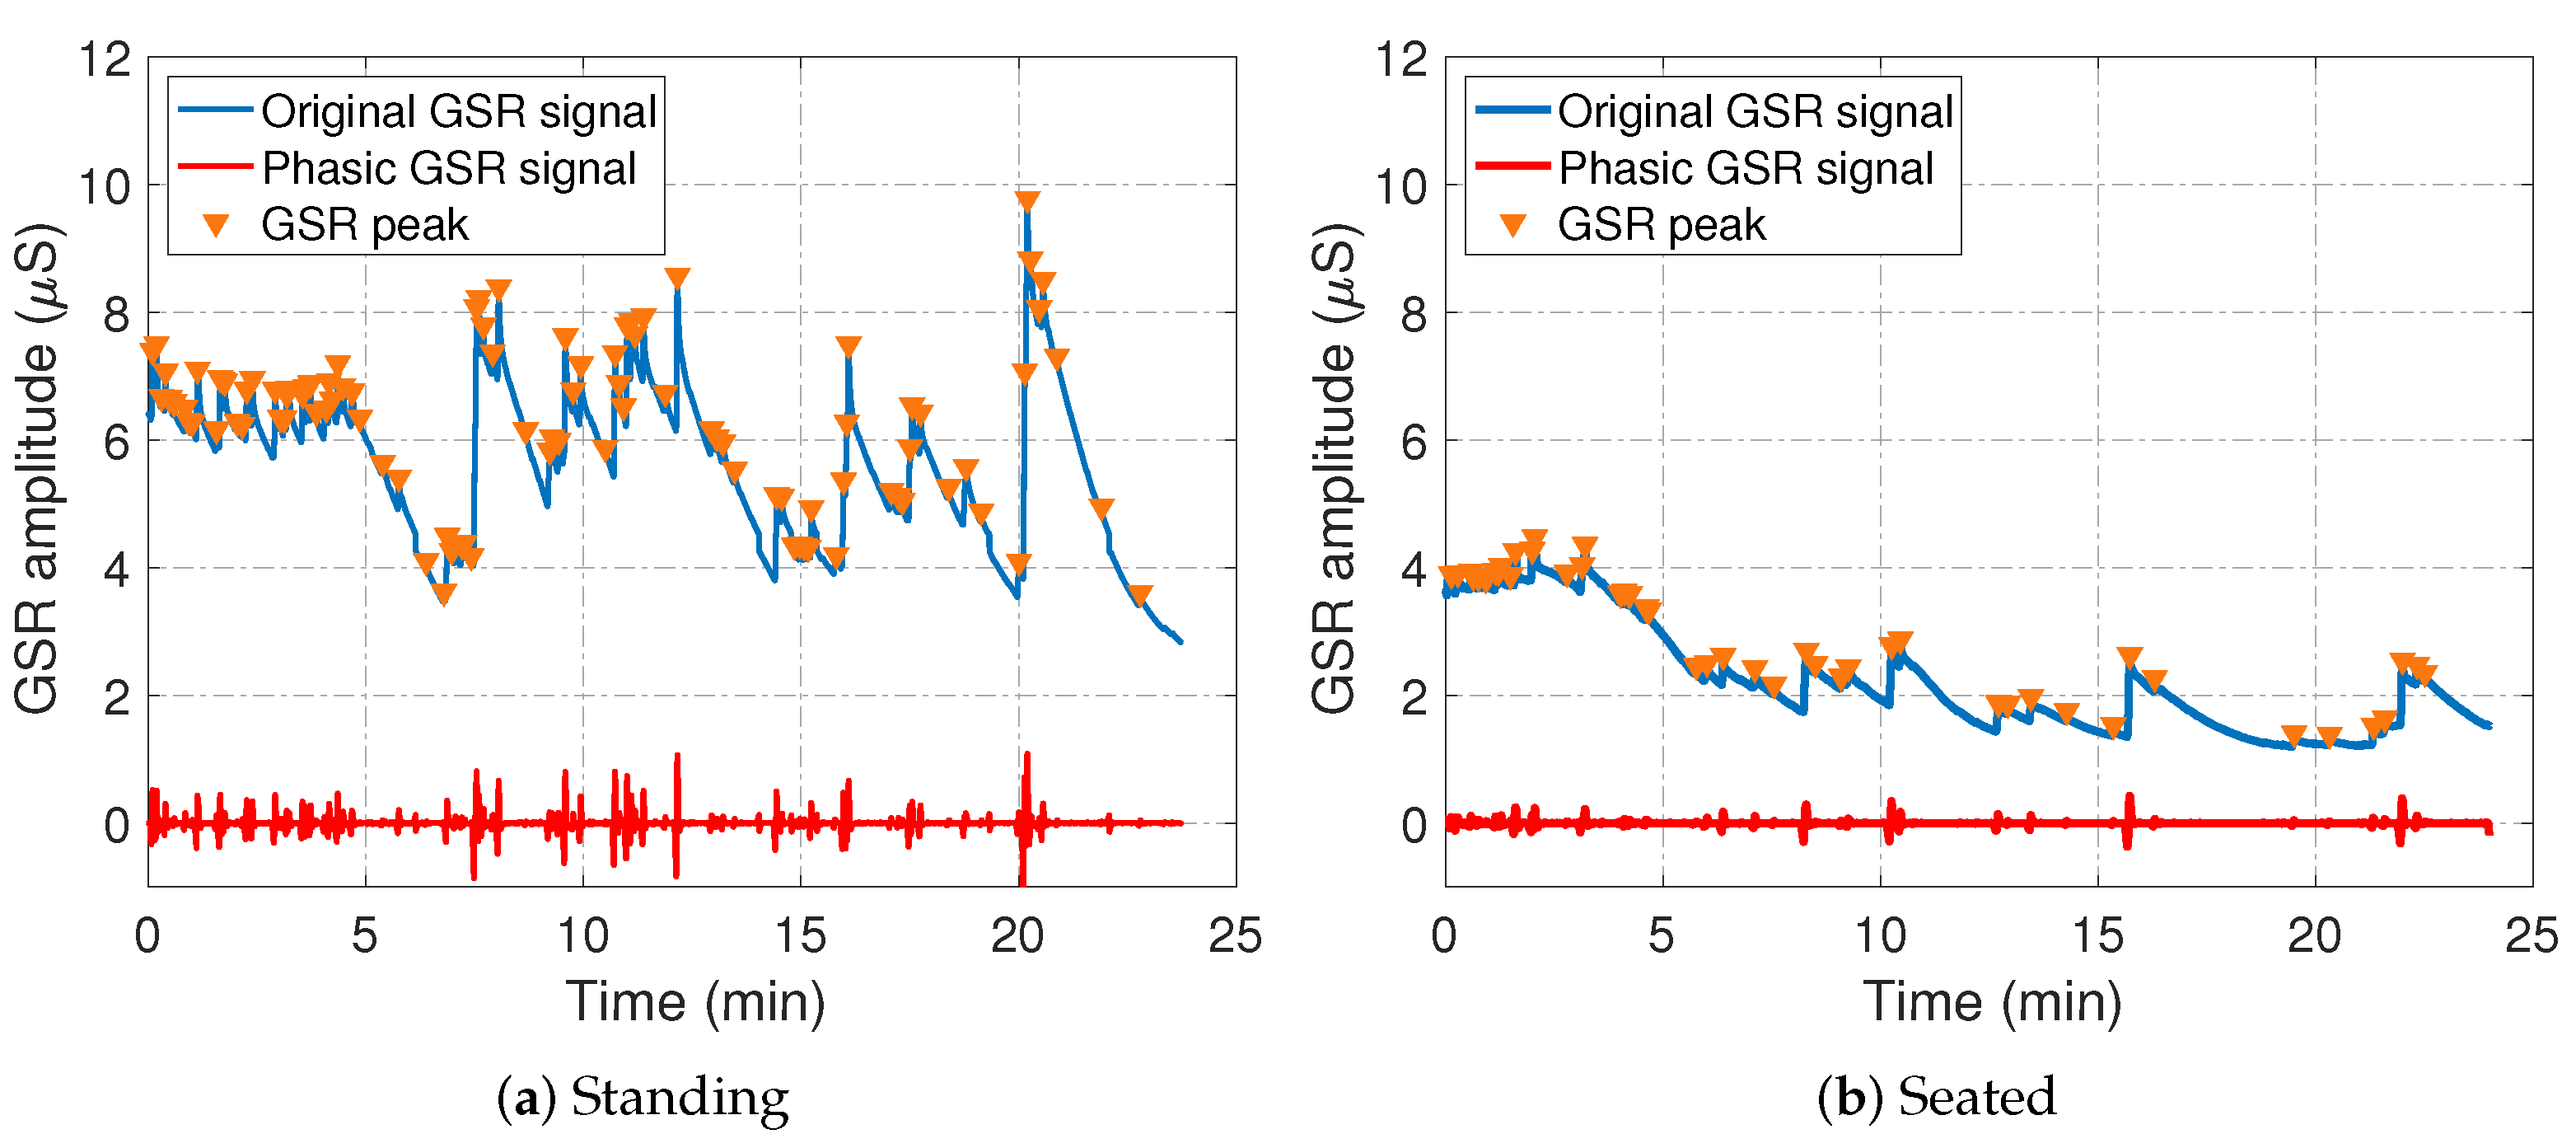
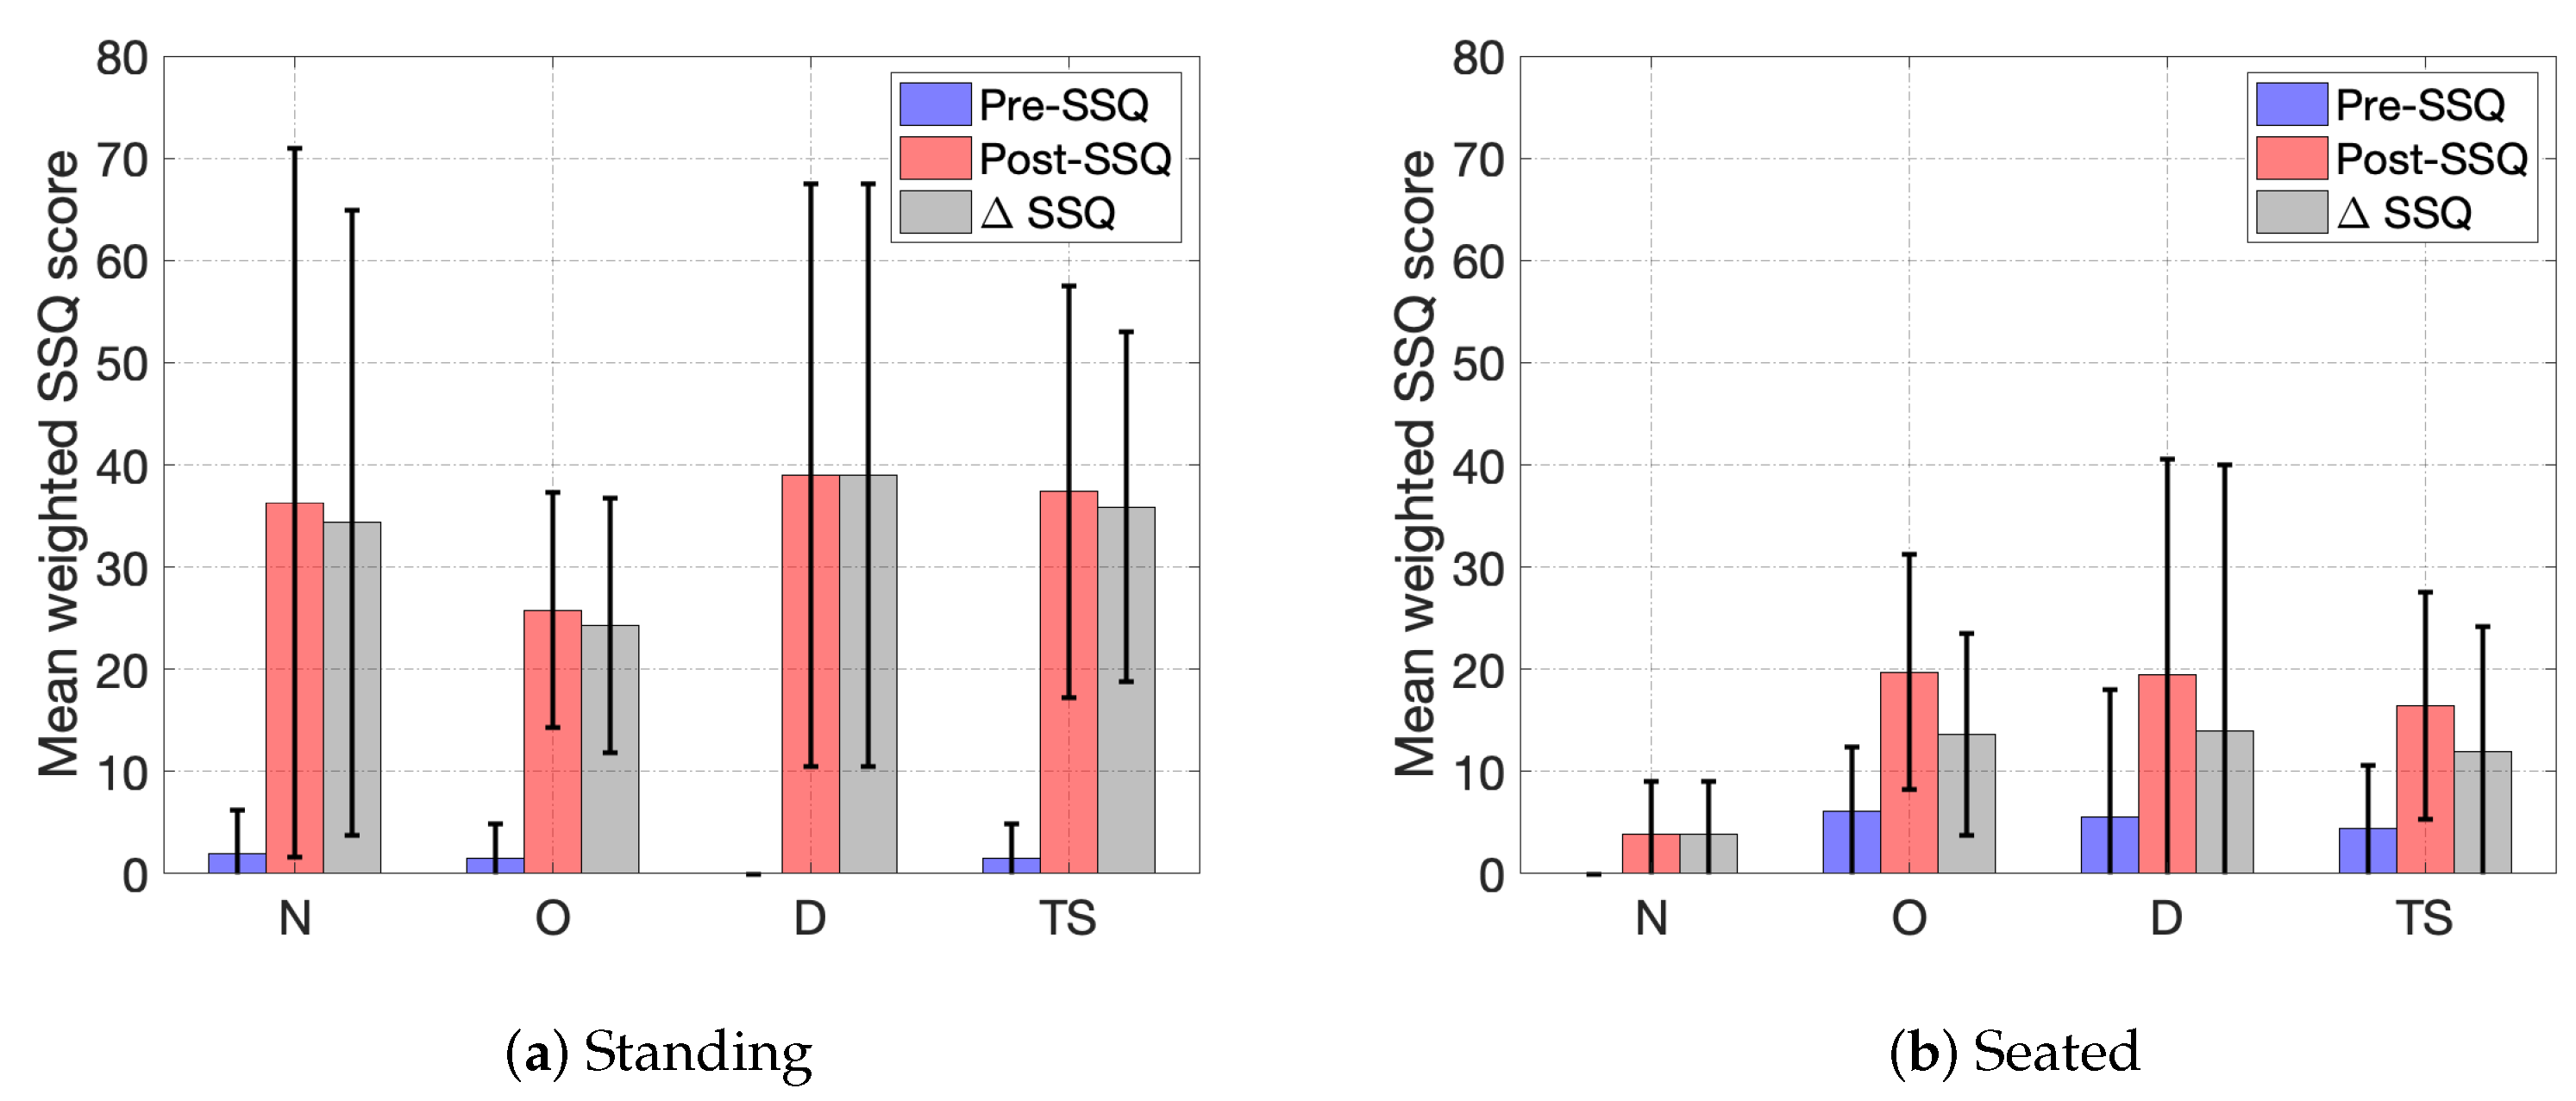
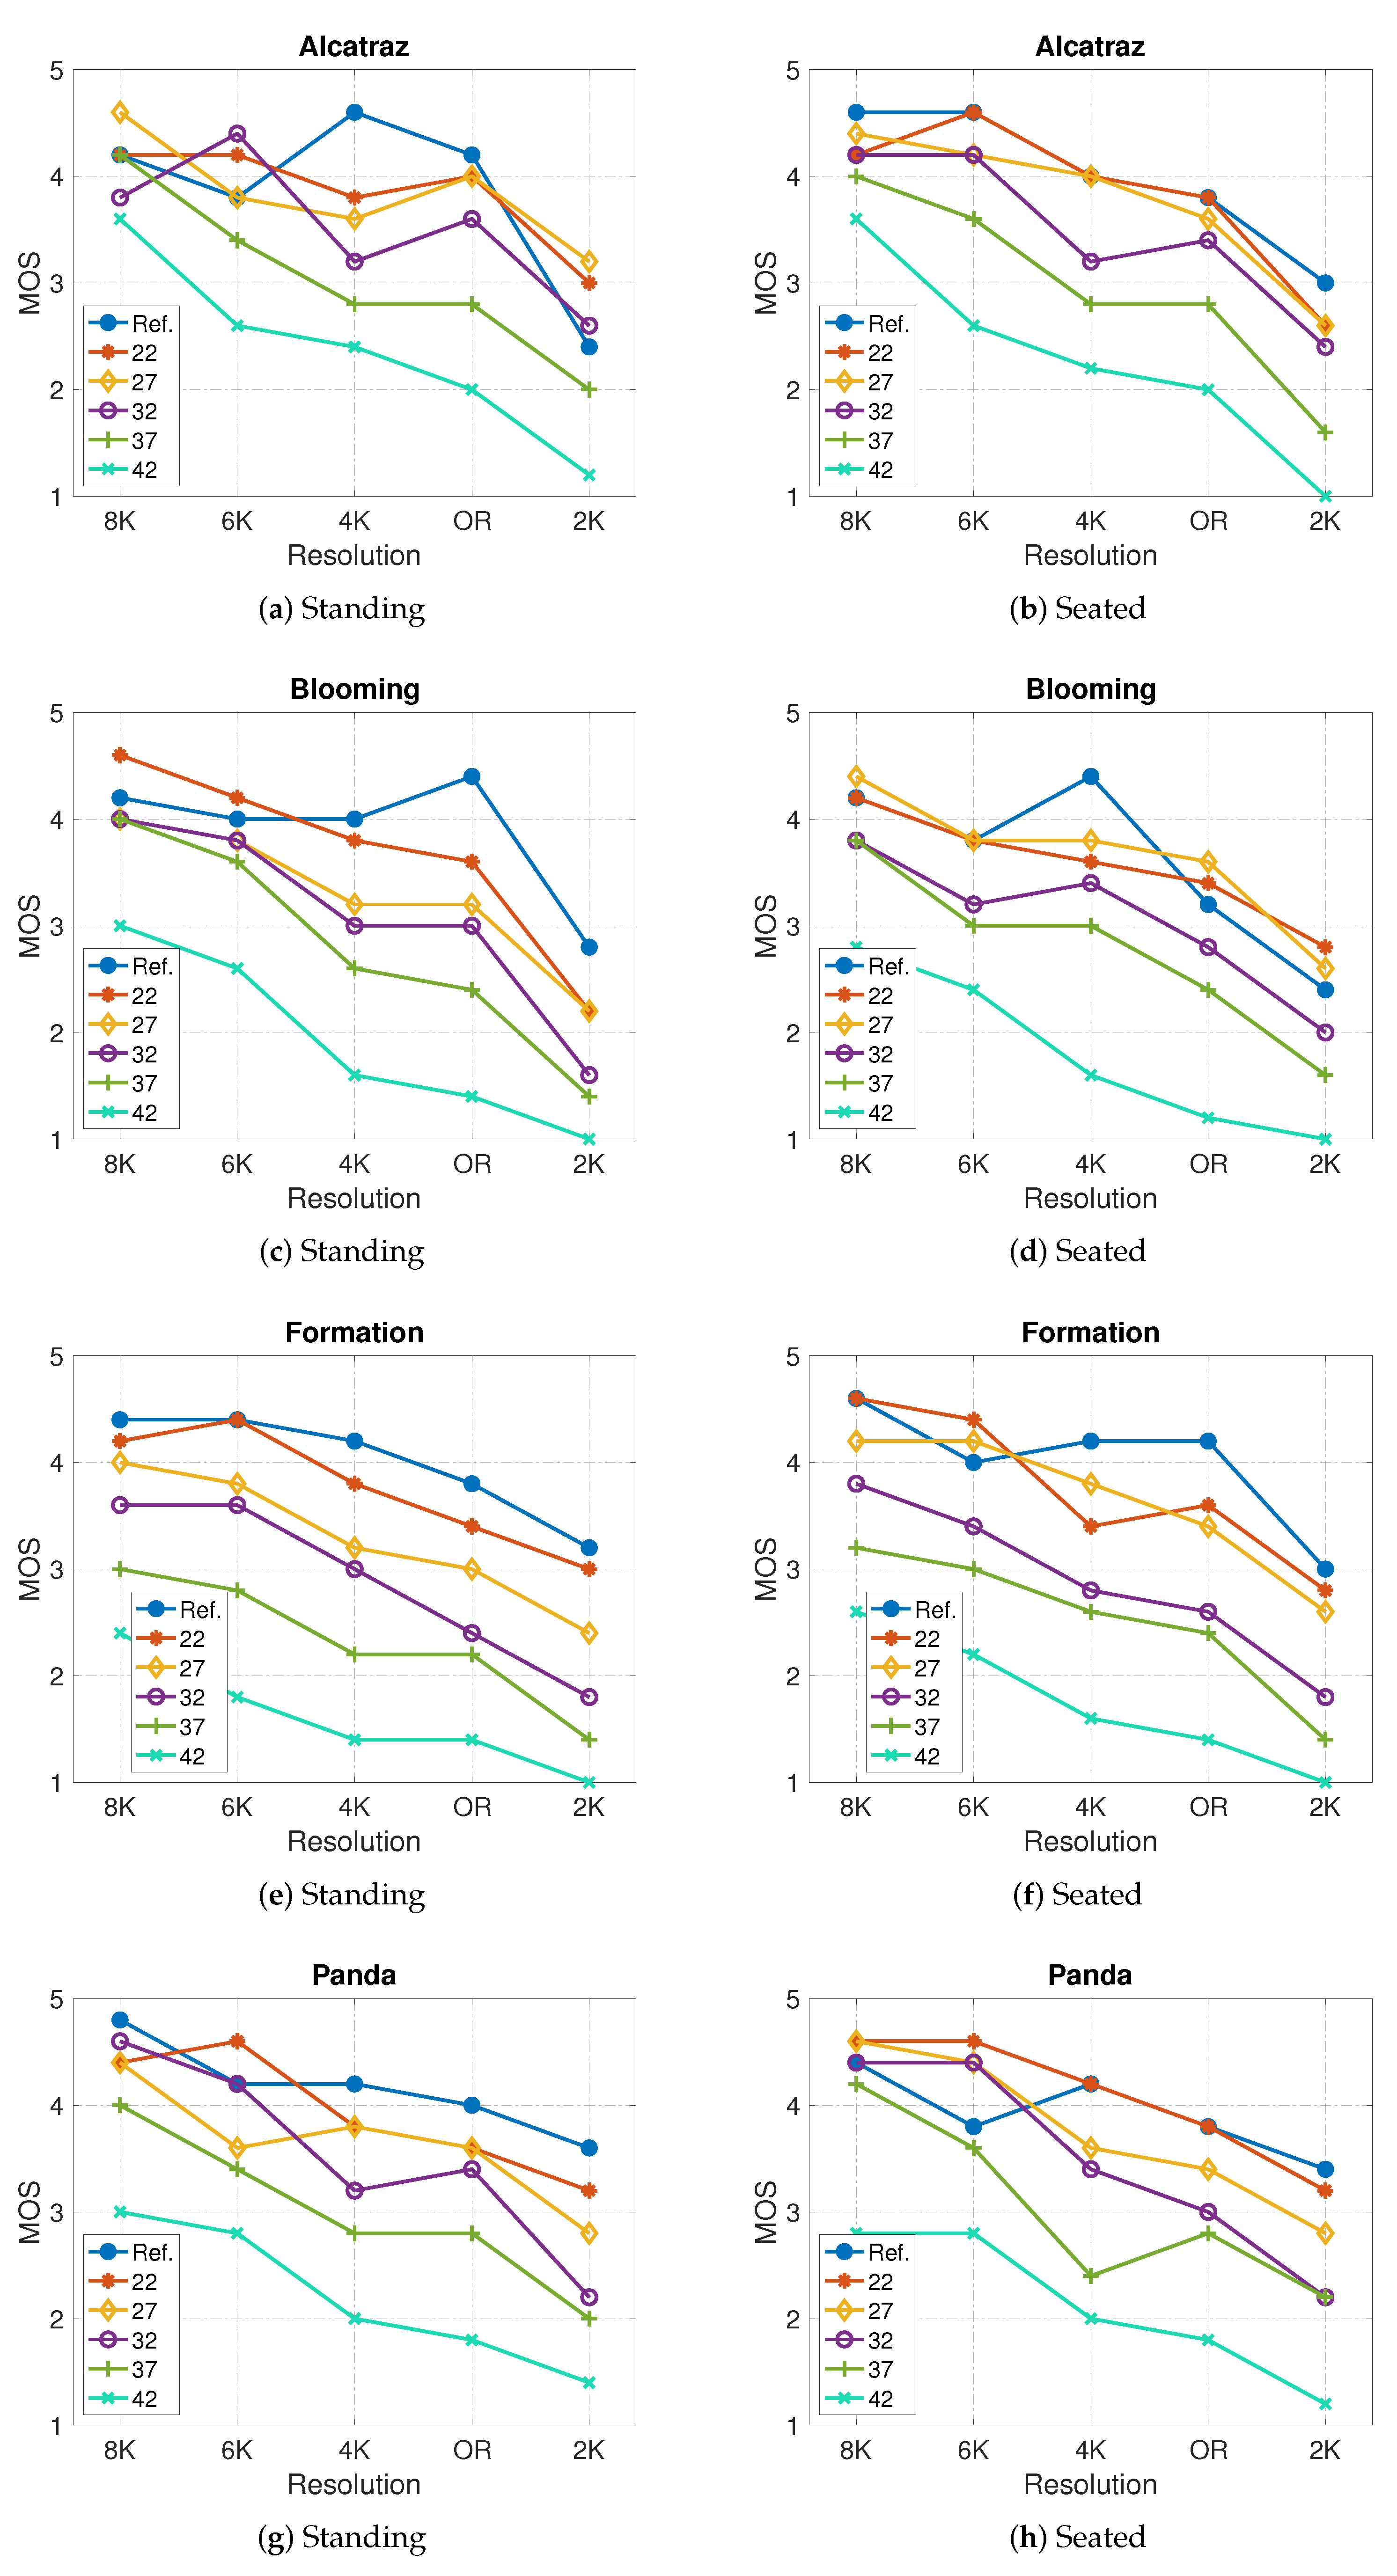
Table 1.
Parameters of the reference and test videos used for each of the four scenes.
| Resolution (Pixels) | 2D Width | Ref. (CRF) | Test Videos (QP) | ||||
|---|---|---|---|---|---|---|---|
| 8K | 10 | 22 | 27 | 32 | 37 | 42 | |
| 6K | 10 | 22 | 27 | 32 | 37 | 42 | |
| 4K | 10 | 22 | 27 | 32 | 37 | 42 | |
| OR | 10 | 22 | 27 | 32 | 37 | 42 | |
| 2K | 10 | 22 | 27 | 32 | 37 | 42 | |
Table 2.
Rating time statistics.
| Rating | Alcatraz | Blooming | Formation | Panda | Average | |||||
|---|---|---|---|---|---|---|---|---|---|---|
| Duration (s) | ST | SE | ST | SE | ST | SE | ST | SE | ST | SE |
| Median | 1.125 | 1.225 | 1.252 | 1.188 | 1.178 | 1.165 | 1.191 | 1.158 | 1.320 | 1.336 |
| Mean | 1.340 | 1.383 | 1.581 | 1.426 | 1.350 | 1.335 | 1.377 | 1.370 | 1.412 | 1.379 |
| SD | 0.653 | 0.668 | 0.934 | 0.730 | 0.608 | 0.594 | 0.588 | 0.795 | 0.715 | 0.700 |
Table 3.
SOS parameter a and MSE of the curve fitting to the SOS function.
| Standing | Seated | Standing | Seated | |
|---|---|---|---|---|
| a | MSE | |||
| Average MOS | 0.1789 | 0.1317 | 0.2704 | 0.2667 |
| Alcatraz | 0.2420 | 0.1247 | 0.7407 | 0.4129 |
| Blooming | 0.1653 | 0.1422 | 0.4475 | 0.4447 |
| Formation | 0.1243 | 0.1039 | 0.4935 | 0.4350 |
| Panda | 0.1258 | 0.1177 | 0.3882 | 0.4330 |
Table 4.
Yaw and pitch angles for each participant.
| Participant | Standing | Seated | ||||||||||
|---|---|---|---|---|---|---|---|---|---|---|---|---|
| Yaw | Pitch | Yaw | Pitch | |||||||||
| max | min | max | min | max | min | max | min | |||||
| 1 | 180° | −180° | 360° | 42.2° | −42.6° | 84.8° | 73.2° | −80.9° | 154.1° | 29.6° | −42.7° | 72.3° |
| 2 | 152.5° | −157.7° | 310.2° | 45.4° | −35.2° | 80.6° | 53.2° | −73.9° | 127.1° | 30.4° | −44.9° | 75.3° |
| 3 | 179.5° | −152° | 331.5° | 50.5° | −28° | 78.5 | 89.6° | −74.4° | 164° | 41° | −22.2° | 63.2° |
| 4 | 124° | −150.9° | 274.9° | 65.8° | −45.3° | 111.1° | 76.2° | −94.9° | 171.1° | 42.6° | −17.6° | 60.2° |
| 5 | 180° | −180° | 360° | 82.7° | −80.1° | 162.8° | 87.6° | −103.5° | 191.1° | 34.8° | −39.3° | 74.1° |
| All | 180° | −180° | 360° | 82.7° | −80.1° | 162.8° | 89.6° | −103.5° | 193.1° | 42.6° | −44.9° | 87.5° |
Table 5.
Pupil diameter statistics.
| Pupil | Participant 1 | Participant 2 | Participant 3 | Participant 4 | Participant 5 | All | Average | |||||||
|---|---|---|---|---|---|---|---|---|---|---|---|---|---|---|
| dia. (mm) | ST | SE | ST | SE | ST | SE | ST | SE | ST | SE | ST | SE | ST | SE |
| Median | 2.751 | 2.778 | 2.367 | 2.648 | 2.460 | 2.172 | 3.138 | 3.083 | 3.021 | 2.738 | 2.717 | 2.665 | 2.770 | 2.709 |
| Mean | 2.766 | 2.777 | 2.402 | 2.697 | 2.477 | 2.200 | 3.165 | 3.113 | 3.039 | 2.753 | 2.783 | 2.707 | 2.773 | 2.710 |
| SD | 0.367 | 0.366 | 0.293 | 0.335 | 0.210 | 0.212 | 0.417 | 0.421 | 0.379 | 0.336 | 0.453 | 0.452 | 0.153 | 0.155 |
Table 6.
Pupil diameter statistics for Participant 2.
| Pupil | Session 1 | Session 2 | Session 3 | All | Average | |||||
|---|---|---|---|---|---|---|---|---|---|---|
| dia. (mm) | ST | SE | ST | SE | ST | SE | ST | SE | ST | SE |
| Median | 2.367 | 2.648 | 2.739 | 2.657 | 2.734 | 2.111 | 2.632 | 2.575 | 2.638 | 2.529 |
| Mean | 2.402 | 2.697 | 2.771 | 2.707 | 2.745 | 2.189 | 2.655 | 2.589 | 2.636 | 2.531 |
| SD | 0.293 | 0.335 | 0.333 | 0.337 | 0.316 | 0.321 | 0.355 | 0.395 | 0.188 | 0.184 |
Table 7.
Number of GSR peaks and peaks per minute for each participant and average measures.
| Standing | Seated | |||
|---|---|---|---|---|
| Participant | No. of Peaks | Peaks/min | No. of Peaks | Peaks/min |
| 1 | 105 | 4.4 | 47 | 1.94 |
| 2 | 117 | 4.95 | 85 | 3.61 |
| 3 | 101 | 4.16 | 10 | 0.41 |
| 4 | 201 | 8.34 | 40 | 1.63 |
| 5 | 18 | 0.72 | 66 | 2.76 |
| Average | 108.4 | 4.51 | 49.6 | 2.07 |
Table 8.
Number of GSR peaks and peaks per minute for Participant 5.
| Standing | Seated | |||
|---|---|---|---|---|
| Test Session | No. of Peaks | Peaks/min | No. of Peaks | Peaks/min |
| 1 | 18 | 0.72 | 66 | 2.76 |
| 2 | 102 | 4.26 | 53 | 2.22 |
| 3 | 40 | 1.69 | 10 | 0.42 |
| Average | 53.3 | 2.22 | 43 | 1.80 |
Publisher’s Note: MDPI stays neutral with regard to jurisdictional claims in published maps and institutional affiliations. |
© 2021 by the authors. Licensee MDPI, Basel, Switzerland. This article is an open access article distributed under the terms and conditions of the Creative Commons Attribution (CC BY) license (https://creativecommons.org/licenses/by/4.0/).
Share and Cite
MDPI and ACS Style
Hu, Y.; Elwardy, M.; Zepernick, H.-J. On the Effect of Standing and Seated Viewing of 360° Videos on Subjective Quality Assessment: A Pilot Study. Computers 2021, 10, 80. https://0-doi-org.brum.beds.ac.uk/10.3390/computers10060080
AMA Style
Hu Y, Elwardy M, Zepernick H-J. On the Effect of Standing and Seated Viewing of 360° Videos on Subjective Quality Assessment: A Pilot Study. Computers. 2021; 10(6):80. https://0-doi-org.brum.beds.ac.uk/10.3390/computers10060080
Chicago/Turabian StyleHu, Yan, Majed Elwardy, and Hans-Jürgen Zepernick. 2021. "On the Effect of Standing and Seated Viewing of 360° Videos on Subjective Quality Assessment: A Pilot Study" Computers 10, no. 6: 80. https://0-doi-org.brum.beds.ac.uk/10.3390/computers10060080
Note that from the first issue of 2016, this journal uses article numbers instead of page numbers. See further details here.