
Using Autoencoders for Anomaly Detection and Transfer Learning in IoT


1
Cybersecurity Technology Institute, Institute for Information Industry, Taipei 105, Taiwan
2
Department of Computer Science and Information Engineering, National Taipei University of Technology, Taipei 106, Taiwan
*
Author to whom correspondence should be addressed.
Computers 2021, 10(7), 88; https://0-doi-org.brum.beds.ac.uk/10.3390/computers10070088
Submission received: 16 June 2021
/
Revised: 11 July 2021
/
Accepted: 14 July 2021
/
Published: 15 July 2021
(This article belongs to the Special Issue Selected Papers from the 3rd International Conference on Machine Learning for Networking (MLN'2020))
Abstract
:With the development of Internet of Things (IoT) technologies, more and more smart devices are connected to the Internet. Since these devices were designed for better connections with each other, very limited security mechanisms have been considered. It would be costly to develop separate security mechanisms for the diverse behaviors in different devices. Given new and changing devices and attacks, it would be helpful if the characteristics of diverse device types could be dynamically learned for better protection. In this paper, we propose a machine learning approach to device type identification through network traffic analysis for anomaly detection in IoT. Firstly, the characteristics of different device types are learned from their generated network packets using supervised learning methods. Secondly, by learning important features from selected device types, we further compare the effects of unsupervised learning methods including One-class SVM, Isolation forest, and autoencoders for dimensionality reduction. Finally, we evaluate the performance of anomaly detection by transfer learning with autoencoders. In our experiments on real data in the target factory, the best performance of device type identification can be achieved by XGBoost with an accuracy of 97.6%. When adopting autoencoders for learning features from the network packets in Modbus TCP protocol, the best F1 score of 98.36% can be achieved. Comparable performance of anomaly detection can be achieved when using autoencoders for transfer learning from the reference dataset in the literature to our target site. This shows the potential of the proposed approach for automatic anomaly detection in smart factories. Further investigation is needed to verify the proposed approach using different types of devices in different IoT environments.
1. Introduction
With the development of Internet of Things (IoT) technologies, more and more diverse devices are being deployed and connected to the Internet through IoT gateways or local routers. Given the large numbers of devices in a typical smart manufacturing scenario such as smart factories, a huge number of data could be generated at all times. These data need to be automatically transmitted to the server for further analysis. In data transmission, there might be a very high information security risk if they cannot be effectively protected. Since they usually contain critical knowledge of manufacturing and domain know-how in the industry, it would further threaten the competitiveness of the company.
The major issue of IoT devices is their lack of security. Since these devices are usually designed for better connection with each other, protection mechanisms are neither complete nor mandatory. Their security level cannot match that of ordinary computers. Since devices in smart factories are usually controlled and managed in an automatic way, they are more vulnerable to potential attacks if they are accessible from the Internet. On the other hand, with very different functions and operations, different device types might respond differently from ordinary computers under various malicious attacks. Given new and changing types of devices and network attacks, it is challenging to provide adequate protection. It would be helpful if the characteristics of different devices could be dynamically learned. Since the potential attacks to IoT devices might be very different from existing Internet attacks, we need a way to distinguish between the normal and abnormal behaviors for devices in the face of unknown attacks.
In this paper, we propose a machine learning approach to device type identification through network traffic analysis for anomaly detection in smart factories. Firstly, we design a system architecture for collecting network packets generated from devices and examining incoming packets for anomaly detection at the “edge” of the network. The assumption is that device anomalies can be determined from the packets they generate. With the collected packets, the device identification model for each type is then learned using supervised learning methods. Secondly, after identifying device types, we want to further distinguish between their normal and abnormal behaviors. To learn the most important features for the selected device types, we adopt unsupervised learning methods including One-class SVM, Isolation forest, and Autoencoders for dimensionality reduction. We further compare their effects on anomaly detection. Finally, by using autoencoders as a method for transfer learning, the models learned from one site can be easily deployed on other sites for anomaly detection.
In our experiments, we first evaluated the performance of device identification on real data collected in a smart factory with 12 production lines and three types of devices that communicate in Modbus over TCP/IP protocol. From the experimental results, we can observe the best performance of device identification with an accuracy of 97.6% and micro-averaging F1 score of 97.6% using XGBoost for feature selection. Secondly, to test the effects of our proposed methods for anomaly detection, we collected the normal behaviors and simulated the abnormal behaviors on real devices in two selected sites in our target factory by sending valid and invalid requests and recording the responses for analysis. From the analysis results of the data distribution in Modbus over TCP/IP protocol, selecting feature subsets was found useful in improving the performance of anomaly detection. The best performance can be observed for autoencoders, where the F1 score can be improved from 43.77% to 57.23% and 48.78% to 98.36%, respectively. This shows the effectiveness of autoencoders for learning the most important features for normal behaviors of devices from the generated packets. Furthermore, by using autoencoders for transfer learning, the models learned from the reference dataset can be effectively used to detect anomalies on the target site with comparable performance. This shows the potential of our proposed approach to automatic anomaly detection and transfer learning using autoencoders. Further investigation is needed to evaluate our proposed method with different types of devices and network attacks in different IoT scenarios.
2. Related Work
IoT technologies facilitate Internet access for diverse types of devices. This is useful in many application scenarios such as smart homes and smart factories, to name a few. Given the high costs with poor hardware resources, very limited security mechanisms are enforced in IoT devices. This could bring a huge risk of these devices being compromised and controlled.
To enhance IoT security, different solutions have been proposed. Hardware-based solutions such as Physical Unclonable Functions (PUF) [1] were proposed where a physically defined “digital fingerprint” output is generated as a unique identifier for given input conditions. For example, a PUF-based authentication mechanism [2] can be used to verify device identities that usually have strict constraints in energy and computational capacity. However, hardware-based solutions are generally unable to cope with new attacks once deployed. In contrast, software-based solutions are more flexible if cryptographic functions could be implemented on these devices. Since there are various device types in a typical smart factory, the characteristics and behaviors could be very different. IOT Sentinel [3] is among the major works for automatic device type identification for security enforcement in IoT. By monitoring the communication behaviors of devices during the setup process, the generated device-specific fingerprints are mapped to device types using the random forest classification algorithm and edit distance. Shahid et al. [4] used machine learning methods to recognize IoT devices by analyzing packets sent and received. In their experiments on four types of smart home devices, Random Forest classifier can obtain a recognition accuracy of 99.9% by the bidirectional flows as defined by a sequence of packet sizes and their inter-arrival times. In this paper, we compared the performance of device identification using supervised learning on real IoT devices in smart factories. Given different response packet contents in diverse devices, we want to improve the performance of anomaly detection by learning the normal and abnormal behaviors for the corresponding device type. Similar to the idea of adaptive anomaly detection in hierarchical edge computing systems [5], we design our solution in the edge. By learning the important features to be matched, our proposed anomaly detection system can achieve greatly improved efficiency.
Anomaly detection has been a popular research topic in IoT security as well as Internet security. For example, Alrashdi et al. [6] proposed an intelligent anomaly detection system in smart cities called AD-IoT. They claimed an accuracy of 99.34% for random forest, but the F1 score is only 86% for detecting attacks in the UNSW-NB15 dataset. Hasan et al. [7] compared performances of several machine learning methods for anomaly prediction in IoT systems. The best accuracy of 99.4% can be obtained for decision trees, random forests, and artificial neural networks (ANN). However, the dataset they used is synthetic in a virtual IoT environment. Diro and Chilamkurti [8] proposed a distributed deep learning approach to network attack detection in social IoTs. For two-class and four-class classification on NSL-KDD dataset, deep learning models outperform shallow models, with the best F1 score of more than 99% and 98%, respectively. However, previous datasets such as NSL-KDD were not helpful for IoT environments, since they cannot represent the major characteristics of IoT. Thus, Koroniotis et al. [9] developed a new dataset called Bot-IoT which incorporates legitimate and simulated IoT network traffics with various types of attacks. A high accuracy can be obtained when they use feature selection techniques based on correlation coefficient and joint entropy to select the 10 best features.
When there are a large number of features, a lot of training time is needed, which does not necessarily improve prediction accuracy. Some features might introduce bias that do not have any relation with the class. Thus, feature selection methods are commonly used to improve the performance of supervised learning. For example, Yang et al. [10] evaluated the performance of feature selection and anomaly detection for hard drive failure prediction. Injadat et al. [11] considered feature selection using information gain and correlation-based measures. They are able to reduce the feature set size significantly. For network intrusion detection, supervised feature selection methods are commonly used [12]. When there are correlations among data, dimension reduction techniques are often utilized, for example, traditional approaches such as linear PCA and kernel PCA. Condensed nearest neighbors consider the distribution of data samples and reduce dimensions [13]. However, autoencoders are found to detect anomalies in which linear PCA fails, and it can also avoid the complex computation in kernel PCA [14]. Lee et al. [15] utilized sparse autoencoders for feature learning and dimension reduction. An accuracy of 99% can be achieved using the CICIDS2017 dataset. Based on our previous experience, important features can be selected using ensemble decision trees for improving intrusion detection performance [16]. In this paper, we apply the same technique in selecting features for device type identification. For anomaly detection, we adopt autoencoders for dimensionality reduction.
In Industrial Internet of Things (IIoT) scenarios, Anton et al. [17] used machine learning algorithms to discover anomalous traffic in a synthetic data set of Modbus/TCP communication in a fictitious industrial scenario. Zolanvari et al. [18] focused on the commonly used SCADA protocols in IIoT systems. They developed a machine-learning-based intrusion detection system where random forest shows the best performance with Matthews Correlation Coefficient (MCC) of 96.81%. However, since IoT devices are usually not capable of the complex computations in deep learning models, Ngo et al. [5] proposed an adaptive anomaly detection method for hierarchical edge computing (HEC) systems. When selecting deep learning models of respective complexity for different layers in the hierarchy, the detection delay can be greatly reduced by 84% while maintaining comparable accuracy.
In this paper, we compared the effects of unsupervised learning methods including one-class SVM, isolation forest, and autoencoders for anomaly detection, where autoencoders achieved the best F1 score of 98.36%. Then, by using autoencoders for transfer learning between different sites which might contain different types of network traffic, we can observe comparable performance for anomaly detection. This shows the feasibility of using autoencoders for anomaly detection and transfer learning from only selected sites without the need for tedious manual labeling process in each new site.
3. The Proposed Method
In this paper, we propose a two-stage machine learning approach to anomaly detection through network traffic analysis in IoT. To capture all network packets generated from various devices, we design a system architecture consisting of an embedded sensor and an edge server on the LAN of IoT devices, with four modules: packet collection, supervised device type identification, unsupervised dimension reduction, and packet filtering, as shown in Figure 1.
As shown in Figure 1, firstly, we collect network packets generated from different types of IoT devices, for example, computers, controllers, and robotic arms, by our packet collection module. Specifically, an open-source Intrusion Detection system called Suricata is used for packet collection since the detection rules can be customized and deployed on the embedded sensor. The supervised device identification module then utilizes supervised learning methods to train models from these packets to distinguish among devices. Secondly, to learn the most important features for each identified type of device, we compare three different unsupervised learning methods for dimensionality reduction, including One-class SVM, Isolation forest, and autoencoders. Since we could not know the possible types of attacks in advance, these methods are helpful in learning only one single model for the normal behaviors when enough data can be collected from devices. The data flow diagram is shown as follows in Figure 2.
As shown in Figure 2, when deploying new devices, they will first be configured to communicate with the embedded sensor. This involves a few packet exchanges during the device setup process, during which we collect the network packets for device type identification. After the setup process is complete, the corresponding model can be automatically learned from the extracted features in normal packets and deployed to the packet filtering module that configures the corresponding filtering rules for examining incoming packets and discovering potential outliers. In the following subsections, we will describe each module in more detail.
3.1. Supervised Device Type Identification
First, we use supervised learning methods to identify various device types. The benefit of supervised learning is the potentially higher classification accuracy, with the cost of manually labeling in the training data. Given multiple types of devices in IoT, we train a multiclass classifier for each type. Then, feature selection methods can be used to select important features for improving device type identification.
To distinguish between different device types, selected fields in network packets are extracted as the features for supervised learning, including “dest_IP”, “dest_port”, “src_port”, “proto”, “pkts_toserver”, “bytes_toserver”, “time_spent”, and “age”. The 5-tuples (protocol, source IP, destination IP, source port, destination port) are associated with bidirectional packets in network sessions. “pkts_toserver” and “bytes_toserver” represent the number of packets and number of bytes to be sent to the server, respectively. Finally, “time_spent” is calculated from the “start” and “end” from the “flow” field, where “age” denotes the duration in seconds. Note that the definition of flows in Suricata are similar to sessions that consist of bidirectional packets with the same 5-tuples mentioned above. All these fields are numerical except for the “proto” field, which consists of variable-size textual names for the protocol. To simplify the processing for real-time feature extraction, texts are converted by word embedding models into fixed-size vectors. In this paper, we adopt Word2Vec as the word embedding model with a vector dimension of 100. This makes the total dimension of features as 110.
For the classification model, we adopt an ordinary neural network with multiple dense layers. With the incremental nature of neural networks, no retraining is needed when we have more input data for training. We then use the feature selection method XGBoost, which is an implementation of gradient boosted decision trees, to estimate the relative importance of individual features. Specifically, the gradient boosting method creates new models that predict the residuals or errors of prior models, which are added together to make the final prediction. By utilizing tree ensembles, the sum of loss functions is minimized for the residuals in each round. Furthermore, importance score is calculated for each tree and weighted by the number of observations. The feature importance is then calculated by averaging across all trees in the model.
3.2. Unsupervised Dimension Reduction for Anomaly Detection
After the device identification model has been trained with the selected features, they can be automatically deployed in our packet filtering module. Then, we adopt unsupervised learning methods to train the model for normal behaviors of each device type, which can then be used for anomaly detection.
To distinguish between normal and abnormal behaviors through network packets generated from devices, we have to know which are normal and which are not. To the best of our knowledge, there is no public IoT attack dataset available, so we would not be able to define the real-world attack models. In this paper, we propose to simulate potential attacks and intrusions by sending predefined malicious network patterns to devices and monitoring the resulting packet responses. Specifically, the malicious packet requests from simulated attackers are abnormal, while the corresponding packet responses to malicious requests are considered normal since these are the behaviors of real devices. In this paper, we apply the idea of dimensionality reduction to discover the most important features in the training data. In particular, we compare three different unsupervised learning methods for anomaly detection: one-class SVM, isolation forest, and autoencoders. We describe below each method in detail.
3.2.1. One-Class SVM
When we only have data of one specific class and data in all the other classes are not available, one-class classification can be used to learn the features. This is usually more difficult than the ordinary classification problem where we have instances of all classes. In the case of one-class SVM or single-class SVM [19], we simply modify SVM classifiers to only use positive examples when training. After the decision boundary has been learned, it can be used to detect objects that are considered as outliers or anomalies if they are very different from features in our training examples. Specifically, the decision boundary for one-class SVM can be determined from the parameters: kernel function, gamma, and nu.
3.2.2. Isolation Forest
Instead of profiling normal objects, isolation forest [20] tries to isolate anomalous objects. It is based on the decision tree algorithm. The main idea is to take advantage of the two major properties of the anomalous objects: first, there are fewer instances, and they are very different from normal objects. Specifically, an ensemble of isolation trees are built from the data objects, from which anomalies have shorter path lengths in the tree. Isolation forest is a nonparametric, unsupervised learning method. There are two major parameters: num_estimators, and max_samples. Num_estimators is the number of base estimators or trees in the ensemble, while max_samples is the maximum number of samples drawn to train each base estimator.
3.2.3. Autoencoders
Autoencoders are neural networks that are designed to project high-dimensional data into a lower-dimensional space that could be easier to separate. They consist of two phases: encoder, and decoder, as shown in Figure 3.
While the encoder reads input into a condensed form, the decoder tries to recover the original input as much as possible. In the simplest design, only three layers are needed in the autoencoder: input layer, intermediate layer, and output layer. The input layer takes the original number of features and connects to the smaller number of neurons in the intermediate layer, which effectively reduces the dimensionality. The intermediate layer is further connected to the output layer with the same dimension as the input. When training autoencoders, we use the same data as the input for the output. The goal is to minimize the loss between the reconstructed data and the original input data.
Since autoencoders were demonstrated to detect subtle anomalies that linear PCA fails [14], we apply them in anomaly detection in this paper. To utilize autoencoders for anomaly detection, we calculate the reconstruction errors of autoencoders to detect outliers [21]. The idea is that if normal behaviors can be learned in autoencoders, the reconstruction error should be minimized for normal packets. Input data that are anomalous should give larger reconstruction errors. Thus, an appropriate threshold is needed to determine if the errors are large enough to be considered as an anomaly. It also depends on the distribution in different datasets.
4. Experiments
In our experiments, the performance evaluation of our proposed approach is divided into two parts: supervised device type identification and unsupervised dimension reduction for anomaly detection. In the following subsections, the experimental results are described.
4.1. Performance of Supervised Device Type Identification
In this experiment, we first evaluate the performance of supervised device identification. To capture network traffic from our embedded sensor, we used the open-source IDS and IPS tool called Suricata. We collected network packets in 12 production lines in our target factory. Then, we manually labeled the data into three classes: computers in 17,296 events, robotic arms in 738 events, and controllers in 3413 events, with a total of 21,447 records as our first dataset for device identification. Note that in Suricata, events represent different types of traffic that can be logged associated with different protocols or other fields. With 10% for validation, the dataset is divided into 18,000 events as the training set, 2000 as the validation set, and 1447 as the test set. As described in Section 3.1, 110-dimensional features were used. Regarding the parameters of the neural network, we utilize Exponential Linear Unit (ELU) as the activation function and Adam optimizer [22] in 150 epochs with a batch size of 32. According to our experimental results with three dense layers of neural networks, the test accuracy of the neural network is 92.8%. This shows the potential of using supervised learning for device identification.
Next, we further improved the performance of our device identification model by utilizing feature selection methods for dimensionality reduction. Specifically, after applying XGBoost for feature selection, we obtained the top 10 important features as in Table 1.
As shown in Table 1, among the top 10 selected features, “proto” is the most important feature, followed by “bytes” and “dest_port”. This is reasonable since the same device type usually uses the same protocol for communication. Furthermore, the number of bytes determines the size of payload, and the “dest_port” determines the destination service. These are usually different for each device type. After feature selection is applied, the confusion matrix of device identification result can be obtained as follows.
As shown in Table 2, we can see an improved accuracy of 97.6%, which is improved by 4.8% compared to the case without feature selection. This shows the effectiveness of feature selection methods for improving classification performance. If we further compare the multiclass classification performance, the micro-averaging and macro-averaging F1 scores are 97.6% and 87.6%, respectively. The reason why the macro-averaging F1 score is not as good is due to the lower performance for the “robotic arms” class, which showed a precision of 72.6%, recall of 60.8%, and F1 score of 66.2%. This is due to the imbalanced distribution of the three classes, where the robotic arm is the smallest one. To prevent bias from imbalanced data distribution, the All-versus-All (AVA) approach should be adopted where a binary classifier for each pair of device types is trained. This can improve the performance of multiclass classification for minority classes.
4.2. Effects of Unsupervised Learning Methods for Anomaly Detection
To evaluate the effects of three different unsupervised learning methods for anomaly detection, we focused on the Modbus TCP protocol, which is used to transmit data in our target factory. Since there are no real IoT attacking data available, we first simulated malicious network patterns that are different from the normal behaviors of devices. In particular, we selected two sites in our target factory: Sites A and B. Site A is a test platform for robotic arms. It is a master–slave architecture where one HMI (Human–Machine Interface) sends commands to the controller for robotic arms. Site B consists of two controllers: one for monitoring water levels and the other for measuring air density (ppm) in water. We collected both normal and attacking packets generated from the devices in the two sites. The statistics of the two datasets for anomaly detection are shown in Table 3.
As shown in Table 3, the distribution of packets collected from the two selected sites (denoted as Site A and Site B) are very imbalanced. The percentages of attacking packets in Sites A and B are 0.456% and 0.3%, respectively. Although this is just a simulation, it also reflects real situations where attacks are very rare compared to normal packets.
To give a fair comparison with other methods, we further surveyed existing open data from the literature as follows. Firstly, the dataset for a Modbus-based gas pipeline control traffic [23] is adapted since it is in the Modbus TCP protocol. We extracted the packets with the function codes 3 and 16 since they account for the most proportion. Secondly, we used two datasets Moving_two_files_Modbus_6RTU and Send_a_fake_command_Modbus_6RTU_with_operate from Anton et al. [17], which are both in Modbus TCP protocol, and extracted the most common packets with the functions codes 1, 2, 3, and 5. These are adapted and combined as the reference dataset for our experiment, as shown in Table 4.
To compare the performance of the three different unsupervised learning methods: one-class SVM, isolation forest, and autoencoders, we first tested their effects on the reference dataset adapted from the literature. From our observation in the preliminary experiments, we set the parameters of the three methods as follows. (1) For one-class SVM, we adopted nu = 0.0001, and gamma = 0.05 with a RBF (Radial Basis Function) kernel function. (2) For isolation forest, we set max_samples = 100, contamination = 0.2, and num_estimators = 10. (3) For autoencoders, the numbers of hidden neurons are (18, 2, 2, 18), and epochs = 20. The performance comparison of anomaly detection is shown as follows.
As shown in Table 5, we can observe the best performance for the reference dataset by using autoencoders, with the best F1 score of 76.76% and an accuracy of 89.9%. This shows the effectiveness of learning normal behaviors by autoencoders. Thus, in our remaining experiments, will used autoencoders for anomaly detection.
4.3. Effects of Feature Selection on Anomaly Detection for Autoencoders
To compare the effects of feature selection on anomaly detection, we targeted the two selected sites in which devices communicated in Modbus over TCP/IP or Modbus TCP protocol. The packet frame format is shown as follows.
As shown in Table 6, the first six bytes are the TCP header, in which the “length” indicates the number of remaining bytes in the packet frame. Firstly, each device is given a unique “address” in Modbus TCP protocol. Since it is a master/slave protocol, any device can send a Modbus command as a master. Secondly, “function code” represents the general commands for different types of devices in the industry. For example, data access commands such as reading or writing single/multiple coils and reading or writing single/multiple registers are among the most commonly used. Finally, the “data value” field is of variable length, which might represent different meanings in different devices. Since there are many different types of devices, the uses of “function code” and “data value” fields are very diverse. This might cause difficulty in distinguishing between normal and anomalous behaviors.
In order to select the most effective features, we further designed four selected sets of feature combinations as follows:
- (1)
- Function code, address, data value
- (2)
- Function code, address, length, data value
- (3)
- Function code, address count, length, data value
- (4)
- Function code, address count, length, data value count
In particular, “address count” is the histogram of different addresses, while “data value count” is the histogram of different data values. The idea is to keep the frequency of occurrences instead of matching the exact values. This could limit the number of possible values in the field that makes the grouping easier. Note that given different combinations of feature subsets, the number of dimensions in input data may also vary. For autoencoders, we set the dimension of the input and output layers to be the same as the dimension of input data. The sequence of bytes from the feature subsets is directly input to the classifier. Given the reconstructed data in the output, we calculate the reconstruction errors of autoencoders to detect outliers.
In the following subsections, we will compare the performance of different feature subsets in detail.
4.3.1. Feature Set 1: Function Code, Address, Data Value
Since we want to select features for learning from the normal data, we first ignored the TCP header. In our dataset, we simply used the remaining fields with their binary representation. Since the longest data value field is 18 bytes in our datasets, we simply do the padding for the whole data value field to 18 bytes. This gives the total dimensionality of 20. The results are shown as follows.
As shown in Table 7, we can observe very different performances for Sites A and B in terms of precision and recall. Site A has fewer false negatives and a higher recall, while Site B has fewer false positives and a higher precision. This is due to the very different characteristics in the behaviors of devices in these two sites. Furthermore, Site B is a little faster in training because it is smaller in size.
4.3.2. Feature Set 2: Function Code, Address, Length, Data Value
To better learn the normal behaviors of different devices, we further include all data fields in Modbus TCP packets. The results are shown in Table 8.
As shown in Table 8, we can observe a large improvement in recall for Site A. However, including all data fields as the feature set does not improve the performance of Site B. After inspecting the data, we found that there are too many possible values in some data fields such as “address”, and “data value”. Thus, it would be very difficult to distinguish between normal and abnormal cases based on their individual values. Next, we further consider using statistics to replace the exact values as the features.
4.3.3. Feature Set 3: Function Code, Address Count, Length, Data Value
In this feature set, we first replace the data field “address” with “address count”. It is the frequency of occurrences for each address. The result is shown in Table 9.
As shown in Table 9, we can observe large improvements for both sites. In particular, the recall in Site B has been greatly improved from 32.79% to 65.57%. On the other hand, the precision improves for Site A while the recall slightly degrades. The overall F1 scores for both sites are much better than the previous feature sets. This shows that using statistics such as “address count” can help in distinguishing between normal and abnormal data. Note that the training times for both Sites A and B increase. This is due to the extra calculation needed for the statistics of “address count”. Next, we want to further replace the remaining data fields.
4.3.4. Feature Set 4: Function Code, Address Count, Length, Data Value Count
Finally, we further replace the data field “data value” with “data value count”, which denotes the frequency of the individual data values. The result is shown in Table 10.
As shown in Table 10, we can observe two totally different phenomena. Firstly, recall was improved to 94.23% with a reduced precision in Site A. Secondly, both precision and recall improved to the highest values of 98.36% in Site B, with the best performance of 98.36% in terms of F1 score. This shows the effectiveness of using statistics in selected fields as the feature. Furthermore, the training time only slightly increases. It is still useful in practice.
4.4. Effects of Transfer Learning across Different Sites
To compare the performance of transfer learning using autoencoders, we first trained autoencoders using the Reference dataset adapted from the literature. Then, we evaluated the effects of anomaly detection using datasets Sites A and B. The results of Feature Sets 3 and 4 are shown in Table 11.
As shown in Table 11, we can see very different results for Sites A and B. Feature Set 3 is helpful in training autoencoders from the reference dataset for detecting anomalies in both Sites A and B. However, Feature Set 4 is very bad for Site A. However, it is very helpful in transfer learning from the Reference dataset to Site B, which gives the same best F1 score of 98.36% as in Table 9. This shows the effectiveness of transfer learning using autoencoders even when the two datasets are collected from the traffic generated by different devices. The training time for the reference dataset is longer for both Feature Sets 3 and 4 since it is much larger in size.
5. Discussion
In our experiments of device identification on real data collected from our target factory, we can effectively distinguish between three most commonly used types of devices: computers, controllers, and robotic arms. The proposed approach achieved the best multiclass classification accuracy of 97.6% and micro-averaging F1 score of 97.6% when we use XGBoost for feature selection and an ordinary neural network for classification. Due to the imbalanced data distribution in three classes, the “robotic arm” class has a lower F1 score which reduced the macro-averaging F1 score to 87.6%. To identify devices in practice, an “All-versus-All” approach to train a binary classifier for each pair of device types is needed to improve classification performance for minority classes. With the incremental nature of neural networks as the classification model, it will be easier to apply to more device types. There is no need to re-train all models. When a new device type is added, we simply need to manually label and train the new model. This makes the solution more feasible in practice.
From our experimental results of simulated attacks on real devices in our target sites, we compared the performance of anomaly detection using different feature sets in Modbus TCP packets that were generated from different devices. In summary, the proposed method of anomaly detection using autoencoders achieves the best F1 score of 98.36% when we utilize Feature Set 4 for Site B and the best F1 score of 57.23% for Feature Set 3 in Site A. On the other hand, in the case of very imbalanced datasets, since the goal of anomaly detection is to find out as many abnormal cases as possible, recall values should be more important. The best recall values can be achieved when Feature Set 4 is used for both Sites A and B. The best recall values are 94.23% and 98.36% for Sites A and B, respectively. Furthermore, from our experiments on using autoencoders for transfer learning, the best performance of 98.36% in the F1 score can be achieved when learning autoencoders with the reference dataset for our target Site B. This shows the potential of our proposed approach for anomaly detection. More types of malicious patterns are needed to justify the performance of the proposed method in anomaly detection.
For anomaly detection, any feature extracted from the data fields could influence the models learned by machine learning. From a single packet, sudden deviation could reflect possible anomalies or some rare events that are normal. Furthermore, anomalous packets could possibly masquerade as normal ones by imitating their behaviors. To effectively distinguish between anomaly and normal events, we choose to learn the aggregate behaviors from multiple packets. In practical contexts, this would be able to satisfy most ordinary cases. However, it is still possible for misclassification to occur. Since our model is based on incremental learning, a single sudden deviation will not greatly affect the detection.
In this paper, we only focused on the packets in Modbus over TCP protocol. Different protocols such as MQTT and SCADA transmit packets in different formats with different expressiveness, the traffics signatures will certainly change. By adding more protocols to the system, we will be able to learn different features that are more complex and very different from Modbus protocols. However, in a typical IoT environment, it is not practical to implement all possible protocols since there are only a limited number of working protocols supported in these devices and applications. Other protocols can be ignored since they are usually neglected in the IoT applications such that no responses from devices means no possible attacks from the outside.
In addition to smart factories, our proposed approach can be easily deployed in any IoT environments without complex configurations. In our implementation, we integrate device identification module and packet filtering module on the same embedded sensor, which can be simply connected to the same local area network to begin monitoring and detection. It can facilitate the easy deployment of anomaly detection systems in existing IoT environments.
In the future, we plan to include more diverse device types in addition to computers, controllers, and robotic arms. For example, in different IoT scenarios such as smart homes or smart healthcare, we might consider environment sensors for air quality or tele-homecare using cameras or medical monitors for vital signs, to name a few. Since the behaviors of these devices could be very different, the traffic generated is also very different. Furthermore, various network protocols in different formats could carry different traffic. These affect the features for supervised and unsupervised learning for anomaly detection. Instead of binary classification of normal and malicious behaviors, multiclass classification of different types of attacks will be more challenging.
6. Conclusions
In this paper, we have proposed a supervised device type identification method and a deep learning approach using autoencoders for anomaly detection and transfer learning in IoT. First, with real data collected from smart factories, we can effectively detect various device types by their network responses using multiclass classification models of neural networks. Second, for each identified device type, we can learn their normal behaviors using autoencoders and deploy them in our embedded sensor for anomaly detection. By using the simulated malicious attacks on real devices in our target factory, we can effectively distinguish between normal and abnormal behaviors based on packet responses using autoencoders. The best F1 score of 98.36% can be obtained. By using autoencoders, we can demonstrate the effectiveness of our proposed approach for transfer learning. Autoencoders learned from the reference dataset can be used to detect anomalous traffic on our target site with comparable performance. This shows the potential of our proposed machine learning approach to supervised device identification and unsupervised learning using autoencoders for anomaly detection. Further investigation is needed to test the performance for more device types and malicious behaviors in different IoT scenarios.
Author Contributions
Conceptualization, T.-Y.H. and J.-H.W.; methodology, T.-Y.H. and J.-H.W.; validation, T.-Y.H. and J.-H.W.; resources, P.-C.C.; data curation, P.-C.C.; writing—original draft preparation, J.-H.W.; writing—review and editing, J.-H.W.; supervision, C.-W.T. and T.-Y.H.; project administration, P.-C.C. and J.-H.W.; funding acquisition, C.-W.T. All authors have read and agreed to the published version of the manuscript.
Funding
This work was partially funded by the research grants of the Ministry of Science and Technology, Taiwan under the grant number MOST109-2221-E-027-090, partially funded by the National Applied Research Laboratories, Taiwan under the grant number of NARL-ISIM-109-002, and partially funded by the “Artificial Intelligence Oriented for Cyber Security Technology Collaboration Project (1/4)” of the Institute of Information Industry, Taiwan.
Institutional Review Board Statement
Not applicable.
Informed Consent Statement
Not applicable.
Data Availability Statement
The data presented in this study are available on request from the corresponding author. The data are not publicly available due to privacy concerns as stated in the Instagram Data Policy.
Acknowledgments
This study is conducted under the “Artificial Intelligence Oriented for Cyber Security Technology Collaboration Project (1/4)” of the Institute of Information Industry which is subsidized by the Ministry of Economic Affairs of the Republic of China.
Conflicts of Interest
The authors declare no conflict of interest.
References
- Pappu, R.S. Physical One-Way Functions. Ph.D. Thesis, Massachusetts Institute of Technology, Cambridge, MA, USA, 2001. [Google Scholar]
- Huang, Z.; Wang, Q. A PUF-based unified identity verification framework for secure IoT hardware via device authentication. World Wide Web J. 2020, 23, 1057–1088. [Google Scholar] [CrossRef]
- Miettinen, M.; Marchal, S.; Hafeez, I.; Sadeghi, A.; Asokan, N.; Tarkoma, S. IoT Sentinel: Automated Device-Type Identification for Security Enforcement in IoT. In Proceedings of the 2017 IEEE 37th International Conference on Distributed Computing Systems (ICDCS 2017), Atlanta, GA, USA, 5–8 June 2017; pp. 2177–2184. [Google Scholar]
- Shahid, M.R.; Blanc, G.; Zhang, Z.; Debar, H. IoT Devices Recognition Through Network Traffic Analysis. In Proceedings of the IEEE International Conference on Big Data (BigData 2018), Seattle, WA, USA, 10–13 December 2018; pp. 5187–5192. [Google Scholar]
- Ngo, M.V.; Chaouchi, H.; Luo, T.; Quek, T.Q.S. Adaptive Anomaly Detection for IoT Data in Hierarchical Edge Computing. In Proceedings of the AAAI Workshop on Artificial Intelligence of Things (AIoT), New York, NY, USA, 7–8 February 2020. [Google Scholar]
- Alrashdi, I.; Alqazzaz, A.; Aloufi, E.; Alharthi, R.; Zohdy, M.; Ming, H. AD-IoT: Anomaly Detection of IoT Cyberattacks in Smart City Using Machine Learning. In Proceedings of the IEEE 9th Annual Computing and Communication Workshop and Conference (CCWC), Las Vegas, NV, USA, 7–9 January 2019; pp. 305–310. [Google Scholar]
- Hasan, M.; Islam, M.; Zarif, I.I.; Hashem, M. Attack and anomaly detection in IoT sensors in IoT sites using machine learning approaches. Internet Things 2019, 7, 100059. [Google Scholar] [CrossRef]
- Diro, A.A.; Chilamkurti, N. Distributed attack detection scheme using deep learning approach for Internet of Things. Future Gener. Comput. Syst. 2018, 82, 761–768. [Google Scholar] [CrossRef]
- Koroniotis, N.; Moustafa, N.; Sitnikova, E.; Turnbull, B. Towards the development of realistic botnet dataset in the internet of things for network forensic analytics: Bot-iot dataset. Future Gener. Comput. Syst. 2019, 100, 779–796. [Google Scholar] [CrossRef] [Green Version]
- Yang, Q.; Jia, X.; Li, X.; Feng, J.; Li, W.; Lee, J. Evaluating Feature Selection and Anomaly Detection Methods of Hard Drive Failure Prediction. IEEE Trans. Reliab. 2021, 70, 749–760. [Google Scholar] [CrossRef]
- Injadat, M.N.; Moubayed, A.; Nassif, A.B.; Shami, A. Multi-Stage Optimized Machine Learning Framework for Network Intrusion Detection. IEEE Trans. Netw. Serv. Manag. 2021, 18, 1803–1816. [Google Scholar] [CrossRef]
- Di Mauro, M.; Galatro, G.; Fortino, G.; Liotta, A. Supervised Feature Selection Techniques in Network Intrusion Detection: A Critical Review. Eng. Appl. Artif. Intell. 2021, 101, 104216. [Google Scholar] [CrossRef]
- Belgrana, F.Z.; Benamrane, N.; Hamaida, M.A.; Chaabani, A.M.; Taleb-Ahmed, A. Network Intrusion Detection System Using Neural Network and Condensed Nearest Neighbors with Selection of NSL-KDD Influencing Features. In Proceedings of the 2020 IEEE International Conference on Internet of Things and Intelligence System (IoTaIS), BALI, Indonesia, 27–28 January 2021; pp. 23–29. [Google Scholar]
- Sakurada, M.; Yairi, T. Anomaly detection using autoencoders with nonlinear dimensionality reduction. In Proceedings of the Pacific Rim International Conference on Artificial Intelligence (PRICAI), Workshop on Machine Learning for Sensory Data Analysis (MLSDA), Gold Coast, Australia, 2 December 2014; pp. 4–11. [Google Scholar]
- Lee, J.; Pak, J.; Lee, M. Network Intrusion Detection System using Feature Extraction based on Deep Sparse Autoencoder. In Proceedings of the 2020 International Conference on Information and Communication Technology Convergence (ICTC), Jeju, Korea, 21–23 October 2020; pp. 1282–1287. [Google Scholar]
- Wang, J.H.; Septian, T.W. Combining Oversampling with Recurrent Neural Networks for Intrusion Detection. In Proceedings of the 26th International Conference on Database Systems for Advanced Applications (DASFAA 2021) Workshops, Virtual, Taipei, Taiwan, 11–14 April 2021; pp. 305–320. [Google Scholar]
- Anton, S.D.D.; Kanoor, S.; Fraunholz, D.; Schotten, H.D. Evaluation of Machine Learning-based Anomaly Detection Algorithms on an Industrial Modbus/TCP Data Set. In Proceedings of the 13th International Conference on Availability, Reliability and Security (ARES 2018), Hamburg, Germany, 27–28 April 2018; pp. 1–9. [Google Scholar]
- Zolanvari, M.; Teixeira, M.A.; Gupta, L.; Khan, K.M.; Jain, R. Machine Learning-Based Network Vulnerability Analysis of Industrial Internet of Things. IEEE Internet Things J. 2019, 6, 6822–6834. [Google Scholar] [CrossRef] [Green Version]
- Schölkopf, B.; Platt, J.C.; Shawe-Taylor, J.C.; Smola, A.J.; Williamson, R.C. Estimating the support of a high-dimensional distribution. Neural Comput. 2001, 13, 1443–1471. [Google Scholar] [CrossRef]
- Liu, F.T.; Ting, K.M.; Zhou, Z.-H. Isolation Forest. In Proceedings of the 2008 Eighth IEEE International Conference on Data Mining, Pisa, Italy, 15–19 December 2008; pp. 413–422. [Google Scholar]
- Aggarwal, C.C.; Sathe, S. Theoretical Foundations and Algorithms for Outlier Ensembles. ACM SIGKDD Explor. Newsl. 2015, 17, 24–47. [Google Scholar] [CrossRef]
- Kingma, D.P.; Ba, J. Adam: A Method for Stochastic Optimization. In Proceedings of the 3rd International Conference on Learning Representations ICLR 2015, San Diego, CA, USA, 7–9 May 2015; pp. 1–15. [Google Scholar]
- Anton, S.D.D.; Sinha, S.; Schotten, H.D. Anomaly-based Intrusion Detection in Industrial Data with SVM and Random Forests. In Proceedings of the 2019 International Conference on Software, Telecommunications and Computer Networks (SoftCOM), Split, Croatia, 19–21 September 2019; pp. 1–6. [Google Scholar]
Figure 1.
System architecture of machine learning for device type identification and anomaly detection.
Figure 1.
System architecture of machine learning for device type identification and anomaly detection.

Figure 2.
Data flow diagram for the proposed approach.
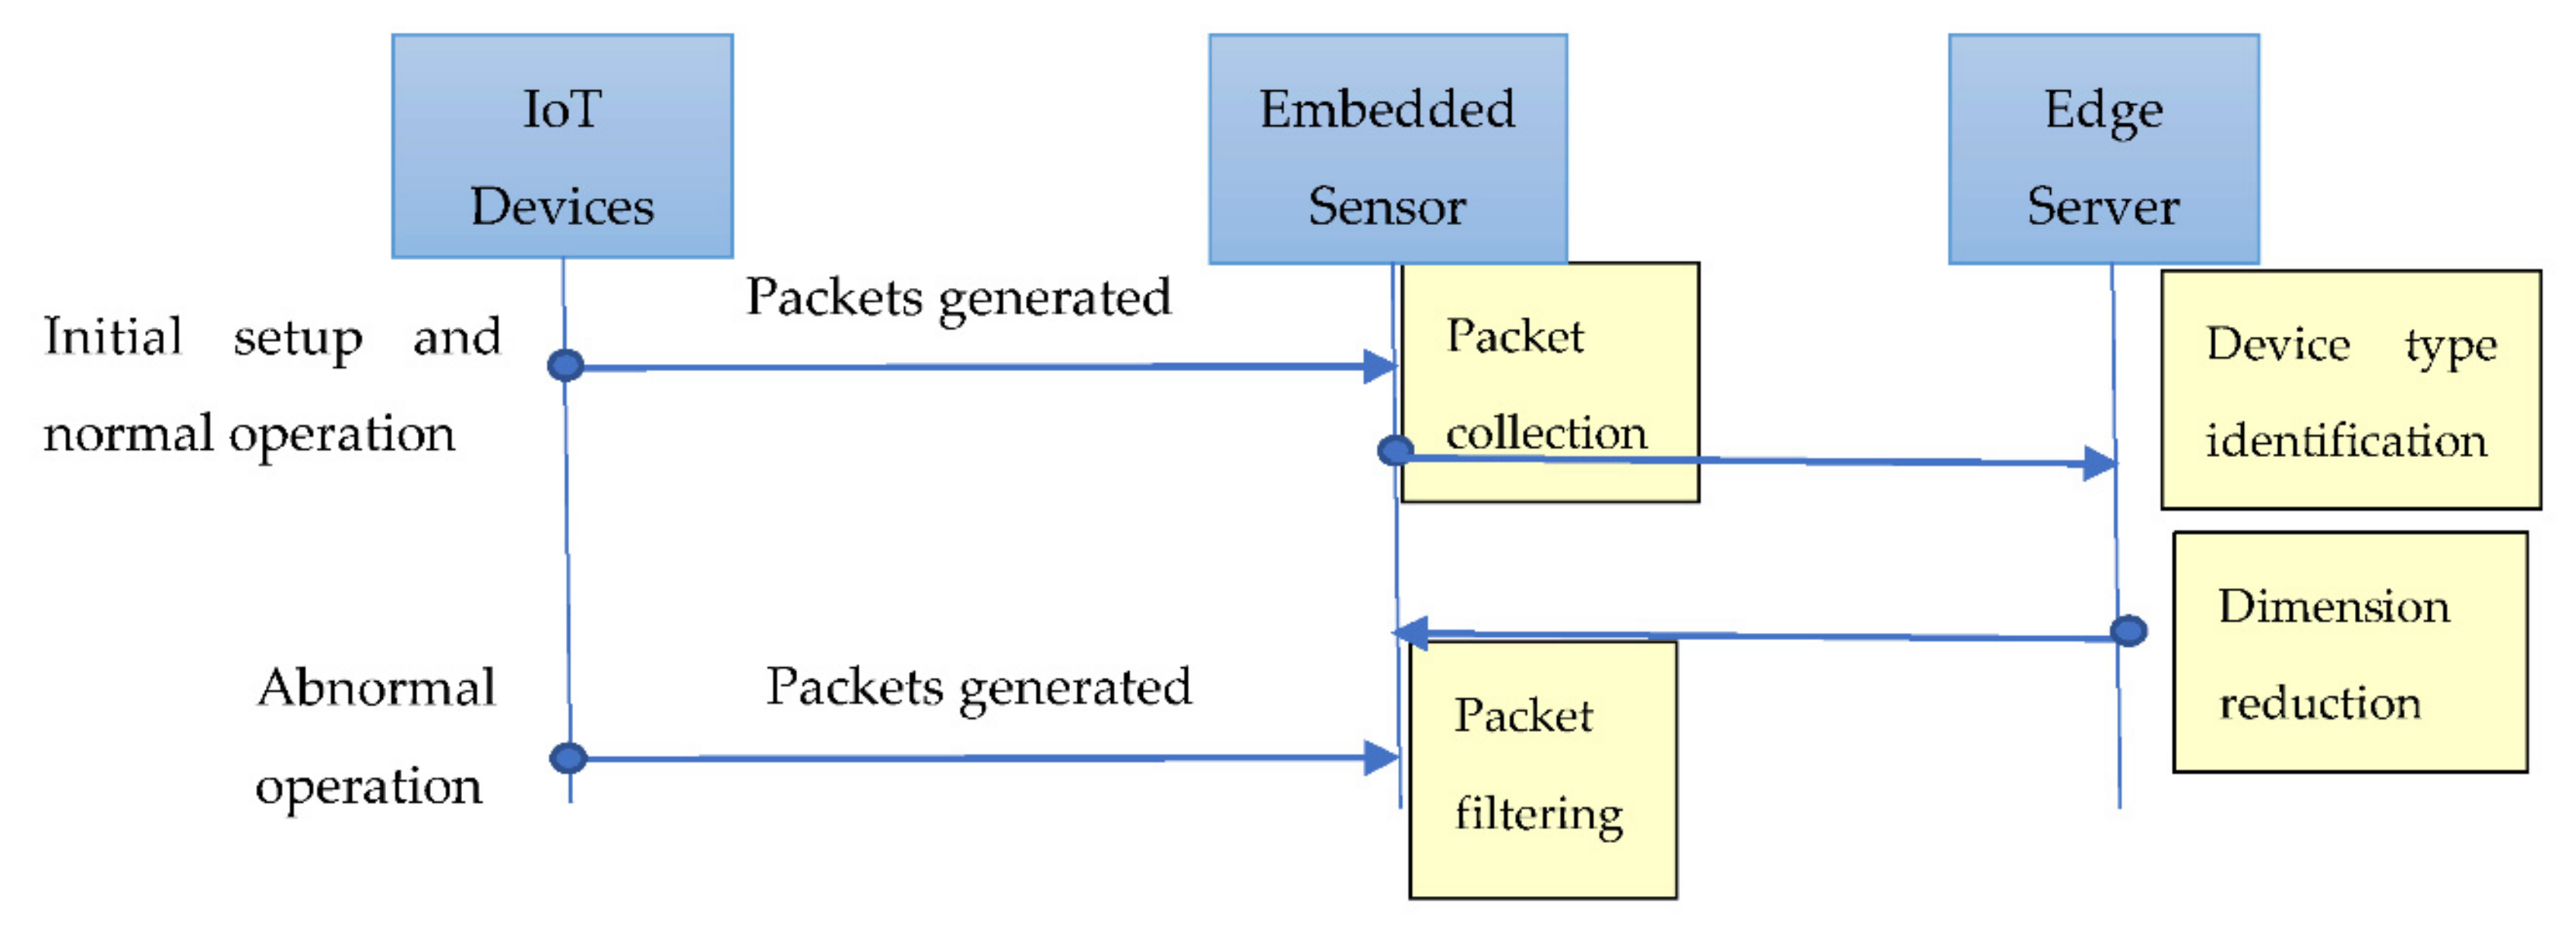
Figure 3.
A simple architecture for autoencoders.


Table 1.
Example packets showing the top 10 features for device identification selected by XGBoost.
| src_port | dest_port | proto | app_proto | tcp | age | bytes | max_ttl | pkts | sepnd_time | label | |
|---|---|---|---|---|---|---|---|---|---|---|---|
| 0 | 55822 | 5355 | 0 | 1 | 1 | 0 | 128 | 1 | 2 | 98,048 | 2 |
| 1 | 49518 | 5355 | 0 | 1 | 1 | 0 | 128 | 1 | 2 | 104,372 | 2 |
| 2 | 61895 | 5355 | 0 | 1 | 1 | 0 | 128 | 1 | 2 | 96,474 | 2 |
| 3 | 51705 | 5355 | 0 | 1 | 1 | 0 | 128 | 1 | 2 | 97,464 | 2 |
| 4 | 61462 | 1947 | 0 | 1 | 1 | 0 | 82 | 128 | 1 | 0 | 2 |
Table 2.
The confusion matrix of device identification result.
| Actual vs. Predicted | Controller | Arm | PC |
|---|---|---|---|
| Controller | 340 | 0 | 2 |
| Arm | 11 | 45 | 18 |
| PC | 3 | 17 | 1710 |
Table 3.
The statistics for the two datasets for anomaly detection: Sites A and B.
| Type | # of Packets in Site A | # of Packets in Site B |
|---|---|---|
| Normal | 22,482 | 19,910 |
| Attack | 103 | 60 |
| Total | 22,585 | 19,970 |
Table 4.
The statistics for the reference dataset for anomaly detection.
| Type | # of Packets |
|---|---|
| Normal | 98,516 |
| Attack | 36,034 |
| Total | 134,550 |
Table 5.
The performance comparison of anomaly detection for the reference dataset using different unsupervised learning methods. Numbers in boldface indicate the best performance among the methods.
Table 5.
The performance comparison of anomaly detection for the reference dataset using different unsupervised learning methods. Numbers in boldface indicate the best performance among the methods.
| Method | Precision | Recall | F1-Score | Accuracy |
|---|---|---|---|---|
| One-class SVM | 74.99 | 66.59 | 70.54 | 85.11 |
| Isolation Forest | 95.14 | 60.28 | 73.8 | 88.54 |
| Autoencoder | 99.89 | 62.33 | 76.76 | 89.9 |
Table 6.
The packet frame format of Modbus TCP protocol.
| Transaction ID | Protocol ID | Length | Address | Function Code | Data Value |
|---|---|---|---|---|---|
| 2 bytes | 2 bytes | 2 bytes | 1 byte | 1 byte | n bytes |
Table 7.
The performance of anomaly detection using Feature Set 1 for Sites A and B.
| Site ID | Precision | Recall | F1-Score | Training Time (s) |
|---|---|---|---|---|
| A | 30.74 | 75.96 | 43.77 | 20.84 |
| B | 95.24 | 32.79 | 48.78 | 17.63 |
Table 8.
The performance of anomaly detection using Feature Set 2 for Sites A and B.
| Site ID | Precision | Recall | F1-Score | Training Time (s) |
|---|---|---|---|---|
| A | 31.25 | 86.45 | 45.92 | 24.06 |
| B | 95.24 | 32.79 | 48.78 | 17.96 |
Table 9.
The performance of anomaly detection using Feature Set 3 for Sites A and B.
| Site ID | Precision | Recall | F1-Score | Training Time (s) |
|---|---|---|---|---|
| A | 43.0 | 85.58 | 57.23 | 26.10 |
| B | 97.56 | 65.57 | 78.43 | 24.25 |
Table 10.
The performance of anomaly detection using Feature Set 4 for Sites A and B. Numbers in boldface indicate the best performance.
Table 10.
The performance of anomaly detection using Feature Set 4 for Sites A and B. Numbers in boldface indicate the best performance.
| Site ID | Precision | Recall | F1-Score | Training Time (s) |
|---|---|---|---|---|
| A | 22.79 | 94.23 | 36.7 | 27.73 |
| B | 98.36 | 98.36 | 98.36 | 21.56 |
Table 11.
The performance of anomaly detection for Sites A and B using autoencoders trained from the reference dataset with Feature Sets 3 and 4. Numbers in boldface indicate the best performance.
Table 11.
The performance of anomaly detection for Sites A and B using autoencoders trained from the reference dataset with Feature Sets 3 and 4. Numbers in boldface indicate the best performance.
| Feature Set | Site ID | Precision | Recall | F1-Score | Training Time (s) |
|---|---|---|---|---|---|
| 3 | A | 42.72 | 84.62 | 56.77 | 98.04 |
| 3 | B | 97.56 | 65.57 | 78.43 | 98.04 |
| 4 | A | 8.43 | 89.42 | 15.41 | 99.28 |
| 4 | B | 98.36 | 98.36 | 98.36 | 99.28 |
Publisher’s Note: MDPI stays neutral with regard to jurisdictional claims in published maps and institutional affiliations. |
© 2021 by the authors. Licensee MDPI, Basel, Switzerland. This article is an open access article distributed under the terms and conditions of the Creative Commons Attribution (CC BY) license (https://creativecommons.org/licenses/by/4.0/).
Share and Cite
MDPI and ACS Style
Tien, C.-W.; Huang, T.-Y.; Chen, P.-C.; Wang, J.-H. Using Autoencoders for Anomaly Detection and Transfer Learning in IoT. Computers 2021, 10, 88. https://0-doi-org.brum.beds.ac.uk/10.3390/computers10070088
AMA Style
Tien C-W, Huang T-Y, Chen P-C, Wang J-H. Using Autoencoders for Anomaly Detection and Transfer Learning in IoT. Computers. 2021; 10(7):88. https://0-doi-org.brum.beds.ac.uk/10.3390/computers10070088
Chicago/Turabian StyleTien, Chin-Wei, Tse-Yung Huang, Ping-Chun Chen, and Jenq-Haur Wang. 2021. "Using Autoencoders for Anomaly Detection and Transfer Learning in IoT" Computers 10, no. 7: 88. https://0-doi-org.brum.beds.ac.uk/10.3390/computers10070088
Note that from the first issue of 2016, this journal uses article numbers instead of page numbers. See further details here.