
Are Papers Asking Questions Cited More Frequently in Computer Science?


Department of Computer Science and Engineering, University of West Bohemia, Univerzitní 8, 30100 Plzeň, Czech Republic
*
Author to whom correspondence should be addressed.
Computers 2021, 10(8), 96; https://0-doi-org.brum.beds.ac.uk/10.3390/computers10080096
Submission received: 8 July 2021
/
Revised: 5 August 2021
/
Accepted: 6 August 2021
/
Published: 9 August 2021
Abstract
:In this article, we test the hypothesis that computer science papers asking questions (i.e., those with a question mark at the end of their title) are cited more frequently than those that do not have this property. To this end, we analyze a data set of almost two million records on computer science papers indexed in the Web of Science database and focus our investigation on the mean number of citations per paper of its specific subsets. The main finding is that the average number of citations per paper of the so-called “asking papers” is greater by almost 20% than that of other papers, and that this difference is statistically significant.
1. Introduction
The impact of research publications is a fundamental feature of every basic research process that is supposed to generate new knowledge and present it in the form of journal articles, conference proceedings, books, book chapters and other visible outputs of scientific publishing. Hardly anyone would like to conduct research without any impact at all on a particular discipline, scientific field, research area, science at large, economy, culture or society as a whole. However, it is not only the scientist who should be displeased with research having no impact, but also (and perhaps foremost) the research funder, be it a research funding organization or the tax payer. In basic research, the established proxy for impact is the number of citations from other scholarly publications (but also from patent applications or the general literature) obtained by research papers resulting from some specific research.
The effects of different characteristics of scholarly papers on their citedness have been the subject of various investigations only relatively recently. Apart from the obvious and straightforward features of every research paper, such as its publication type (e.g., journal article, conference paper, book, book chapter, technical report or dissertation), form (original research article or review article) and venue (journal or conference of different quality and reputation), more complex properties have also been considered, such as the number and reputation of the co-authors, the composition of the author team in terms of their internationality and seniority or the repute of the authors’ institutions and countries. However, this study is concerned with one of the direct attributes of a research paper, namely its title, in the specific field of computer science with which the authors of this article are intimately familiar.
In the following section, we review some of the more recent studies concerned with the effects of various article title properties, such as their length, form or style (including the presence of non-alphanumeric characters), and sometimes of some non-title properties as well, such as the article length, the number of cited references or the citation rates of the articles under investigation. As will be seen, the below analyses focus on diverse scientific disciplines, vary greatly in the size of analyzed data sets and are actually quite inconclusive with respect to the question asked in the title of this present paper, which is a reexamination of the data used in Fiala and Tutoky [1].
2. Related Work
Buter and van Raan [2] explored about half a million paper titles from different scientific disciplines and looked for non-alphanumeric characters in them. They found that the inclusion of some non-alphanumeric characters (such as hyphens and colons) in the titles correlated positively with the impact of papers in general but not in all the specific research fields they investigated (computer science was not included). Dorta-González and Santana-Jiménez [3] studied the bibliographic attributes of some 10,000 papers (including 335 computer science articles) consisting of highly cited and non-highly cited publications and concluded that highly cited papers were longer, cited more references and had slightly shorter titles but longer abstracts.
2.1. Strong Efforts
The title structures of roughly 6000 papers submitted to an ecology journal were the focus of the study conducted by Fox and Burns [4]. They were able to analyze the effect of titles on their success in the editorial process as well as on their post-publication (citation) impact and concluded, among other things, that papers with more specific titles (including a species name) received fewer citations and that questions in titles did not influence the citedness of papers. In turn, Gnewuch and Wohlrabe [5] inspected over 300,000 articles from economy journals and determined that shorter titles and the presence of non-alphanumeric characters both contributed to higher citation counts. On the other hand, no effect of the usage of questions in titles on the citation counts of articles was observed in the study by Hartley and Cabanac [6], but their data set was very tiny (only 100 papers written by J. Hartley). In contrast, Haustein et al. [7] analyzed a set of 1.3 million bibliographic records of papers (from any discipline) and concluded that citation rates were higher for longer papers and for papers with longer lists of cited references.
Letchford et al. [8] were concerned with paper abstracts rather than titles. They investigated the citation counts of 300,000 papers from all fields of science and found that shorter abstracts using frequent words were associated with slightly more impactful papers. Missen et al. [9] analyzed a small collection (below 1000 papers) of science (including computer science) and social science articles and ascertained that publications having titles with question marks were not well cited, but their findings had practically no statistical relevance because the number of such papers in their data set was extremely small. Another small sample of papers (around 550 articles from leading management journals) was explored by Nair and Gibbert [10], and the effects of various title features (such as the length, style and specificity) on citation counts were studied. They determined that non-alphanumeric characters in titles (including question marks) influenced the citation rate of papers negatively, but “interrogative” titles themselves (i.e., those asking a question) had a weakly significant positive correlation with papers’ impacts. However, again, the number of such papers was two small (a few dozen) to allow for generalization. Stevens et al. [11] explored the titles of papers from planning-related journals in a similar quantity as the previous study and concluded that neither their length nor their formulation as a question had a significant influence on the citedness of articles.
An even smaller collection of titles (less than 300 from 40 psychology journals) was analyzed by Subotic and Mukherjee [12], and it was found that the title type (including a question) had no relation to citations and that the title length was correlated slightly negatively with the impact in terms of citations (i.e., shorter titles yielded more citations), but this effect was rather caused by higher journal impact factors. Tahamtan and Bornmann [13] gave a partial overview of research papers’ attributes, including the title length and type, affecting their citation ability, and a more detailed overview of the literature dealing with the characteristics of article titles such as their length or the presence of non-alphanumeric characters in them was provided by Tahamtan et al. [14]. Thelwall [15] investigated the titles of nearly 900,000 articles from 18 Scopus narrow subject areas and found that papers with titles containing rarely used words were associated with lower citation counts. Aside from titles and abstracts, the keywords of articles were also studied, such as in the analysis by Uddin and Khan [16], in which nearly 30,000 papers on obesity were examined and some keyword properties were observed to be positively correlated with citations. A collection of approximately 4500 article titles from psychology journals was inspected by Whissell [17], but the relationship of the titles’ various linguistic characteristics with citation impact was not studied.
2.2. Inconclusive Outcomes
In contrast, a much larger data set comprising about 1.3 million bibliographic records of papers from various scientific domains (including some 130,000 papers from mathematics and computer science) was investigated by Zahedi and Haustein [18]. The authors were concerned with the effects of different article features on their Mendeley readership and citations and determined, among other things, that longer titles resulted in papers with more citations but a smaller readership. Cook and Plourde [19] addressed the specific issue of paper titles structured as questions in almost 8000 articles from 60 journals covering six disciplines, including over 1100 computer science papers. However, they made no attempt at analyzing the effect of questions in titles on the citedness of papers. Keating et al. [20] explored 2400 titles of articles from communication journals, and one of their findings was that papers with questions in titles were more frequently cited than those without a question, but the difference between the mean number of citations per paper of the two paper groups was not statistically significant.
A study by Mongeon et al. [21] dealt with the inclusion of country names in the titles and abstracts of journal articles and found that papers with titles or abstracts including specific country names were generally cited less than papers without any such references. The collection of papers under scrutiny contained hundreds of thousands of records from any discipline except arts and humanities, but their exact number was not disclosed. In the analysis by Pearson [22], the titles of papers from the field of linguistics (over 36,000) were examined in terms of the presence of direct quoted speech, and its usage was detected to affect the impact of papers in a negative manner. Another recent analysis by the same author [23] was concerned with the titles of articles from a specific subfield of linguistics, but the tiny data set included only a few hundred titles. No significant effect by the title length on the citedness of the papers was found, but the inclusion of non-alphanumeric characters in the titles had a significantly negative influence on the citation impact of such articles. Jamali and Nikzad [24] ascertained that articles with interrogative titles were cited less than other articles in their collection of more than 2000 papers under investigation. They also observed that titles including a special non-alphanumeric character (a colon) resulted in the respective papers receiving fewer citations. Stremersch et al. [25] explored a similar number of marketing journal articles and identified that the title length did not affect the citation impact and that special “attention-grabbing” words in paper titles did not increase the number of citations.
The influence on the citedness of the presence of the main conclusion in the titles of almost 800 journal articles from the field of medical research was studied by Annalingam et al. [26] and was found to be insignificant, but the citation counts were reported to be slightly positively correlated with the number of words in the article title. Falagas et al. [27] analyzed some 200 articles from high-impact journals in general medicine and concluded that the article length affected the citation impact positively, but both the title length and the abstract length correlated somewhat negatively with the citation number. A similar study of more than 200 articles from journals in vascular and endovascular surgery by Antoniou et al. [28] confirmed the result of the article length positively affecting citation counts and brought a new finding that papers with titles reporting designs were associated with more citations. Rostami et al. [29] examined about 300 articles in a psychology journal and determined that the title length was not associated with citation rates but that titles with hyphens or colons and keywords distinct from title words resulted in higher citation counts. They also learned that papers with interrogative titles received fewer citations on average but did not report any statistical relevancy in this respect. So et al. [30] inspected data on more than 45,000 papers in the fields of natural sciences, life sciences and engineering and ascertained that the article length had a negative effect on the number of citations attracted, but the number of keywords had a significantly positive influence on the citation impact of papers.
None of the studies above were specifically concerned with computer science, and none dealt with such a large number of papers in a single scientific discipline as this analysis does. Therefore, this article seems to be the first ever large-scale analysis of the titles of computer science papers.
3. Data and Methods
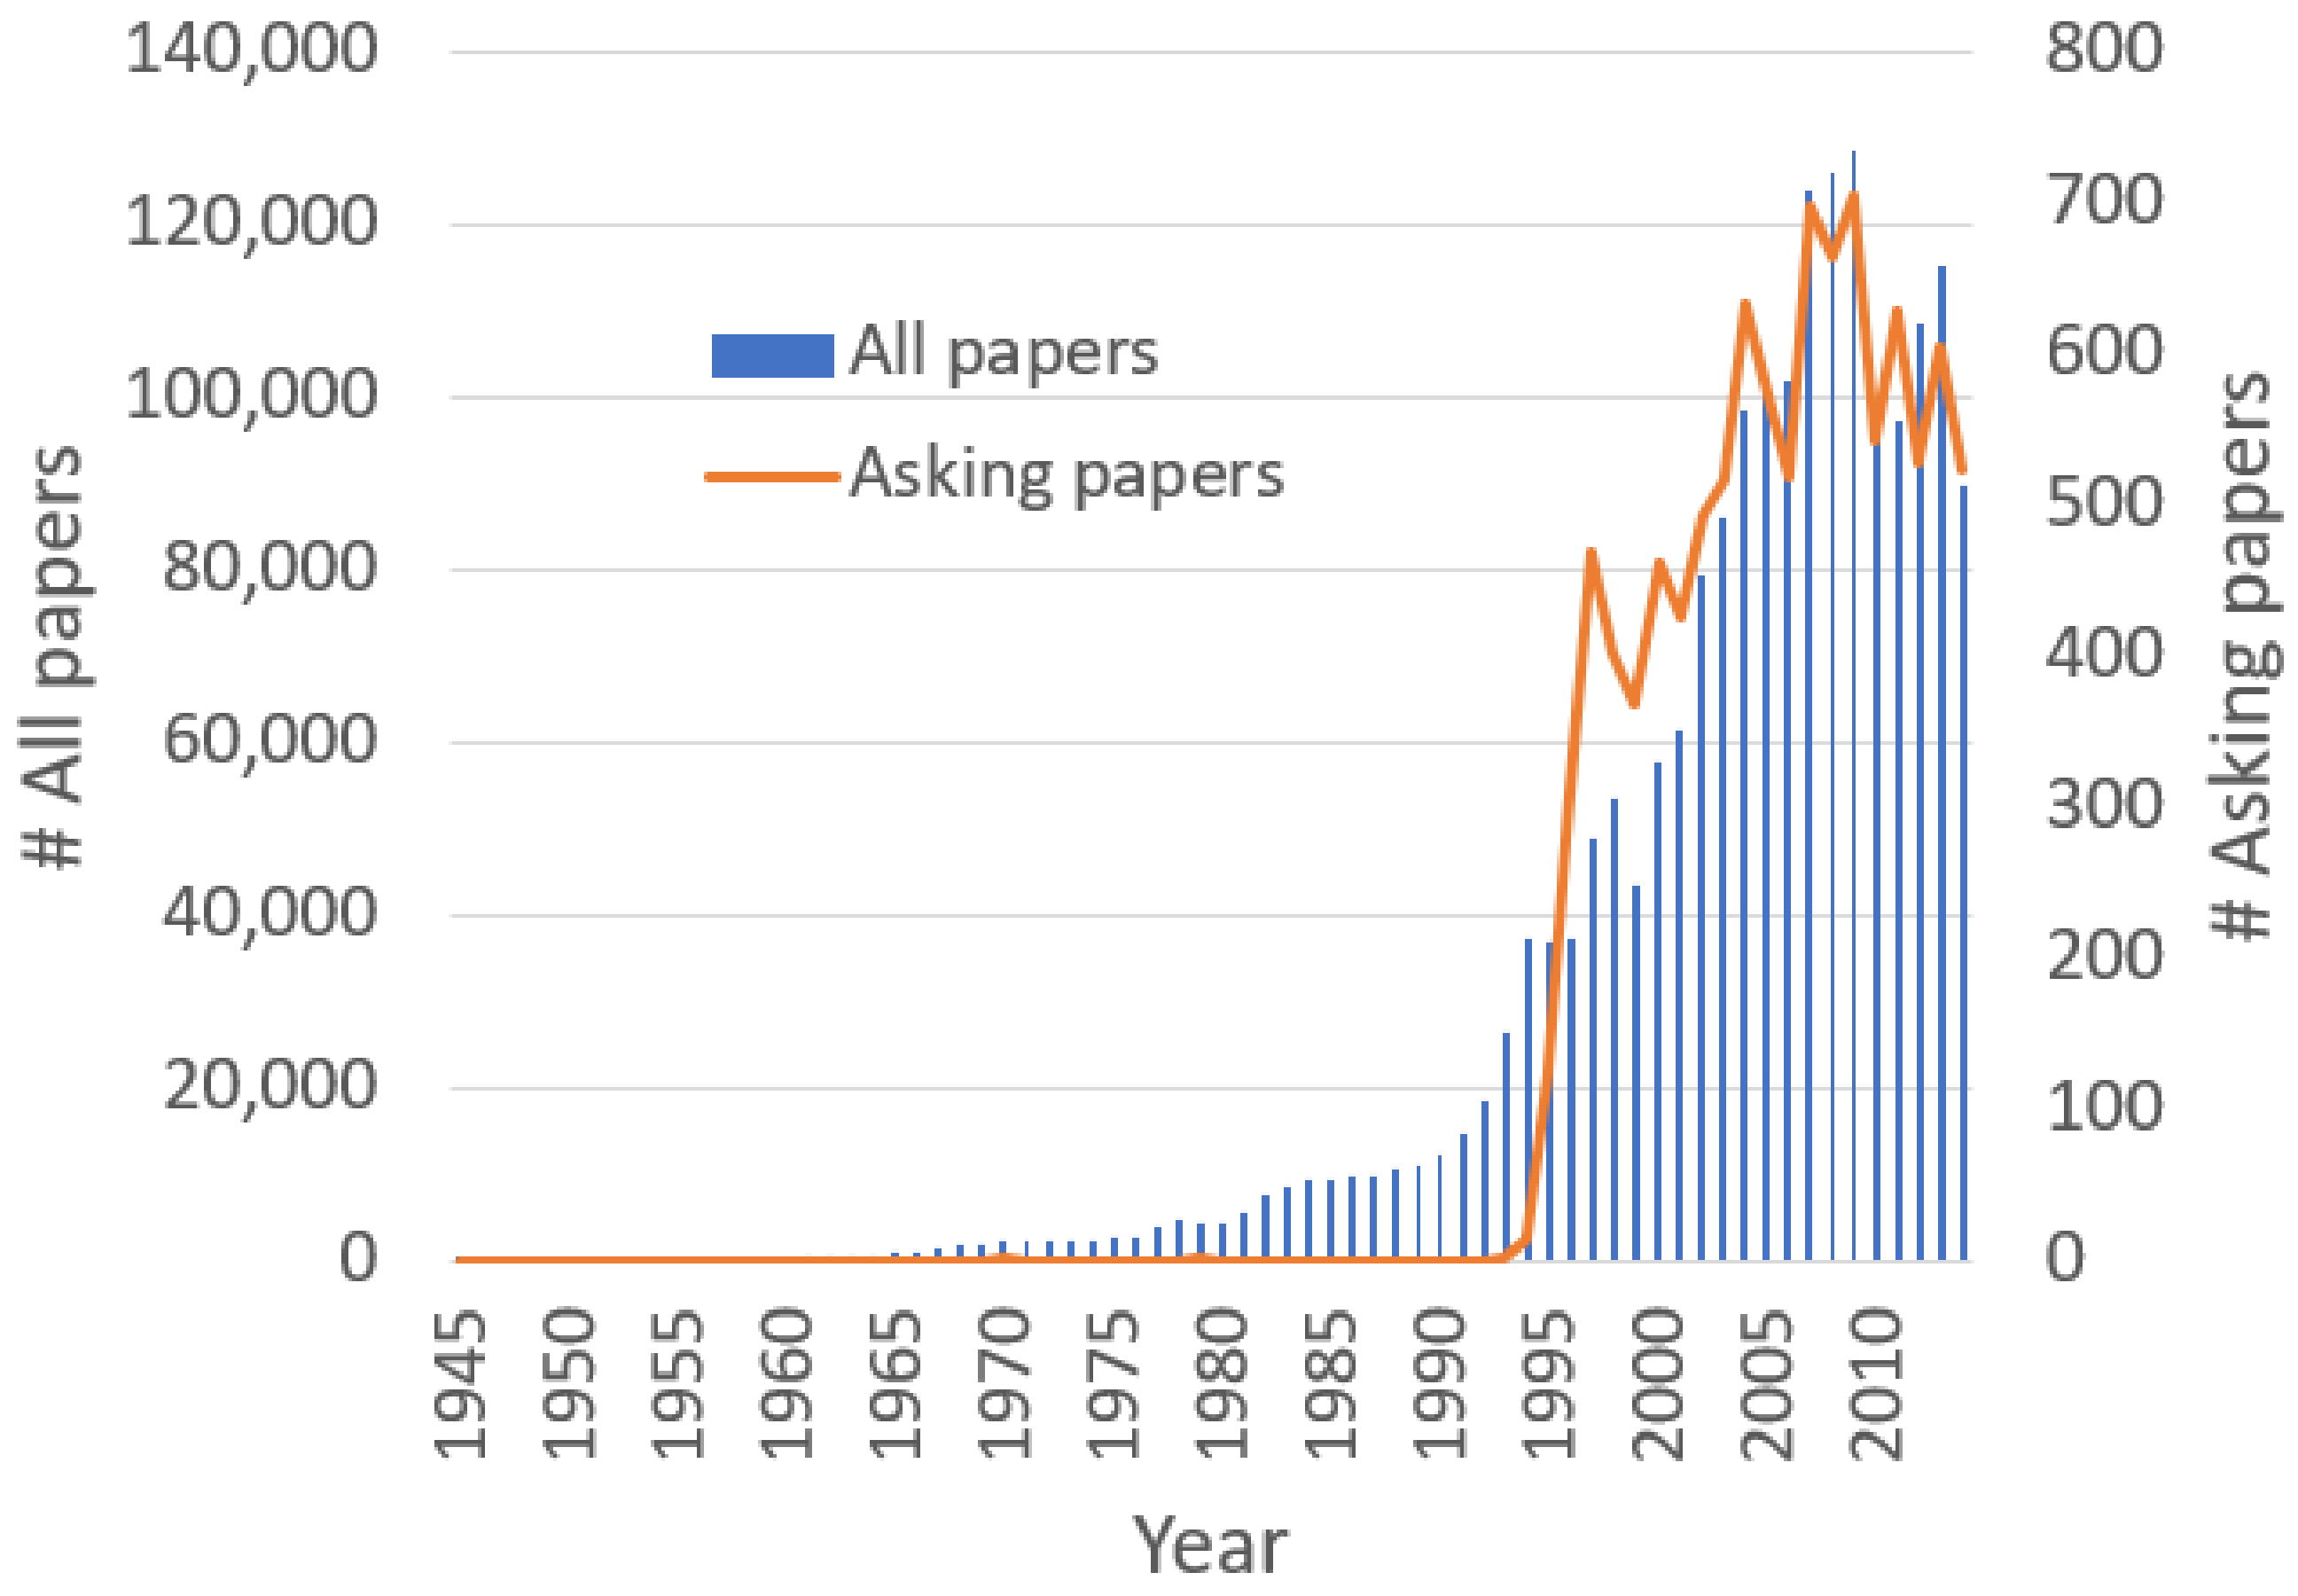
For our data set, we used exactly the same data as in Fiala and Tutoky [1], which consisted of 1,922,652 bibliographic records on journal articles and conference proceedings papers published from 1945 to 2014 indexed in the Web of Science database in the “Computer Science” research area. As the data acquisition took place in August 2015, the citation counts associated with each record thus do not reflect citations made after that date. Since we were primarily interested in papers titled as questions, we extracted paper records with titles ending with a question mark (i.e., “?”) from the basic data set. (Later, we repeated the experiment with question marks appearing anywhere in the title, but the main outcomes did not change.) There was a total of 10,192 such papers in the data set, which corresponded to about 0.53% of just all the papers. This was actually quite a low share of “asking papers” in all the papers, which was, however, not equal over the whole period from 1945 to 2014 and tended to increase in later years, as can be seen in Figure 1. In that figure, the absolute numbers of all papers and asking papers in individual years are plotted, and it is clearly visible that until around 1993, there had been practically no asking papers at all. That number began rising in the late 1990s, going into the hundreds per year and peaking at 704 in 2009, but the overall number of computer science papers grew too, achieving its high with 128,219 publications in that very same year. This means a tiny percentage of asking papers was present in 1993 (0.01%), followed by their largest share in 1997 (0.97%) and their gradual decline to a share of about 0.55% in 2009 and later on.
After further considerations, we decided to focus our investigation on the time range of 2000–2009, because this was a complete decade with a slightly larger percentage of asking papers in all papers (roughly 0.59%), and even the more recent papers still had time (more than 5 years) to accrue citations until 2015, when the citation data were cut off. At the same time, we also had a look at the paper titles ending with exclamation marks (i.e., “!”) and created complementary data sets for “asking papers” and “exclamatory papers” in the time period under investigation (2000–2009) (i.e., “non-asking papers” and “non-exclamatory papers”). In this way, along with “all papers” in that period, we obtained five data sets whose basic descriptive statistics are presented in Table 1.
4. Results and Discussion
4.1. Whole Period: 2000–2009
The largest data set was thus “all papers”, with 963,519 records and an average number of citations per paper (mean times cited) of 5.99. Out of all these papers, there were 5682 “asking papers”, with an average citation count per paper of 7.14. It is interesting to note that although these two paper sets had not so distinct standard deviations of their citation counts distributions (43.78 vs. 36.82), which indicates a similar degree of dispersion of the observed citation counts around the mean value, all papers had a much higher skewness value (125.07) than the asking papers (28.79), and the asking papers had a median times cited count of 1, unlike that of 0 for all papers (and actually all other paper sets). While the higher skewness of all papers suggests a much longer right tail of the citation distribution consisting of many papers with no citations compared with the asking papers, the values of the zero medians for most groups of papers in Table 1 are in accordance with the percentages of the cited papers shown in the last column of the same table, in which only the asking papers had the share of papers cited greater than one half (50.44%) at least once.
When asking papers were removed from all papers, there were 957,837 remaining papers, and this set of papers was called “non-asking papers”, having similar characteristics as the all papers group. The main question then arose of whether the difference between the mean values of the citations per paper of the asking papers and non-asking (or all) papers was large enough that we might conclude that papers with a question mark at the end of their titles were cited more frequently on average than other papers. Thus, the null hypothesis H0: µasking = µnon-asking should be tested, where µ is the mean citation count per paper in each respective group of papers. To this end, one may apply the non-parametric Mann–Whitney U test in R (or any other statistical package) to see that the difference between 7.14 and 5.99 as the mean citations per paper of the two groups of investigated papers is indeed statistically significant at the 0.05 (and even 0.001, because p = 0.00001) level. This means that one may claim that asking papers are cited more frequently than other papers in computer science.
Similarly, the difference between 10.73, which was the mean number of citations per paper of the 253 exclamatory papers in the collection, and 5.99, which was the corresponding value for all papers as well as non-exclamatory papers, was also found to be statistically significant at the 0.001 level (p = 0.0194). Thus, papers whose titles ended with an exclamation mark were also cited more frequently (almost twice as much) than those that did not. However, the number of exclamatory papers was much smaller than that of asking papers (253 compared with 5682), so this claim is generally weaker than with the asking papers. Finally, if the difference between the mean times cited of the asking and exclamatory papers (7.14 vs. 10.73) were to be tested, it would be statistically significant at the 0.05 level and also at the 0.01 level, but not at the 0.001 level (p = 0.0017). Thus, we may conclude that computer science papers with titles ending with exclamation marks are cited more often that papers with titles ending with question marks. Given the small size of the set of exclamatory papers, however, the hypotheses dealing with them should be tested on larger data to verify the findings.
Of course, there may be many other factors affecting the citedness of asking papers, such as the quality of the publication outlets, number of co-authors, prestige of those authors’ affiliations (institutions), their countries of origin or the seniority of the authors. Inspecting all these factors was beyond the scope of our study, but we did look into the impact factors of journals publishing asking papers. Overall, around 63.2% of all papers and 67.2% of the asking papers were journal articles. Out of these journal articles, the average impact factor (according to the 2014 Journal Citation Reports, which were the most recent impact factors at the time we acquired the data on papers) of journals publishing all papers was 1.243, and that of journals publishing asking papers was 1.286. This indicates roughly a 3.5% increase in the impact factor of the asking papers’ journals compared with the impact factor of the all papers journals. By contrast, the growth in citedness was almost 20% between the all and asking papers (from 5.99 citations per paper to 7.14), and thus it seems very improbable this was caused by the slightly better quality of the publishing journals.
4.2. Individual Years
An objection to the mean citation counts of papers, mentioned in Table 1, might be that they were calculated over the whole 2000–2009 period and, therefore, may be biased toward asking papers, provided they were concentrated more at the beginning of the period and thus had a larger citation window at their disposal. One might argue that if the distribution of the asking papers was more even throughout the period under study, or if their concentration was denser toward the end of that period, their mean citation count (7.14) would decrease due to the smaller citation window and would get closer to the average citation count of all papers (5.99). To dispel these concerns, we needed to have a look at the year-normalized citation counts. (We did not consider field-normalization as necessary because all the papers under study were from one scientific field—computer science—and a further division into subfields of computer science did not appear to be meaningful.) To this end, Table 2 shows the counts of all papers and the asking papers and their mean times cited in the individual years from 2000 to 2009.
We can see in Table 2 that the number of all papers grew from 57,750 to 128,219 between 2000 and 2009, and correspondingly, the number of asking papers rose from 461 to 704 in the same period, producing a share of 0.80% at the beginning and 0.55% at the end of the time range. The mean citation count of all papers was 9.02 in 2000, and then it gradually declined (with the exception of 2003) to reach only 3.95 in 2009. These mean citation counts of all papers represented the baseline by which the mean times cited of the asking papers would be normalized (divided). The average citations per paper of the asking papers was actually smaller than the baseline in 2000 and 2001 (7.23 compared with 9.02 and 5.30 compared with 8.99, respectively), but it was greater in all subsequent years starting with 2002. The larger mean citation counts (be it in all papers or in asking papers) are highlighted in bold italics in the table. Even more visible is the higher citedness of the asking papers when the normalized mean citation counts are considered. These are below 1 in 2000 and 2001, as expected, but they are 1.11 in 2002, well over 1 in all other years and reach up to 1.70 in 2006. This means that those 518 asking papers in 2006 achieved on average 70% more citations than all the papers from the very same year. The last column in Table 2 shows the p-value from the statistical hypothesis testing of the difference between the mean citation counts of the two respective groups of papers. It can be seen that this difference was statistically significant only in 2005, 2008 (each at the 0.01 level) and 2009 (at the 0.001 level), where the p-value is highlighted in bold face. Again, as earlier, we calculated the values from Table 2 for the non-asking papers instead of all papers in order to have two truly independent sets of papers, but the main results remained the same.
4.3. Citation Distributions
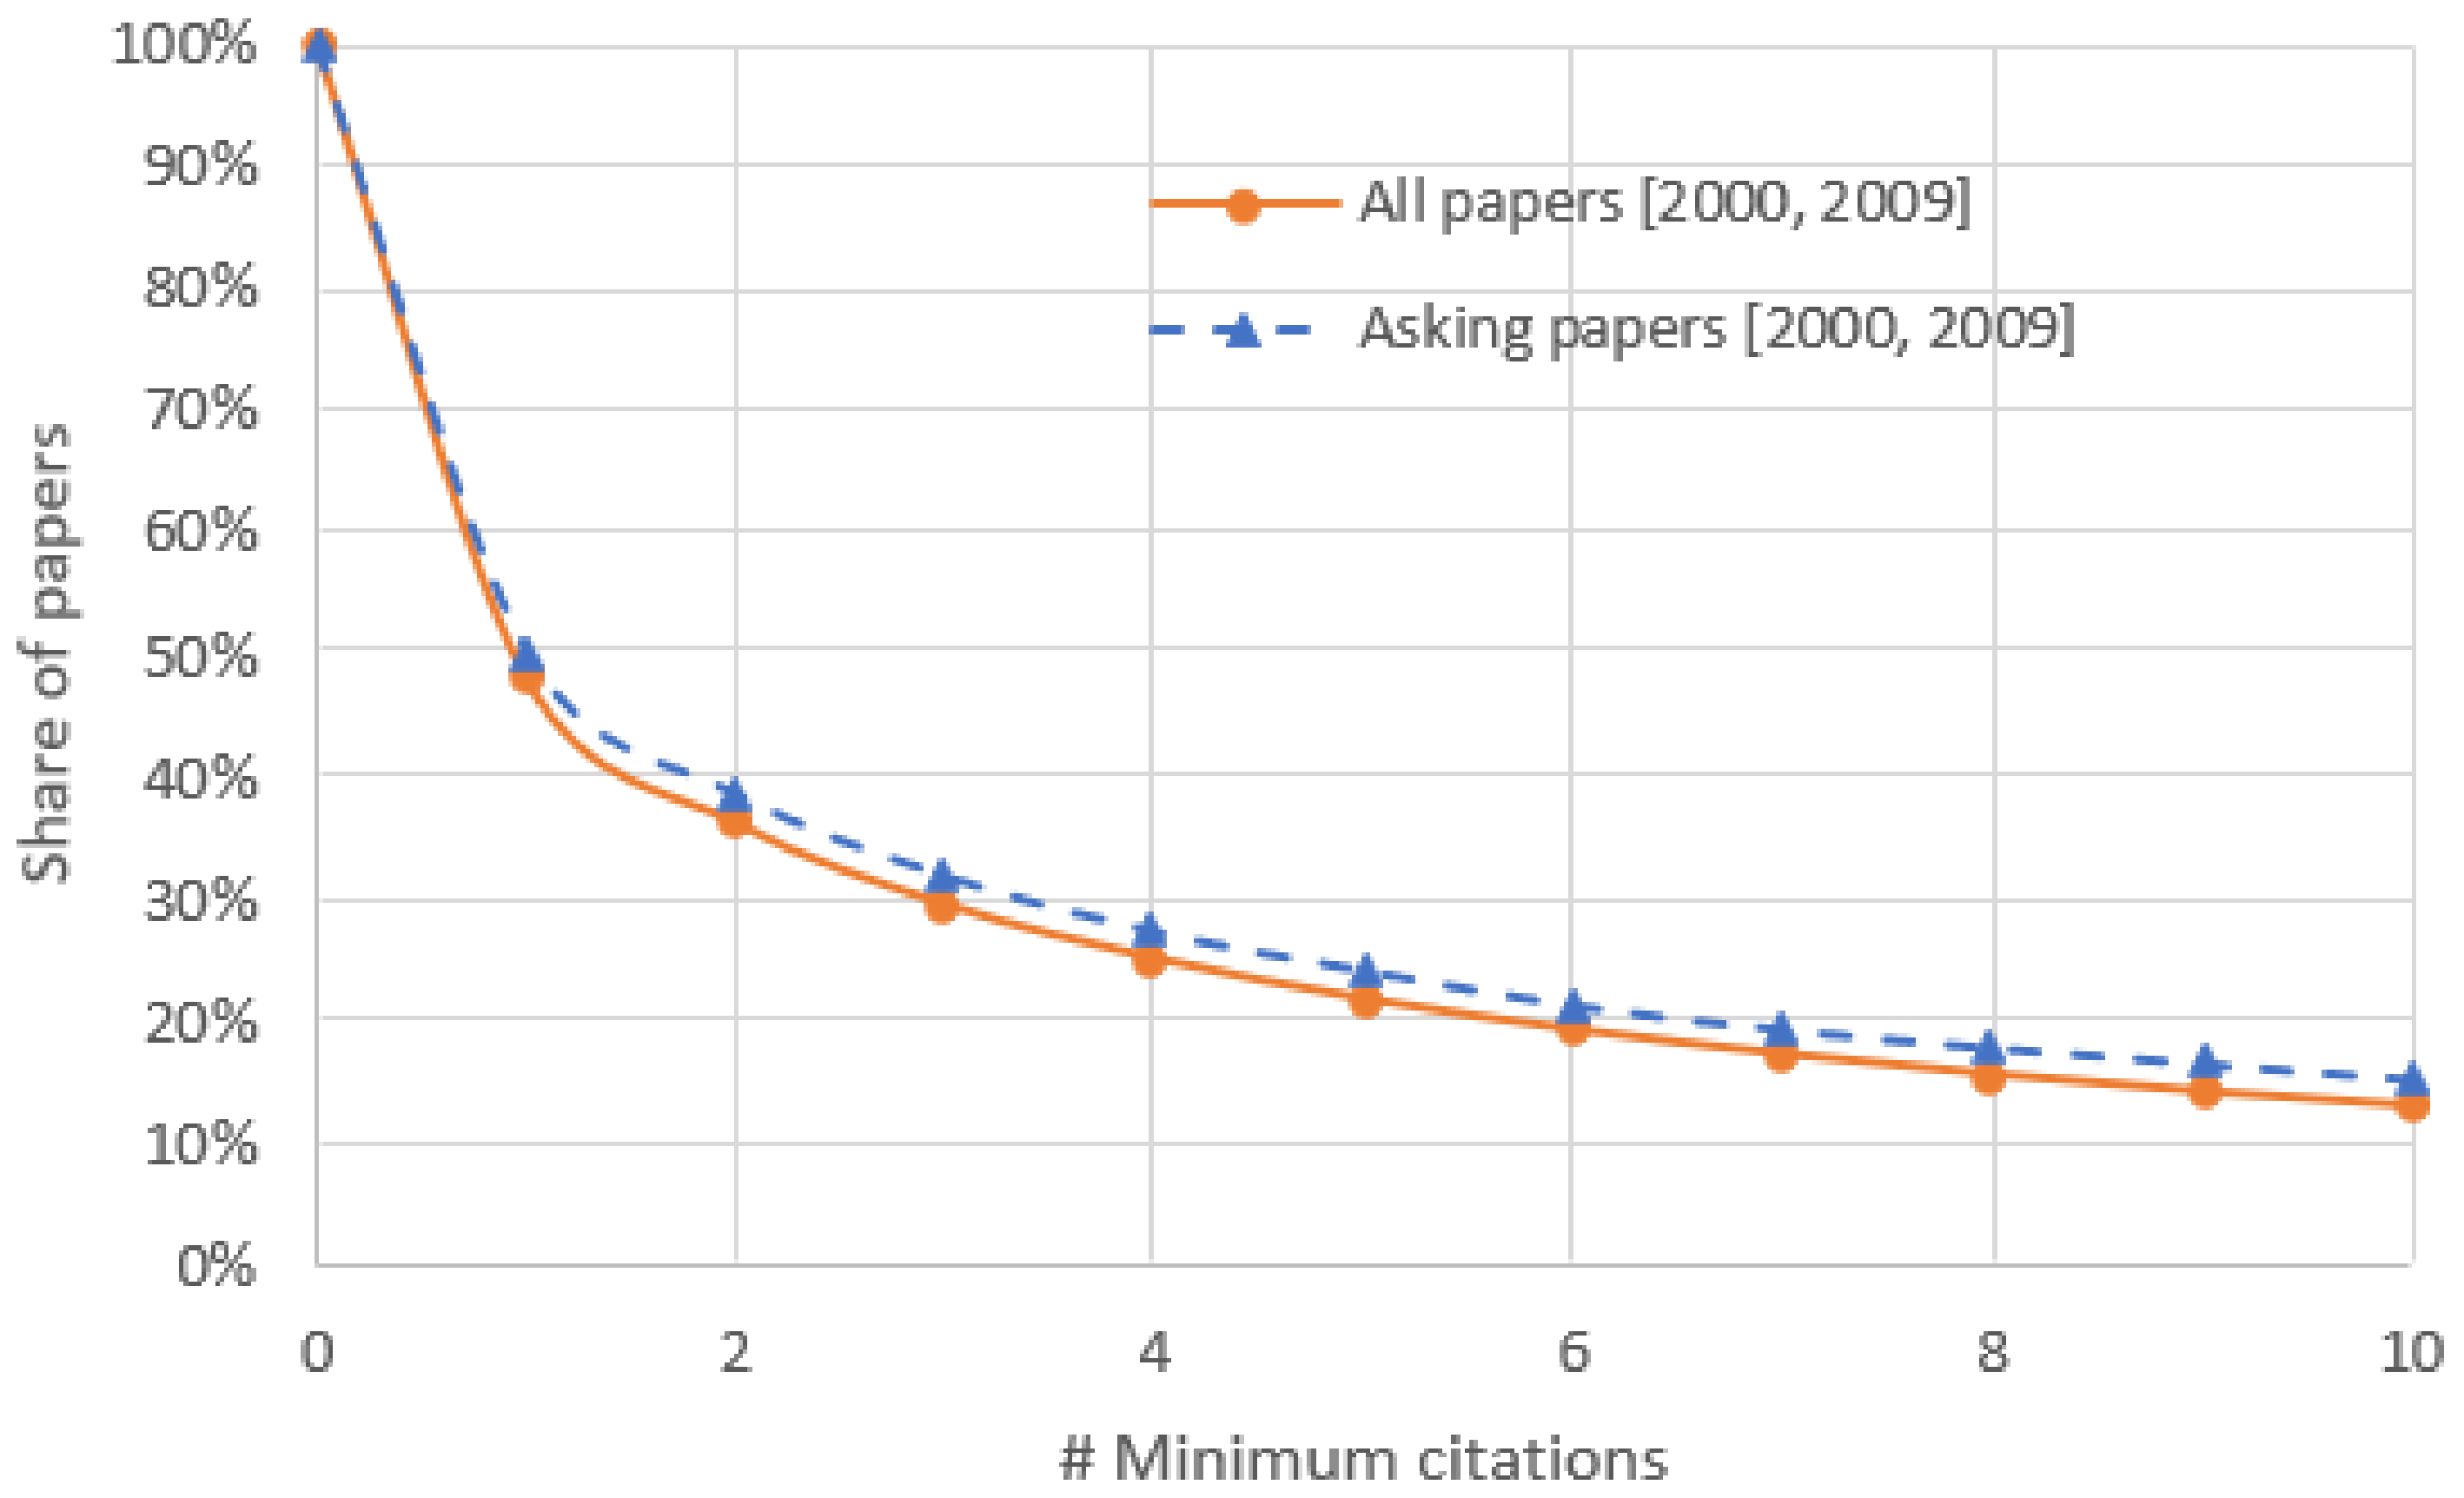
As we have shown in the previous section, there is almost no difference between the set of all papers and non-asking papers in terms of the attributes displayed in Table 1, and therefore, Figure 2 depicts how asking papers differed from all papers based on the minimum number of citations the respective papers received. The share of asking papers obtaining at least a certain amount of citations was always larger than that of all papers, as can be seen from the blue dashed line representing asking papers, which is always (starting with minimum citations equal to one) above the solid line representing all papers. For instance, the percentage of asking papers having 2 citations at least was 38.72%, which was more than the 36.32% of all papers that had the same minimum number of citations, and the shares were 27.40% vs. 25.26%, respectively, for at least 4 citations, 21.33% compared with 19.45%, respectively, for at least 6 citations and so on.
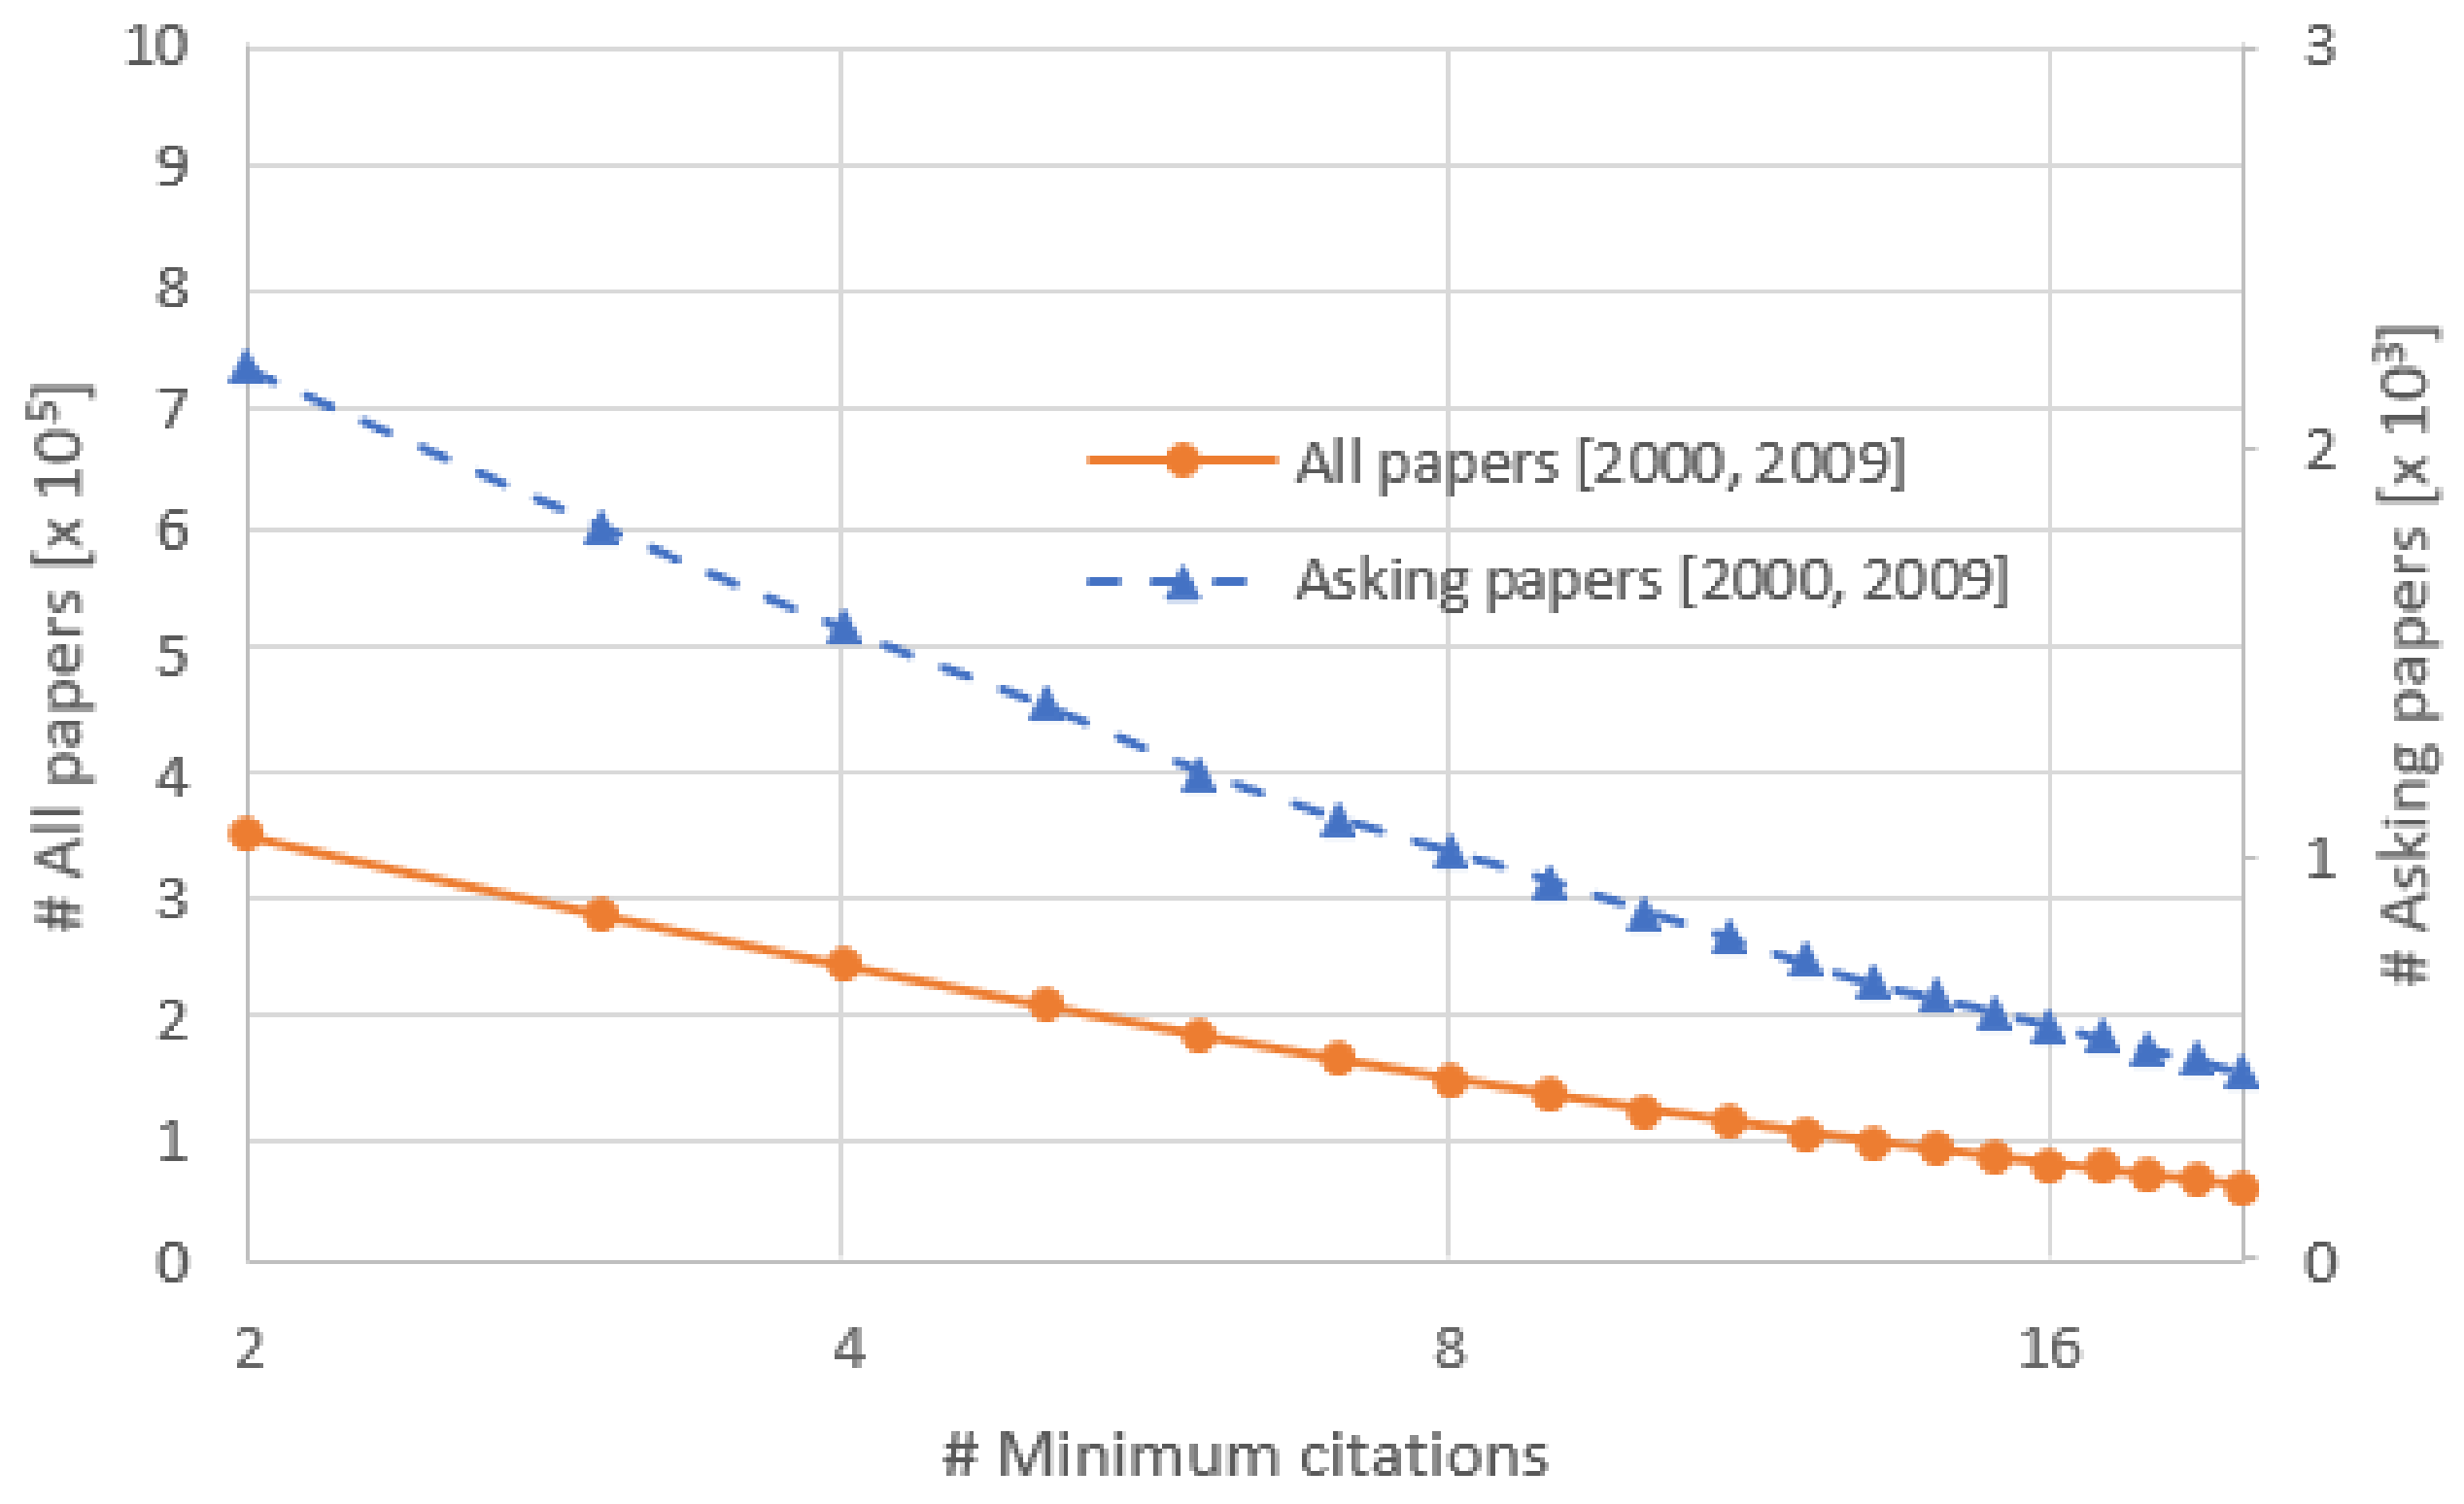
Similarly, Figure 3 displays the exact number of papers with a specific minimum citation count for both groups of papers. As the total number of papers in both collections varies greatly, there must be two vertical axes in this chart for the plot to have the same shape as in Figure 2, but we displayed it on a logarithmic scale of the horizontal axis to get a finer distinction between the two lines for the minimum citation counts ranging from 2 to 20. Thus, for example, we can learn from Figure 3 that well over 200,000 all papers were cited 5 times or more, whereas the same minimum citation count was achieved by approximately 1500 asking papers, about 100,000 all papers and 500 asking papers received at least 15 citations and so on.
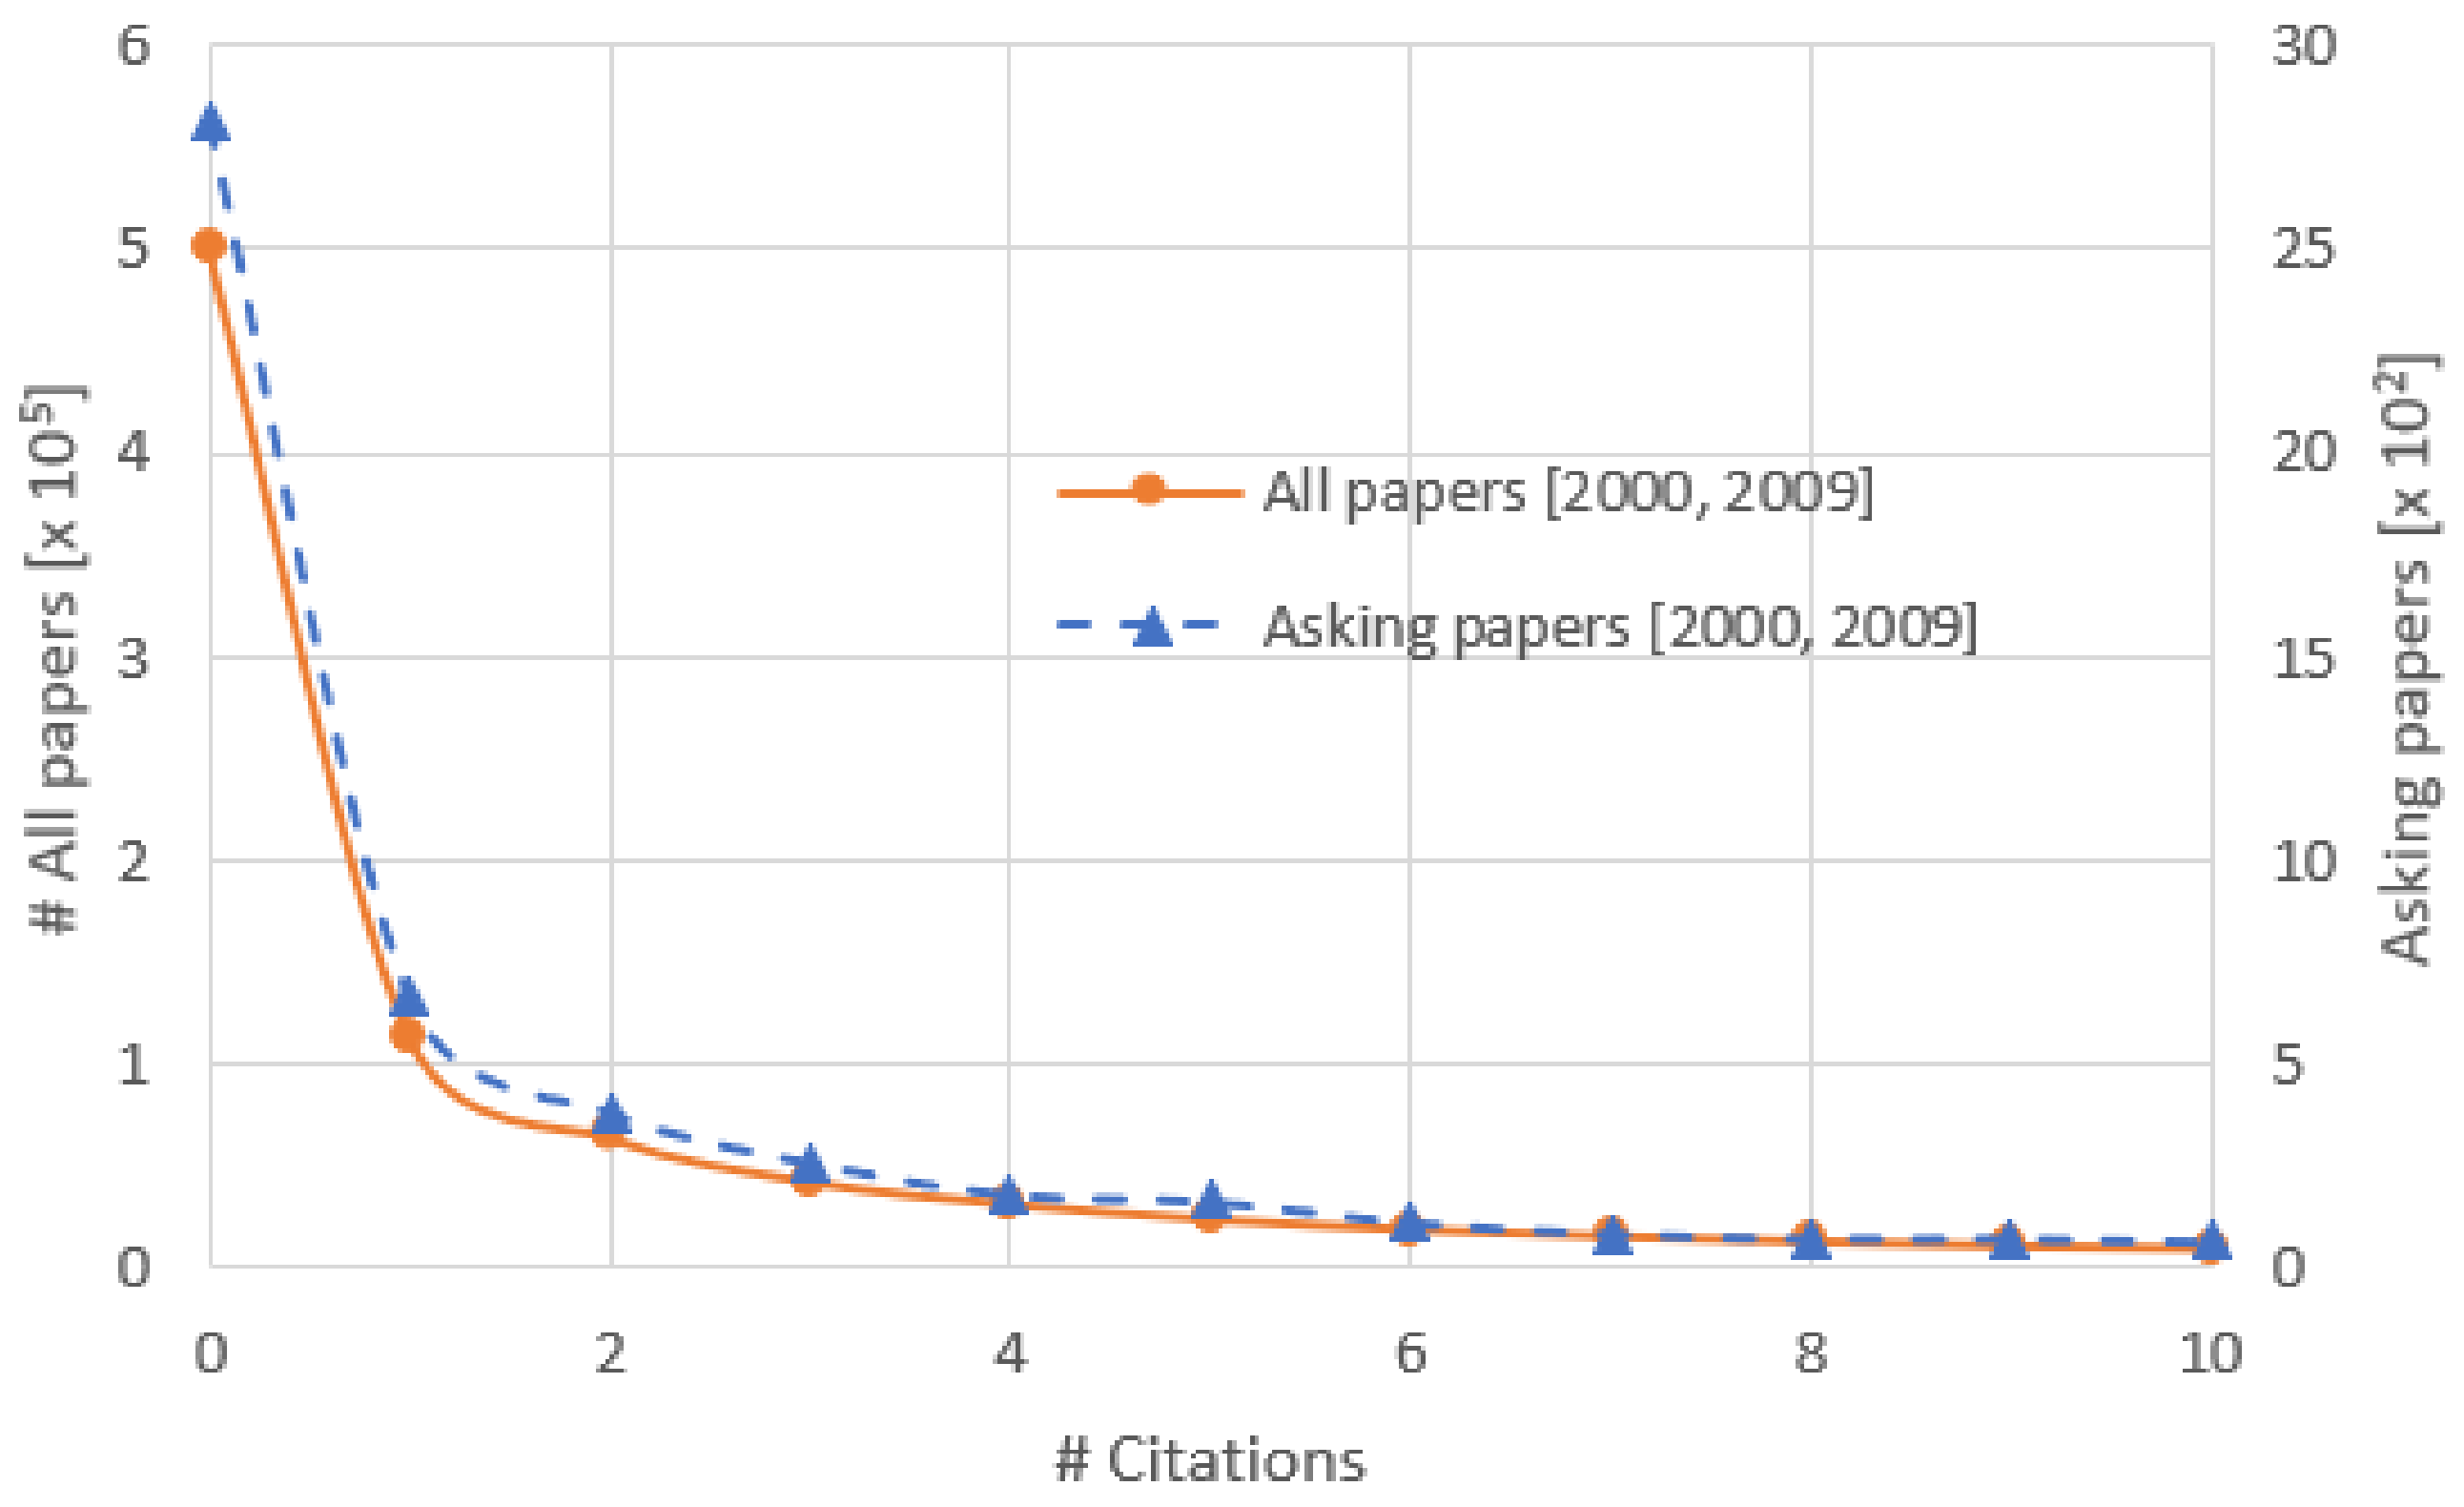
The last chart in this series is Figure 4, which depicts the exact citation counts and the number of papers associated with them. Even here, the dashed line (for asking papers) is placed above the solid one (for all papers), albeit not so clearly as in the preceding two linear and semi-log plots. For instance, there were some 60,000 all papers and 400 asking papers with 2 citations, 30,000 all papers and 150 asking papers attracting 4 citations and so on. The two lines tend to overlap with an increasing number of citations, which is why the upper bound of the horizontal axis is limited to 10 citations.
5. Conclusions and Future Work
In this study, we investigated a set of 1,922,652 records of computer science papers indexed in Web of Science that were published from 1945 to 2014. This data set was acquired in August 2015, which was also the cut-off date for counting citations for these papers. This data set was already used in [1], where more details on its acquisition and structure can be found. Furthermore, we focused on a subset of this basic data set and analyzed papers published in the decade of 2000–2009. The hypothesis we wanted to test was whether papers asking questions (i.e., those having question marks at the ends of their titles) were cited more frequently than those that did not. As a main result, we found the citation count per paper of the 5682 so-called “asking papers” to be almost 20% higher than that of the 957,837 non-asking papers, and this difference was found to be statistically significant, even at the 0.001 level.
We also examined the citation performance of asking papers in the individual years of the time period under study and detected that, with the exception of 2000 and 2001, the average citation count of the asking papers was always greater (up to by 70%) than the baseline citation rate of all papers in the respective year. The superiority of the asking papers to all papers was documented by a series of visual charts too, where the asking papers ranked steadily above all papers in terms of citations.
A limitation of the present study is the citation window cut-off date (August 2015), the change of which may have an effect on the main outcomes of the analysis. It could be useful to repeat the analysis with a more recent cut-off date in the future to verify the chief results. In addition, we did not attempt to field normalize the citation counts of the papers because we were inspecting one large scientific field (computer science) and did not suppose its subfields, like software engineering or artificial intelligence, would exhibit different citation behaviors. In the future, however, the citation data could be field normalized using the seven computer science subject categories defined in the Web of Science database.
In spite of the above limitations, the current analysis appears to be the first ever large-scale study of the effects of interrogative titles on the citedness of computer science papers and thus properly fills the void in the literature overview presented at the beginning of this article.
Author Contributions
Conceptualization, D.F. and P.K.; methodology, D.F.; software, M.D.; validation, D.F., P.K. and M.D.; formal analysis, D.F.; investigation, D.F.; resources, M.D.; data curation, M.D.; writing—original draft preparation, D.F.; writing—review and editing, P.K.; visualization, M.D.; supervision, P.K.; project administration, M.D.; funding acquisition, M.D. All authors have read and agreed to the published version of the manuscript.
Funding
This work was supported in part by the European Regional Development Fund under project no. CZ.02.1.01/0.0/0.0/17048/0007267 “Research and Development of Intelligent Components of Advanced Technologies for the Pilsen Metropolitan Area (InteCom)”.
Institutional Review Board Statement
Not applicable.
Informed Consent Statement
Not applicable.
Data Availability Statement
The data presented in this study are available on request from the corresponding author. The data are not publicly available due to license restrictions.
Conflicts of Interest
The authors declare no conflict of interest.
References
- Fiala, D.; Tutoky, G. Computer Science Papers in Web of Science: A Bibliometric Analysis. Publications 2017, 5, 23. [Google Scholar] [CrossRef] [Green Version]
- Buter, R.K.; van Raan, A.F.J. Non-Alphanumeric Characters in Titles of Scientific Publications: An Analysis of Their Occurrence and Correlation with Citation Impact. J. Informetr. 2011, 5, 608–617. [Google Scholar] [CrossRef]
- Dorta-González, P.; Santana-Jiménez, Y. Characterizing the Highly Cited Articles: A Large-Scale Bibliometric Analysis of the Top 1% Most Cited Research. Malays. J. Libr. Sci. 2019, 24, 23–39. [Google Scholar] [CrossRef]
- Fox, C.W.; Burns, C.S. The Relationship between Manuscript Title Structure and Success: Editorial Decisions and Citation Performance for an Ecological Journal. Ecol. Evol. 2015, 5, 1970–1980. [Google Scholar] [CrossRef]
- Gnewuch, M.; Wohlrabe, K. Title Characteristics and Citations in Economics. Scientometrics 2017, 110, 1573–1578. [Google Scholar] [CrossRef] [Green Version]
- Hartley, J.; Cabanac, G. An Academic Odyssey: Writing Over Time. Scientometrics 2015, 103, 1073–1082. [Google Scholar] [CrossRef] [Green Version]
- Haustein, S.; Costas, R.; Larivière, V. Characterizing Social Media Metrics of Scholarly Papers: The Effect of Document Properties and Collaboration Patterns. PLoS ONE 2015, 10, e0120495. [Google Scholar] [CrossRef]
- Letchford, A.; Preis, T.; Moat, H.S. The Advantage of Simple Paper Abstracts. J. Informetr. 2016, 10, 1–8. [Google Scholar] [CrossRef] [Green Version]
- Missen, M.M.S.; Qureshi, S.; Salamat, N.; Akhtar, N.; Asmat, H.; Coustaty, M.; Prasath, V.B.S. Scientometric Analysis of Social Science and Science Disciplines in a Developing Nation: A Case Study of Pakistan in the Last Decade. Scientometrics 2020, 123, 113–142. [Google Scholar] [CrossRef]
- Nair, L.B.; Gibbert, M. What Makes a ‘Good’ Title and (how) does it Matter for Citations? A Review and General Model of Article Title Attributes in Management Science. Scientometrics 2016, 107, 1331–1359. [Google Scholar] [CrossRef]
- Stevens, M.R.; Park, K.; Tian, G.; Kim, K.; Ewing, R. Why do Some Articles in Planning Journals get Cited more than others? J. Plan. Educ. Res. 2019, in press. [Google Scholar] [CrossRef]
- Subotic, S.; Mukherjee, B. Short and Amusing: The Relationship between Title Characteristics, Downloads, and Citations in Psychology Articles. J. Inf. Sci. 2014, 40, 115–124. [Google Scholar] [CrossRef]
- Tahamtan, I.; Bornmann, L. Core Elements in the Process of Citing Publications: Conceptual Overview of the Literature. J. Informetr. 2018, 12, 203–216. [Google Scholar] [CrossRef] [Green Version]
- Tahamtan, I.; Safipour Afshar, A.; Ahamdzadeh, K. Factors Affecting Number of Citations: A Comprehensive Review of the Literature. Scientometrics 2016, 107, 1195–1225. [Google Scholar] [CrossRef]
- Thelwall, M. Avoiding Obscure Topics and Generalising Findings Produces Higher Impact Research. Scientometrics 2017, 110, 307–320. [Google Scholar] [CrossRef] [Green Version]
- Uddin, S.; Khan, A. The Impact of Author-Selected Keywords on Citation Counts. J. Informetr. 2016, 10, 1166–1177. [Google Scholar] [CrossRef]
- Whissell, C. Titles in Highly Ranked Multidisciplinary Psychology Journals 1966-2011: More Words and Punctuation Marks Allow for the Communication of More Information. Psychol. Rep. 2013, 113, 969–986. [Google Scholar] [CrossRef]
- Zahedi, Z.; Haustein, S. On the Relationships between Bibliographic Characteristics of Scientific Documents and Citation and Mendeley Readership Counts: A Large-Scale Analysis of Web of Science Publications. J. Informetr. 2018, 12, 191–202. [Google Scholar] [CrossRef] [Green Version]
- Cook, J.M.; Plourde, D. Do Scholars Follow Betteridge’s Law? The Use of Questions in Journal Article Titles. Scientometrics 2016, 108, 1119–1128. [Google Scholar] [CrossRef]
- Keating, D.M.; Richards, A.S.; Palomares, N.A.; Banas, J.A.; Joyce, N.; Rains, S.A. Titling Practices and Their Implications in Communication Research 1970-2010: Cutesy Cues Carry Citation Consequences. Commun. Res. 2019. [Google Scholar] [CrossRef]
- Mongeon, P.; Paul-Hus, A.; Archambaut, A.; Cameron-Pesant, S.; Sainte-Marie, M.; Larivière, V. On the Citation Gap of Articles Naming Countries. In Proceedings of the 16th International Conference on Scientometrics and Informetrics (ISSI 2017), Wuhan, China, 16–20 October 2017; Atanassova, I., Bertin, M., Mayr, P., Eds.; International Society for Scientometrics and Informetrics (ISSI): Leuven, Belgium, 2017; pp. 976–981. [Google Scholar]
- Pearson, W.S. Quoted Speech in Linguistics Research Article Titles: Patterns of Use and Effects on Citations. Scientometrics 2021, 126, 3421–3442. [Google Scholar] [CrossRef]
- Pearson, W.S. Research Article Titles in Written Feedback on English as a Second Language Writing. Scientometrics 2020, 123, 997–1019. [Google Scholar] [CrossRef]
- Jamali, H.R.; Nikzad, M. Article Title Type and Its Relation with the Number of Downloads and Citations. Scientometrics 2011, 88, 653–661. [Google Scholar] [CrossRef] [Green Version]
- Stremersch, S.; Verniers, I.; Verhoef, P.C. The Quest for Citations: Drivers of Article Impact. J. Mark. 2007, 71, 171–193. [Google Scholar] [CrossRef] [Green Version]
- Annalingam, A.; Damayanthi, H.; Jayawardena, R.; Ranasinghe, P. Determinants of the Citation Rate of Medical Research Publications from a Developing Country. SpringerPlus 2014, 3, 140. [Google Scholar] [CrossRef] [PubMed] [Green Version]
- Falagas, M.E.; Zarkali, A.; Karageorgopoulos, D.E.; Bardakas, V.; Mavros, M.N. The Impact of Article Length on the Number of Future Citations: A Bibliometric Analysis of General Medicine Journals. PLoS ONE 2013, 8, e49476. [Google Scholar] [CrossRef]
- Antoniou, G.A.; Antoniou, S.A.; Georgakarakos, E.I.; Sfyroeras, G.S.; Georgiadis, G.S. Bibliometric Analysis of Factors Predicting Increased Citations in the Vascular and Endovascular Literature. Ann. Vasc. Surg. 2015, 29, 286–292. [Google Scholar] [CrossRef]
- Rostami, F.; Mohammadpoorasl, A.; Hajizadeh, M. The Effect of Characteristics of Title on Citation Rates of Articles. Scientometrics 2014, 98, 2007–2010. [Google Scholar] [CrossRef]
- So, M.; Kim, J.; Choi, S.; Park, H.W. Factors Affecting Citation Networks in Science and Technology: Focused on Non-Quality Factors. Qual. Quant. 2015, 49, 1513–1530. [Google Scholar] [CrossRef]
Figure 1.
The numbers of all papers and “asking papers” published in individual years.

Figure 2.
The percentage of all papers and “asking papers” published from 2000 to 2009 with a specific minimum number of citations received.
Figure 2.
The percentage of all papers and “asking papers” published from 2000 to 2009 with a specific minimum number of citations received.

Figure 3.
The number of all papers and “asking papers” published from 2000 to 2009 with a specific minimum number of citations received (shown on a semi-log scale).
Figure 3.
The number of all papers and “asking papers” published from 2000 to 2009 with a specific minimum number of citations received (shown on a semi-log scale).

Figure 4.
The number of all papers and “asking papers” published from 2000 to 2009 with a specific exact number of citations received.
Figure 4.
The number of all papers and “asking papers” published from 2000 to 2009 with a specific exact number of citations received.


Table 1.
Basic statistics for five sets of different types of papers published from 2000 to 2009.
| Paper Type | Number of Papers | Mean Times Cited | Standard Deviation | Skewness | Median Times Cited | % of Papers Cited |
|---|---|---|---|---|---|---|
| All papers | 963,519 | 5.99 | 43.78 | 125.07 | 0 | 48.13 |
| Asking papers | 5682 | 7.14 | 36.82 | 28.79 | 1 | 50.44 |
| Exclamatory papers | 253 | 10.73 | 102.67 | 15.14 | 0 | 42.29 |
| Non-asking papers | 957,837 | 5.99 | 43.82 | 125.38 | 0 | 48.12 |
| Non-exclamatory papers | 963,266 | 5.99 | 43.75 | 125.27 | 0 | 48.13 |
Table 2.
Counts of all and asking papers and their mean times cited in the individual years of the 2000–2009 period.
Table 2.
Counts of all and asking papers and their mean times cited in the individual years of the 2000–2009 period.
| Year | # All Papers | All Papers Mean Times Cited | Number of Asking Papers | Asking Papers % | Asking Papers Mean Times Cited | Asking Papers Normalized Mean Times Cited | Significance Test p-Value |
|---|---|---|---|---|---|---|---|
| 2000 | 57,750 | 9.02 | 461 | 0.80 | 7.23 | 0.80 | 0.65520 |
| 2001 | 61,184 | 8.99 | 425 | 0.69 | 5.30 | 0.59 | 0.48120 |
| 2002 | 79,400 | 7.33 | 491 | 0.62 | 8.14 | 1.11 | 0.97090 |
| 2003 | 85,860 | 7.37 | 517 | 0.60 | 9.15 | 1.24 | 0.07796 |
| 2004 | 98,565 | 6.69 | 633 | 0.64 | 9.59 | 1.43 | 0.70050 |
| 2005 | 101,112 | 6.47 | 572 | 0.57 | 7.86 | 1.21 | 0.00659 |
| 2006 | 101,667 | 5.80 | 518 | 0.51 | 9.86 | 1.70 | 0.11240 |
| 2007 | 123,983 | 4.60 | 697 | 0.56 | 5.47 | 1.19 | 0.30470 |
| 2008 | 125,779 | 4.05 | 664 | 0.53 | 5.47 | 1.35 | 0.00620 |
| 2009 | 128,219 | 3.95 | 704 | 0.55 | 4.48 | 1.14 | 0.00004 |
Larger mean citation counts (be it in all papers or in asking papers) are highlighted in bold italics. The difference between the mean citation counts of the two respective groups of papers was statistically significant only in 2005, 2008 (each at the 0.01 level) and 2009 (at the 0.001 level), where the p-value is highlighted in bold face.
Publisher’s Note: MDPI stays neutral with regard to jurisdictional claims in published maps and institutional affiliations. |
© 2021 by the authors. Licensee MDPI, Basel, Switzerland. This article is an open access article distributed under the terms and conditions of the Creative Commons Attribution (CC BY) license (https://creativecommons.org/licenses/by/4.0/).
Share and Cite
MDPI and ACS Style
Fiala, D.; Král, P.; Dostal, M. Are Papers Asking Questions Cited More Frequently in Computer Science? Computers 2021, 10, 96. https://0-doi-org.brum.beds.ac.uk/10.3390/computers10080096
AMA Style
Fiala D, Král P, Dostal M. Are Papers Asking Questions Cited More Frequently in Computer Science? Computers. 2021; 10(8):96. https://0-doi-org.brum.beds.ac.uk/10.3390/computers10080096
Chicago/Turabian StyleFiala, Dalibor, Pavel Král, and Martin Dostal. 2021. "Are Papers Asking Questions Cited More Frequently in Computer Science?" Computers 10, no. 8: 96. https://0-doi-org.brum.beds.ac.uk/10.3390/computers10080096
Note that from the first issue of 2016, this journal uses article numbers instead of page numbers. See further details here.